Embed Size (px)
Citation preview

CBC Performance and Quality Improvement Meeting
Data for Week Ended Sunday, November 13, 2019
No Meeting This Week
Circuit 10 – Central Region

22
Community Based Care Lead Agency ScorecardFY 18-19 – 4th Quarter: April 01, 2019 to June 30, 2019

3
Contract Measures at a GlanceCBC Contract Measures – HFC Performance with CMO Breakdown
3
* Current Qtr Performance includes closed GCJFCS cases but are not presented in the CMO breakdown

Scorecard Measure 4 - Children Seen / Not Seen – October, Weekly ReportsPercent of children under supervision who are required to be seen every 30 days
4
Scorecard Measure 4 - Children Seen / Not Seen – September, Month-end ReportsPercent of children under supervision who are required to be seen every 30 days

Green = Meeting Measure, Yellow = 10% Below Measure, Red = More Than 10% Below Measure
Scorecard Measures 5 & 6 - Children Achieving PermanencySM05 - Percent of children exiting care to a permanent home within 12 months of entering care – Target = 40.5%
SM06 - Percent of children exiting care to a permanent home for children in care 12-23 months – Target = 43.6%
5

Scorecard Measure 7 – Children Who Do Not Re-Enter Care Percentage of children who do not re-enter foster care within 12 months of moving to a permanent home.
6

Source: FSFN Data Warehouse Ad Hoc Report, Rpt-as-of: 10/13/19
Children Returning to Care Number of Children in a Removal Episode Who Have Had a Prior Removal
7

Scorecard Measure 12 – Separated Siblings Percentage of siblings groups in out-of-home care where all
siblings are placed together.
8

9
Adoption FinalizationsPercent of Adoptions Finalized with 24 Months of Removal & Percent of Adoption Goal Met
Upcoming Finalization Dates
October 16, 2019
October 23, 2019

Permanency for Children in Out of Home Care
10
Average Cost and Length of Stay for Children by Case Management Organization
11

Children’s Legal Services- Shelter ReportCLS Weekly Shelter Report FY 2019-20 as of October 07, 2019
12

Case Transfer Staffing Data Case Transfer Data For Fiscal Year July 1, 2019 – June 30, 2020 - Data as of 10/14/2019
Children Entering & Exiting CareNumber of Children Entering and Exiting Out-of-Home Care per Month
13

Neighbor to Family – Weekly & Monthly Census 19-20 Fiscal Year to Month - Percentage of Children Not Sheltered: 97.0%
14
"Nurturing Parenting was great!"
- Family Satisfaction Survey
15
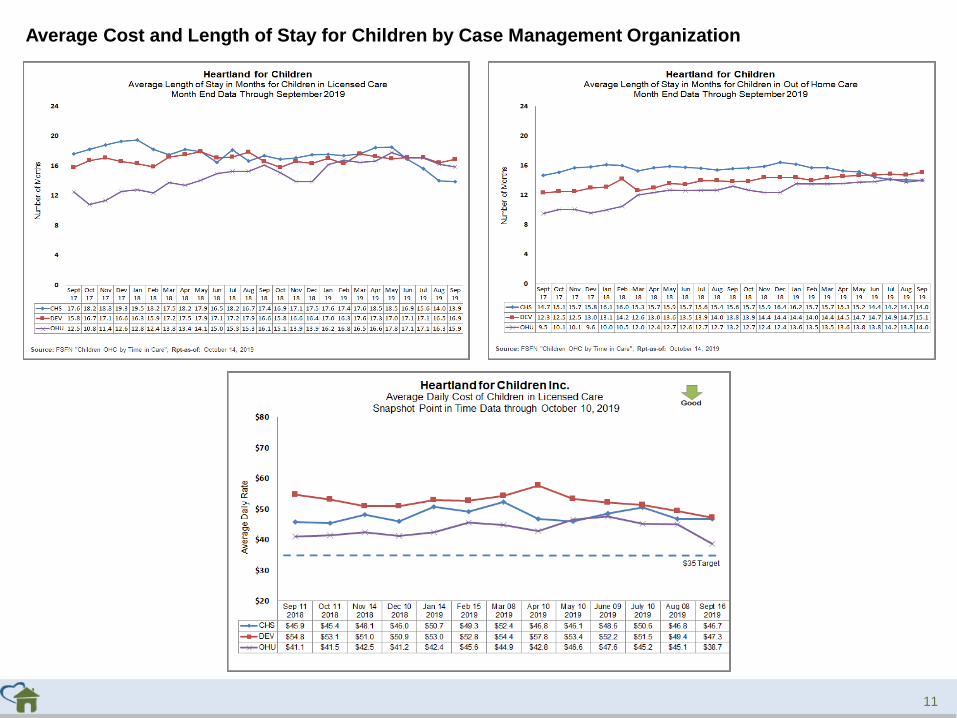
Missing Children HFC – DCF Circuit 10 Number of Missing Youth as of Reporting Date
16
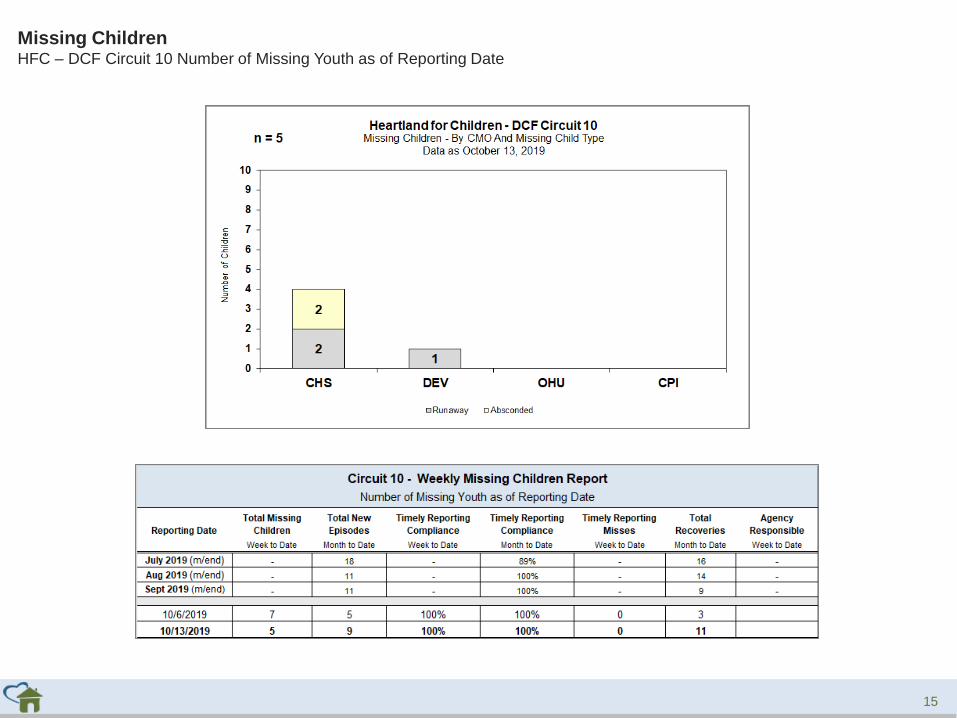
Missing Children – DebriefsHFC - Required Debriefs Completed and Note Entry Timeliness
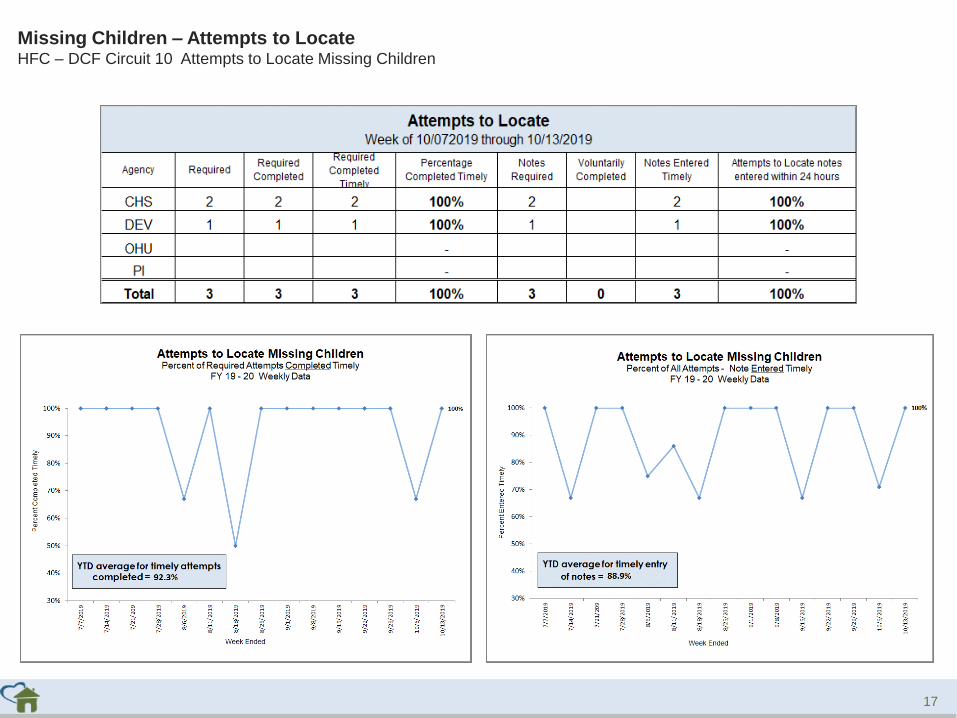
Missing Children – Attempts to LocateHFC – DCF Circuit 10 Attempts to Locate Missing Children
17

Caseload Census Information CBC Services Weekly Caseloads By CMO
18

Red = Supervisors carrying cases
*These OHU case managers contain caseloads that are over 70% OCS cases.
On average an OCS case compares to 1.54 regular cases (i.e., 20 OCS cases approx. equals 13 regular cases).
**All CHS case managers are supported by Case-Aim support. On average a Case-Aim supported case compares to 1.33 regular cases
(i.e., 20 cases with Case-Aim approx. equals 15 cases without Case-Aim support).
18

Caseload Census Information Case Manager Caseload Breakdown by Agency – Data as of 10/14/2019
Case Management Organization Turnover12 Month Case Manager Turnover Rates by Agency
20
* Data Excludes Supervisor Count

Monthly Birth Parent ContactsTarget = 70% Mothers and 50% Fathers - seen monthly
21

Healthcare InformationData Entered Into FSFN for Children in Out-of-Home Care
22
Scorecard Measures 9 & 10 - Children Receiving Healthcare ServicesSM 9 - Percent of children in out-of-home care who have received medical services in the last 12 months – Target = 95.0%
SM 10 - Percent of children in out-of-home care who have received dental services in the last 7 months – Target = 95.0%
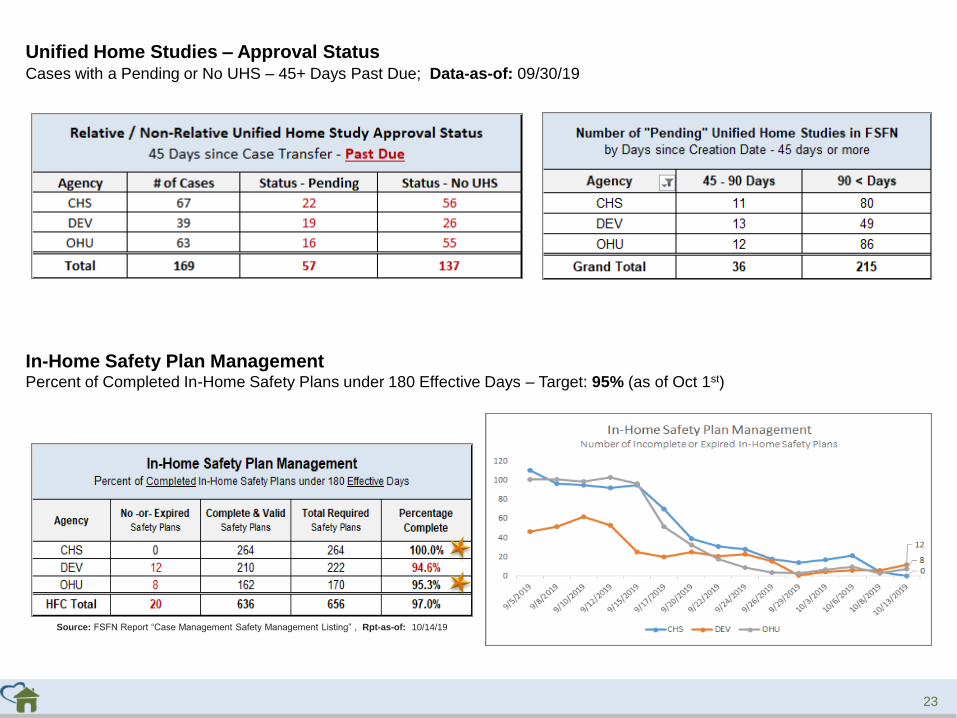
Unified Home Studies – Approval StatusCases with a Pending or No UHS – 45+ Days Past Due; Data-as-of: 09/30/19
23
In-Home Safety Plan ManagementPercent of Completed In-Home Safety Plans under 180 Effective Days – Target: 95% (as of Oct 1st)
Source: FSFN Report “Case Management Safety Management Listing” , Rpt-as-of: 10/14/19

24
Child Placement Agreement – Current Errors
Health Risk AssessmentsForms must be submitted by Friday each week or by month-end to avoid penalties

Data Exceptions: AFCARSData for Reporting Period: 04/01/19 – 09/30/19
25
Data Exceptions: Placements
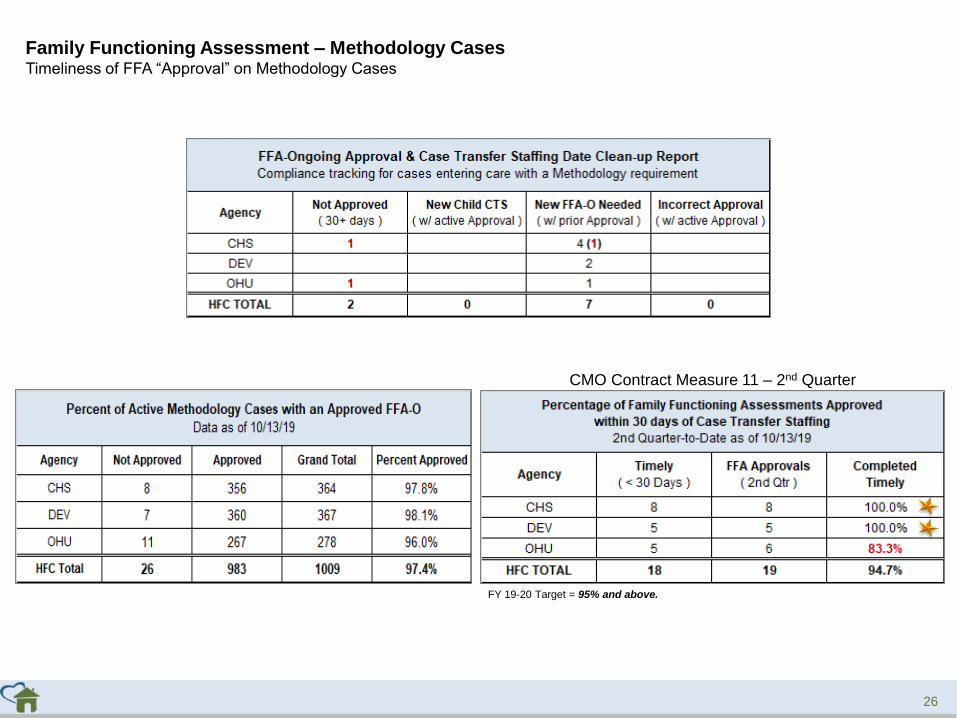
CMO Contract Measure 11 – 2nd Quarter
FY 19-20 Target = 95% and above.
Family Functioning Assessment – Methodology CasesTimeliness of FFA “Approval” on Methodology Cases
26

27
“If everyone is moving forward together,
then success takes care of itself.”
~ Henry Ford

28

29


![CBC公式ホームページ | CBCテレビ[JOGX-DTV] / CBCラジオ ...CBC公式ホームページ | CBCテレビ[JOGX-DTV] / CBCラジオ](https://img.pdfslide.net/doc/110x75/6075b4954ec3c56938370b69/cbcfffff-cbcfffjogx-dtv-cbcf-cbcfffff.jpg)