Embed Size (px)
Citation preview
www.labsmartservices.com.au
CBR - 2018 (81)
PROFICIENCY TESTING
PROGRAM REPORT
Accredited for compliance with ISO/IEC 17043
Copyright: LabSmart Services Pty Ltd
CBR Proficiency Testing Program - 2018(81)
Copyright: LabSmart Services Pty Ltd Issued - 29 January 2019 Page 1 of 41
Report This report is available on the LabSmart Services website. The issue of this proficiency report was authorised by Peter Young, Director, LabSmart Services Pty Ltd, January 2019. Contact Details
Email: [email protected] Mobile: 0432 767 706 Fax: (03) 8888 4987
Program Coordinator The program coordinator for this program was Peter Young, Director, LabSmart Services Pty Ltd. Contact Details
Email: [email protected] Mobile: 0432 767 706 Fax: (03) 8888 4987
Accredited Proficiency Testing Provider LabSmart Services is accredited by NATA to ISO/IEC 17043, Conformity assessment – General requirements for proficiency testing. Accreditation number 19235. The accreditation provides additional assurance to participants of the quality and importance we place on our proficiency testing programs.
LabSmart Services Please see our website for further details.
www.labsmartservices.com.au
Copyright This work is copyright. No part of this publication may be reproduced in any form, transmitted or stored in any repository (e.g. mechanical, digital, electronic or photographic) without prior written permission of LabSmart Services Pty Ltd. Please contact LabSmart Services Pty Ltd should you wish to reproduce any part of this report.
Z-Score Summary Z-score summary for this program issued 13 November 2018
Amendment History Reports may be downloaded from the LabSmart Services website.
Version 1 – Issued 29 January 2019
CBR Proficiency Testing Program - 2018(81)
Copyright: LabSmart Services Pty Ltd Issued - 29 January 2019 Page 2 of 41
CONTENTS PAGE
1. Program Aim
5
2. Performance
2.1 Performance assessment 2.2 Identified outliers 2.3 Program summary
5 5 5 7
3. Technical Comment
3.1 General
3.1.1 Measurement uncertainty 3.1.2 Supply of test information 3.1.3 Errors
3.2 Statistics
3.2.1 Accuracy of data 3.2.2 Variation in CBR results 3.2.3 Set s.d limit 3.2.4 Repeatability
3.3 CBR results
3.3.2 CBR results 3.3.3 Identification of inconsistencies and errors
3.4 Direct influences
3.4.1 Load cell 3.4.2 Seating load 3.4.3 Penetration rate 3.4.4 Test (penetration / load) data 3.4.5 Accuracy of the graph prepared 3.4.6 Zero-point correction 3.4.7 Rounding
3.5 Indirect influences
3.5.1 Pre-compaction curing 3.5.2 CBR compaction 3.5.3 OMC & MDD 3.5.4 LDR & LMR
8
8 8 8 9 9 9 10 11 11
11
11 12
12
12 13 13 14 15 16 16
17
17 17 19 19
4. Statistics: Z-Scores & Graph
CBR Z-scores : Sample A
22
22
CBR Proficiency Testing Program - 2018(81)
Copyright: LabSmart Services Pty Ltd Issued - 29 January 2019 Page 3 of 41
5. Program Information
5.1 Z-score summary 5.2 Program design
5.2.1 Design 5.2.2 Selection of material for program 5.2.3 OMC & MDD 5.2.4 Role of proficiency testing 5.2.5 Participant assessment 5.2.6 Reporting of results – significant figures 5.2.7 Additional test information requested 5.2.8 Data checks
5.3 Sample preparation 5.4 Packaging and instructions 5.5 Quarantine 5.6 Sample dispatch 5.7 Homogeneity testing 5.8 Participation 5.9 Statistics
5.9.1 Z-score Summary 5.9.2 Comparing statistics from one program to another 5.9.3 Measurement uncertainty 5.9.4 Metrological traceability
5.10 Non-statistical
24
24 24
24 24 25 25 26 26 27 27
28 28 28 28 28 29 29
30 31 31 31
31
6. Participants’ Test Results
32
Appendix A Instructions for testers
Appendix B Results log
Appendix C Graph example
37
39
41
CBR Proficiency Testing Program - 2018(81)
Copyright: LabSmart Services Pty Ltd Issued - 29 January 2019 Page 4 of 41
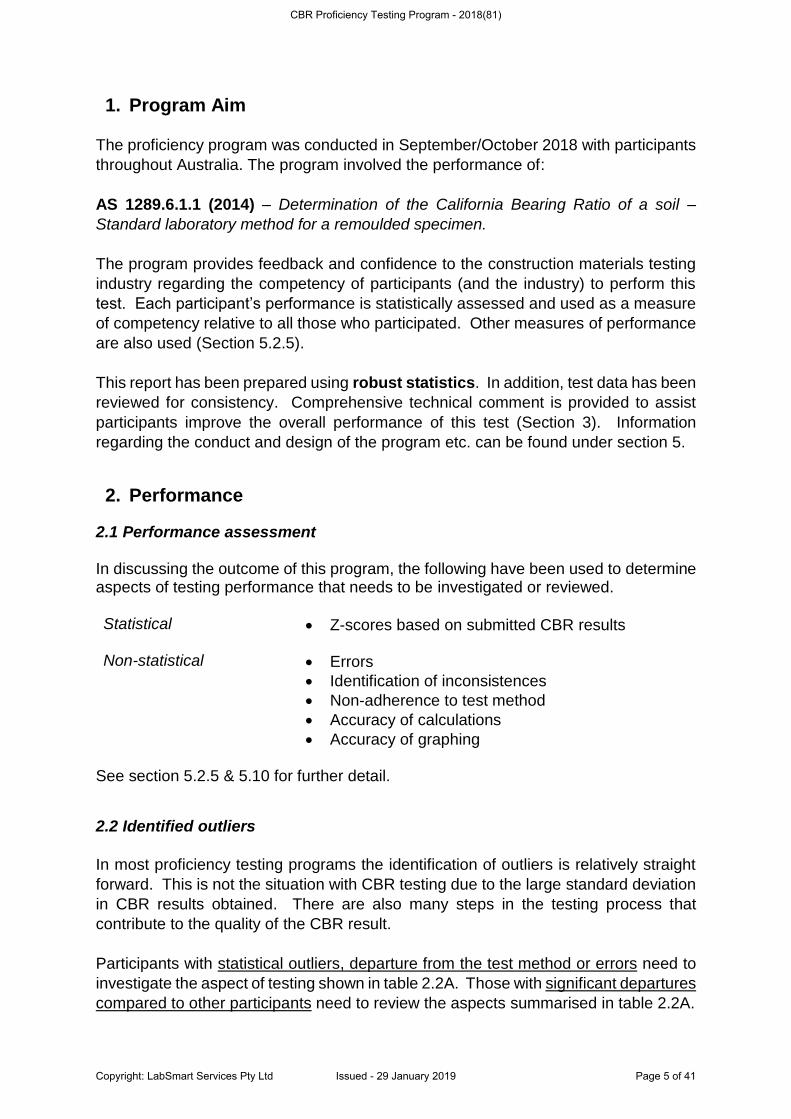
1. Program Aim
The proficiency program was conducted in September/October 2018 with participants
throughout Australia. The program involved the performance of:
AS 1289.6.1.1 (2014) – Determination of the California Bearing Ratio of a soil –
Standard laboratory method for a remoulded specimen.
The program provides feedback and confidence to the construction materials testing
industry regarding the competency of participants (and the industry) to perform this
test. Each participant’s performance is statistically assessed and used as a measure
of competency relative to all those who participated. Other measures of performance
are also used (Section 5.2.5).
This report has been prepared using robust statistics. In addition, test data has been
reviewed for consistency. Comprehensive technical comment is provided to assist
participants improve the overall performance of this test (Section 3). Information
regarding the conduct and design of the program etc. can be found under section 5.
2. Performance
2.1 Performance assessment In discussing the outcome of this program, the following have been used to determine aspects of testing performance that needs to be investigated or reviewed. Statistical • Z-scores based on submitted CBR results
Non-statistical • Errors
• Identification of inconsistences
• Non-adherence to test method
• Accuracy of calculations
• Accuracy of graphing
See section 5.2.5 & 5.10 for further detail.
2.2 Identified outliers
In most proficiency testing programs the identification of outliers is relatively straight
forward. This is not the situation with CBR testing due to the large standard deviation
in CBR results obtained. There are also many steps in the testing process that
contribute to the quality of the CBR result.
Participants with statistical outliers, departure from the test method or errors need to
investigate the aspect of testing shown in table 2.2A. Those with significant departures
compared to other participants need to review the aspects summarised in table 2.2A.
CBR Proficiency Testing Program - 2018(81)
Copyright: LabSmart Services Pty Ltd Issued - 29 January 2019 Page 5 of 41
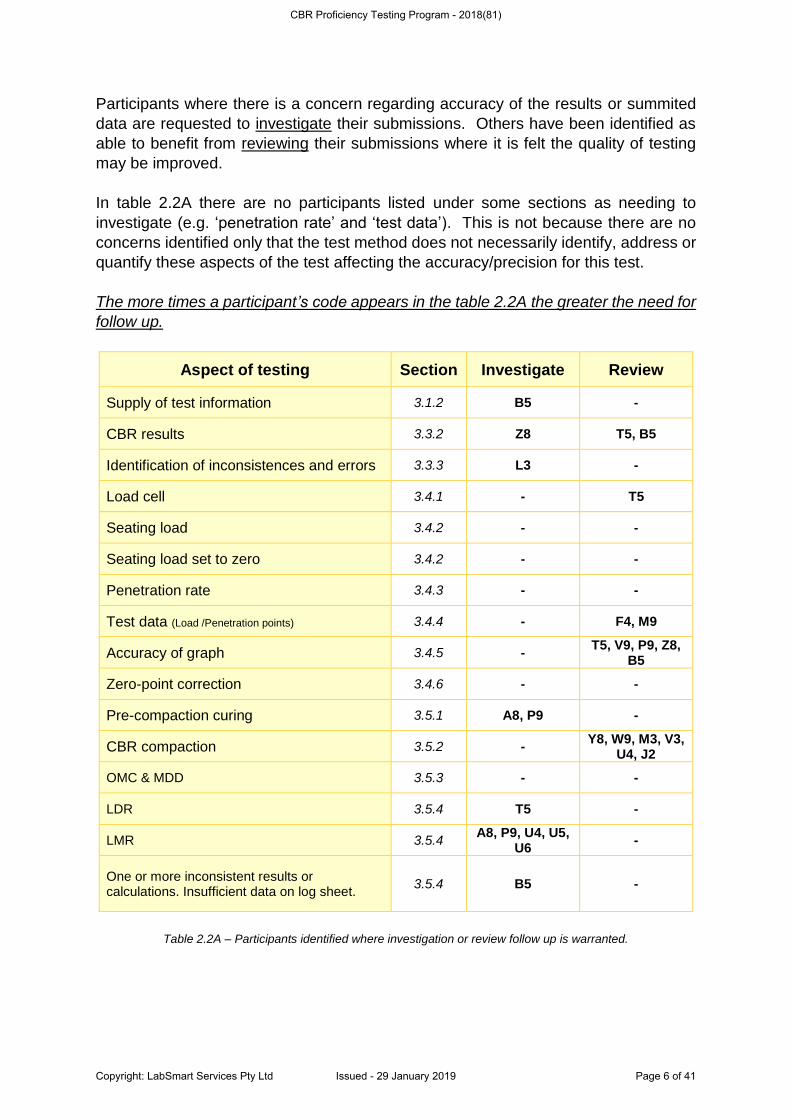
Participants where there is a concern regarding accuracy of the results or summited
data are requested to investigate their submissions. Others have been identified as
able to benefit from reviewing their submissions where it is felt the quality of testing
may be improved.
In table 2.2A there are no participants listed under some sections as needing to
investigate (e.g. ‘penetration rate’ and ‘test data’). This is not because there are no
concerns identified only that the test method does not necessarily identify, address or
quantify these aspects of the test affecting the accuracy/precision for this test.
The more times a participant’s code appears in the table 2.2A the greater the need for
follow up.
Aspect of testing Section Investigate Review
Supply of test information 3.1.2 B5 -
CBR results 3.3.2 Z8 T5, B5
Identification of inconsistences and errors 3.3.3 L3 -
Load cell 3.4.1 - T5
Seating load 3.4.2 - -
Seating load set to zero 3.4.2 - -
Penetration rate 3.4.3 - -
Test data (Load /Penetration points) 3.4.4 - F4, M9
Accuracy of graph 3.4.5 - T5, V9, P9, Z8,
B5
Zero-point correction 3.4.6 - -
Pre-compaction curing 3.5.1 A8, P9 -
CBR compaction 3.5.2 - Y8, W9, M3, V3,
U4, J2
OMC & MDD 3.5.3 - -
LDR 3.5.4 T5 -
LMR 3.5.4 A8, P9, U4, U5,
U6 -
One or more inconsistent results or calculations. Insufficient data on log sheet.
3.5.4 B5 -
Table 2.2A – Participants identified where investigation or review follow up is warranted.
CBR Proficiency Testing Program - 2018(81)
Copyright: LabSmart Services Pty Ltd Issued - 29 January 2019 Page 6 of 41
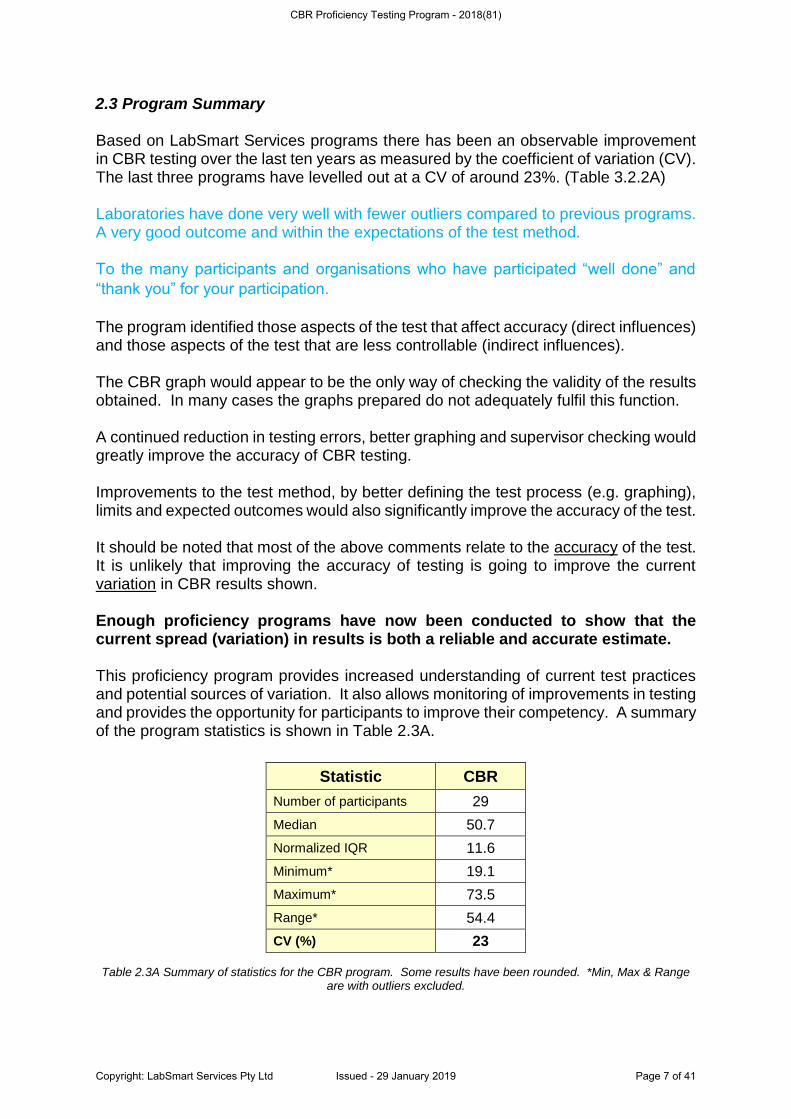
2.3 Program Summary Based on LabSmart Services programs there has been an observable improvement in CBR testing over the last ten years as measured by the coefficient of variation (CV). The last three programs have levelled out at a CV of around 23%. (Table 3.2.2A) Laboratories have done very well with fewer outliers compared to previous programs. A very good outcome and within the expectations of the test method. To the many participants and organisations who have participated “well done” and
“thank you” for your participation.
The program identified those aspects of the test that affect accuracy (direct influences) and those aspects of the test that are less controllable (indirect influences). The CBR graph would appear to be the only way of checking the validity of the results obtained. In many cases the graphs prepared do not adequately fulfil this function. A continued reduction in testing errors, better graphing and supervisor checking would greatly improve the accuracy of CBR testing. Improvements to the test method, by better defining the test process (e.g. graphing), limits and expected outcomes would also significantly improve the accuracy of the test. It should be noted that most of the above comments relate to the accuracy of the test. It is unlikely that improving the accuracy of testing is going to improve the current variation in CBR results shown. Enough proficiency programs have now been conducted to show that the current spread (variation) in results is both a reliable and accurate estimate. This proficiency program provides increased understanding of current test practices and potential sources of variation. It also allows monitoring of improvements in testing and provides the opportunity for participants to improve their competency. A summary of the program statistics is shown in Table 2.3A.
Statistic CBR
Number of participants 29
Median 50.7
Normalized IQR 11.6
Minimum* 19.1
Maximum* 73.5
Range* 54.4
CV (%) 23
Table 2.3A Summary of statistics for the CBR program. Some results have been rounded. *Min, Max & Range are with outliers excluded.
CBR Proficiency Testing Program - 2018(81)
Copyright: LabSmart Services Pty Ltd Issued - 29 January 2019 Page 7 of 41
3.0 Technical comment 3.1 General 3.1.1 Measurement Uncertainty
Aspects of the test can be split into whether they have a direct (measurable) or indirect
(not measurable) impact on the calculated CBR result. This is part of the process
taken when calculating measurement uncertainty.
Direct influences can be measured or estimated (section 3.4). Direct influences
generally involve participant errors or inconsistencies in testing. Testing can be
improved by improving the accuracy with which these aspects of the test are
performed. For example:
➢ Accuracy of the load cell
➢ Accuracy of seating load
➢ Accuracy of penetration
➢ Accuracy of the rate of penetration
➢ Accuracy of recording force readings
➢ Number of data points selected
➢ Accuracy of the graph prepared
➢ Accuracy of the zero correction
➢ Rounding of results
Indirect influences cannot be practically measured or improved easily (section 3.5).
Indirect influences generally involve non – compliance to the test method
requirements or limits. Test variation is minimised by strict adherence to the test
method. For example:
➢ OMC & MDD
➢ Moisture content
➢ LDR & LMR
➢ Compaction i.e. layer thickness,
compaction pattern, number of blows
➢ Curing of sample
3.1.2 Good laboratory practice
Proficiency program participants are expected to comply with the requirements of the program and meet basic laboratory standards. Good laboratory practice covers those aspects of laboratory operations that are in keeping with NATA accreditation. Some aspects that are particularly relevant for this program are:
➢ Supervision of testing
➢ Following the test method
➢ Following proficiency testing instructions
➢ Correctly filling out paperwork i.e. PT log sheet
➢ Checking of calculations and data i.e. free of errors
➢ Reality check of results i.e. does it fit the type of material submitted
CBR Proficiency Testing Program - 2018(81)
Copyright: LabSmart Services Pty Ltd Issued - 29 January 2019 Page 8 of 41
Compared to earlier CBR proficiency testing programs there has been significant improvement in most of the above areas. However as detailed in subsequent sections there is still room to improve the performance of CBR testing. If participants are not meeting the above basic requirements it also raises concern as to what other omissions or errors are occurring during testing that remain undetected. 3.1.2 Supply of test information
Most participants supplied all the testing details requested. This additional information
(see section 5.2.7) is important as it is used to validate the results received and to
assist in providing the feedback given in the following sections.
Participants are always welcome to contact the program coordinator if they require
further explanation as to what information is required or how to proceed with testing.
There were several participants that did not supply all the data requested or supplied
incorrect data. These participants are encouraged to review what they have submitted
against other participants in order to improve data supplied in future. Participant B5
needs to investigate why only the CBR result was supplied.
3.1.3 Errors
Errors may arise from several sources, an incorrect calculation, transcription error, wrong methodology used, not following the test method etc. Many of the comments in the following sections relate to errors. Although some of these may have only a small impact they do accumulate. Others can have a large impact such as incorrect graphing technique and zero correction.
3.2 Statistics
The use of statistics are a very useful and practical means of analysing test data.
Below are some aspects that affect statistical outcomes.
3.2.1 Accuracy of data
If the test data is in error, then any statistics calculated may also be in error. Any
interpretations made, based on the statistics, may therefore also be in error. Most
proficiency programs can handle a few inaccurate results without any concern about
the veracity of the program outcome. Most of the technical comment concerns the
accuracy of the CBR test results.
CBR Proficiency Testing Program - 2018(81)
Copyright: LabSmart Services Pty Ltd Issued - 29 January 2019 Page 9 of 41
3.2.2 Variation in CBR results
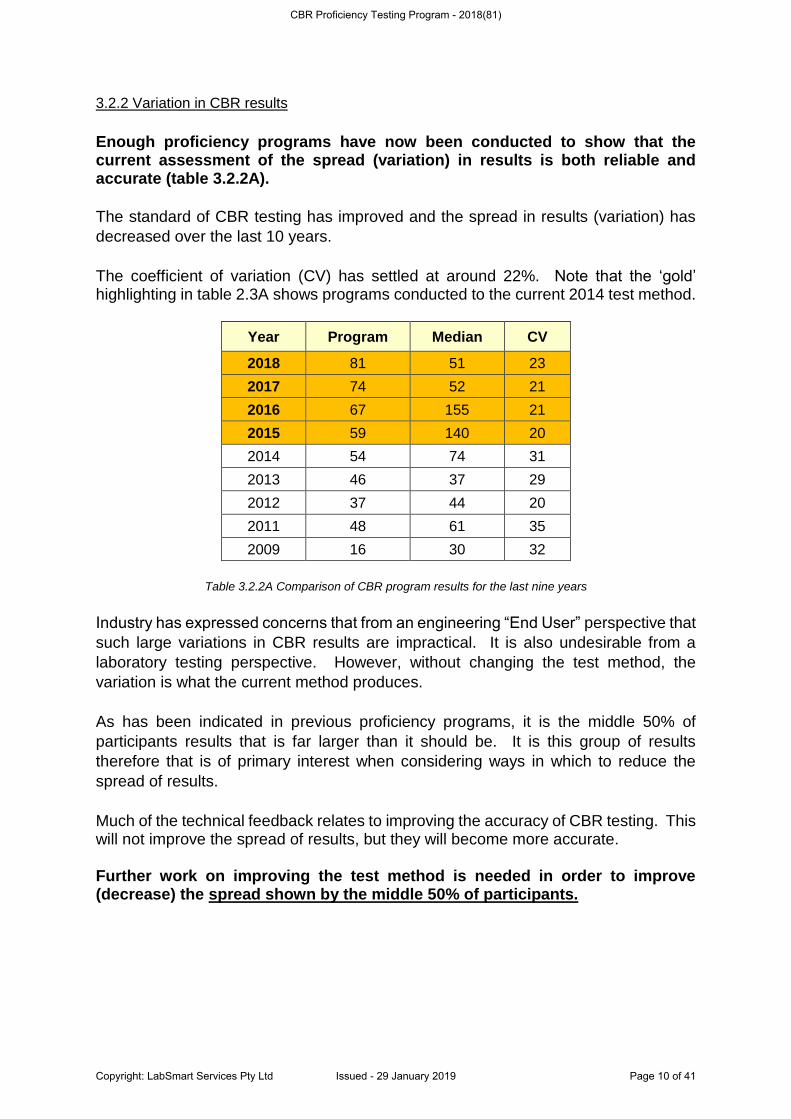
Enough proficiency programs have now been conducted to show that the current assessment of the spread (variation) in results is both reliable and accurate (table 3.2.2A).
The standard of CBR testing has improved and the spread in results (variation) has
decreased over the last 10 years.
The coefficient of variation (CV) has settled at around 22%. Note that the ‘gold’ highlighting in table 2.3A shows programs conducted to the current 2014 test method.
Year Program Median CV
2018 81 51 23
2017 74 52 21
2016 67 155 21
2015 59 140 20
2014 54 74 31
2013 46 37 29
2012 37 44 20
2011 48 61 35
2009 16 30 32
Table 3.2.2A Comparison of CBR program results for the last nine years
Industry has expressed concerns that from an engineering “End User” perspective that
such large variations in CBR results are impractical. It is also undesirable from a
laboratory testing perspective. However, without changing the test method, the
variation is what the current method produces.
As has been indicated in previous proficiency programs, it is the middle 50% of
participants results that is far larger than it should be. It is this group of results
therefore that is of primary interest when considering ways in which to reduce the
spread of results.
Much of the technical feedback relates to improving the accuracy of CBR testing. This will not improve the spread of results, but they will become more accurate. Further work on improving the test method is needed in order to improve (decrease) the spread shown by the middle 50% of participants.
CBR Proficiency Testing Program - 2018(81)
Copyright: LabSmart Services Pty Ltd Issued - 29 January 2019 Page 10 of 41
3.2.3 “Set s.d limit”
In previous CBR proficiency programs the z-score statistics have been recalculated
using a “Set s.d limit” or “Target s.d”. The purpose of which was to bring the variation
(spread) in results back to something useful to geotechnical engineers and others in
the industry. It appeals as a very practical way of approaching the problem.
There is no reason however to suspect that, based on the outcome of this program,
or other programs that any result within the middle 50% is better than any another
result from the middle 50%. The “Set s.d limit” outcome then does not provide any
useful information.
If the accuracy of many CBR test results is questionable along with the median value,
then results may lie above or below any ‘set limits’. It does not identify problems or
inaccurate results, worse, it could indicate results as being satisfactory when they may
not be.
The “set limits” is therefore no longer used in CBR PT programs.
3.2.4 Repeatability
This program focuses on the variation (spread) of results between laboratories
(reproducibility).
It is questionable that with the large variation shown in CBR results that an estimate
of repeatability (performance of two identical samples) would yield reliable information.
For some tests the homogeneity data can be used as a guide to the repeatability.
However, for CBR such an estimate may be unreliable as the precision may be good
(same machine and pace rate etc) but it is unknown if the overall accuracy is good or
poor.
3.3 CBR Results
3.3.2 CBR results
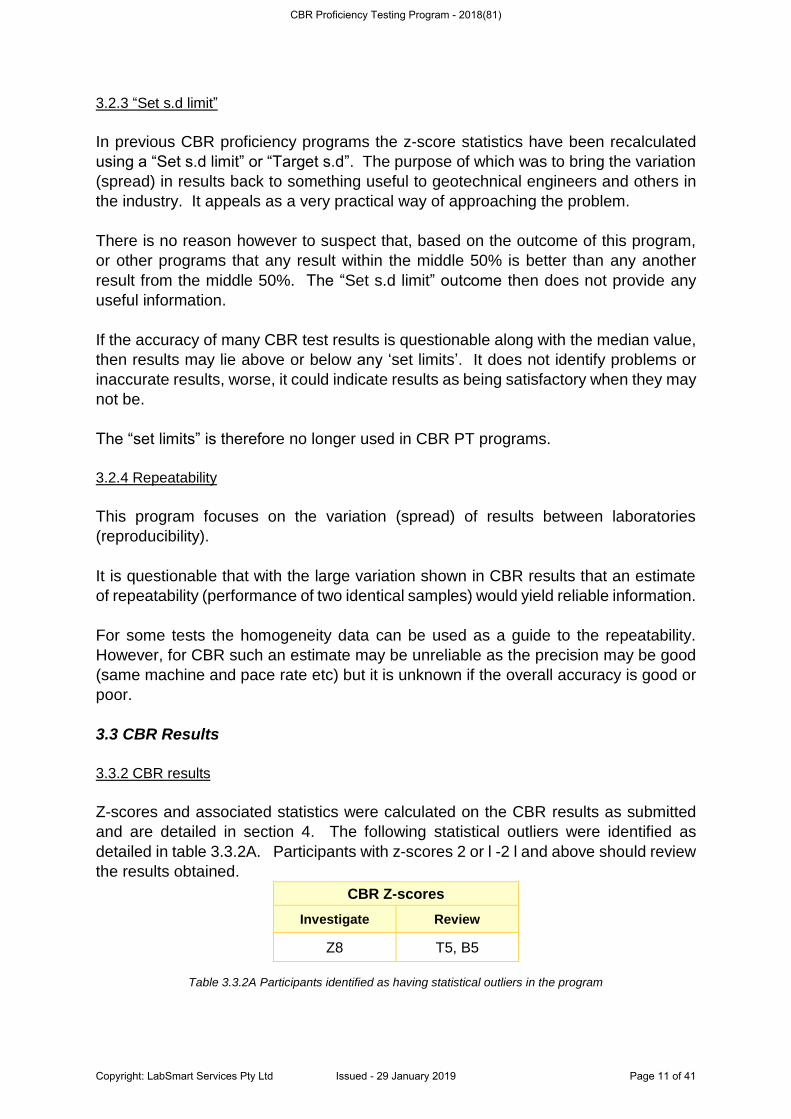
Z-scores and associated statistics were calculated on the CBR results as submitted
and are detailed in section 4. The following statistical outliers were identified as
detailed in table 3.3.2A. Participants with z-scores 2 or l -2 l and above should review
the results obtained.
CBR Z-scores
Investigate Review
Z8 T5, B5
Table 3.3.2A Participants identified as having statistical outliers in the program
CBR Proficiency Testing Program - 2018(81)
Copyright: LabSmart Services Pty Ltd Issued - 29 January 2019 Page 11 of 41
3.3.3 Identification of inconsistences and errors
There are many steps within the conduct of the test (methodology) that can become a
source of error or where inconsistencies can occur. As well there are limits posed by
the test method itself that may also contribute. For example, compaction and moisture
content. See section 3.4 and 3.5 that explore these aspects further.
The use of a detailed CBR graph is a quick and reliable means of checking results. A
rough mathematical check was undertaken by the program coordinator for all
participants. Those with significant differences were regraphed and the CBR
recalculated.
The CBR result for one of the participants (L3) had not been calculated correctly. The
results for this participant was amended and is shown in green in section 4.
Participant L3 needs to investigate the reason for the incorrect result.
3.4 Direct Influences
The following sections cover many aspects of test methodology. From previous
programs it has been noted that even with corrections resulting from re-graphed data
and using unrounded results it has only a marginal effect on the middle 50% of
participants. In other words, the corrections tend to be random with some corrected
CBR values increasing while others decrease.
Overall it suggests that while the accuracy of testing can and should be improved there
may be little change to the overall spread of results obtained for the CBR test.
3.4.1 Load cell
In section 6 the load values are shown for each participant. Some laboratories used
more data points than requested (great to see).
Most participants in this program used load cells with two participants (T5 & U4) that
used load rings. Most devices were calibrated to ‘Class ‘A’ or a combination e.g.
A/B/C. Participants generally used a 50 kN load device with CBR values occurring
around 10 kN.
Selection of the correct load cell capacity is dependent on the experience of the
laboratory and where possible prior knowledge of the material to be tested.
Unfortunately, due to the large range of CBR results possible from participants, this
information cannot be given by the program organisers prior to testing.
If a load cell or ring does not have enough capacity during testing it is important that
testing be stopped on approach to the maximum capacity of the load cell. Exceeding
the capacity of a ring can cause permanent damage (not visually obvious to a user).
Participant T5 should review the size of the load cell used for this program.
CBR Proficiency Testing Program - 2018(81)
Copyright: LabSmart Services Pty Ltd Issued - 29 January 2019 Page 12 of 41
Another consideration is the resolution at the lower end of the load scale to accurately
measure the seating load. For load cells used in this program that are on the larger
side (e.g. 50kN or above) it may be difficult to accurately measure small loads.
Often this is not a lack in ability of the load cell but a reflection of the normal calibration
practise where the calibration may not extend to the low load values required for
seating loads or low CBR values. Laboratories may need to request calibration
facilities, where possible, to specifically cover the seating loads required when
undertaking the load cell calibration.
3.4.2 Seating load
The test method requires that the least amount of force be used for the seating load.
It is important that the piston is in contact with a stable surface. The seating load is
considered the ‘zero point’ from which the load values and penetration commence.
In this program the CBR was greater than 30% and a seating load of 250 N should
have been used. Thirteen participants (68%) used the correct seating load. The test
method indicates that 50N should be used for CBRs less than 30%.
At high CBRs the seating load has only minimal effect on the CBR obtained but does
influence where the penetration points fall. For this type of material any effect of
incorrect assignment of the zero penetration is usually cancelled out with the zero-
point correction offset if performed correctly.
All participants indicate that the seating load was set to zero except for participant U4.
Participant U4 used a load ring where setting the dial gauge to zero could introduce
an error in the force calculated.
Not setting ‘back to zero’ again can lead to an inaccuracy in the load scale creating an
offset.
However, errors in both processes (seating load applied and resetting back to zero)
may influence the CBR. An error in penetration of ± 0.5mm could lead to a change of
± 4.5% CBR. This may not seem much but in the rounding process when reporting
this may cause a difference of 10% in the CBR result.
3.4.3 Penetration rate
The test method indicates that the machine used must be capable of “….forcing the
penetration piston into the specimen at uniform (not pulsating) rate of 1.0± 0.2 mm/min
during the complete test….”.
NATA indicates that the penetration rate be checked every two years.
CBR Proficiency Testing Program - 2018(81)
Copyright: LabSmart Services Pty Ltd Issued - 29 January 2019 Page 13 of 41
It is not entirely clear, based on input from previous programs, if the standard means
an ‘average rate’ or if it means it must be met at ‘all times’. If it is taken as an average
rate then theoretically you could have half the penetration at 0.5 mm/min and the other
half at 1.5 mm/min and still arrive at the average rate of 1.0 mm/min.
For ‘hand’ operated devices it is hard to check other than an overall average. A
motorised platform was used by most participants with four participants (W4, J2, Y8,
V3) using a hand operated unit.
With load cell units, they usually allow the rate to be checked as you go on a ‘per 0.5
mm of travel’ etc. This can be done on a ‘test by test’ basis so is a very good record
of meeting the requirements of the standard.
In previous programs the rate was requested with most participants reporting the test
method requirement rather than the actual rate achieved. For this program more
detailed information was requested from participants, i.e. average, minimum and
maximum rates achieved.
Around 45% of participants accurately completed this section of the log sheet. Those
that did provided the information all meet the requirements of the test method.
The penetration rate is linked to the slope of the load/penetration curve. It is therefore
significant in determining the CBR and hence the set limits placed on the rate of travel
by the test method.
3.4.4 Test (penetration / load) data
The number of penetration points selected is extremely important. Most participants
recorded the requested additional load/penetration data, and some recorded more. A
very good outcome. Participants F4 and M9 should review the number of data points
submitted.
The test method specifies a minimum data set (0.5, 1.0, 1.5, 2.0, 2.5, 3.0, 4.0, 5.0, 7.5,
10.0 and 12.5 mm penetrations).
The ‘key’ word in the test method is “at least”. In other words if you know the material
well (i.e. have a CBR history of the material) then you should be able to use fewer
points otherwise you need to record loads at more points.
Additional data points are needed to:
➢ Allow for the discount of an abnormal data value ➢ Have sufficient points left so that the discounting of a point does not
compromise the test result ➢ Have sufficient points to fit a straight line and a curve ➢ Have sufficient points above the straight section of the graph. ➢ Have sufficient points to be able to tell that you have an abnormal data point
CBR Proficiency Testing Program - 2018(81)
Copyright: LabSmart Services Pty Ltd Issued - 29 January 2019 Page 14 of 41
It is evident also that two few data points can have a measurable difference on the
result that is obtained as much as suspect data. Greater confidence in the result and
accuracy is obtained when more points are taken.
Approximately 45% of results submitted were checked and found that the data points
submitted were sound and suitable for curve fitting. This was a good outcome.
3.4.5 Accuracy of the graph prepared
In the previous CBR proficiency program all participants results were re-graphed. In
this program, only a selected group (45%) have been re-graphed. Consequently, any
inconsistencies found will not need to be investigated.
Graphing is discussed in this program due to its importance in deriving an accurate
result and being able to check the CBR result obtained. The CBR test method does
not emphasis this aspect.
Graphing of results has been an issue for the last ten CBR proficiency programs.
Overall graphing has improved vastly over this time.
Regardless of what graph is submitted to the client a detailed graph for use by the
laboratory is important as it is the primary method of checking that a reasonable result
has been obtained.
The test method is also not very descriptive regarding the quality of the graph
prepared. In previous proficiency programs, considerable feedback was given. An
example graph is given in Appendix C of the level of detail considered useful.
Only three participants did not submit a graph (V9, Z8, B5). All other participants had
computer generated graphs. Theses participants need to review the lack of a graph.
The standard overall was very good.
From Table 3.5.5A it shows a variation of results due to the accuracy of graphing. The
difference in CBR results shown are significant.
If the z-scores for all participants were recalculated with these three amended
CBR results (P9, Z8, T5) the NIQR increased by 1.04 and the CV increases by 1.9
%. This indicates the effect incorrect results in a program can have on the participant
performance outcomes (z-scores).
Participants shown in Table 3.4.5A need to review their results.
CBR Proficiency Testing Program - 2018(81)
Copyright: LabSmart Services Pty Ltd Issued - 29 January 2019 Page 15 of 41
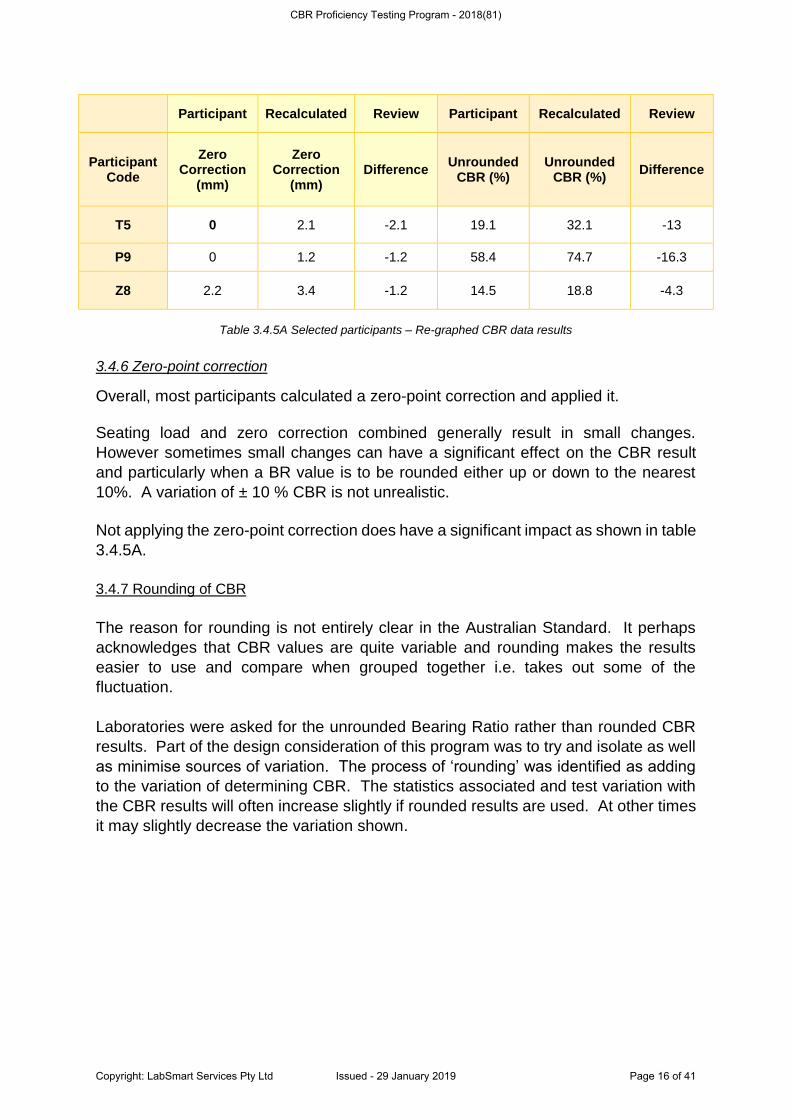
Participant Recalculated Review Participant Recalculated Review
Participant Code
Zero Correction
(mm)
Zero Correction
(mm) Difference
Unrounded CBR (%)
Unrounded CBR (%)
Difference
T5 0 2.1 -2.1 19.1 32.1 -13
P9 0 1.2 -1.2 58.4 74.7 -16.3
Z8 2.2 3.4 -1.2 14.5 18.8 -4.3
Table 3.4.5A Selected participants – Re-graphed CBR data results
3.4.6 Zero-point correction
Overall, most participants calculated a zero-point correction and applied it. Seating load and zero correction combined generally result in small changes.
However sometimes small changes can have a significant effect on the CBR result
and particularly when a BR value is to be rounded either up or down to the nearest
10%. A variation of ± 10 % CBR is not unrealistic.
Not applying the zero-point correction does have a significant impact as shown in table
3.4.5A.
3.4.7 Rounding of CBR
The reason for rounding is not entirely clear in the Australian Standard. It perhaps
acknowledges that CBR values are quite variable and rounding makes the results
easier to use and compare when grouped together i.e. takes out some of the
fluctuation.
Laboratories were asked for the unrounded Bearing Ratio rather than rounded CBR
results. Part of the design consideration of this program was to try and isolate as well
as minimise sources of variation. The process of ‘rounding’ was identified as adding
to the variation of determining CBR. The statistics associated and test variation with
the CBR results will often increase slightly if rounded results are used. At other times
it may slightly decrease the variation shown.
CBR Proficiency Testing Program - 2018(81)
Copyright: LabSmart Services Pty Ltd Issued - 29 January 2019 Page 16 of 41
3.5 Indirect Influences
The following aspects of testing methodology are difficult to relate to the final CBR test
result. They can be measured individually but the influence it has on the CBR result
is more difficult due to the ‘unknown interactions’ they have on each other.
It is clear however that more accurate measurement of these aspects of the test in
conjunction with better definition within the test method should assist with improving
the overall accuracy of the test.
3.5.1 Pre-compaction curing
There were a range of curing times used by participants. The majority used 48 hours and above. The curing times specified by the test method are minimums. More curing, if done correctly, is better than less.
The test method now requires laboratories to select the appropriate curing time based
on material, Liquid Limit and departure from OMC.
There were a wide range of ‘liquid limit’ values used and hence a wide range of curing
times. The 2017 amendment to the test method allows for the ‘liquid limit’ to be
estimated based on experience. Most participants (approximately 70%) based the
curing on their ‘estimate’ of ‘liquid limit’.
A few used 24 hours with the majority choosing to cure for 48 hours or more. Only
one participant had a lower curing of 5.75 hours.
An estimate of the MC of the material ‘as received’ and whether within 2% of the OMC
was not specifically requested as part of this program.
Section 6c of the test method requires the material to be within ±0.5% of the specified
moisture. For this program OMC was 10.3%. The allowed range then was 9.8 to 10.8
%. The following participants (A8 & P9) indicated MCs outside this range and should
investigate.
3.5.2 CBR compaction
The proficiency program required participants to perform the CBR compaction using the OMC and MDD values provided and 100 % standard compaction. Test methods relating to compaction are very specific about the energy input into the process. This is largely governed by the spread of hammer blows and the number of blows used. The revised CBR method now stipulates the pattern to be used when compacting the CBR mould. The test method however does not specifically require the number of blows delivered to be recorded. As it is an important part of the test it should be recorded.
CBR Proficiency Testing Program - 2018(81)
Copyright: LabSmart Services Pty Ltd Issued - 29 January 2019 Page 17 of 41
It is expected that by compacting a calculated amount of material to a set height that the desired density will be achieved. The blows will vary depending on the material type and moisture. Depending on how this is done a variation in the number of blows per layer is the typical outcome. However, between layers these should remain reasonably close. For determination of OMC/MDD using standard compaction 25 blows per layer is used. To achieve the same energy input around 53 blows is required for the larger CBR mould. More or less blows than 53 may be needed for a variety of reasons.
• Inaccuracy of the OMC and MDD initially
• Blows not delivered in a regular pattern
• Nature of the material may cause it to move around the mould excessively
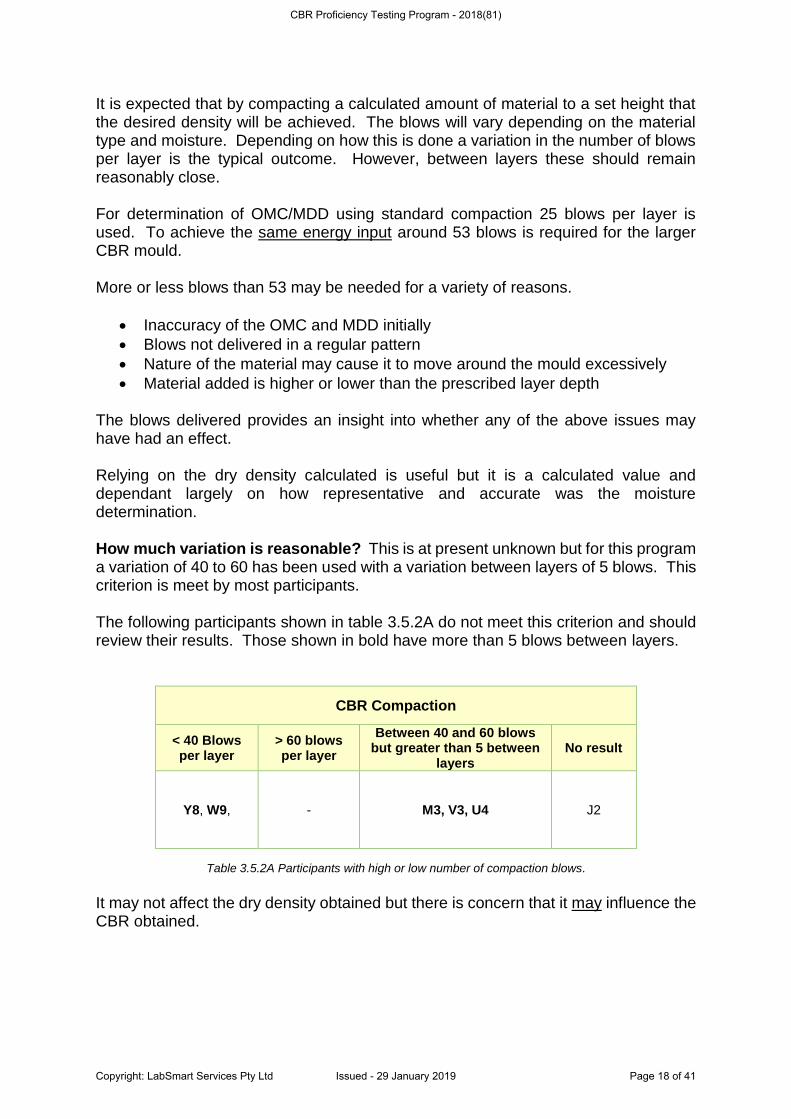
• Material added is higher or lower than the prescribed layer depth The blows delivered provides an insight into whether any of the above issues may have had an effect. Relying on the dry density calculated is useful but it is a calculated value and dependant largely on how representative and accurate was the moisture determination. How much variation is reasonable? This is at present unknown but for this program a variation of 40 to 60 has been used with a variation between layers of 5 blows. This criterion is meet by most participants. The following participants shown in table 3.5.2A do not meet this criterion and should review their results. Those shown in bold have more than 5 blows between layers.
CBR Compaction
< 40 Blows per layer
> 60 blows per layer
Between 40 and 60 blows but greater than 5 between
layers No result
Y8, W9, - M3, V3, U4 J2
Table 3.5.2A Participants with high or low number of compaction blows.
It may not affect the dry density obtained but there is concern that it may influence the CBR obtained.
CBR Proficiency Testing Program - 2018(81)
Copyright: LabSmart Services Pty Ltd Issued - 29 January 2019 Page 18 of 41
For low compaction it may influence:
• segregation of particles
• uneven compaction, For high compaction, effects such as:
• orienting the soil particles,
• segregation of particles
• causing fissures,
• breaking up of particles
• uneven compaction, all of which could influence the CBR without affecting the dry density value achieved. CBR results may be higher or lower depending on the influence. It is unclear if this has been investigated in recent times. 3.5.3 OMC & MDD
Different determinations of OMC & MDD by different laboratories will give rise to a
spread of results (Variation). To limit the effect of this variation on the CBR testing in
this proficiency program the OMC & MDD have been predetermined. This information
was supplied to participants (See instructions Appendix A) so that all participants used
the same OMC & MDD values.
3.5.4 LDR and LMR
❖ Calculation of LDR & LMR
Participants were requested to submit:
• The sample moisture immediately prior to compaction (w1) in accordance with
clause 6(c) of the standard.
• Moisture content variation (wv)
• The Laboratory Moisture Ratio (LMR)
• The Laboratory Density Ratio (LDR) and
• Dry Density (before soaking)
These intermediate results are noted in the test method as needing to be reported or
required to determine compliance with the test method.
The reported LDR and LMR values were re-calculated using the reported moisture
from clause 6(c) and density (before soaking). It is suspected that several participants
had incorrectly reported the moisture of the sample as being that of ‘as received’.
CBR Proficiency Testing Program - 2018(81)
Copyright: LabSmart Services Pty Ltd Issued - 29 January 2019 Page 19 of 41
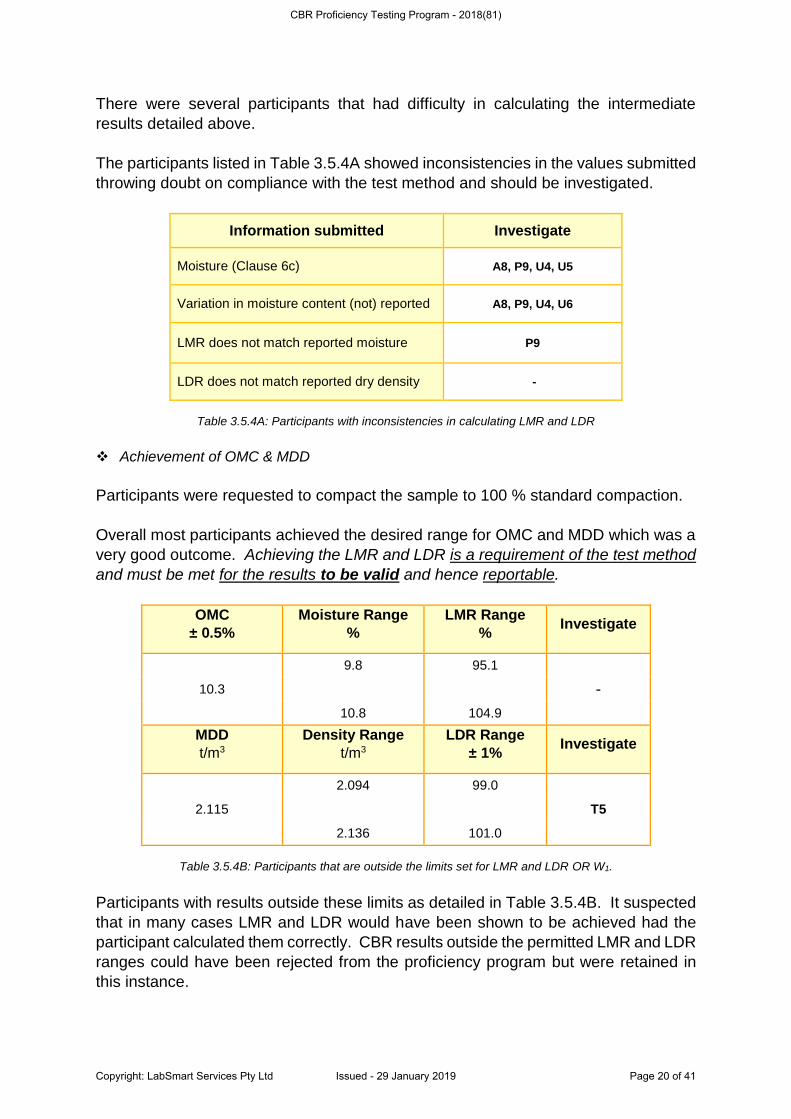
There were several participants that had difficulty in calculating the intermediate
results detailed above.
The participants listed in Table 3.5.4A showed inconsistencies in the values submitted
throwing doubt on compliance with the test method and should be investigated.
Information submitted Investigate
Moisture (Clause 6c) A8, P9, U4, U5
Variation in moisture content (not) reported A8, P9, U4, U6
LMR does not match reported moisture P9
LDR does not match reported dry density -
Table 3.5.4A: Participants with inconsistencies in calculating LMR and LDR
❖ Achievement of OMC & MDD
Participants were requested to compact the sample to 100 % standard compaction.
Overall most participants achieved the desired range for OMC and MDD which was a
very good outcome. Achieving the LMR and LDR is a requirement of the test method
and must be met for the results to be valid and hence reportable.
OMC
± 0.5%
Moisture Range
%
LMR Range
% Investigate
9.8 95.1
- 10.3
10.8 104.9
MDD
t/m3
Density Range
t/m3
LDR Range
± 1% Investigate
2.094 99.0
T5 2.115
2.136 101.0
Table 3.5.4B: Participants that are outside the limits set for LMR and LDR OR W1.
Participants with results outside these limits as detailed in Table 3.5.4B. It suspected
that in many cases LMR and LDR would have been shown to be achieved had the
participant calculated them correctly. CBR results outside the permitted LMR and LDR
ranges could have been rejected from the proficiency program but were retained in
this instance.
CBR Proficiency Testing Program - 2018(81)
Copyright: LabSmart Services Pty Ltd Issued - 29 January 2019 Page 20 of 41
This page has been left blank intentionally for formatting purposes.
CBR Proficiency Testing Program - 2018(81)
Copyright: LabSmart Services Pty Ltd Issued - 29 January 2019 Page 21 of 41
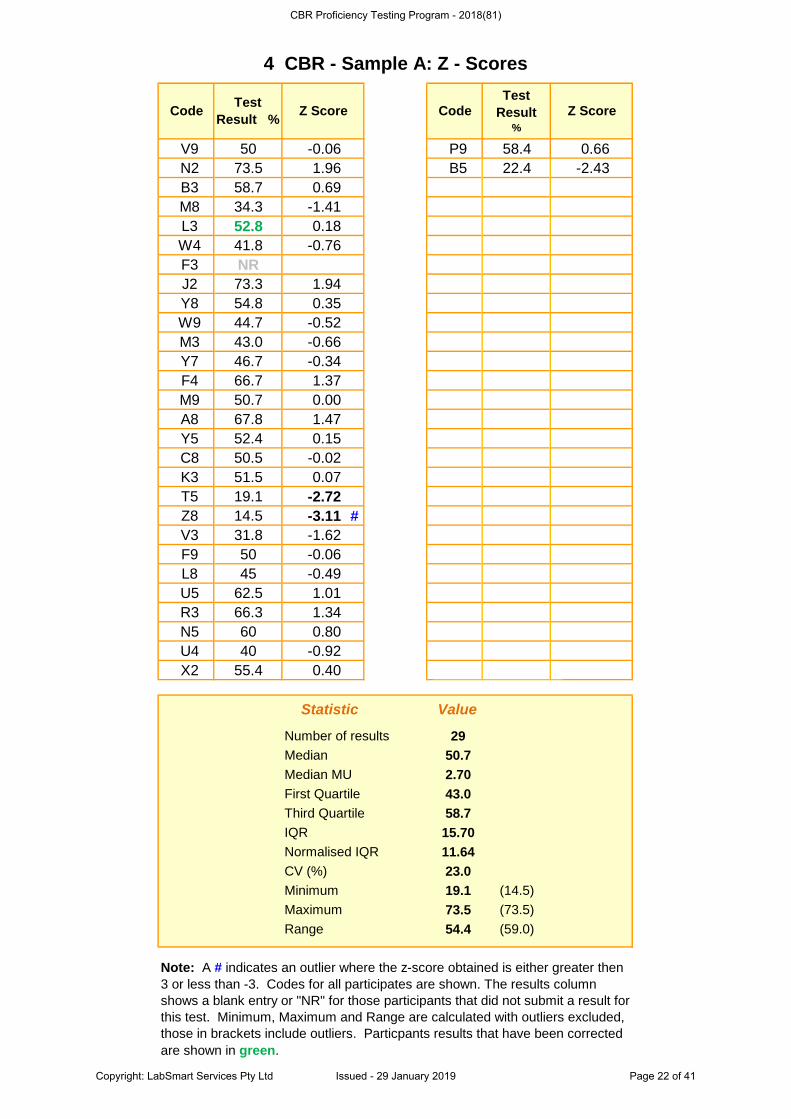
V9 50 -0.06 P9 58.4 0.66
N2 73.5 1.96 B5 22.4 -2.43
B3 58.7 0.69
M8 34.3 -1.41
L3 52.8 0.18
W4 41.8 -0.76
F3 NR
J2 73.3 1.94
Y8 54.8 0.35
W9 44.7 -0.52
M3 43.0 -0.66
Y7 46.7 -0.34
F4 66.7 1.37
M9 50.7 0.00
A8 67.8 1.47
Y5 52.4 0.15
C8 50.5 -0.02
K3 51.5 0.07
T5 19.1 -2.72
Z8 14.5 -3.11 #
V3 31.8 -1.62
F9 50 -0.06
L8 45 -0.49
U5 62.5 1.01
R3 66.3 1.34
N5 60 0.80
U4 40 -0.92
X2 55.4 0.40
Number of results 29
Median 50.7
Median MU 2.70
First Quartile 43.0
Third Quartile 58.7
IQR 15.70
Normalised IQR 11.64
CV (%) 23.0
Minimum 19.1 (14.5)
Maximum 73.5 (73.5)
Range 54.4 (59.0)
Note: A # indicates an outlier where the z-score obtained is either greater then
3 or less than -3. Codes for all participates are shown. The results column
shows a blank entry or "NR" for those participants that did not submit a result for
this test. Minimum, Maximum and Range are calculated with outliers excluded,
those in brackets include outliers. Particpants results that have been corrected
are shown in green.
4 CBR - Sample A: Z - Scores
CodeTest
Result %Z Score Code
Test
Result %
Z Score
Statistic Value
CBR Proficiency Testing Program - 2018(81)
Copyright: LabSmart Services Pty Ltd Issued - 29 January 2019 Page 22 of 41
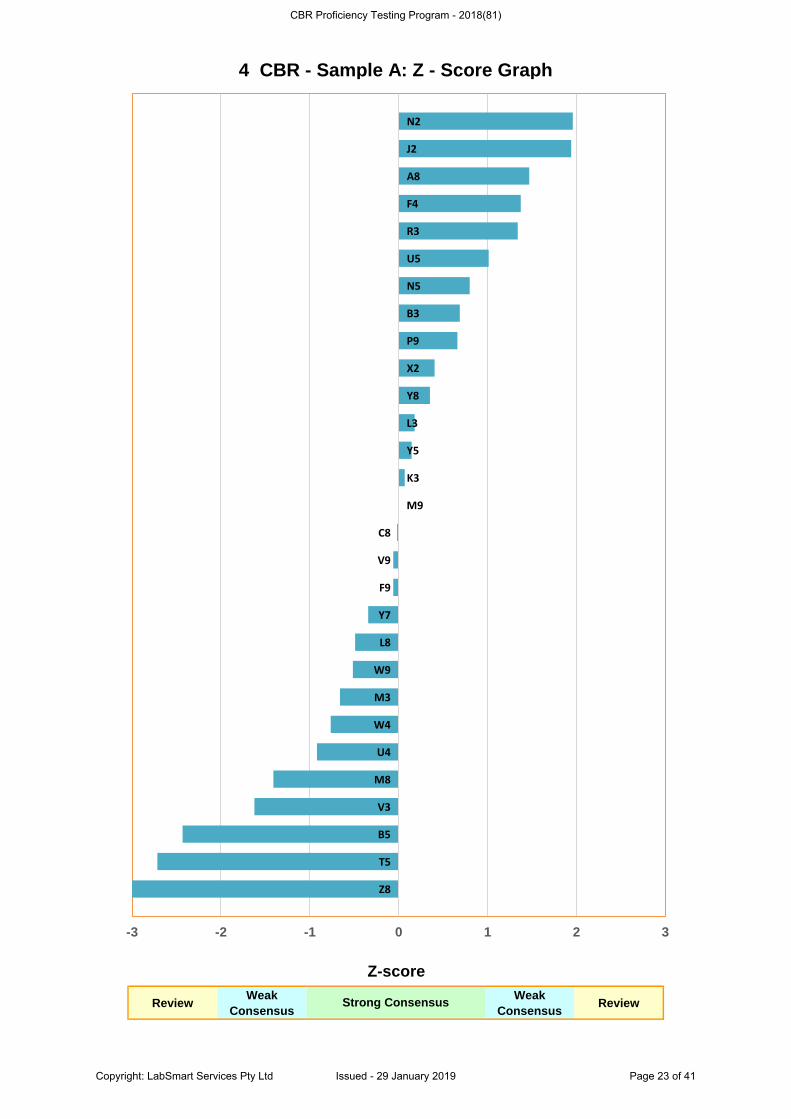
ReviewWeak
Consensus
Weak
ConsensusReview
Z-score
Strong Consensus
4 CBR - Sample A: Z - Score Graph
N2
J2
A8
F4
R3
U5
N5
B3
P9
X2
Y8
L3
Y5
K3
M9
C8
V9
F9
Y7
L8
W9
M3
W4
U4
M8
V3
B5
T5
Z8
-3 -2 -1 0 1 2 3
CBR Proficiency Testing Program - 2018(81)
Copyright: LabSmart Services Pty Ltd Issued - 29 January 2019 Page 23 of 41
5. Program information 5.1 Z score Summary The proficiency program was conducted in September/October 2018. A ‘Z-score Summary’ summary was issued on the 13 November 2018. A copy was e-mailed to all participants who submitted results. The summary is intended as an early indicator of participant performance. This program report supersedes the z - score summary. Further information can be found in section 5.9 ‘Statistics’. The z-scores generally do not vary significantly between the “summary” and the “Final Report”. 5.2. Program Design 5.2.1 Design
This program is one of a series of CBR programs conducted by LabSmart Services over the last ten years. The CBR test is a complex test from a measurement uncertainty perspective despite its apparent technical simplicity. Unfortunately, the CBR test method does not provide guidance about some aspects of the test such as repeatability or reproducibility. There also appears a lack of guidance on both the performance and the interpretation of the test within the industry. The range of test results obtained in a proficiency program, for any given sample, has been far wider than is generally acceptable to the industry. This adds to the difficulty in interpreting the outcome of CBR proficiency testing programs. Part of the design of each program involves asking for the right information. The correct analysis of the data collected then allows feedback to be offered to enable participants to improve in the performance of this test. The program was designed to provide technical feedback regarding performance as well as possible improvements in performance. Other considerations involving the design of the program are detailed below. 5.2.2 Selection of material for the program
The test in this proficiency program is operator skill/experience dependant. Different materials are selected for each program to mirror the range of materials encountered in practice and hence the results obtained. The higher the CBR value the greater the variation encountered. This program provides a sample that gives results in the range that would be commonly tested by laboratories. It is expected that the level of experience/skill needed to perform these tests will present a reasonable assessment of the overall competency of the tester and industry performance.
CBR Proficiency Testing Program - 2018(81)
Copyright: LabSmart Services Pty Ltd Issued - 29 January 2019 Page 24 of 41
5.2.3 OMC & MDD
The determination of OMC and MDD is usually an initial stage undertaken prior to performing a CBR test. The determination of these two parameters can show a significant variation. In turn having an impact on the variation obtained for CBR results. The intention of the program is to minimise the influence on the CBR results that could arise from laboratories determining these values in-house and reduce the likelihood of different OMC and MDD values being applied. To assist in reducing this variation, participants were requested to use 100% standard compaction and use:
• OMC = 10.3%
• MDD = 2.115 t/m3. These values were determined prior to the program. This approach has been used to minimise variation however other aspect may still contribute to the variation observed. OMC/MDD values may vary from person to person but this may not be so important if the same person determines OMC/MDD and CBR. That is a low compaction on the OMC/MDD should give the same compaction on the CBR. Overall it is still considered that a set OMC/MDD will contribute the least variation. 5.2.4 Role of proficiency testing
The determination of outliers is an important task of this proficiency program. A secondary function is to provide feedback that can help those with outliers identify possible areas to investigate as well as assist all participants to improve. In addition to the statistics, proficiency programs often obtain other information that is not normally available to a laboratory. It allows for a better understanding of the testing and can provide information that can lead to improvements in the testing process or test method. Proficiency testing enables participants to measure competency against others. It is also a measure of staff performance and the equipment used. Apart from ‘measurement uncertainty’ it is the next most useful tool a laboratory has in better understanding the performance of a test.
CBR Proficiency Testing Program - 2018(81)
Copyright: LabSmart Services Pty Ltd Issued - 29 January 2019 Page 25 of 41
5.2.5 Participant assessment
In discussing the outcome of this program, the following have broadly been used to determine outliers and areas for investigation/review. Statistical • Z-scores based on submitted CBR results
Non-statistical • Errors
• Identification of inconsistences
• Non-adherence to test method
• Accuracy of calculations
• Accuracy of graphing Participants are asked to “investigate” statistical outliers. Assessment of each participant is based on a z-score that is related to the program consensus value (median). This is used to determine any statistical outliers. Errors in testing, test method not followed or where test parameters are outside the limits set in the test method all need to be “investigated”. See section 5.10. Other maters identified are shown as “Review”. These are matters that would help improve testing and it most cases would be considered outside normal testing parameters. It is sometimes difficult to determine as the CBR test method often does not provide enough guidance. Compliance to proficiency program requirements including the correct calculation of results and adherence to program and test method requirements may also be used as part of the assessment process (sees section 5.2.7). Participants may also be asked to investigate any discrepancies detected with the paperwork submitted. See section 5.2.8 for further details. 5.2.6 Reporting of results - Significant figures
The number of decimal places (significant figures) reported for a test has a bearing on the statistical analysis and therefore the interpretation of the results. There is a need to strike a balance between what is desirable from a statistical view point and test method accuracy while recognising how the results are used in practice. Too few decimal places (e.g. due to rounding) can cause an increase in the observed spread of results. Increasing the number of decimal places (with respect to normal reporting) can distort the observed spread of results compared to that encountered in actual practice. Large numbers of similar, rounded results can also cause a distortion in the analysis. For example, rounding to 10 % means that any number between 45 and 54 will become 50%. If the largest value is 45 in a set of results it is pushed out to 50 through rounding. Rounded results may better reflect the repeatability and reproducibility of the test according to the rounding in the test method but are not as useful when considering laboratory performance.
CBR Proficiency Testing Program - 2018(81)
Copyright: LabSmart Services Pty Ltd Issued - 29 January 2019 Page 26 of 41
For this program, it was decided that the benefits of using additional decimal places would complement the aim of the proficiency program. Participants results were analysed as received regardless of whether there were more or less significant figures than the number requested by the program. 5.2.7 Additional test information requested
This program requested additional information as detailed in Section 6 not usually reported. The additional information is however consistent with the performance of the test and the records the test method requires laboratories to maintain or is consistent with ‘good laboratory’ practice. The additional information is used to interpret participant’s performance and assist with providing technical comment including feedback on outliers and possible participant improvement. It is also used to validate the results received. Participant results can be rejected if they do not conform to the program requirements. The correctness and quality of the information supplied is assessed as to the veracity of the information or results submitted. An adverse assessment may lead to the whole of the participants results being rejected or asked to investigate/review some aspect of what has been submitted. 5.2.8 Data checks
As often observed ‘operator errors’ can occur in the result calculation process. Every participant’s results were verified as reasonable. Checks however are only as accurate as the raw data supplied by each participant. These checks also help ensure that the data is comparable. Any inconsistencies identified during this process are identified as possible feedback for participant improvement. In some cases, inconsistences identified may need to be investigated by participants. Proficiency testing providers are obligated under their accreditation standard to remove results known to be incorrect or where a participant has not followed the test method including adherence to prescribed limits. Not providing all data requested, particularly where it is used to assess the validity of the results obtained (e.g. compaction, MC) is also a valid reason to reject a CBR result. These matters are not ‘black & white’ but require some interpretation as to each component’s importance. Keeping results that may be suspect in the statistical pool may distort the statistical outcome. However, if all the results found to be inaccurate or not meet the test method etc. were rejected from this program the pool of results would be significantly decreased. A balance must be struck. Participants need to be aware that the program coordinator performing the checks may not have access to the full set of results for each participant (e.g. significant figures etc.). This can sometimes cause differences between what the participant has calculated and what the program coordinator calculates. Also, due to the large amount of data associated with this program it is entirely possible that the coordinator may not have recalculated some participants results correctly although considerable effort is made to prevent this from occurring.
CBR Proficiency Testing Program - 2018(81)
Copyright: LabSmart Services Pty Ltd Issued - 29 January 2019 Page 27 of 41
5.3. Sample preparation Sufficient material of a homogeneous appearance was obtained for the proficiency program. The lot was partially dried then mixed to ensure, as far as possible, a homogeneous material throughout. The material was sampled and placed into numbered plastic bags. Ten samples were drawn at regular intervals from the lot for homogeneity testing. Each participant received a randomly drawn sample from the remaining samples. A unique program code was assigned to each sample.
5.4. Packaging and instructions Each plastic bag was sealed with a rubber band and placed into a sturdy box. Each participant received one box with a sealed sample labelled ‘2018 (81) CBR Sample’. The sample weighed approximately 8 kg. Instructions and a ‘Results Log’ sheet were enclosed (See Appendix A & B). Participants were instructed to test according to the nominated test method and report to the accuracy indicated on the ‘Results Log’.
5.5. Quarantine There were no samples that needed to comply with quarantine requirements.
5.6. Sample despatch Samples were dispatched to participants early October 2018 via courier. Dispatched samples were tracked from ‘despatch to delivery’ for each participant.
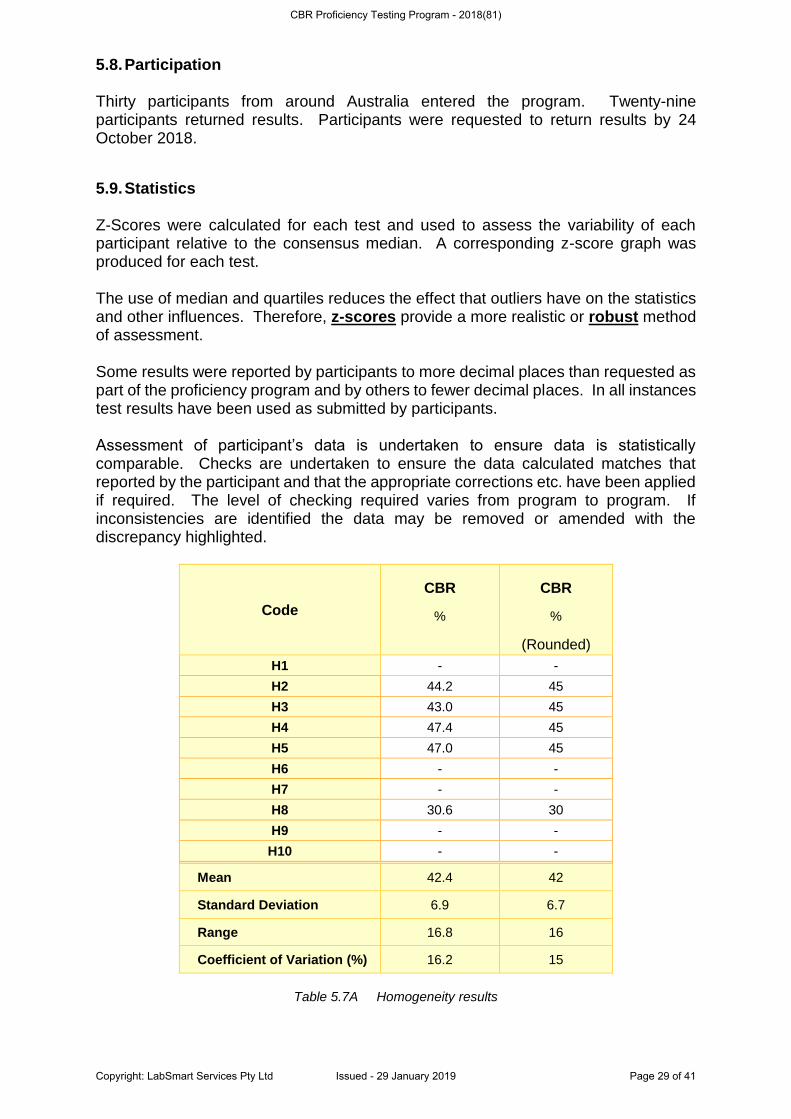
5.7. Homogeneity testing Homogeneity samples were selected, evenly spaced, from the prepared participant samples. Samples for homogeneity testing were packed in the same way as those for all participants. The homogeneity samples were tested by an independent NATA accredited laboratory. To approximate the same conditions the same instructions were given to the laboratory performing the homogeneity testing. Ten samples were tested for homogeneity. Five samples had to be removed as either outliers or not representative of the statistical sample population. The overall variability associated with the homogeneity samples was considered satisfactory. The average of the homogeneity samples also lies within 1 s.d of the program median value. This provides confidence that any outliers identified in the program represent statistically valid outliers. A statistical analysis of the homogeneity testing results is provided in table 5.7A.
CBR Proficiency Testing Program - 2018(81)
Copyright: LabSmart Services Pty Ltd Issued - 29 January 2019 Page 28 of 41
5.8. Participation Thirty participants from around Australia entered the program. Twenty-nine participants returned results. Participants were requested to return results by 24 October 2018.
5.9. Statistics Z-Scores were calculated for each test and used to assess the variability of each participant relative to the consensus median. A corresponding z-score graph was produced for each test. The use of median and quartiles reduces the effect that outliers have on the statistics and other influences. Therefore, z-scores provide a more realistic or robust method of assessment. Some results were reported by participants to more decimal places than requested as part of the proficiency program and by others to fewer decimal places. In all instances test results have been used as submitted by participants. Assessment of participant’s data is undertaken to ensure data is statistically comparable. Checks are undertaken to ensure the data calculated matches that reported by the participant and that the appropriate corrections etc. have been applied if required. The level of checking required varies from program to program. If inconsistencies are identified the data may be removed or amended with the discrepancy highlighted.
Code
CBR
%
CBR
%
(Rounded)
H1 - -
H2 44.2 45
H3 43.0 45
H4 47.4 45
H5 47.0 45
H6 - -
H7 - -
H8 30.6 30
H9 - -
H10 - -
Mean 42.4 42
Standard Deviation 6.9 6.7
Range 16.8 16
Coefficient of Variation (%) 16.2 15
Table 5.7A Homogeneity results
CBR Proficiency Testing Program - 2018(81)
Copyright: LabSmart Services Pty Ltd Issued - 29 January 2019 Page 29 of 41
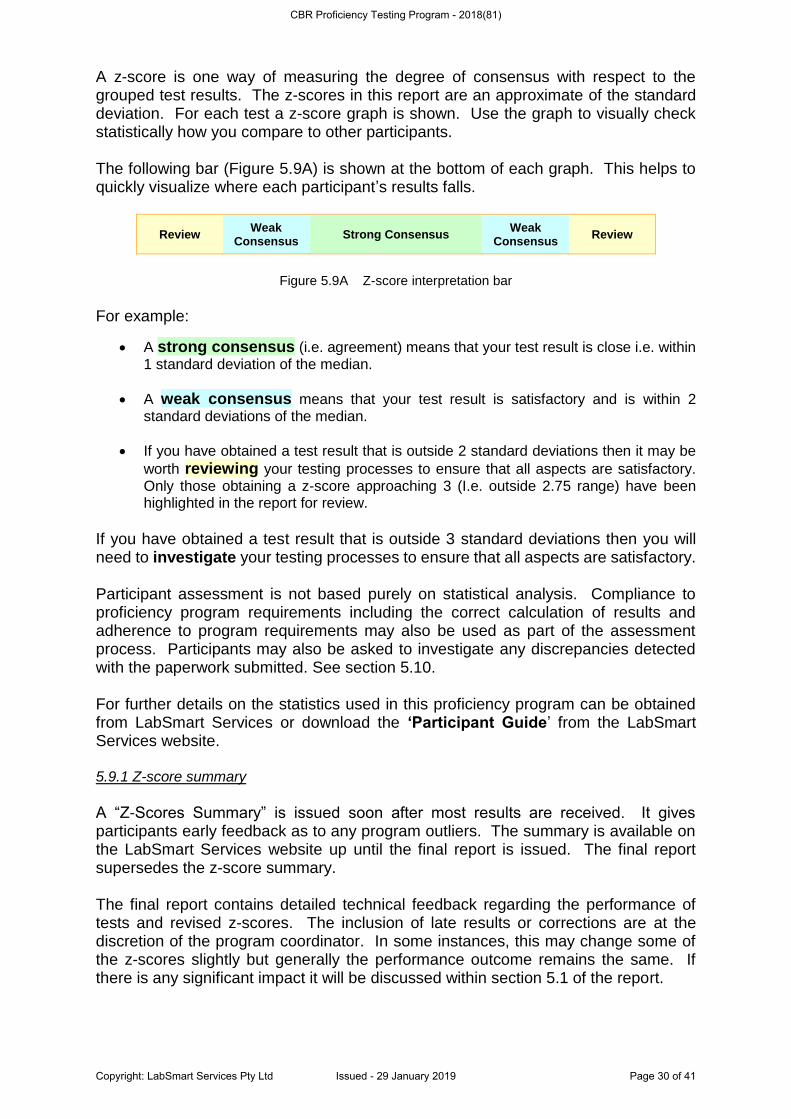
A z-score is one way of measuring the degree of consensus with respect to the grouped test results. The z-scores in this report are an approximate of the standard deviation. For each test a z-score graph is shown. Use the graph to visually check statistically how you compare to other participants. The following bar (Figure 5.9A) is shown at the bottom of each graph. This helps to quickly visualize where each participant’s results falls.
Review Weak
Consensus Strong Consensus
Weak Consensus
Review
Figure 5.9A Z-score interpretation bar
For example:
• A strong consensus (i.e. agreement) means that your test result is close i.e. within 1 standard deviation of the median.
• A weak consensus means that your test result is satisfactory and is within 2 standard deviations of the median.
• If you have obtained a test result that is outside 2 standard deviations then it may be
worth reviewing your testing processes to ensure that all aspects are satisfactory. Only those obtaining a z-score approaching 3 (I.e. outside 2.75 range) have been highlighted in the report for review.
If you have obtained a test result that is outside 3 standard deviations then you will need to investigate your testing processes to ensure that all aspects are satisfactory. Participant assessment is not based purely on statistical analysis. Compliance to proficiency program requirements including the correct calculation of results and adherence to program requirements may also be used as part of the assessment process. Participants may also be asked to investigate any discrepancies detected with the paperwork submitted. See section 5.10. For further details on the statistics used in this proficiency program can be obtained from LabSmart Services or download the ‘Participant Guide’ from the LabSmart Services website. 5.9.1 Z-score summary
A “Z-Scores Summary” is issued soon after most results are received. It gives participants early feedback as to any program outliers. The summary is available on the LabSmart Services website up until the final report is issued. The final report supersedes the z-score summary. The final report contains detailed technical feedback regarding the performance of tests and revised z-scores. The inclusion of late results or corrections are at the discretion of the program coordinator. In some instances, this may change some of the z-scores slightly but generally the performance outcome remains the same. If there is any significant impact it will be discussed within section 5.1 of the report.
CBR Proficiency Testing Program - 2018(81)
Copyright: LabSmart Services Pty Ltd Issued - 29 January 2019 Page 30 of 41
5.9.2 Comparing statistics from one program to another
The statistics generated from one proficiency program are not usually comparable to those from another proficiency testing program. Only very general comparisons may be possible. The reason statistics from one program may not be compared to another is due to the range of variables that differ from one proficiency program to another. These variables include:
• Type of material selected,
• The number of participants,
• Experience of participants,
• Test methodology variations,
• Equipment used,
• Test methods used,
• Experience of supervisors,
• Range of organisations involved.
• Program design and the statistics employed.
The program outcome represents a ‘snap shot’ of the competency within the industry and hence provides an overview of the industry. The more participants involved in the program then the more representative the overview. 5.9.3 Measurement uncertainty
The statistics detailed in this program do not replace the need for laboratories to separately calculated measurement uncertainties associated with each test when required by the client or NATA. The proficiency program does give information useful for calculating the MU and bench marking the MU calculated. 5.9.4 Metrological traceability
The assigned median value used in this proficiency testing program is derived from participant performance and is not metrologically traceable. 5.10 Non-statistical One of the issues faced by proficiency testing providers is what to do with an incorrect result even if its z-score is satisfactory. In many cases they cannot be detected but still can have a significant impact on the statistics calculated. This can cause biased (or unfair) outcomes for other participants. To limit the effect that erroneous results may have on a program additional information is requested to allow the main results to be recalculated. In some cases, results shown to be erroneous may be rejected for inclusion in the program. If the result does not add any statistical bias it is left in the program. The result however is incorrect even though it may have a satisfactory z-score. To highlight that the participant needs to investigate, ‘non-statistical’, erroneous results. This may also be applied to non-compliance to program requirements e.g. incorrect reporting of results etc or incorrect partial calculations/data.
CBR Proficiency Testing Program - 2018(81)
Copyright: LabSmart Services Pty Ltd Issued - 29 January 2019 Page 31 of 41
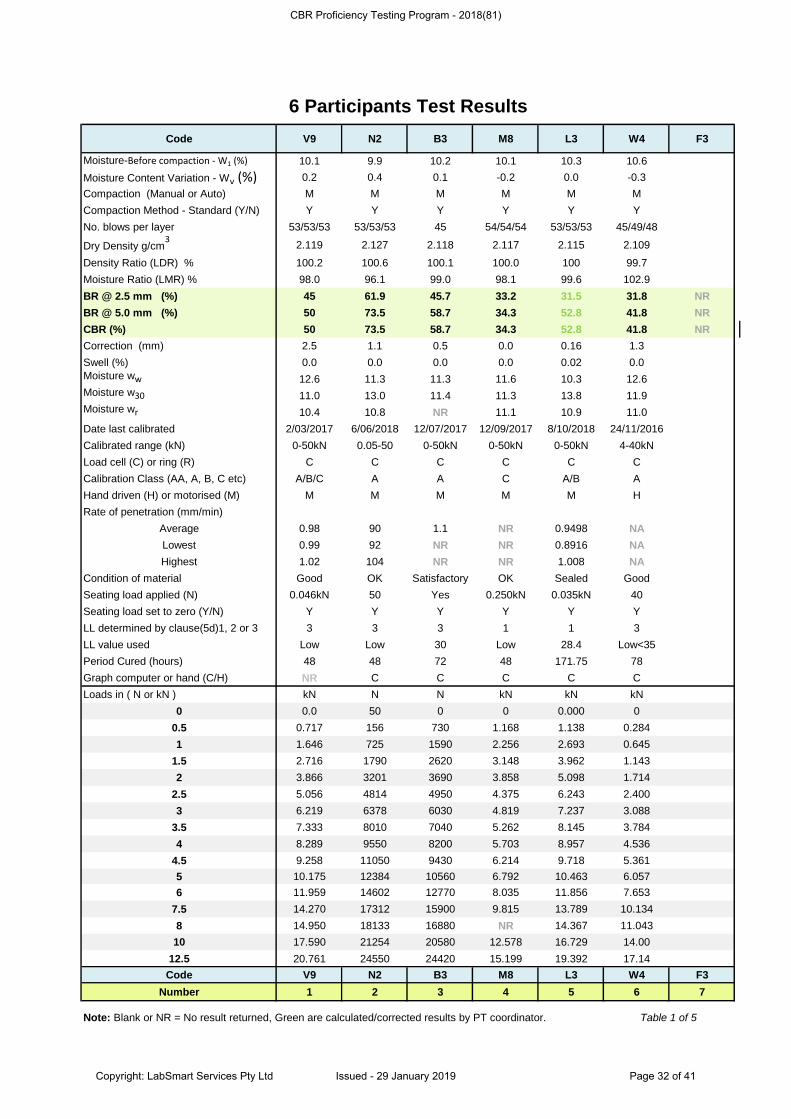
Code V9 N2 B3 M8 L3 W4 F3
Moisture-Before compaction - W1 (%) 10.1 9.9 10.2 10.1 10.3 10.6
Moisture Content Variation - Wv (%) 0.2 0.4 0.1 -0.2 0.0 -0.3
Compaction (Manual or Auto) M M M M M M
Compaction Method - Standard (Y/N) Y Y Y Y Y Y
No. blows per layer 53/53/53 53/53/53 45 54/54/54 53/53/53 45/49/48
Dry Density g/cm3
2.119 2.127 2.118 2.117 2.115 2.109
Density Ratio (LDR) % 100.2 100.6 100.1 100.0 100 99.7
Moisture Ratio (LMR) % 98.0 96.1 99.0 98.1 99.6 102.9
BR @ 2.5 mm (%) 45 61.9 45.7 33.2 31.5 31.8 NR
BR @ 5.0 mm (%) 50 73.5 58.7 34.3 52.8 41.8 NR
CBR (%) 50 73.5 58.7 34.3 52.8 41.8 NR
Correction (mm) 2.5 1.1 0.5 0.0 0.16 1.3
Swell (%) 0.0 0.0 0.0 0.0 0.02 0.0
Moisture ww 12.6 11.3 11.3 11.6 10.3 12.6
Moisture w30 11.0 13.0 11.4 11.3 13.8 11.9
Moisture wr 10.4 10.8 NR 11.1 10.9 11.0
Date last calibrated 2/03/2017 6/06/2018 12/07/2017 12/09/2017 8/10/2018 24/11/2016
Calibrated range (kN) 0-50kN 0.05-50 0-50kN 0-50kN 0-50kN 4-40kN
Load cell (C) or ring (R) C C C C C C
Calibration Class (AA, A, B, C etc) A/B/C A A C A/B A
Hand driven (H) or motorised (M) M M M M M H
Rate of penetration (mm/min)
Average 0.98 90 1.1 NR 0.9498 NA
Lowest 0.99 92 NR NR 0.8916 NA
Highest 1.02 104 NR NR 1.008 NA
Condition of material Good OK Satisfactory OK Sealed Good
Seating load applied (N) 0.046kN 50 Yes 0.250kN 0.035kN 40
Seating load set to zero (Y/N) Y Y Y Y Y Y
LL determined by clause(5d)1, 2 or 3 3 3 3 1 1 3
LL value used Low Low 30 Low 28.4 Low<35
Period Cured (hours) 48 48 72 48 171.75 78
Graph computer or hand (C/H) NR C C C C C
Loads in ( N or kN ) kN N N kN kN kN
0 0.0 50 0 0 0.000 0
0.5 0.717 156 730 1.168 1.138 0.284
1 1.646 725 1590 2.256 2.693 0.645
1.5 2.716 1790 2620 3.148 3.962 1.143
2 3.866 3201 3690 3.858 5.098 1.714
2.5 5.056 4814 4950 4.375 6.243 2.400
3 6.219 6378 6030 4.819 7.237 3.088
3.5 7.333 8010 7040 5.262 8.145 3.784
4 8.289 9550 8200 5.703 8.957 4.536
4.5 9.258 11050 9430 6.214 9.718 5.361
5 10.175 12384 10560 6.792 10.463 6.057
6 11.959 14602 12770 8.035 11.856 7.653
7.5 14.270 17312 15900 9.815 13.789 10.134
8 14.950 18133 16880 NR 14.367 11.043
10 17.590 21254 20580 12.578 16.729 14.0010.512.5 20.761 24550 24420 15.199 19.392 17.14
Code V9 N2 B3 M8 L3 W4 F3
Number 1 2 3 4 5 6 7
Table 1 of 5
6 Participants Test Results
Note: Blank or NR = No result returned, Green are calculated/corrected results by PT coordinator.
CBR Proficiency Testing Program - 2018(81)
Copyright: LabSmart Services Pty Ltd Issued - 29 January 2019 Page 32 of 41
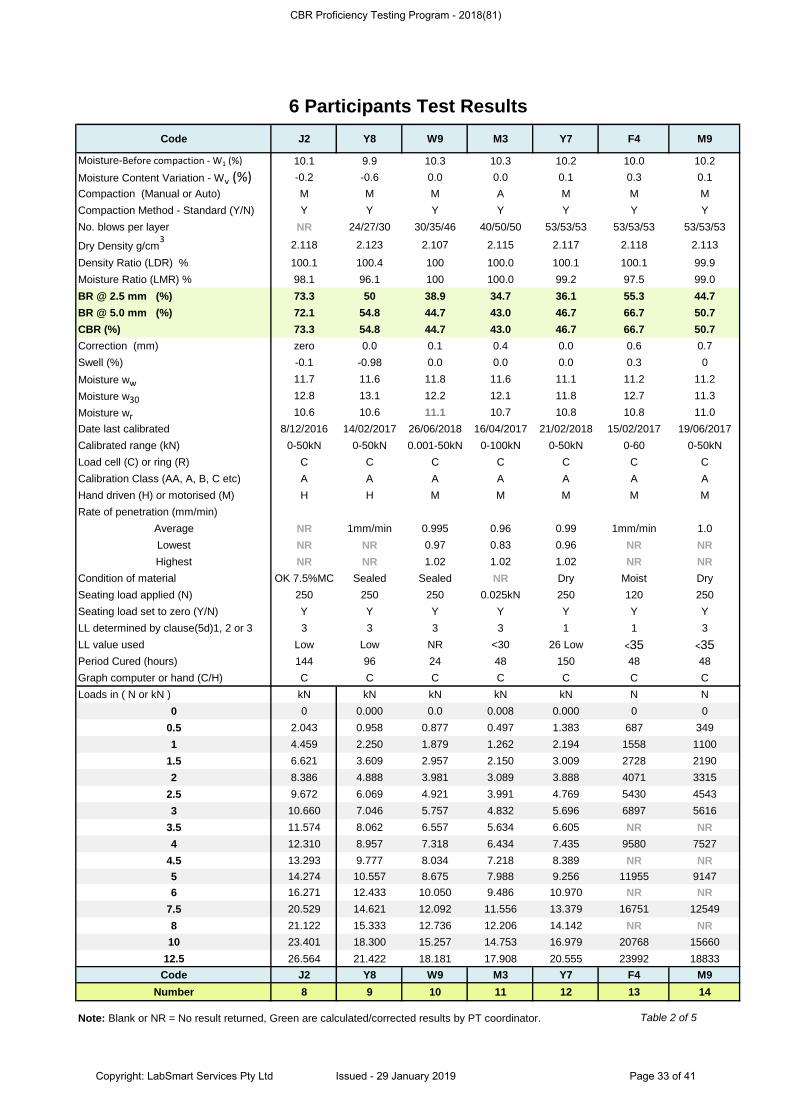
Code J2 Y8 W9 M3 Y7 F4 M9
Moisture-Before compaction - W1 (%) 10.1 9.9 10.3 10.3 10.2 10.0 10.2
Moisture Content Variation - Wv (%) -0.2 -0.6 0.0 0.0 0.1 0.3 0.1
Compaction (Manual or Auto) M M M A M M M
Compaction Method - Standard (Y/N) Y Y Y Y Y Y Y
No. blows per layer NR 24/27/30 30/35/46 40/50/50 53/53/53 53/53/53 53/53/53
Dry Density g/cm3
2.118 2.123 2.107 2.115 2.117 2.118 2.113
Density Ratio (LDR) % 100.1 100.4 100 100.0 100.1 100.1 99.9
Moisture Ratio (LMR) % 98.1 96.1 100 100.0 99.2 97.5 99.0
BR @ 2.5 mm (%) 73.3 50 38.9 34.7 36.1 55.3 44.7
BR @ 5.0 mm (%) 72.1 54.8 44.7 43.0 46.7 66.7 50.7
CBR (%) 73.3 54.8 44.7 43.0 46.7 66.7 50.7
Correction (mm) zero 0.0 0.1 0.4 0.0 0.6 0.7
Swell (%) -0.1 -0.98 0.0 0.0 0.0 0.3 0
Moisture ww 11.7 11.6 11.8 11.6 11.1 11.2 11.2
Moisture w30 12.8 13.1 12.2 12.1 11.8 12.7 11.3
Moisture wr 10.6 10.6 11.1 10.7 10.8 10.8 11.0
Date last calibrated 8/12/2016 14/02/2017 26/06/2018 16/04/2017 21/02/2018 15/02/2017 19/06/2017
Calibrated range (kN) 0-50kN 0-50kN 0.001-50kN 0-100kN 0-50kN 0-60 0-50kN
Load cell (C) or ring (R) C C C C C C C
Calibration Class (AA, A, B, C etc) A A A A A A A
Hand driven (H) or motorised (M) H H M M M M M
Rate of penetration (mm/min)
Average NR 1mm/min 0.995 0.96 0.99 1mm/min 1.0
Lowest NR NR 0.97 0.83 0.96 NR NR
Highest NR NR 1.02 1.02 1.02 NR NR
Condition of material OK 7.5%MC Sealed Sealed NR Dry Moist Dry
Seating load applied (N) 250 250 250 0.025kN 250 120 250
Seating load set to zero (Y/N) Y Y Y Y Y Y Y
LL determined by clause(5d)1, 2 or 3 3 3 3 3 1 1 3
LL value used Low Low NR <30 26 Low <35 <35
Period Cured (hours) 144 96 24 48 150 48 48
Graph computer or hand (C/H) C C C C C C C
Loads in ( N or kN ) kN kN kN kN kN N N
0 0 0.000 0.0 0.008 0.000 0 0
0.5 2.043 0.958 0.877 0.497 1.383 687 349
1 4.459 2.250 1.879 1.262 2.194 1558 1100
1.5 6.621 3.609 2.957 2.150 3.009 2728 2190
2 8.386 4.888 3.981 3.089 3.888 4071 3315
2.5 9.672 6.069 4.921 3.991 4.769 5430 4543
3 10.660 7.046 5.757 4.832 5.696 6897 5616
3.5 11.574 8.062 6.557 5.634 6.605 NR NR
4 12.310 8.957 7.318 6.434 7.435 9580 7527
4.5 13.293 9.777 8.034 7.218 8.389 NR NR
5 14.274 10.557 8.675 7.988 9.256 11955 9147
6 16.271 12.433 10.050 9.486 10.970 NR NR
7.5 20.529 14.621 12.092 11.556 13.379 16751 12549
8 21.122 15.333 12.736 12.206 14.142 NR NR
10 23.401 18.300 15.257 14.753 16.979 20768 1566010.512.5 26.564 21.422 18.181 17.908 20.555 23992 18833
Code J2 Y8 W9 M3 Y7 F4 M9
Number 8 9 10 11 12 13 14
Note: Blank or NR = No result returned, Green are calculated/corrected results by PT coordinator. Table 2 of 5
6 Participants Test Results 6 Participants Test Results
CBR Proficiency Testing Program - 2018(81)
Copyright: LabSmart Services Pty Ltd Issued - 29 January 2019 Page 33 of 41
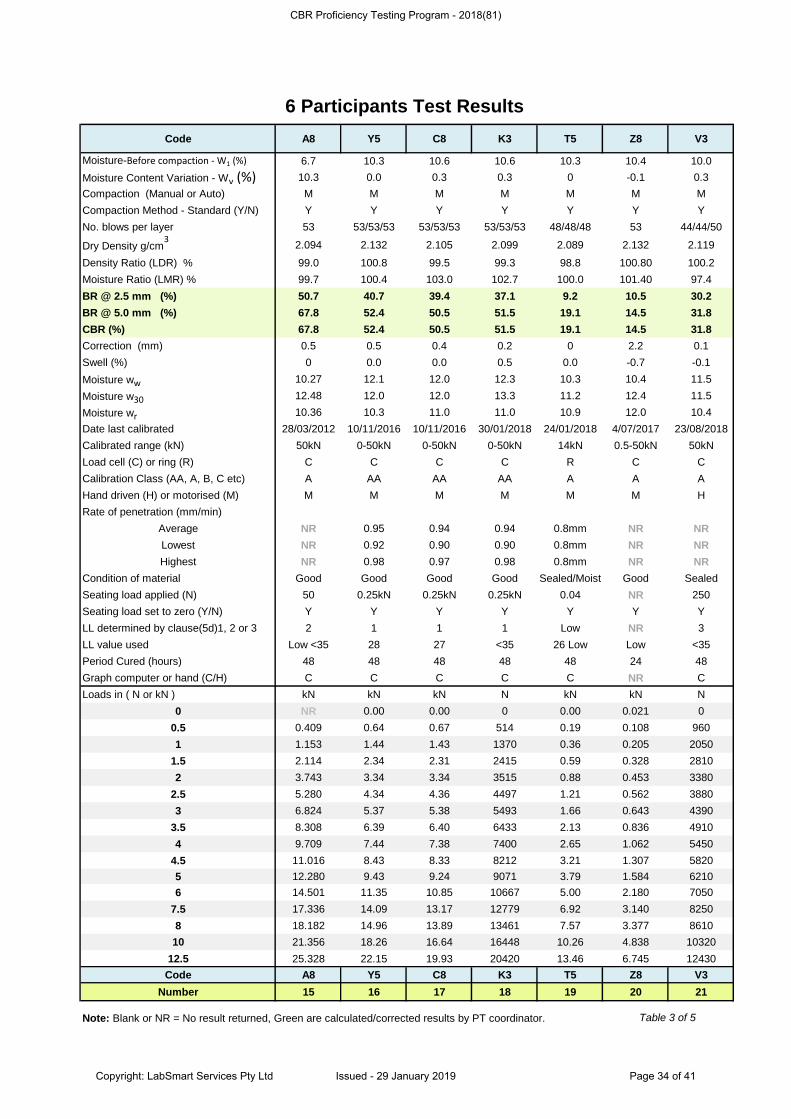
Code A8 Y5 C8 K3 T5 Z8 V3
Moisture-Before compaction - W1 (%) 6.7 10.3 10.6 10.6 10.3 10.4 10.0
Moisture Content Variation - Wv (%) 10.3 0.0 0.3 0.3 0 -0.1 0.3
Compaction (Manual or Auto) M M M M M M M
Compaction Method - Standard (Y/N) Y Y Y Y Y Y Y
No. blows per layer 53 53/53/53 53/53/53 53/53/53 48/48/48 53 44/44/50
Dry Density g/cm3
2.094 2.132 2.105 2.099 2.089 2.132 2.119
Density Ratio (LDR) % 99.0 100.8 99.5 99.3 98.8 100.80 100.2
Moisture Ratio (LMR) % 99.7 100.4 103.0 102.7 100.0 101.40 97.4
BR @ 2.5 mm (%) 50.7 40.7 39.4 37.1 9.2 10.5 30.2
BR @ 5.0 mm (%) 67.8 52.4 50.5 51.5 19.1 14.5 31.8
CBR (%) 67.8 52.4 50.5 51.5 19.1 14.5 31.8
Correction (mm) 0.5 0.5 0.4 0.2 0 2.2 0.1
Swell (%) 0 0.0 0.0 0.5 0.0 -0.7 -0.1
Moisture ww 10.27 12.1 12.0 12.3 10.3 10.4 11.5
Moisture w30 12.48 12.0 12.0 13.3 11.2 12.4 11.5
Moisture wr 10.36 10.3 11.0 11.0 10.9 12.0 10.4
Date last calibrated 28/03/2012 10/11/2016 10/11/2016 30/01/2018 24/01/2018 4/07/2017 23/08/2018
Calibrated range (kN) 50kN 0-50kN 0-50kN 0-50kN 14kN 0.5-50kN 50kN
Load cell (C) or ring (R) C C C C R C C
Calibration Class (AA, A, B, C etc) A AA AA AA A A A
Hand driven (H) or motorised (M) M M M M M M H
Rate of penetration (mm/min)
Average NR 0.95 0.94 0.94 0.8mm NR NR
Lowest NR 0.92 0.90 0.90 0.8mm NR NR
Highest NR 0.98 0.97 0.98 0.8mm NR NR
Condition of material Good Good Good Good Sealed/Moist Good Sealed
Seating load applied (N) 50 0.25kN 0.25kN 0.25kN 0.04 NR 250
Seating load set to zero (Y/N) Y Y Y Y Y Y Y
LL determined by clause(5d)1, 2 or 3 2 1 1 1 Low NR 3
LL value used Low <35 28 27 <35 26 Low Low <35
Period Cured (hours) 48 48 48 48 48 24 48
Graph computer or hand (C/H) C C C C C NR C
Loads in ( N or kN ) kN kN kN N kN kN N
0 NR 0.00 0.00 0 0.00 0.021 0
0.5 0.409 0.64 0.67 514 0.19 0.108 960
1 1.153 1.44 1.43 1370 0.36 0.205 2050
1.5 2.114 2.34 2.31 2415 0.59 0.328 2810
2 3.743 3.34 3.34 3515 0.88 0.453 3380
2.5 5.280 4.34 4.36 4497 1.21 0.562 3880
3 6.824 5.37 5.38 5493 1.66 0.643 4390
3.5 8.308 6.39 6.40 6433 2.13 0.836 4910
4 9.709 7.44 7.38 7400 2.65 1.062 5450
4.5 11.016 8.43 8.33 8212 3.21 1.307 5820
5 12.280 9.43 9.24 9071 3.79 1.584 6210
6 14.501 11.35 10.85 10667 5.00 2.180 7050
7.5 17.336 14.09 13.17 12779 6.92 3.140 8250
8 18.182 14.96 13.89 13461 7.57 3.377 8610
10 21.356 18.26 16.64 16448 10.26 4.838 1032010.512.5 25.328 22.15 19.93 20420 13.46 6.745 12430
Code A8 Y5 C8 K3 T5 Z8 V3
Number 15 16 17 18 19 20 21
Note: Blank or NR = No result returned, Green are calculated/corrected results by PT coordinator.
6 Participants Test Results
Table 3 of 5
6 Participants Test Results
CBR Proficiency Testing Program - 2018(81)
Copyright: LabSmart Services Pty Ltd Issued - 29 January 2019 Page 34 of 41
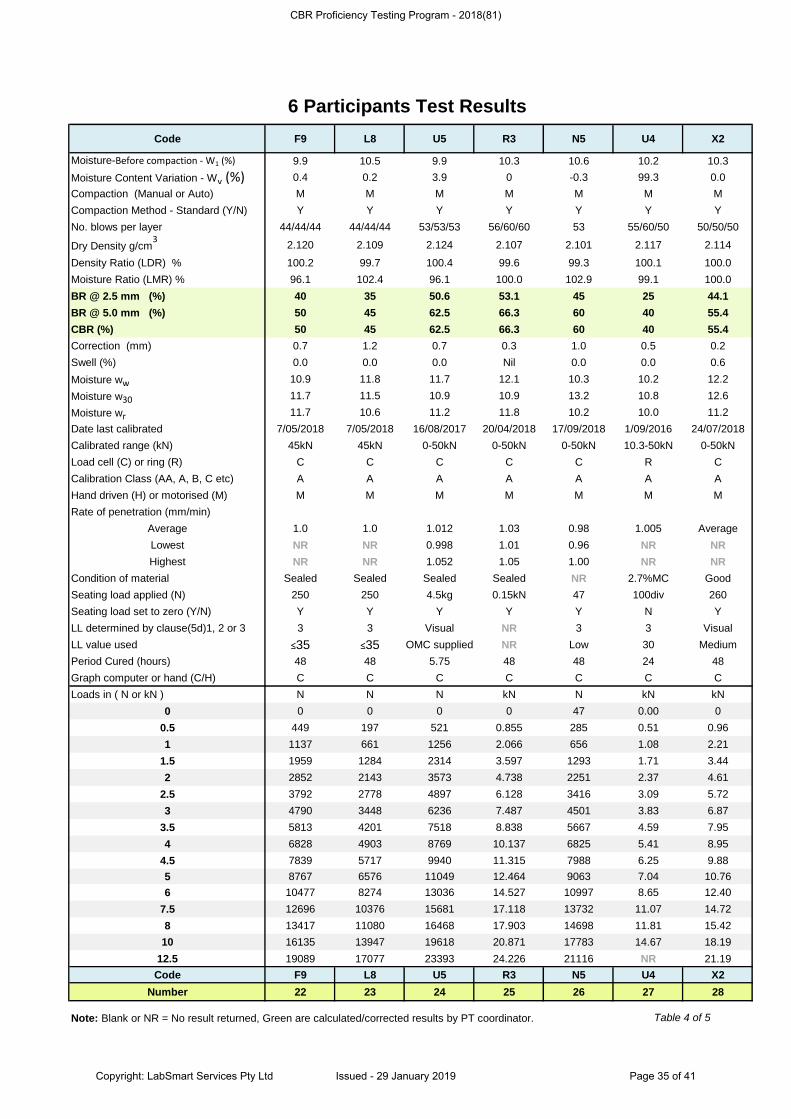
Code F9 L8 U5 R3 N5 U4 X2
Moisture-Before compaction - W1 (%) 9.9 10.5 9.9 10.3 10.6 10.2 10.3
Moisture Content Variation - Wv (%) 0.4 0.2 3.9 0 -0.3 99.3 0.0
Compaction (Manual or Auto) M M M M M M M
Compaction Method - Standard (Y/N) Y Y Y Y Y Y Y
No. blows per layer 44/44/44 44/44/44 53/53/53 56/60/60 53 55/60/50 50/50/50
Dry Density g/cm3
2.120 2.109 2.124 2.107 2.101 2.117 2.114
Density Ratio (LDR) % 100.2 99.7 100.4 99.6 99.3 100.1 100.0
Moisture Ratio (LMR) % 96.1 102.4 96.1 100.0 102.9 99.1 100.0
BR @ 2.5 mm (%) 40 35 50.6 53.1 45 25 44.1
BR @ 5.0 mm (%) 50 45 62.5 66.3 60 40 55.4
CBR (%) 50 45 62.5 66.3 60 40 55.4
Correction (mm) 0.7 1.2 0.7 0.3 1.0 0.5 0.2
Swell (%) 0.0 0.0 0.0 Nil 0.0 0.0 0.6
Moisture ww 10.9 11.8 11.7 12.1 10.3 10.2 12.2
Moisture w30 11.7 11.5 10.9 10.9 13.2 10.8 12.6
Moisture wr 11.7 10.6 11.2 11.8 10.2 10.0 11.2
Date last calibrated 7/05/2018 7/05/2018 16/08/2017 20/04/2018 17/09/2018 1/09/2016 24/07/2018
Calibrated range (kN) 45kN 45kN 0-50kN 0-50kN 0-50kN 10.3-50kN 0-50kN
Load cell (C) or ring (R) C C C C C R C
Calibration Class (AA, A, B, C etc) A A A A A A A
Hand driven (H) or motorised (M) M M M M M M M
Rate of penetration (mm/min)
Average 1.0 1.0 1.012 1.03 0.98 1.005 Average
Lowest NR NR 0.998 1.01 0.96 NR NR
Highest NR NR 1.052 1.05 1.00 NR NR
Condition of material Sealed Sealed Sealed Sealed NR 2.7%MC Good
Seating load applied (N) 250 250 4.5kg 0.15kN 47 100div 260
Seating load set to zero (Y/N) Y Y Y Y Y N Y
LL determined by clause(5d)1, 2 or 3 3 3 Visual NR 3 3 Visual
LL value used ≤35 ≤35 OMC supplied NR Low 30 Medium
Period Cured (hours) 48 48 5.75 48 48 24 48
Graph computer or hand (C/H) C C C C C C C
Loads in ( N or kN ) N N N kN N kN kN
0 0 0 0 0 47 0.00 0
0.5 449 197 521 0.855 285 0.51 0.96
1 1137 661 1256 2.066 656 1.08 2.21
1.5 1959 1284 2314 3.597 1293 1.71 3.44
2 2852 2143 3573 4.738 2251 2.37 4.61
2.5 3792 2778 4897 6.128 3416 3.09 5.72
3 4790 3448 6236 7.487 4501 3.83 6.87
3.5 5813 4201 7518 8.838 5667 4.59 7.95
4 6828 4903 8769 10.137 6825 5.41 8.95
4.5 7839 5717 9940 11.315 7988 6.25 9.88
5 8767 6576 11049 12.464 9063 7.04 10.76
6 10477 8274 13036 14.527 10997 8.65 12.40
7.5 12696 10376 15681 17.118 13732 11.07 14.72
8 13417 11080 16468 17.903 14698 11.81 15.42
10 16135 13947 19618 20.871 17783 14.67 18.1910.512.5 19089 17077 23393 24.226 21116 NR 21.19
Code F9 L8 U5 R3 N5 U4 X2
Number 22 23 24 25 26 27 28
Note: Blank or NR = No result returned, Green are calculated/corrected results by PT coordinator.
6 Participants Test Results
Table 4 of 5
CBR Proficiency Testing Program - 2018(81)
Copyright: LabSmart Services Pty Ltd Issued - 29 January 2019 Page 35 of 41
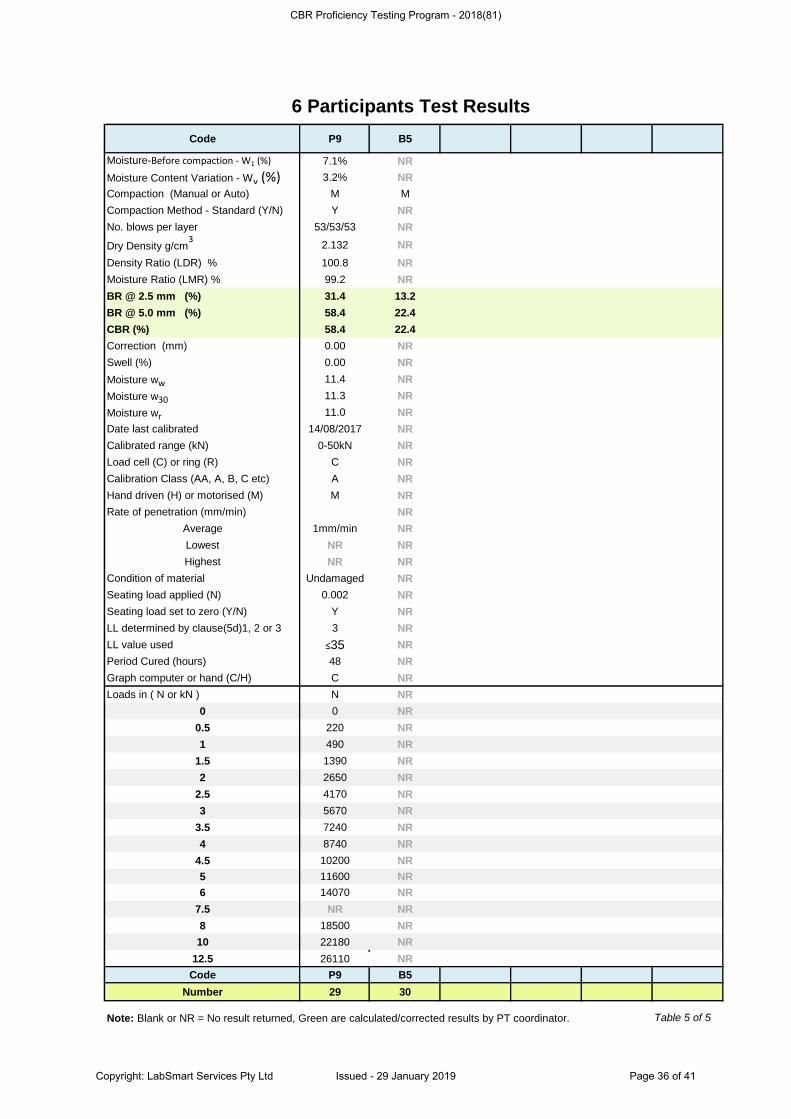
Code P9 B5
Moisture-Before compaction - W1 (%) 7.1% NR
Moisture Content Variation - Wv (%) 3.2% NR
Compaction (Manual or Auto) M M
Compaction Method - Standard (Y/N) Y NR
No. blows per layer 53/53/53 NR
Dry Density g/cm3
2.132 NR
Density Ratio (LDR) % 100.8 NR
Moisture Ratio (LMR) % 99.2 NR
BR @ 2.5 mm (%) 31.4 13.2
BR @ 5.0 mm (%) 58.4 22.4
CBR (%) 58.4 22.4
Correction (mm) 0.00 NR
Swell (%) 0.00 NR
Moisture ww 11.4 NR
Moisture w30 11.3 NR
Moisture wr 11.0 NR
Date last calibrated 14/08/2017 NR
Calibrated range (kN) 0-50kN NR
Load cell (C) or ring (R) C NR
Calibration Class (AA, A, B, C etc) A NR
Hand driven (H) or motorised (M) M NR
Rate of penetration (mm/min) NR
Average 1mm/min NR
Lowest NR NR
Highest NR NR
Condition of material Undamaged NR
Seating load applied (N) 0.002 NR
Seating load set to zero (Y/N) Y NR
LL determined by clause(5d)1, 2 or 3 3 NR
LL value used ≤35 NR
Period Cured (hours) 48 NR
Graph computer or hand (C/H) C NR
Loads in ( N or kN ) N NR
0 0 NR
0.5 220 NR
1 490 NR
1.5 1390 NR
2 2650 NR
2.5 4170 NR
3 5670 NR
3.5 7240 NR
4 8740 NR
4.5 10200 NR
5 11600 NR
6 14070 NR
7.5 NR NR
8 18500 NR
10 22180 NR10.5 NR12.5 26110 NR
Code P9 B5
Number 29 30
Note: Blank or NR = No result returned, Green are calculated/corrected results by PT coordinator. Table 5 of 5
6 Participants Test Results
CBR Proficiency Testing Program - 2018(81)
Copyright: LabSmart Services Pty Ltd Issued - 29 January 2019 Page 36 of 41
81 App A CBR PT Instructions V3.docx
LabSmart Services
Proficiency Testing Program
California Bearing Ratio – 2018 (81)
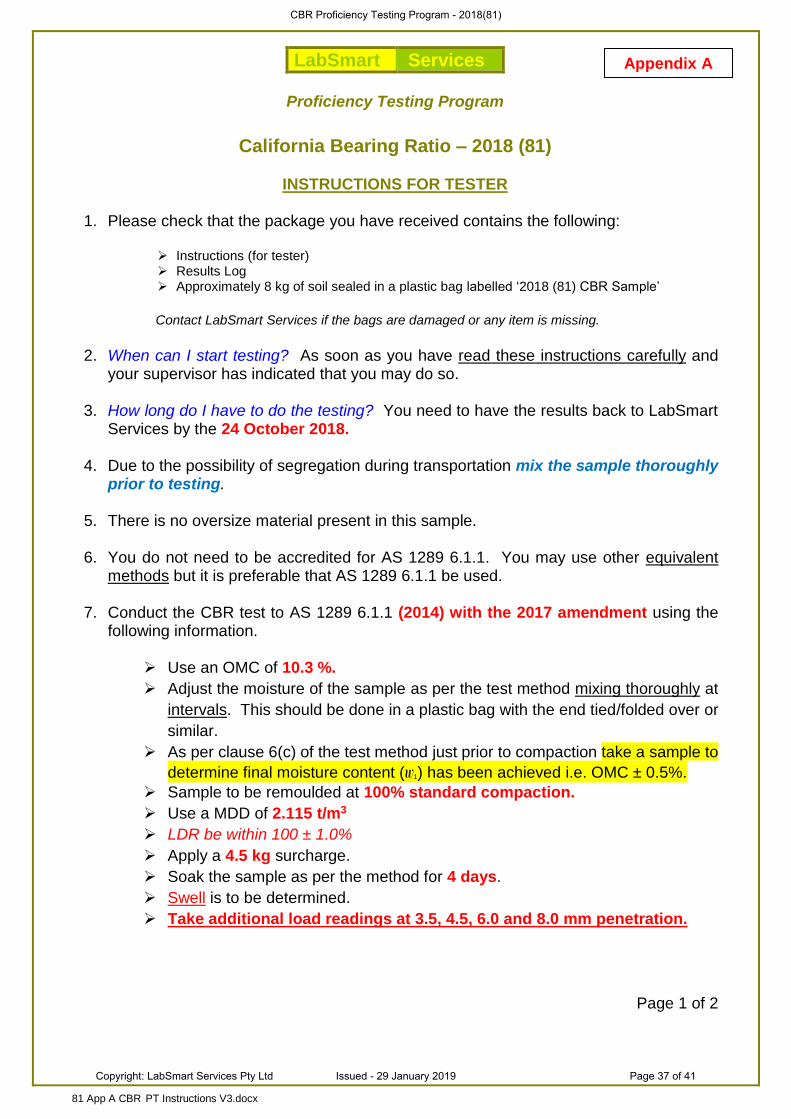
INSTRUCTIONS FOR TESTER
1. Please check that the package you have received contains the following:
➢ Instructions (for tester) ➢ Results Log ➢ Approximately 8 kg of soil sealed in a plastic bag labelled ‘2018 (81) CBR Sample’
Contact LabSmart Services if the bags are damaged or any item is missing.
2. When can I start testing? As soon as you have read these instructions carefully and
your supervisor has indicated that you may do so.
3. How long do I have to do the testing? You need to have the results back to LabSmart Services by the 24 October 2018.
4. Due to the possibility of segregation during transportation mix the sample thoroughly
prior to testing.
5. There is no oversize material present in this sample. 6. You do not need to be accredited for AS 1289 6.1.1. You may use other equivalent
methods but it is preferable that AS 1289 6.1.1 be used.
7. Conduct the CBR test to AS 1289 6.1.1 (2014) with the 2017 amendment using the following information.
➢ Use an OMC of 10.3 %.
➢ Adjust the moisture of the sample as per the test method mixing thoroughly at
intervals. This should be done in a plastic bag with the end tied/folded over or
similar.
➢ As per clause 6(c) of the test method just prior to compaction take a sample to
determine final moisture content (w1) has been achieved i.e. OMC ± 0.5%.
➢ Sample to be remoulded at 100% standard compaction.
➢ Use a MDD of 2.115 t/m3
➢ LDR be within 100 ± 1.0%
➢ Apply a 4.5 kg surcharge.
➢ Soak the sample as per the method for 4 days.
➢ Swell is to be determined.
➢ Take additional load readings at 3.5, 4.5, 6.0 and 8.0 mm penetration.
Page 1 of 2
Appendix A
CBR Proficiency Testing Program - 2018(81)
Copyright: LabSmart Services Pty Ltd Issued - 29 January 2019 Page 37 of 41
81 App A CBR PT Instructions V3.docx
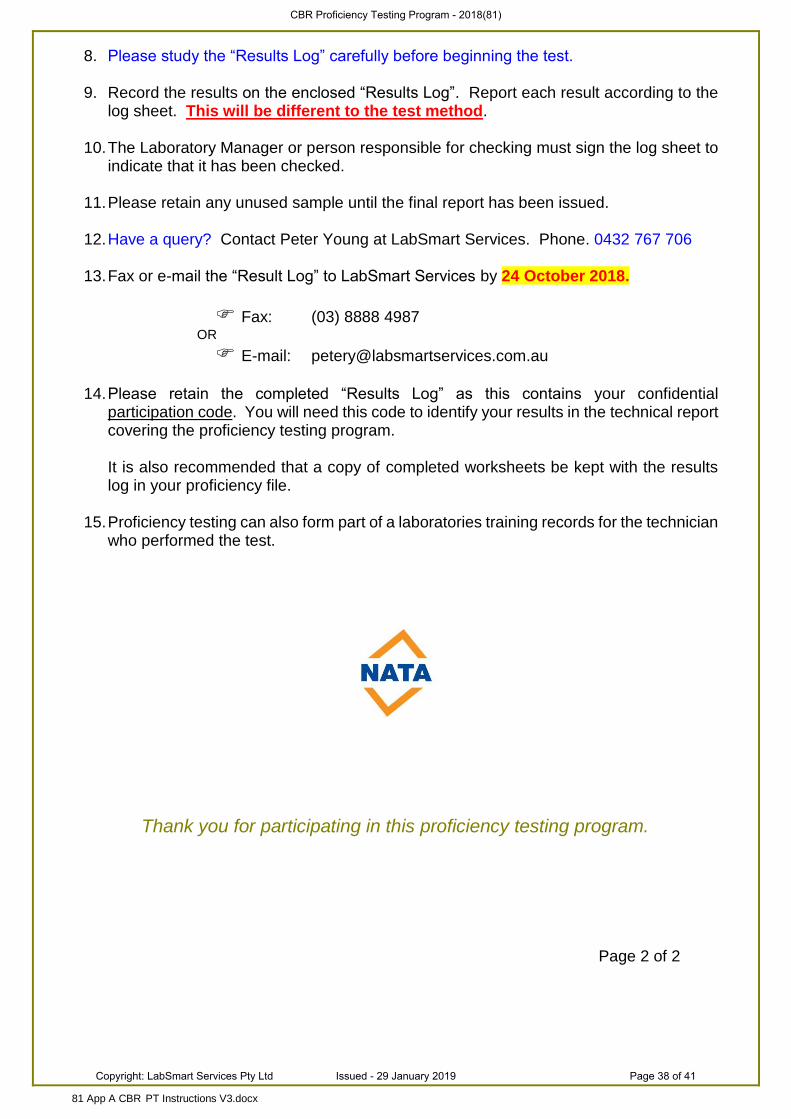
8. Please study the “Results Log” carefully before beginning the test.
9. Record the results on the enclosed “Results Log”. Report each result according to the log sheet. This will be different to the test method.
10. The Laboratory Manager or person responsible for checking must sign the log sheet to
indicate that it has been checked.
11. Please retain any unused sample until the final report has been issued.
12. Have a query? Contact Peter Young at LabSmart Services. Phone. 0432 767 706
13. Fax or e-mail the “Result Log” to LabSmart Services by 24 October 2018.
Fax: (03) 8888 4987 OR
E-mail: [email protected]
14. Please retain the completed “Results Log” as this contains your confidential
participation code. You will need this code to identify your results in the technical report covering the proficiency testing program. It is also recommended that a copy of completed worksheets be kept with the results log in your proficiency file.
15. Proficiency testing can also form part of a laboratories training records for the technician who performed the test.
Thank you for participating in this proficiency testing program.
Page 2 of 2
CBR Proficiency Testing Program - 2018(81)
Copyright: LabSmart Services Pty Ltd Issued - 29 January 2019 Page 38 of 41
81 App B PT Results Log V4.docx
LabSmart Services
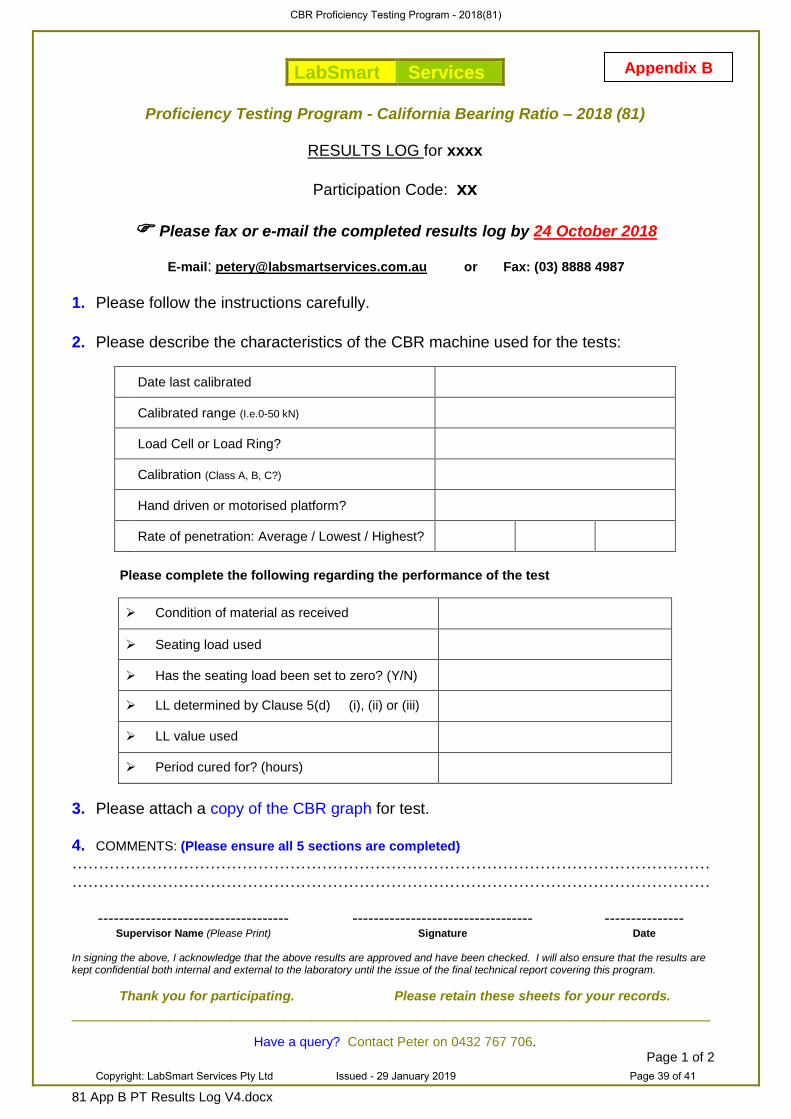
Proficiency Testing Program - California Bearing Ratio – 2018 (81)
RESULTS LOG for xxxx
Participation Code: xx
Please fax or e-mail the completed results log by 24 October 2018
E-mail: [email protected] or Fax: (03) 8888 4987
1. Please follow the instructions carefully.
2. Please describe the characteristics of the CBR machine used for the tests:
Date last calibrated
Calibrated range (I.e.0-50 kN)
Load Cell or Load Ring?
Calibration (Class A, B, C?)
Hand driven or motorised platform?
Rate of penetration: Average / Lowest / Highest?
Please complete the following regarding the performance of the test
➢ Condition of material as received
➢ Seating load used
➢ Has the seating load been set to zero? (Y/N)
➢ LL determined by Clause 5(d) (i), (ii) or (iii)
➢ LL value used
➢ Period cured for? (hours)
3. Please attach a copy of the CBR graph for test. 4. COMMENTS: (Please ensure all 5 sections are completed)
……………………………………………………………………………………………………………………………………………………………………………………………………………………
------------------------------------ ---------------------------------- --------------- Supervisor Name (Please Print) Signature Date
In signing the above, I acknowledge that the above results are approved and have been checked. I will also ensure that the results are kept confidential both internal and external to the laboratory until the issue of the final technical report covering this program.
Thank you for participating. Please retain these sheets for your records.
________________________________________________________________________
Have a query? Contact Peter on 0432 767 706. Page 1 of 2
Appendix B
CBR Proficiency Testing Program - 2018(81)
Copyright: LabSmart Services Pty Ltd Issued - 29 January 2019 Page 39 of 41
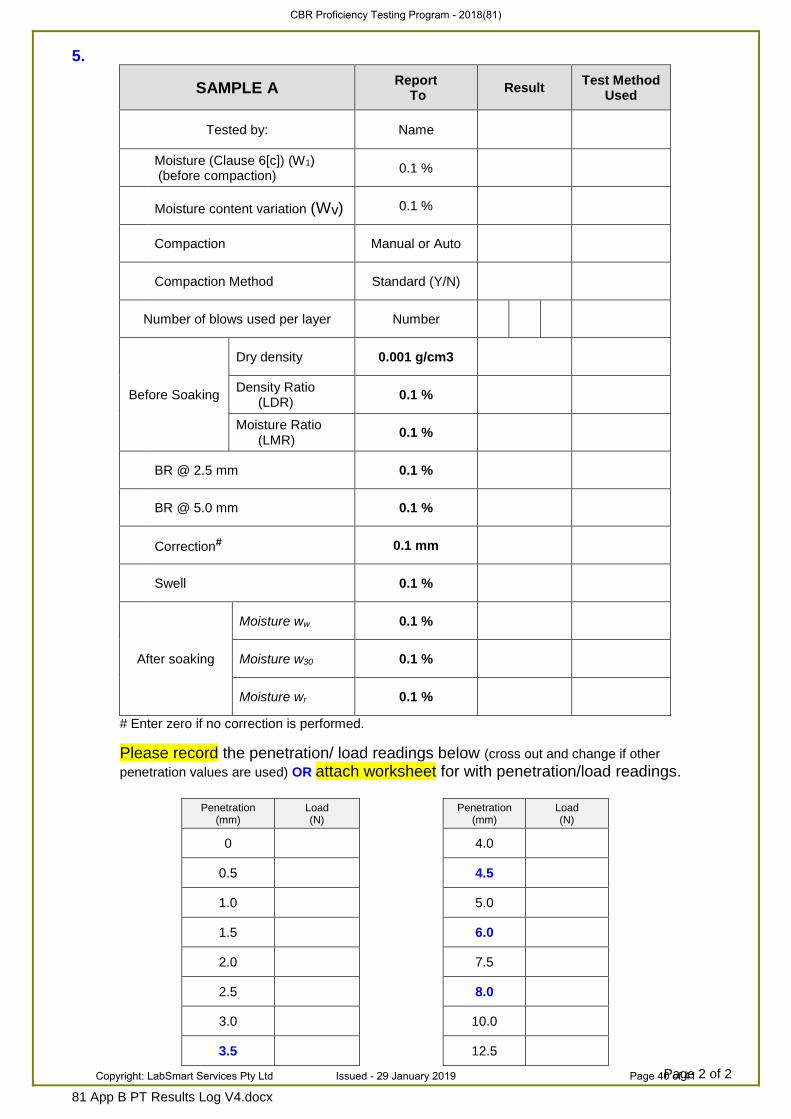
81 App B PT Results Log V4.docx
5.
SAMPLE A Report
To Result
Test Method Used
Tested by: Name
Moisture (Clause 6[c]) (W1) (before compaction)
0.1 %
Moisture content variation (Wv) 0.1 %
Compaction Manual or Auto
Compaction Method Standard (Y/N)
Number of blows used per layer Number
Before Soaking
Dry density 0.001 g/cm3
Density Ratio (LDR)
0.1 %
Moisture Ratio (LMR)
0.1 %
BR @ 2.5 mm 0.1 %
BR @ 5.0 mm 0.1 %
Correction# 0.1 mm
Swell 0.1 %
After soaking
Moisture ww 0.1 %
Moisture w30 0.1 %
Moisture wr 0.1 %
# Enter zero if no correction is performed.
Please record the penetration/ load readings below (cross out and change if other
penetration values are used) OR attach worksheet for with penetration/load readings.
Penetration (mm)
Load (N)
Penetration
(mm) Load (N)
0 4.0
0.5 4.5
1.0 5.0
1.5 6.0
2.0 7.5
2.5 8.0
3.0 10.0
3.5 12.5
Page 2 of 2
CBR Proficiency Testing Program - 2018(81)
Copyright: LabSmart Services Pty Ltd Issued - 29 January 2019 Page 40 of 41
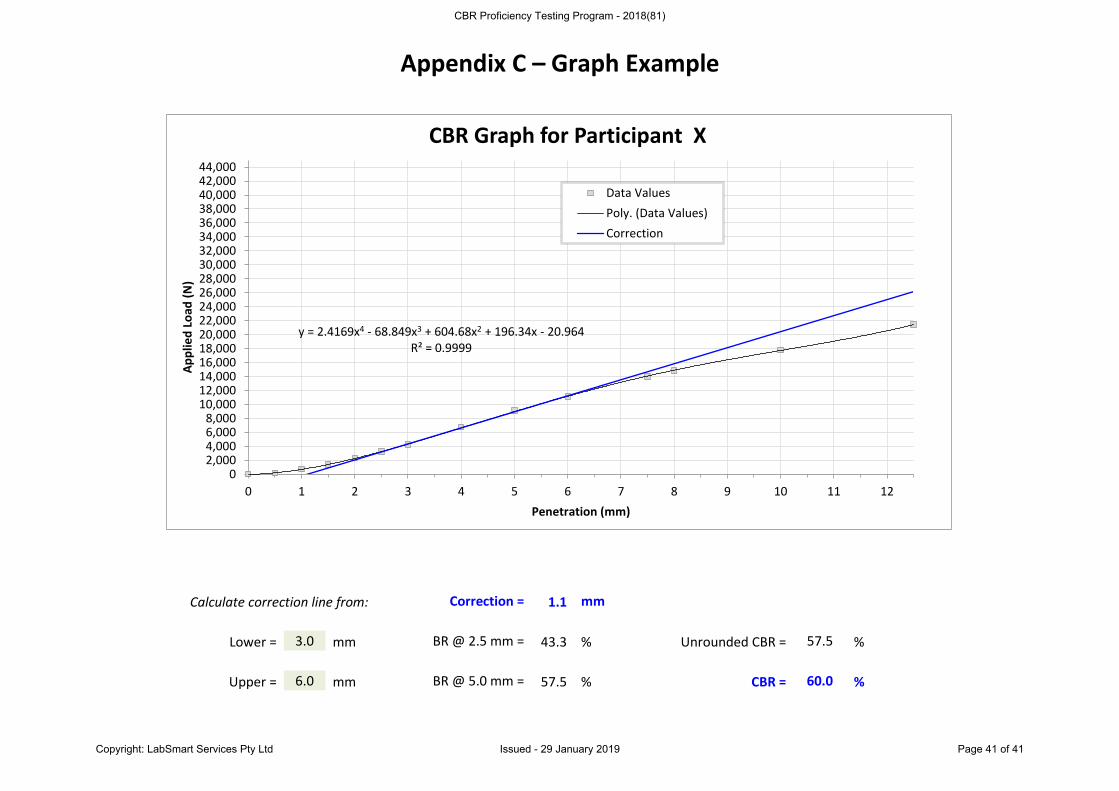
Appendix C – Graph Example
Calculate correction line from: Correction = 1.1 mm
Lower = 3.0 mm BR @ 2.5 mm = 43.3 % Unrounded CBR = 57.5 %
Upper = 6.0 mm BR @ 5.0 mm = 57.5 % CBR = 60.0 %
y = 2.4169x4 - 68.849x3 + 604.68x2 + 196.34x - 20.964R² = 0.9999
02,0004,0006,0008,000
10,00012,00014,00016,00018,00020,00022,00024,00026,00028,00030,00032,00034,00036,00038,00040,00042,00044,000
0 1 2 3 4 5 6 7 8 9 10 11 12
Ap
plie
d L
oad
(N
)
Penetration (mm)
CBR Graph for Participant X
Data Values
Poly. (Data Values)
Correction
CBR Proficiency Testing Program - 2018(81)
Copyright: LabSmart Services Pty Ltd Issued - 29 January 2019 Page 41 of 41