Embed Size (px)
Citation preview
1
CBR Quarterly Review Vol. 3, No. 1, July – September 2003
A Review of Resource Mobilization Efforts of
Central Board of Revenue
CENTRAL BOARD OF REVENUE Government of Pakistan
Constitution Avenue
Islamabad - Pakistan

Contact:
Dr. Ather Maqsood Ahmed
Member, Fiscal Research and Statistics
e-mail: [email protected]
Phone: (051)-920-4436
Fax: (051)-921-9211
October: 2003

Contents Pages
Foreword by Chairman, CBR i
I. CBR Tax Collection: An Analysis of
Revenue Statistics 1
o The Economy 1
o CBR Revenue Target for FY 03-04 3
o Monitoring CBR Revenue Collection 6
o CBR Revenue Position 7
o Overall Collection and Refunds 7
o Detailed Analysis of Individual Taxes 9
o Direct Taxes 9
o Sales Tax 12
o Customs Duties 15
o Central Excise Duties 18
o Concluding Observations 20
II. Industry Profile: Cement Industry in Pakistan 21
III. Pakistan’s Experience with WTO Agreements
on Market Access 33
IV. WTO Agreement on Customs Valuation: Pakistan’s
Experience in Historical Perspective 43
V. CBR Reform Program:
Introducing ‘Income Tax Assistant’ 55

i
Foreword The CBR Reform program is well on its way and a number of initiatives have been undertaken in the recent past to facilitate taxpayers to honor their tax obligations with respect. One such initiative is the ‘Income Tax Assistant’ – a software prepared painstakingly and circulated by CBR prior to the September deadline of submitting income tax returns. A brief note on it has been included in this issue. The instant CBR Quarterly Review is presented with the objective of sharing with stakeholders the efforts of CBR to improve tax collection and administration. This journey was started in June 2002 when the first issue of the Review was published. The quarterly analysis of data is carried out as soon as the disaggregated information becomes available and it is circulated far and wide among representatives of trade and investment bodies, policy planners, researchers, and tax practitioners. We have received valuable comments and, occasionally felicitations, from our valued readers. One of the major shifts in our analysis is the preference for thematic presentations. The articles in the Review now revolve around topics of policy interest. The current issue focuses on Pakistan’s compliance with various WTO Agreements with special emphasis on market access and customs valuation. Let me hasten to add that some of the views expressed in the Review deviate somewhat from the official viewpoint. Nonetheless, it only emphasizes the new CBR culture of encouraging freedom of expression. While complimenting the efforts of the Fiscal Research wing at CBR, I look forward to receiving continued feedback from our esteemed customers.
Riaz A. Malik
Chairman, CBR

1
I
CBR Tax Collection: An Analysis of Revenue Statistics of Q1:03-041
The Economy
Pakistan’s economy has maintained its upswing for the fifth quarter
running. This means that, technically, the economy has come out of
an extended period of recession. The strength of economic
fundamentals, rising domestic and external demand, and stability of
the financial markets corroborate that the economy has reached the
stage of sustained growth. The recent decision of the government to
retire expensive debt earlier than the due date also confirms that
prudent economic management has provided the much-needed fiscal
space to focus on social sectors that were reluctantly overlooked in
the past to settle the heavy debt burden. At the same time there is no
denying that external factors that influenced rescheduling of debt
and raised the level of capital inflow through formal banking
channels have also helped in achieving the immediate objective of
economic revival and financial stability. Nonetheless, we believe
that the implementation of wide-ranging reform programs and
consistency of policies have a bigger share in reversing the fortune
to regain the lost credibility and to meet international commitments.
A brief review of the 1st quarter statistics confirms that there is
ample evidence of broad-based recovery. However, the future
outlook remains watchful in certain areas. Most importantly, in the
agriculture sector the initial damage to the cotton crop caused by
rains has been deteriorated further due to pest attack. Despite the
optimism shown by MINFAL that the production target would be
achieved due to 15% increase in the sown area, the market situation
1 The Research Team of the Fiscal Research Wing of CBR has prepared this Chapter. Valuable support
by the staff of the Budget Wings of Direct & Indirect Taxes and the Directorate of Research & Statistics is gratefully acknowledged.

2
stays precarious. Similarly, wheat production can be affected
adversely, especially in the sugarcane growing areas, if the crushing
season is delayed further. Needless to add that better availability of
sufficient irrigation water during Kharif and Rabi seasons, and
expected gains through bumper rice crop have brightened the overall
prospects, which means that the contribution of the agriculture
sector in GDP may not differ significantly from its initial estimates.
It is also refreshing that the production of leading industries has
started to pick up. For thirty-nine manufactured items, that constitute
42% of the manufacturing sector output, the growth in production
has been 6.8% during July-August 2003. Some of the products
registering robust growth were: motor vehicles including
motorcycles 53.6%, cotton cloth 21.3%, jute goods 21.6%, caustic
soda17.3%, cement 15.5%, cigarettes 15.3%, and coke12.3%.
However, why the contagion effect is missing and widespread
recovery of the industrial sector is delayed remains a concern? The
lukewarm response of private sector could have been due to various
reasons including higher cost of doing business, inadequate level of
skills of the available work force, poor maintenance of the existing
infrastructure, and most importantly, the missing enthusiasm and
coordination among relevant public institutions to create conducive
environment for investment in the country.
The external trade sector despite being vibrant remains narrowly
concentrated in few commodity groups. According to the CBR data,
total imports have increased from Rs. 172.5 billion in Q1:02-03 to
Rs. 179.3 billion in Q1:03-04, indicating a growth of around 4%.
However, imports of 15 major commodity groups, constituting 82%
of the total import value, have increased by 18.5%. Similarly, even
though the rupee value of exports has increased by 11.3% during the
1st quarter of FY 03-04, the driving force behind this growth
continues to be the textile sector. Nevertheless, irrespective of the
commodity composition of foreign trade, the growth pattern of

3
imports and exports has resulted into further improvement in the
current account position.
Another brighter side of the economy is the reinforcement of the real
sector gains by the stability of the financial sector that has been
ensured through careful manipulation of the monetary/ exchange
rate policy mix and a strict monitoring of financial institutions.
Excess liquidity has been moped up through effective open market
operations and in the process the collusive arrangement among
banks to raise interest rate has been discouraged. The most notable
development is the receding fear of deflation.
To sum up, the improved macroeconomic environment substantiates
that the broad ranging policy reform agenda that envisioned a
competitive milieu and level playing field for all stakeholders has
been realized to a great extent. However, the economy has not yet
reached the level of maturity. Low savings and investment rates,
persisting unemployment, and high incidence of poverty remain
some of the significant missing links to overall development that
require continued attention.
CBR Revenue Target for FY 03-04
The following regression equation has been used to describe the tax
revenue and GDP relationship in a simplified way:
Log (Tax Revenue) = -1.83 + 0.976 Log (GDP at market prices)
(-12.80) (95.45)
R2 = 0.998 D.W. = 1.66 F = 9111.5
Based on the buoyancy estimate of 0.976 and the projected value of
nominal GDP at market prices, the baseline revenue target for FY

4
03-04 is estimated to be Rs. 494.2 billion.2 This includes a net
reduction of Rs. 10 billion in revenue on account of various tax
measures introduced during current and past fiscal years, which are
briefly discussed in the following paragraph. The CBR revenue
target for FY 03-04 is, nonetheless, fixed at Rs. 510 billion so that
tax/GDP ratio could be maintained at 11.5%. The target envisages
an increase of 10.7% over actual collection of Rs. 460.6 billion in
FY 02-03. A comparison of the budgetary targets of major taxes
with actual collection presented in Table 1 indicates that an increase
of 6.2% is anticipated for direct taxes, 14.5% for sales tax, 13% for
customs duties and 6% for central excise duties.
Table 1: Comparison of Collection and Target: FY 03-04 over FY 02-03
(Rs. Billion)
Collection
FY 02-03
Target
FY 03-04
Difference
(Percent)
Direct Taxes 151.7 161.1 6.2
Sales Tax 194.8 223.1 14.5
Customs 69.1 78.1 13.0
Central Excise 45.0 47.7 6.0
All Taxes 460.6 510.0 10.7
Some of the specific fiscal initiatives introduced at the time of
Budget 2002-03 and Budget 2003-04 are as follows:
a) The Revenue Impact of Measures Taken in Budget 2002-03:
The direct tax collection will have an adverse impact of Rs.
3.6 billion on account of three tax measures announced in the
Federal Budget of 2002-03. First, the minimum threshold of
exemption from income tax for individuals (and association
of persons) was raised from Rs. 60,000 to Rs. 80,000 to
provide relief to low and low-to-medium income earners. It
is anticipated that this measure will reduce income tax
2 The nominal GDP at market prices is projected to grow by 9.5% during FY 03-04. This requires that
non-agriculture (nominal) income and large-scale manufacturing (nominal) income grow by 10.1% and
9.5% respectively. Additionally, imports and dutiable imports (at current prices) are expected to increase by 12.1% during FY 03-04 as dollar-rupee parity is expected to remain stabilized.

5
collection by about Rs. 2.4 billion. Second, the reduction in
tax rates of banking and private companies to create parity
will cost around Rs. 1 billion to national exchequer, and
third, the increase in the mark-up limit for housing loans will
reduce direct tax collection by about Rs. 220 million.
b) Tariff Rationalization to Support Industrial Growth: On the
basis of a detailed rationalization exercise, duty on 259 items
classified as raw materials and components for industrial
sectors such as heavy engineering, capacitors, auto-
engineering and agriculture implements, casting and forging,
items for ceramics industry, fan industry, surgical and
cutlery, bulbs and tube lights etc has been reduced. However,
with a view to give protection to the local industry, the duty
on old and used dumpers has been raised from 40% to 100%.
Similarly, for locally manufactured parts of electricity meters
from it has been raised from 10% to 20% and 25%, on old
and used computer monitors from zero to 25% and on waste
paper other than pressed bundles from 10% to 20%.
c) Reduction of Customs Duty on Smuggling prone items: The
rate of duty on smuggling prone items like tea has been
slashed from 25% to 20%, spices (nutmeg, mace and seeds
of anise or badian) from 20% to 10%, silk yarn from 15% to
10% and ball bearings and wristwatches from 10% to 5%.
d) Exemption of Customs Duty on Oilseeds and levy of Sales
Tax instead: Prior to the announcement of the Budget for
CFY, oil-seeds used for the extraction of edible oils were
exempt from sales tax but chargeable to customs duty @
10%. In order to broaden the sales tax net, Customs duty has
been withdrawn and replaced with levy of sales tax on
import of edible oil seeds.
e) Reduction of CED on Cement: Cement has remained a
heavily taxed item over the years. CED on this item was
reduced from Rs.1400 per MT to Rs.1000 per MT in

6
September 2000. Additionally, it was also liable to sales tax
at the standard rate of 15%. In order to give relief to
construction activity, CED has been reduced from Rs.1000
to Rs.750 per ton. Even though this measure will reduce
CED collection by about Rs. 2.7 billion, nonetheless, it is
anticipated that the Cement Industry will flourish as a
consequence and consumers will also get relief in the shape
of lower retail price of cement.
f) Withdrawal of CED on Wires & Cables and Paper &
Paperboard: In continuation with government policy to
reduce items subjected to CED and instead rely on GST,
paper and paperboard and wires and cables have been
exempted from CED. While these exemptions will generate
far-reaching benefits towards strengthening of the related up-
and downstream industries, they will reduce CED collection
by about Rs. 1.5 billion.
Monitoring CBR Revenue Collection
In an effort to monitor revenue collection on regular intervals,
monthly and quarterly targets of the four taxes have been prepared
on the basis of historical trends in collection, i.e., average collection
during FY 97-98 and FY 02-03. Slight adjustments have been made
to these guiding posts in the light of the most recent outturn and the
policy initiatives undertaken during the year. Accordingly, the
revenue target for the July-September 2003 has been fixed at Rs.
92.2 billion, which constitutes about 18.1% of the yearly target.
Similarly, to maintain consistency, greater reliance is placed on GST
and direct taxes. Nearly 46% of the 1st quarter net collection is
expected to come from sales tax and 27.4% from direct taxes (Table
2). The revenue targets for the 2nd, 3rd, and 4th quarters are fixed at
Rs. 125.9 billion, Rs. 123.9 billion, and Rs. 168.1 billion, which
constitute about 25%, 24%, and 33% of yearly target, respectively.
The end loading should not be surprising as it is not an exception.

7
Table 2: Monthly and Quarterly CBR Targets for FY 03-04 (Rs. Billion)
Direct
Taxes
Sales
Taxes
Customs
Duties
Central
Excise
All
Taxes
July 6.2 10.3 4.9 2.0 23.4
August 7.6 14.5 5.0 3.0 30.1
September 11.5 17.5 6.2 3.5 38.7
Quarter: 1 25.3 42.3 16.1 8.5 92.2
October 12.3 17.1 5.8 3.6 38.8
November 11.4 17.3 5.2 3.6 37.5
December 21.3 17.7 6.9 3.7 49.6
Quarter: 2 45.0 52.1 17.9 10.9 125.9
January 12.2 18.1 6.8 3.7 40.8
February 10.6 18.3 6.5 3.8 39.2
March 13.7 18.5 7.5 4.2 43.9
Quarter: 3 36.5 54.9 20.8 11.7 123.9
April 14.3 20.0 7.8 4.7 46.8
May 14.1 24.9 7.5 5.4 51.9
June 25.9 29.1 8.0 6.4 69.4
Quarter: 4 54.3 74.0 23.3 16.5 168.1
Full Year 161.1 223.1 78.1 47.7 510.0
CBR Revenue Position
The revenue target for the 1st quarter of FY 03-04 has been
achieved. CBR has managed to collect Rs. 94.1 billion against the
target of Rs. 92.2 billion, which is 2.1% higher than the target. The
momentum in revenue collection has been maintained largely due to
broad-based growth of the economy. At the same time various
policy initiatives undertaken by CBR over the last few years have
started to payoff. A favorable tax friendly environment has been
created and maintained that has encouraged taxpayers to support tax
policy and administrative reform initiatives of the government. They
are now part of the new taxation system.
Overall Collection and Refunds
Traditionally, even though the collection is somewhat slower at the
start of new fiscal year, this year the tradition has been set aside. It is
the fifth consecutive quarter running that the collection has been
8
according to the projections made at the beginning of the year. A
comparison of individual taxes with the first quarter targets exhibits
an encouraging picture as the collection of three out of four federal
taxes has exceeded their respective targets. The largest increase of
11.1% has been observed in the case of customs duties.
Interestingly, the collection of central excise duties has also
surpassed the target by 5.9% even though its collection has fallen
short of last year’s collection due to its fading nature. The only
exception where the target has not been met is sales tax; its
collection has missed the target by 1.7%.
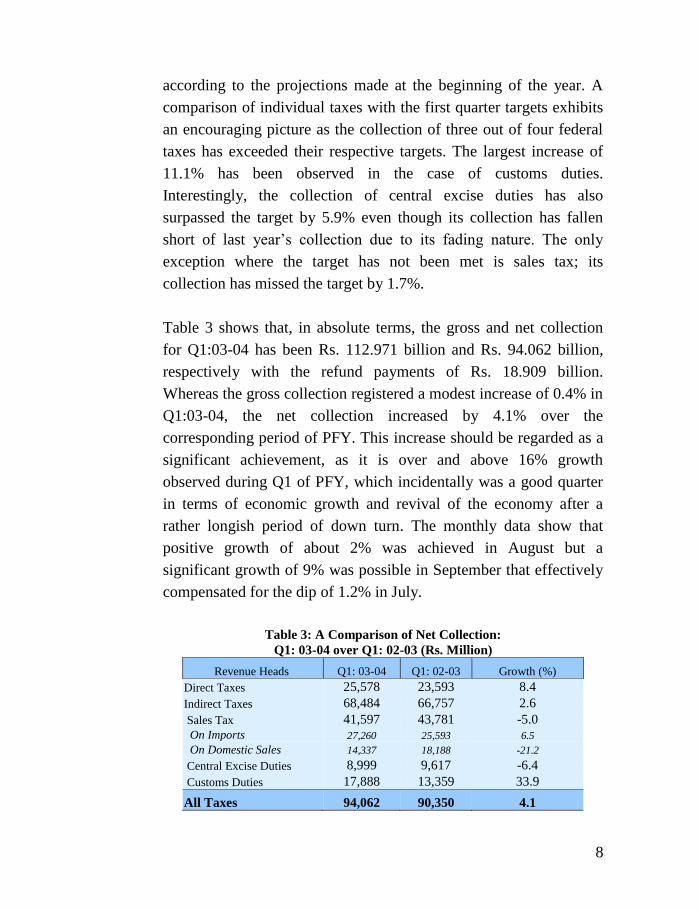
Table 3 shows that, in absolute terms, the gross and net collection
for Q1:03-04 has been Rs. 112.971 billion and Rs. 94.062 billion,
respectively with the refund payments of Rs. 18.909 billion.
Whereas the gross collection registered a modest increase of 0.4% in
Q1:03-04, the net collection increased by 4.1% over the
corresponding period of PFY. This increase should be regarded as a
significant achievement, as it is over and above 16% growth
observed during Q1 of PFY, which incidentally was a good quarter
in terms of economic growth and revival of the economy after a
rather longish period of down turn. The monthly data show that
positive growth of about 2% was achieved in August but a
significant growth of 9% was possible in September that effectively
compensated for the dip of 1.2% in July.
Table 3: A Comparison of Net Collection:
Q1: 03-04 over Q1: 02-03 (Rs. Million)
Revenue Heads Q1: 03-04 Q1: 02-03 Growth (%)
Direct Taxes 25,578 23,593 8.4
Indirect Taxes 68,484 66,757 2.6
Sales Tax 41,597 43,781 -5.0
On Imports 27,260 25,593 6.5
On Domestic Sales 14,337 18,188 -21.2
Central Excise Duties 8,999 9,617 -6.4
Customs Duties 17,888 13,359 33.9
All Taxes 94,062 90,350 4.1
9
Detailed Analysis of Individual Taxes
The detailed analysis of individual taxes is carried out to understand
inter linkages between tax receipts and macroeconomic aggregates.
It is believed that CBR performance is closely linked with the
overall improvement in the economy. Since a number of fiscal
policy initiatives have been undertaken during the current and past
fiscal years with respect to broadening of tax bases and
improvement in tax administration, it is relevant to know the impact
of these policy changes on tax collection.
Direct Taxes: The gross collection on account of direct taxes during
the 1st quarter of CFY was Rs. 27.4 billion, refunds Rs. 1.8 billion,
and net collection Rs. 25.6 billion. This compares with gross
collection of Rs. 27.3 billion, refunds Rs. 3.7 billion, and net
collection Rs. 23.6 billion during Q1:02-03. Thus, the gross and net
collection has increased by 0.3% and 8.4%, respectively, which is
more than the required yearly growth of 6.2%. The important feature
of this growth in direct tax receipts is the increase in collection with
returns. Although the number of income tax returns filed by the
taxpayers has declined by about 19% as of 10th October 2003 as
compared to PFY, the amount of income tax submitted with returns
has increased by 92%. This is a significant development and could
be attributed to improved profitability of leading non-resident
companies due to better turnover. This is also evident from an
improved collection registered at the Large Taxpayer Unit, Karachi.
As far as the reduction in returns is concerned, it could have been
due to the increase in the minimum threshold from Rs. 60,000 to Rs.
80,000 during the Budget 02-03. Both these factors require further
investigation, that will remain pending until the availability of
computerized data on returns.
Components of Income and Corporate Taxes: While the first two
major components of income tax, i.e., voluntary compliance and
collection on demand registered a negative growth during the 1st

10
quarter of CFY as compared to Q1 of PFY, the third component, i.e.,
the withholding taxes registered an increase to compensate for the
fall in the other two components. As indicated earlier, voluntary
compliance as a result of the introduction of Income Tax Ordinance,
2001 and the in-built concept of Universal Self-Assessment is
significant. This is indicated by 92% increase in the income tax
revenue along with the returns. However, this development has been
overshadowed by a substantial reduction in advance payments (by
67.4%). Consequently, the voluntary compliance has registered a
negative growth of 29.4% (Table 4). It may be added that advance
payments are one of the leading sources of refund claims, which
means that a fall in advance payments is expected to result in lower
refund claims in the future.
Similar to voluntary compliance, the collection on demand, arrears
as well as current, has registered a decline of 20.4% and its share in
gross income tax receipts has also fallen to 4.4% against 5.3%
during Q1 of PFY. Although this is not an unusual phenomenon, at
least during the 1st quarter, this decline could be due the gradual
shift in perception of tax collectors and taxpayers about the new tax
regime where the emphasis is being shifted from full assessment to
risk-based audit.
Table 4: Monthly Data on Voluntary Payments & Collection on Demand:
A Comparison FY 03-04 & FY 02-03 Collection
(Rs. Million)
FY: 03-04 FY: 02-03
Difference
Absolute Percent
Voluntary Payments
July 165.1 230.2 -65.6 -28.4
August 76.7 441.2 -364.5 -82.6
September 4959.5 6697.9 -1738.4 -26.0
Quarter 1 5201.3 7369.3 -2168.0 -29.4
Collection on Demand
July 364.3 196.8 167.5 85.1
August 459.9 310.4 149.5 48.2
September 307.1 914.2 -607.1 -66.4
Quarter 1 1131.3 1421.4 -290.1 -20.4

11
Finally, the direct tax collection on account of withholding taxes
(WHT) has increased by 6.5% during the 1st quarter of CFY (Table
5). Simultaneously, the contributing of WHT in gross income tax
Table 5: Monthly Data on WHT: A Comparison of
FY 03-04 & FY 02-03 Collection
(Rs. Million)
Collection Heads FY: 03-04 FY: 02-03
Difference
Absolute Percent
Contracts
July 1270.7 1079.3 191.4 17.7
August 1438.5 1585.5 -147.0 -9.3
September 1878.3 1597.7 280.6 17.6
Q1 4587.5 4262.5 325.0 7.6
Securities
July 433.9 197.5 236.4 119.7
August 656.3 500.1 156.2 31.2
September 213.6 275.7 -62.1 -22.5
Q1 1303.8 973.3 330.5 34.0
Imports
July 2078.7 1823.6 255.1 14.0
August 1862.7 1742.6 120.2 6.9
September 1866.8 1742.6 124.2 7.1
Q1 5808.2 5308.7 499.5 9.4
Salary
July 418.1 552.0 -133.9 -24.3
August 778.7 616.0 162.7 26.4
September 808.0 789.8 18.2 2.3
Q1 2004.8 1957.8 47.0 2.4
Interest
July 274.9 347.2 -72.3 -20.8
August 427.2 636.9 -209.7 -32.9
September 336.2 462.5 -126.3 -27.3
Q1 1038.3 1446.6 -408.3 -28.2
Sub-Total (Five Items) 14742.6 13948.9 793.7 5.7
Share in total WHT (%) 76.7 77.2
Other WHT 4486.1 4111.7 374.4 9.1
Total WHT 19228.7 18060.6 1168.1 6.5
collection has jumped to 75% as against 67% during the
corresponding period of last year. During the months of July and
August, the growth in WHT was 11.8% and 80.6%, respectively,
that declined in September 2003 by 26%. While the share of five-
major withholding taxes, including contracts, securities, imports,
salary and interest has declined from 77.2% to 76.7%, the
contribution of imports (30.2%) remains at the top of the list,
12
followed by contracts (23.9%) and salary (10.4%). While the
increase in WHT on imports by 9.4% has been driven by the
increase in total imports by 4%, the 9% growth in WHT on exports
is due to 11% increase in the volume of exports. The collection from
securities has increased by 34%; mainly due to rate stabilization and
better monitoring and 7.6% increase in contracts is because of the
overall improvement in economic conditions.
Sales Tax: The gross and net sales tax collection has declined by
3.6% and 5%, respectively during the 1st quarter of CFY. In terms of
value, the gross and net collection stood at Rs. 54.6 billion and Rs.
41.6 billion, respectively and refunds amount to Rs. 13 billion.
While the import related net sales tax receipts increased from Rs.
25.6 billion during Q1:02-03 to Rs. 27.3 billion in Q1:03-04,
showing an increase of 6.5%, the net domestic collection fell from
Rs. 18.2 billion to Rs. 14.3 billion, presenting a negative growth of
21.2%. Let it be added that this decline may not be viewed as slow
down in domestic demand rather a major portion of this reduction
has been due to readjustment of advance payment of sales tax.
Domestic Sales Tax Collection: Around 62% of the collection of
sales tax (domestic) has been realized from ten major revenue
spinners during the first quarter of CFY (Table 6). A comparison of
the current quarter data with the first quarter figures of PFY indicate
that of ten major revenue spinners, POL products, natural gas,
cigarettes and cotton yarn have contributed positively to GST
collection. On the other hand, a major shortfall has been registered
in GST revenue from services (telephone/ fax etc) and electrical
energy mainly due to readjustment of advance payments. While the
collection on services was higher in July by 32.2%, it fell drastically
in the subsequent two months. Similarly, the collection on account
of electricity consumption was abysmally low in July and August,
but it increased by more than 100% in September to register an
overall decline of 50% for the 1st quarter. The decline in sugar has
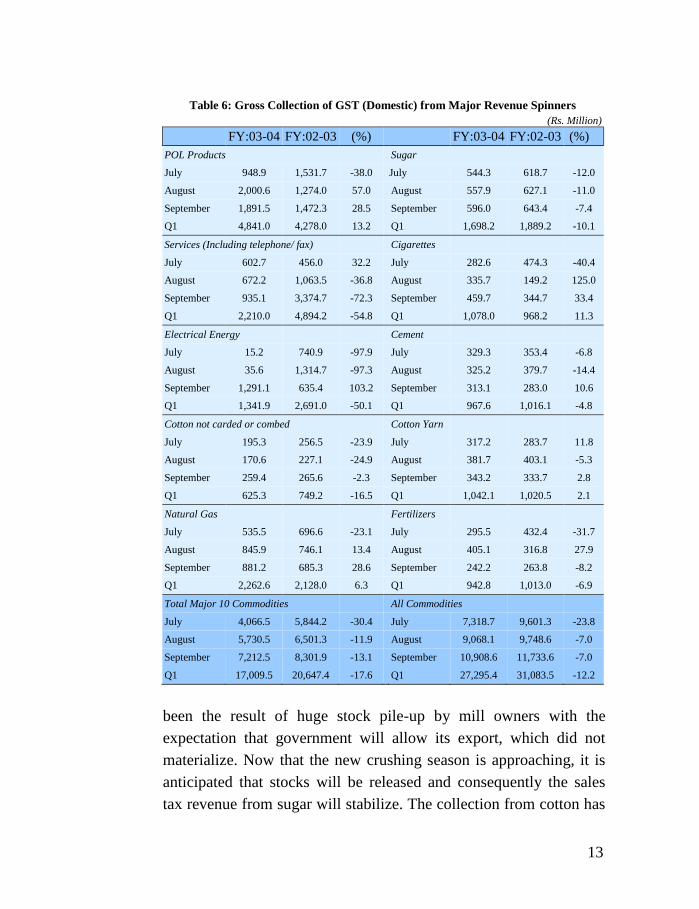
13
Table 6: Gross Collection of GST (Domestic) from Major Revenue Spinners
(Rs. Million)
FY:03-04 FY:02-03 (%) FY:03-04 FY:02-03 (%)
POL Products Sugar
July 948.9 1,531.7 -38.0 July 544.3 618.7 -12.0
August 2,000.6 1,274.0 57.0 August 557.9 627.1 -11.0
September 1,891.5 1,472.3 28.5 September 596.0 643.4 -7.4
Q1 4,841.0 4,278.0 13.2 Q1 1,698.2 1,889.2 -10.1
Services (Including telephone/ fax) Cigarettes
July 602.7 456.0 32.2 July 282.6 474.3 -40.4
August 672.2 1,063.5 -36.8 August 335.7 149.2 125.0
September 935.1 3,374.7 -72.3 September 459.7 344.7 33.4
Q1 2,210.0 4,894.2 -54.8 Q1 1,078.0 968.2 11.3
Electrical Energy Cement
July 15.2 740.9 -97.9 July 329.3 353.4 -6.8
August 35.6 1,314.7 -97.3 August 325.2 379.7 -14.4
September 1,291.1 635.4 103.2 September 313.1 283.0 10.6
Q1 1,341.9 2,691.0 -50.1 Q1 967.6 1,016.1 -4.8
Cotton not carded or combed Cotton Yarn
July 195.3 256.5 -23.9 July 317.2 283.7 11.8
August 170.6 227.1 -24.9 August 381.7 403.1 -5.3
September 259.4 265.6 -2.3 September 343.2 333.7 2.8
Q1 625.3 749.2 -16.5 Q1 1,042.1 1,020.5 2.1
Natural Gas Fertilizers
July 535.5 696.6 -23.1 July 295.5 432.4 -31.7
August 845.9 746.1 13.4 August 405.1 316.8 27.9
September 881.2 685.3 28.6 September 242.2 263.8 -8.2
Q1 2,262.6 2,128.0 6.3 Q1 942.8 1,013.0 -6.9
Total Major 10 Commodities All Commodities
July 4,066.5 5,844.2 -30.4 July 7,318.7 9,601.3 -23.8
August 5,730.5 6,501.3 -11.9 August 9,068.1 9,748.6 -7.0
September 7,212.5 8,301.9 -13.1 September 10,908.6 11,733.6 -7.0
Q1 17,009.5 20,647.4 -17.6 Q1 27,295.4 31,083.5 -12.2
been the result of huge stock pile-up by mill owners with the
expectation that government will allow its export, which did not
materialize. Now that the new crushing season is approaching, it is
anticipated that stocks will be released and consequently the sales
tax revenue from sugar will stabilize. The collection from cotton has

14
suffered because of the weather condition that resulted into late
sowing that also delayed its harvesting. Now that the crop is facing
the danger of pest attack, it may also affect sales tax collection.
However, going by the assessment of MINFAL that anticipates no
major shortfall in production, an improvement in collection could be
anticipated in coming months. Regarding cement, despite an increase
in production by 15.5%, the sales tax collection witnessed a decline
in July and August only to improve in September. The export of
cement, which incidentally is zero-rated, and regulated domestic
supply by cement cartel are the possible reasons for this erratic
behavior. Finally, the decline in fertilizer production during July-
August 2003 has been instrumental in the reduction of sales tax from
this source.
Risk-Based Audit in Sales Tax: The role of audit is extremely
important in order to keep the system transparent. For CBR it is even
more important as it serves as an effective tool to curb tax evasion.
The first quarter data of sales tax audit presented in Table 7 reveals
that the number of audits conducted and amount detected has
considerably declined during the CFY over the corresponding period
of PFY. However, the overall recovery of the detected amount has
improved considerably.
The historical data indicate that 16001 cases of audit were initiated
during FY 2002-03. Since a vast majority of the audit reports
showed NIL detection, it raised pertinent concerns about validity of
the number of audits completed. Similarly, since CBR has adopted a
new Audit Report Review procedure whereby each and every report
must be sent to CBR for final review and only 4600 reports were
received during the PFY, it is assumed that only 29% of the reported
audits were actually conducted. Viewed within this perspective, the
performance of audit during the 1st quarter of CFY is not that
gloomy after all. However, further streamlining of data is required to
draw meaningful conclusions.

15
Table 7: Sales Tax Audits: A Comparison (Rs. Million)
FY:03-04 FY:02-03 Growth
(%)
July
No. of Audits conducted 655 1615 -59.4
Amount Detected 545.9 393.9 38.5
Amount recovered 43.6 33.7 29.4
% Recovery 8.0 8.6
August
No. of Audits conducted 602 1984 -69.7
Amount Detected 636.7 579.2 9.9
Amount recovered 47.8 38.5 24.2
% Recovery 7.5 6.6
September
No. of Audits conducted 503 1713 70.6
Amount Detected 463.6 2381.1 -80.5
Amount recovered 91.1 46.4 96.3
% Recovery 19.7 1.9
Jul-September
No. of Audits conducted 1760 5312 -66.9
Amount Detected 1646.2 3354.2 -50.9
Amount recovered 182.5 118.6 53.9
% Recovery 11.1 3.5
Customs Duties: The revenue collection on account of customs
duties is mainly driven by fluctuations in its base, which is rupee
value of dutiable imports. The upsurge in imports observed during
the PFY has continued during the 1st quarter of CFY – a reflection of
a continuous improvement in domestic demand. Over 15% growth
in dutiable imports has been fully translated in the revenue receipts
of (gross) customs duties that also increased by about 16% during
the first quarter. In terms of value, the gross revenue collection
during Q1 03-04 has been Rs. 22 billion as opposed to Rs. 19 billion
in Q1 02-03. Similarly, the net collection increased to Rs. 18 billion
from Rs. 13.3 billion. The difference between gross and net receipts
is refund/ rebate payments that declined by 27.1% largely due to the
revision of the duty drawback rates.3
3 Since at the announcement of the Budget 03-04 customs duty was revised on a number of items, some of which were smuggling prone in nature, the impact of this policy change on customs duty
collection was determined by separating the tariff lines influenced by this change. It is interesting to
find that the impact of duty revision was felt only on 5% of total imports or 7% of dutiable imports.
However, nearly 11% of CD revenue was affected by this change. Source Customs House data only.
16
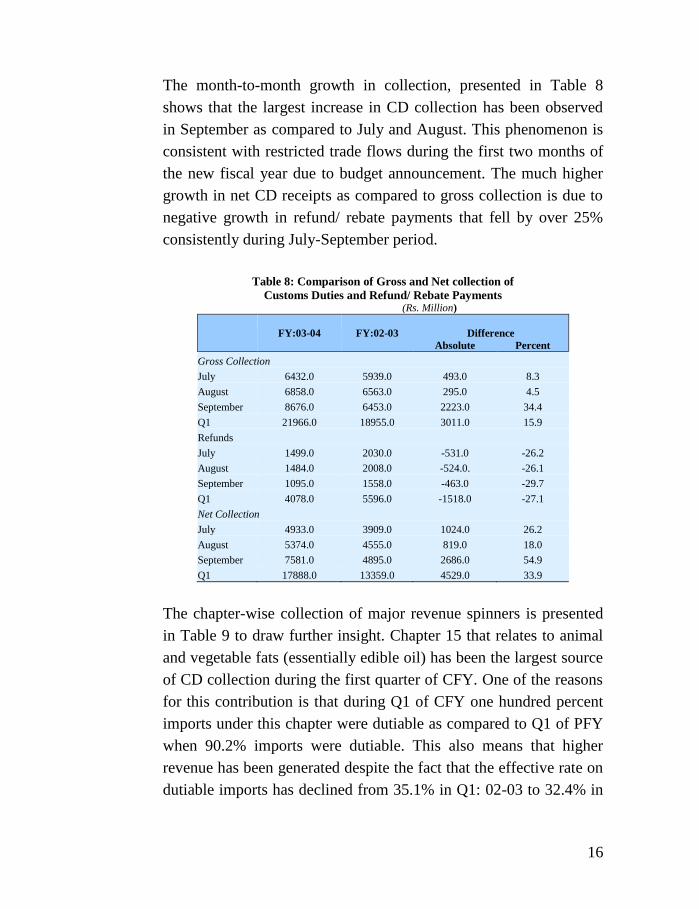
The month-to-month growth in collection, presented in Table 8
shows that the largest increase in CD collection has been observed
in September as compared to July and August. This phenomenon is
consistent with restricted trade flows during the first two months of
the new fiscal year due to budget announcement. The much higher
growth in net CD receipts as compared to gross collection is due to
negative growth in refund/ rebate payments that fell by over 25%
consistently during July-September period.
Table 8: Comparison of Gross and Net collection of
Customs Duties and Refund/ Rebate Payments (Rs. Million)
FY:03-04 FY:02-03
Difference
Absolute Percent
Gross Collection
July 6432.0 5939.0 493.0 8.3
August 6858.0 6563.0 295.0 4.5
September 8676.0 6453.0 2223.0 34.4
Q1 21966.0 18955.0 3011.0 15.9
Refunds
July 1499.0 2030.0 -531.0 -26.2
August 1484.0 2008.0 -524.0. -26.1
September 1095.0 1558.0 -463.0 -29.7
Q1 4078.0 5596.0 -1518.0 -27.1
Net Collection
July 4933.0 3909.0 1024.0 26.2
August 5374.0 4555.0 819.0 18.0
September 7581.0 4895.0 2686.0 54.9
Q1 17888.0 13359.0 4529.0 33.9
The chapter-wise collection of major revenue spinners is presented
in Table 9 to draw further insight. Chapter 15 that relates to animal
and vegetable fats (essentially edible oil) has been the largest source
of CD collection during the first quarter of CFY. One of the reasons
for this contribution is that during Q1 of CFY one hundred percent
imports under this chapter were dutiable as compared to Q1 of PFY
when 90.2% imports were dutiable. This also means that higher
revenue has been generated despite the fact that the effective rate on
dutiable imports has declined from 35.1% in Q1: 02-03 to 32.4% in

17
Q1: 03-04.4 The second highest source of CD collection was
vehicles (Chapter 87) where 92% of total imports were dutiable. In
this case the growth in dutiable imports was 33% and the growth in
CD revenue was 47%. A similar pattern of growth has been
observed for other commodity groups as well, particularly for
machinery (Chapter 84), Chemicals (Chapter 29) and Iron & Steel
(Chapter 72). Some of the commodities that registered negative
growth in collection as compared to Q1:02-03 but still contributing
significantly towards overall revenue were: Coffee and tea (Chapter
9), POL products (Chapter 27) and dyes and paints (Chapter 32).
While in the case of coffee and tea the effective rate on dutiable
imports has fallen from 23.5% to 18.9% during Q1: 02-03 and Q1:
03-04, it remained stable for the other two commodity groups.
Table 9: Chapter-Wise Growth of Major Revenue Spinners
and Effective Rates
PCT
Ch.
Tariff Description
July-September Growth (%) Effective Rates
with Dutiable Imports
Import Value Dutiable
Imports
Customs
Duties
Jul-Sep
03-04
Jul-Sep
02-03
15 Animal or vegetable fats 18.2 31.1 20.6 32.4 35.1
87 Vehicles 33.3 33.0 47.1 35.8 32.4
84 Machinery -5.6 14.3 14.5 10.3 10.3
39 Plastic Resins 19.8 21.0 21.4 18.6 18.6
29 Chemicals 26.4 17.4 19.7 9.8 9.6
85 Electrical Machinery 39.8 27.2 29.7 13.5 13.3
27 POL Products 5.6 -19.1 -18.9 10.2 10.2
72 Iron & Steel 51.9 46.8 44.3 16.0 16.3
9 Coffee and Tea etc. 4.1 -4.1 -22.8 18.9 23.5
38 Misc. Chemical Products 18.8 18.1 6.7 11.1 12.3
48 Paper and Paperboard 19.9 20.6 16.1 18.0 18.7
32 Dyes, paints -3.3 -4.3 -4.3 18.4 18.4
40 Rubber products 25.3 26.5 17.7 14.0 15.0
54 Man made filaments 29.8 26.9 14.9 16.5 18.3
30 Pharmaceutical Products 13.7 13.8 11.6 10.2 10.4
Sub-total 16.6 15.9 18.3 17.0 16.7
Others -10.7 13.2 5.3 12.1 13.0
Grand total 4.8 15.3 16.1 16.0 15.9
4 These figures are based on data from Custom House, Karachi and Dry Ports within the country. These data represents nearly 96% of trade flows.
18
Central Excise: Even though the collection of central excise duties
declined by 6.4% during Q1:03-04, still the reduced amount was
sufficient to meet the target set for the 1st quarter. The net collection
declined from Rs. 9.6 billion in Q1:02-03 to Rs. 9 billion in Q1:03-
04. The main reasons for this decline are the continuously shrinking
base of CED since the last few years in view of the extension in the
GST base. This policy option was exercised in the present budget as
well when CED was withdrawn from paper and paperboard and
wires and cables. Two additional policy decision having far reaching
implications for CED collection included reduction of duty on
cement by 25%, and the adoption of new rule of levying of CED on
natural gas, a shift from volume to heat content basis as mentioned
above. The combined negative impact of all these budgetary
measures is estimated to be around Rs. 5 billion during FY 03-04.
The month-to-month progress of CED collection indicates that the
revenue from this source declined appreciably in July. This sharp
fall was although partially arrested in August, but the growth in
revenue remained negative as compared to August 2002. However,
the collection improved significantly in September mainly due to
25.5% increase in CED from cigarettes and resultantly the overall
decline for the quarter remained gentle at 7%.
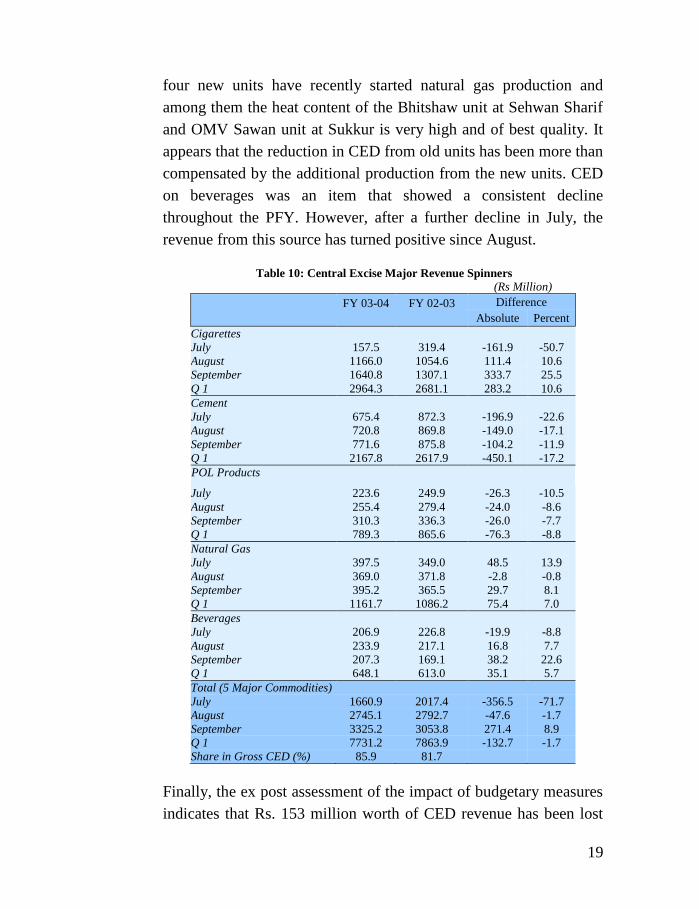
The performance of CED collection on commodity basis is given in
Table 10. The data shows that for cement and POL products the
CED collection, as anticipated, declined continuously during the
first three months.5 The overall reduction in the case of cement was
Rs. 450 million, and for POL products Rs. 76.3 million. However,
contrary to initial expectations, CED revenue increased from Natural
Gas. The information collected through field offices has confirmed
that a significant increase in collection has been registered at the
Hyderabad Collectorate. On further probing it was observed that
5 It may be remembered that most of the POL Products were shifted to CD net during FY 02-03.
19
four new units have recently started natural gas production and
among them the heat content of the Bhitshaw unit at Sehwan Sharif
and OMV Sawan unit at Sukkur is very high and of best quality. It
appears that the reduction in CED from old units has been more than
compensated by the additional production from the new units. CED
on beverages was an item that showed a consistent decline
throughout the PFY. However, after a further decline in July, the
revenue from this source has turned positive since August.
Table 10: Central Excise Major Revenue Spinners
(Rs Million)
FY 03-04 FY 02-03 Difference
Absolute Percent
Cigarettes
July 157.5 319.4 -161.9 -50.7
August 1166.0 1054.6 111.4 10.6
September 1640.8 1307.1 333.7 25.5
Q 1 2964.3 2681.1 283.2 10.6
Cement
July 675.4 872.3 -196.9 -22.6
August 720.8 869.8 -149.0 -17.1
September 771.6 875.8 -104.2 -11.9
Q 1 2167.8 2617.9 -450.1 -17.2
POL Products
July 223.6 249.9 -26.3 -10.5
August 255.4 279.4 -24.0 -8.6
September 310.3 336.3 -26.0 -7.7
Q 1 789.3 865.6 -76.3 -8.8
Natural Gas
July 397.5 349.0 48.5 13.9
August 369.0 371.8 -2.8 -0.8
September 395.2 365.5 29.7 8.1
Q 1 1161.7 1086.2 75.4 7.0
Beverages
July 206.9 226.8 -19.9 -8.8
August 233.9 217.1 16.8 7.7
September 207.3 169.1 38.2 22.6
Q 1 648.1 613.0 35.1 5.7
Total (5 Major Commodities)
July 1660.9 2017.4 -356.5 -71.7
August 2745.1 2792.7 -47.6 -1.7
September 3325.2 3053.8 271.4 8.9
Q 1 7731.2 7863.9 -132.7 -1.7
Share in Gross CED (%) 85.9 81.7
Finally, the ex post assessment of the impact of budgetary measures
indicates that Rs. 153 million worth of CED revenue has been lost

20
on account of abolishing of duty on cables and wires and Rs. 102
million have been lost on account of paper and paperboard.6 While
the revenue loss in terms of cement has been Rs. 450.3 million, there
is a revenue gain of Rs. 75.5 million on account of natural gas. Thus,
the overall net impact of four budgetary measures has been around
Rs. 630 million during the 1st quarter of CFY.
Concluding Observations
The CBR revenue performance has been encouraging during the 1st
quarter of CFY. More important is the fact that the performance is
broad-based. The collection of three federal taxes, i.e., direct taxes,
customs duties, and central excise duties has exceeded their
respective 1st quarter targets. The sales tax collection has even
though lagged behind its target, but it has been due to technical
correction only, as there is no evidence of declining domestic
demand or slowdown in sales. This assertion is further supported by
the double-digit growth in imports of capital goods and raw material
for capital goods. The expansion in customs duty base has been
instrumental not only in raising the revenue from this source, it has
also contributed significantly towards the overall revenue target and
its achievement during the first quarter.
It has also been demonstrated that direct tax has continued its strong
performance for the second quarter running. The most important
development has been the high level of compliance with income tax
returns, which if broad based, may turn out to be an indication of
success of the universal self-assessment in income tax. The strong
growth of individual taxes also indicates that various tax bases are
growing as well, which in turn is a reflection of the health of the
economy. This phenomenon if continued will augur well for the
long run objectives of attaining respectable growth and stability of
the economy with reduced levels of unemployment and poverty.
6 This amount was collected during Q1 of FY 02-03. The loss of an exact amount assumes that the
production value has remained the same during the period under consideration.

21
II
Industry profile:
Cement Industry in Pakistan7
Introduction
Cement is one of the essential industries of a country. Besides
playing key role in the development of physical infrastructure and
generating economic activity in a number of downstream industries
especially construction, it also contributes significantly towards
government receipts. The 24 production plants currently operating in
the country have a total installed capacity of 17.7 million tons,
which is more than sufficient to meet the domestic demand. Of these
operational plants, 20 units are established within the private sector.
Twenty-one units are listed with the Karachi Stock Exchange.
Historical Profile of Cement Industry
The cement industry in Pakistan has grown gradually with the
passage of time. At the time of independence there were only four
units with total production capacity of nearly half a million tons per
annum. By 1972 the number of cement plants increased to 14 and
the production capacity also increased to 2.5 million tons. Both
public and private sectors took initiative to establish new plants. As
was the case for other industries, the cement industry was also
nationalized in 1972 and the State Cement Corporation of Pakistan
(SCCP) was established and given the responsibility to manage the
production of cement in the country. Considering the higher cement
demand as compared to supply, cement import was also allowed in
FY 76-77 that continued until FY 94-95. With a change in policy of
state control over industrial units, the state owned cement plants
were also put-up for privatization along with other industries. The
private sector was allowed to invest in the cement manufacturing.
7 This study has been prepared by Dr. Ather Maqsood Ahmed, Member and Mr. Naeem Ahmed, Research Officer, Fiscal Research Wing, CBR.

22
Consequently, the role of SCCP as market leader vanished gradually
and currently it owns only four plants, of which two have been
closed down on efficiency and profitability grounds.
In view of the higher demand during the period of de-regulation and
liberalization, a number of new units were set up and many others
invested heavily to increase their existing production capacity. As a
result, the production capacity has reached 17.7 million tons per
annum during 2003. Surprisingly the recent increase in the installed
capacity has outpaced the increase in demand with the result that the
cement industry is operating with an idle capacity of almost 50%.
Production Process of Clinker/ Cement
The production of clinker/ cement is highly energy-intensive.8 It
involves chemical combination of various inputs that are abundantly
and cheaply available in Pakistan and therefore the country enjoys
comparative advantage in its production. The chemical analysis of
different materials used in its production process is presented in
Table 1. However, it is important to mention that the desired
physical and chemical properties of cement can be obtained by
changing the percentages of these basic chemical components.
Table 1: Chemical Analysis of Different Inputs in Cement Production
Parameters Lime
Stone
Slate Laterite Kiln
Feed
Clinker Cement
Silicon Dioxide (SiO2) 4.885 69.74 55.00 13.8 22.49 21.9
Aluminum Oxide (AI2O3) 1.623 18.14 12.50 3.92 5.71 5.50
Iron Oxide (Fe2O3) 1.580 6.12 35.54 2.45 3.52 3.40
Calcium Oxide (CaO) 48.35 0.80 0.12 42.54 64.86 63.90
Magnesium Oxide (MgO) 0.85 0.25 0.66 0.45 0.89 0.87
Sulphur Trioxide (SO3) 0.001 0.02 0.17 0.001 0.20 2.50
Sodium Oxide (Na2O) 0.11 0.88 0.12 0.22 0.23 0.14
Potassium Oxide (K2O) 0.24 1.10 0.35 0.78 0.78 0.65
8 The energy use depends on whether wet, semi-dry or dry process is used in the production of cement.
Since the wet process consumes more energy as compared to the dry process, its share in total installed
capacity has declined drastically from over 90% in 1960s to 12% in 2002-03. See ‘Cement Industry in Pakistan’ prepared by the Expert Advisory Cell, Islamabad (2002-3).

23
The several stages of the cement production process involve
quarrying and crushing, raw grinding, blending, preheating, feeding
to kiln, clinker storage, cement/ clinker grinding, storage and
packing. The graphical exposition of these processes is as follows.9
Quarry and Crushing
1.Lime Stone
2. Slate/ Shale/ Clay
3. Laterite (Iron Ore)
Reducing Quarry Material from IM3 to 30mm
↓
Raw Grinding
1. Ball Mill
2. Raw Press
30 mm is reduced to 170 micron
↓
Blending to Clinker
1. Blending to get uniform composition
2. Feeding to the Kiln through Pre-heated
3. Passing through kiln at 1450 degree C to Change into Clinker
↓
Clinker Grinding
1. Cement Mill
2. Cement Press
95% Clinker and 5% Gypsum is Grinded
↓
Storage, Packaging & Dispatch
Cost of Production of Cement
The production cost of cement (including depreciation but excluding
government taxes) is estimated to be around Rs. 1951 per ton,
provided the capacity utilization rate is 100%.10 Nearly 76% of the
variable cost or 54% of total cost is consumed by energy (fuel and
9 Cement can be produced by utilizing dry, semi-dry or dry process. For each of these processes, heat
consumption varies significantly.
10 See Expert Advisory Cell (2002-03). An earlier study estimated this cost to be around Rs. 1641 per
ton excluding depreciation and government taxes. See ‘Input Cost and Corporate Tax Structure: An
Analysis of Trends in SAARC Region’ – a joint study by the Institute of Cost and Management Accountants of Pakistan and the Federation of Pakistan Chamber of Commerce and Industry (2001).

24
power), 14% of total cost by administrative and financial expenses,
12% by raw material, 9% by depreciation, and 3% by wages and
salaries. With the addition of taxes and rebates to stockists, the cost
of production during FY 02-03 varied between Rs. 3800 and Rs.
4300 per ton for different cement manufacturers depending upon the
location of their plant in the country. Since the sale price per ton was
invariably higher than the cost of production, including taxes,
therefore cement manufacturers were generally reaping 3% to 10%
profit on each ton of cement sold in the market [EAC (2002-03)].
In an effort to further reduce the cost of production, most of the
cement plants operating on furnace oil have started to switch to coal
fired plants as the price of furnace oil has escalated rapidly in recent
years. Presently, out of 24 units, 5 have fully converted to coal firing
plants. These include D.G. Khan, Pioneer, Gharibwal, Bestway, and
Dandot. At the same time the degree of conversion of other plants is
as follows: Pakland 95%, Dadabhoy 90%, Zealpak 80%, Maple Leaf
70%, FECTO 50%, Charat 45%, Nizampur and Askari 40%, Kohat
30%, and Attock 25%. The Essa cement plant has completed 70% of
conversion work of kiln-II, Saadi has completed 90% of work on
line-1 and Lucky has converted 100% and 50% of work on its lines
B and A, respectively.11 This detailed description indicates that the
cement manufacturers are consciously striving to reduce the
comparative cost of production through cheaper utilization of inputs,
especially heating fuel even though this transition is not as smooth
in terms of availability of coal, its price, and environmental effects.
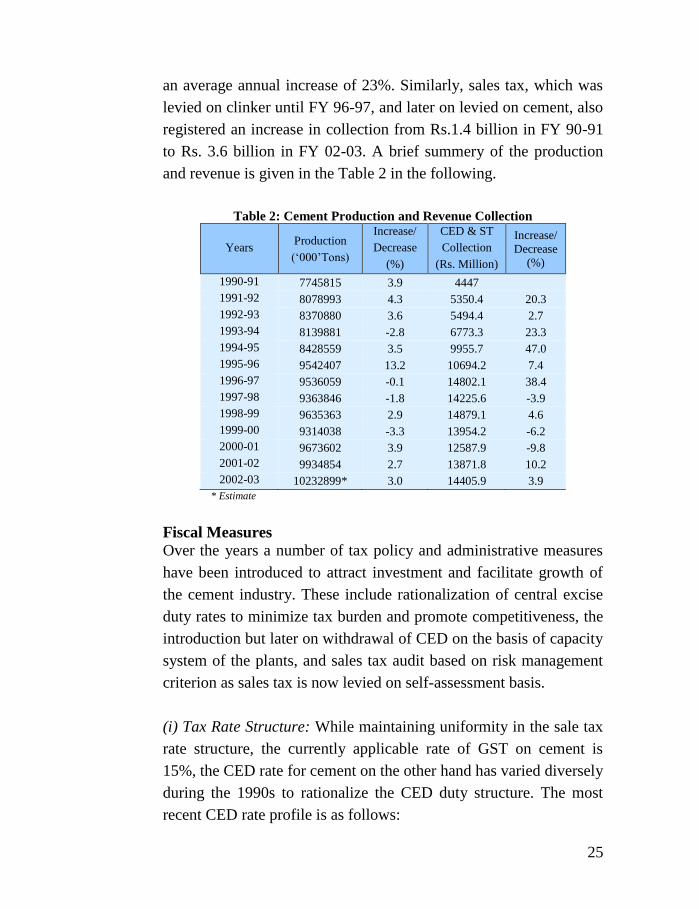
Production and Revenue
The historical data confirms that with a steady increase in cement
production, government revenue has also increased. For example,
the collection on account of central excise duties (CED) has jumped
from Rs.15 million in FY 60-61 to Rs. 10,812 million in FY 02-03 –
11 See the Experts Advisory Cell’s prepared document ‘Utilization of Coal in Cement Industry’ for further details.
25
an average annual increase of 23%. Similarly, sales tax, which was
levied on clinker until FY 96-97, and later on levied on cement, also
registered an increase in collection from Rs.1.4 billion in FY 90-91
to Rs. 3.6 billion in FY 02-03. A brief summery of the production
and revenue is given in the Table 2 in the following.
Table 2: Cement Production and Revenue Collection
Years Production
(‘000’Tons)
Increase/
Decrease
(%)
CED & ST
Collection
(Rs. Million)
Increase/
Decrease
(%)
1990-91 7745815 3.9 4447
1991-92 8078993 4.3 5350.4 20.3
1992-93 8370880 3.6 5494.4 2.7
1993-94 8139881 -2.8 6773.3 23.3
1994-95 8428559 3.5 9955.7 47.0
1995-96 9542407 13.2 10694.2 7.4
1996-97 9536059 -0.1 14802.1 38.4
1997-98 9363846 -1.8 14225.6 -3.9
1998-99 9635363 2.9 14879.1 4.6
1999-00 9314038 -3.3 13954.2 -6.2
2000-01 9673602 3.9 12587.9 -9.8
2001-02 9934854 2.7 13871.8 10.2
2002-03 10232899* 3.0 14405.9 3.9
* Estimate
Fiscal Measures
Over the years a number of tax policy and administrative measures
have been introduced to attract investment and facilitate growth of
the cement industry. These include rationalization of central excise
duty rates to minimize tax burden and promote competitiveness, the
introduction but later on withdrawal of CED on the basis of capacity
system of the plants, and sales tax audit based on risk management
criterion as sales tax is now levied on self-assessment basis.
(i) Tax Rate Structure: While maintaining uniformity in the sale tax
rate structure, the currently applicable rate of GST on cement is
15%, the CED rate for cement on the other hand has varied diversely
during the 1990s to rationalize the CED duty structure. The most
recent CED rate profile is as follows:
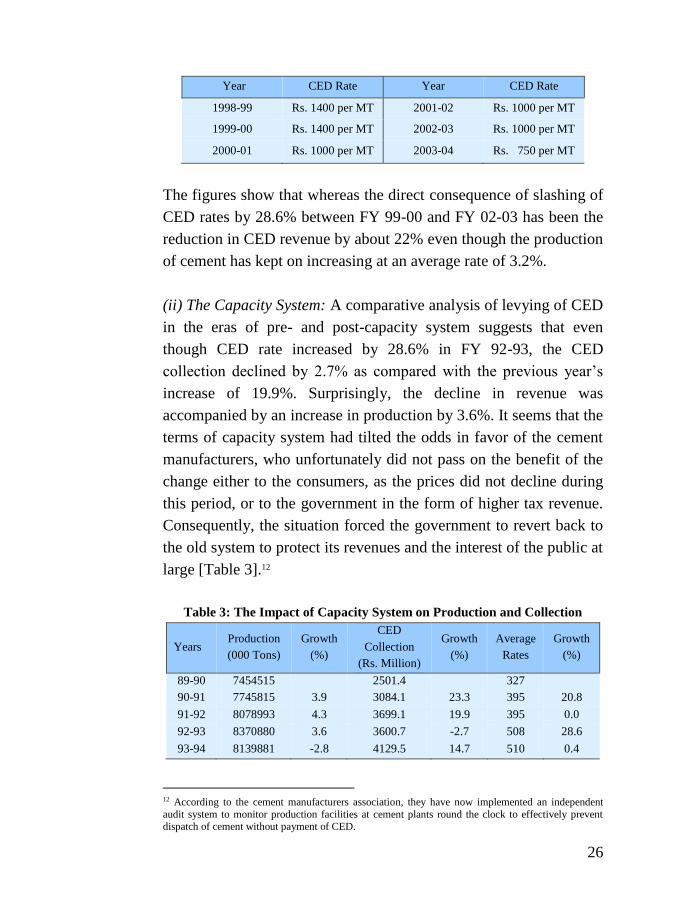
26
Year CED Rate Year CED Rate
1998-99 Rs. 1400 per MT 2001-02 Rs. 1000 per MT
1999-00 Rs. 1400 per MT 2002-03 Rs. 1000 per MT
2000-01 Rs. 1000 per MT 2003-04 Rs. 750 per MT
The figures show that whereas the direct consequence of slashing of
CED rates by 28.6% between FY 99-00 and FY 02-03 has been the
reduction in CED revenue by about 22% even though the production
of cement has kept on increasing at an average rate of 3.2%.
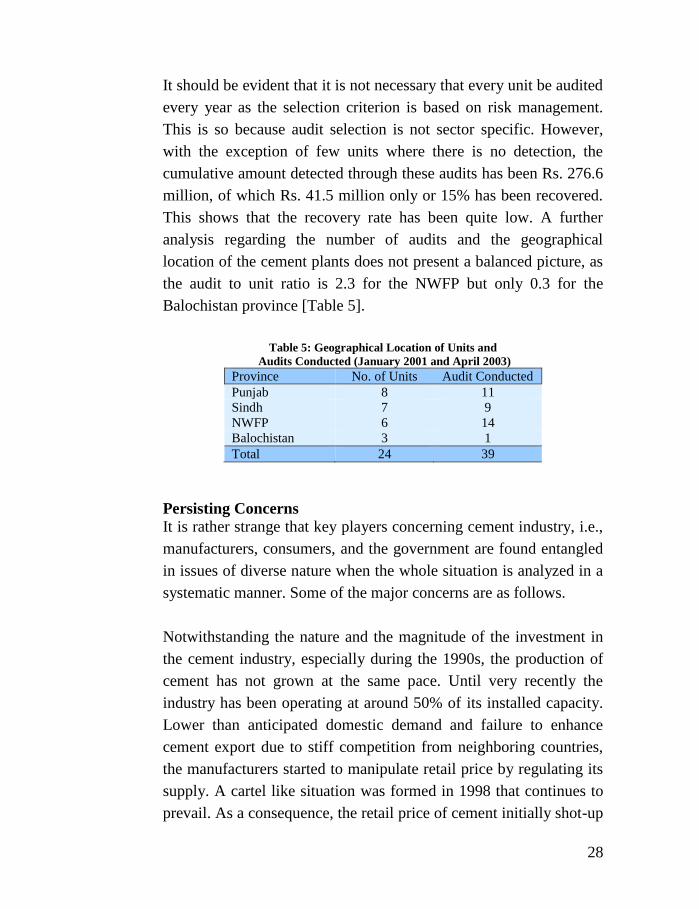
(ii) The Capacity System: A comparative analysis of levying of CED
in the eras of pre- and post-capacity system suggests that even
though CED rate increased by 28.6% in FY 92-93, the CED
collection declined by 2.7% as compared with the previous year’s
increase of 19.9%. Surprisingly, the decline in revenue was
accompanied by an increase in production by 3.6%. It seems that the
terms of capacity system had tilted the odds in favor of the cement
manufacturers, who unfortunately did not pass on the benefit of the
change either to the consumers, as the prices did not decline during
this period, or to the government in the form of higher tax revenue.
Consequently, the situation forced the government to revert back to
the old system to protect its revenues and the interest of the public at
large [Table 3].12
Table 3: The Impact of Capacity System on Production and Collection
Years Production
(000 Tons)
Growth
(%)
CED
Collection
(Rs. Million)
Growth
(%)
Average
Rates
Growth
(%)
89-90 7454515 2501.4 327
90-91 7745815 3.9 3084.1 23.3 395 20.8
91-92 8078993 4.3 3699.1 19.9 395 0.0
92-93 8370880 3.6 3600.7 -2.7 508 28.6
93-94 8139881 -2.8 4129.5 14.7 510 0.4
12 According to the cement manufacturers association, they have now implemented an independent
audit system to monitor production facilities at cement plants round the clock to effectively prevent
dispatch of cement without payment of CED.

27
(iii) Sales Tax Audit: With the introduction of GST, an elaborate
system of audit ensures compliance of sales tax. The routine audit of
any registered person/ unit during the financial year is conducted
under section 25 of the Sales Tax Act, 1990. However, the
investigative audit under section 38 could be conducted in any
number of times during the financial year if deemed necessary.
Within this setup, the historical evidence of sales tax audit reveals
that during three recent years, i.e., between 2001 and 2003, 35 audits
of cement unit were conducted. Of them, 11 audits were carried out
in 2001, 18 in 2002, and 6 in 2003. The unit-wise details of the audit
are given in Table 4.
Table 4: Details of Sales Tax Audit of Cement Plants (Rs. million)
UNIT NAME Year # of audits Detection Recovery
Maple Leaf Cement Factory Ltd Phase II,
Zeal Pak Cement Factory Ltd.
Thatta Cement Company Ltd. Pakistan Slag Cement Ind. (Pvt) Ltd.
Javedan Cement
Charat Cement Co. Ltd
Lucky Cement Ltd.
Army Welfare Trust Plant at Nizampur
2001
2
2
1 1
2
1
1
1
18.75
2.25
0.00 0.00
4.90
0.00
1.75
13.96
0.00
0.27
0.00 0.00
0.00
0.00
0.00
0.00
Total 11 41.56 0.27
Maple Leaf Cement Factory Pioneer Cement Ltd.
Attock Cement Pakistan Ltd.
Dadabhoy Cement Industries Ltd. Lucky Cement Ltd.
Kohat Cement Co Ltd
Saadi Cement Limited Charat Cement Co Ltd
Army Welfare Trust at Nizampur
Gharibwal Cement Ltd.
Dandot Cement Ltd,
Bestway Cement Limited
Fecto Cement Limited
2002
1 1
1
1 2
3
2 2
1
1
1
1
1
0.79 29.81
1.07
0.00 24.07
9.43
0.94 9.56
7.20
16.99
12.89
18.23
0.00
0.00 0.00
0.58
0.00 9.51
0.00
0.00 0.56
0.00
16.35
11.82
0.00
0.00
Total 18 129.9 38.2
Zeal Pak Cement Factory Ltd.
Pakistan Slag Cement Ind. (Pvt) Ltd.
Mustahkam Cement Ltd. Dandot Cement Ltd.
Gharibwal Cement Ltd.
Fauji Cement Company Ltd.
2003
1
1
1 1
1
1
2.83
53.17
0.08 25.08
23.91
0.00
0.0
0.0
0.0 3.0
0.0
0.0
Total 6 105.1 3.0
28
It should be evident that it is not necessary that every unit be audited
every year as the selection criterion is based on risk management.
This is so because audit selection is not sector specific. However,
with the exception of few units where there is no detection, the
cumulative amount detected through these audits has been Rs. 276.6
million, of which Rs. 41.5 million only or 15% has been recovered.
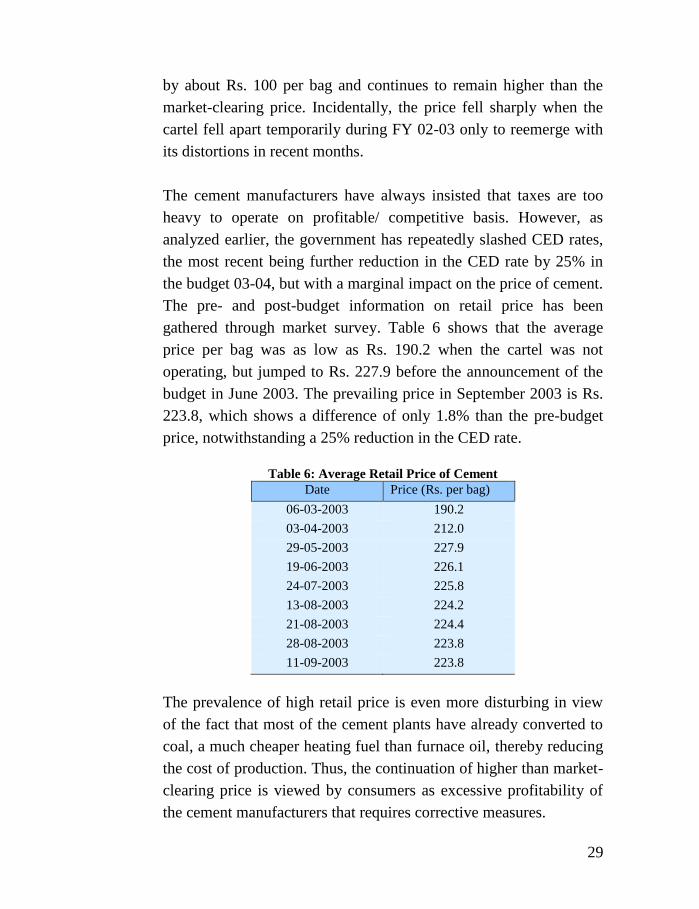
This shows that the recovery rate has been quite low. A further
analysis regarding the number of audits and the geographical
location of the cement plants does not present a balanced picture, as
the audit to unit ratio is 2.3 for the NWFP but only 0.3 for the
Balochistan province [Table 5].
Table 5: Geographical Location of Units and
Audits Conducted (January 2001 and April 2003)
Province No. of Units Audit Conducted
Punjab 8 11
Sindh 7 9
NWFP 6 14
Balochistan 3 1
Total 24 39
Persisting Concerns
It is rather strange that key players concerning cement industry, i.e.,
manufacturers, consumers, and the government are found entangled
in issues of diverse nature when the whole situation is analyzed in a
systematic manner. Some of the major concerns are as follows.
Notwithstanding the nature and the magnitude of the investment in
the cement industry, especially during the 1990s, the production of
cement has not grown at the same pace. Until very recently the
industry has been operating at around 50% of its installed capacity.
Lower than anticipated domestic demand and failure to enhance
cement export due to stiff competition from neighboring countries,
the manufacturers started to manipulate retail price by regulating its
supply. A cartel like situation was formed in 1998 that continues to
prevail. As a consequence, the retail price of cement initially shot-up
29
by about Rs. 100 per bag and continues to remain higher than the
market-clearing price. Incidentally, the price fell sharply when the
cartel fell apart temporarily during FY 02-03 only to reemerge with
its distortions in recent months.
The cement manufacturers have always insisted that taxes are too
heavy to operate on profitable/ competitive basis. However, as
analyzed earlier, the government has repeatedly slashed CED rates,
the most recent being further reduction in the CED rate by 25% in
the budget 03-04, but with a marginal impact on the price of cement.
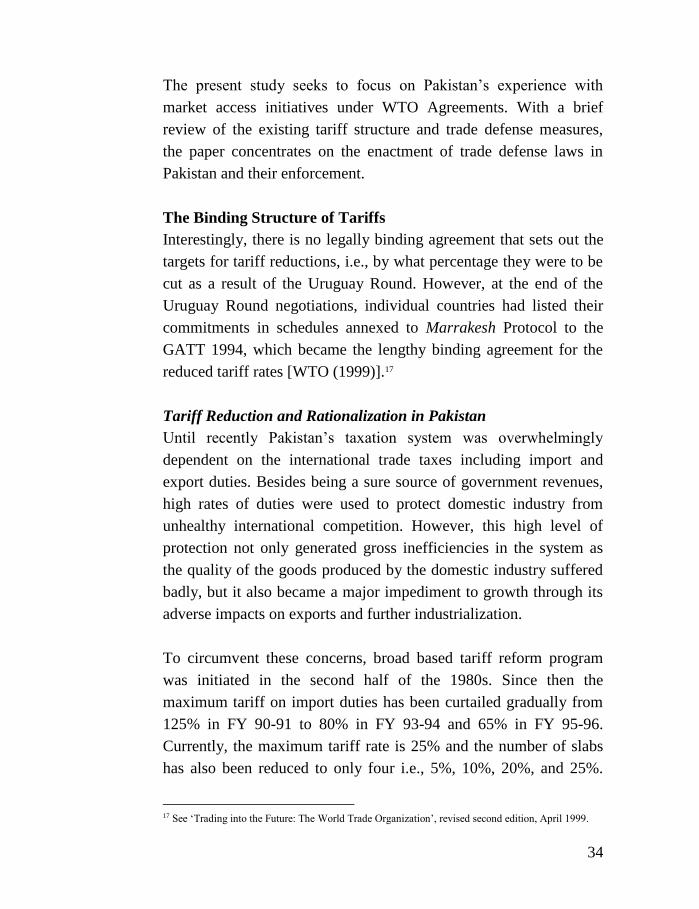
The pre- and post-budget information on retail price has been
gathered through market survey. Table 6 shows that the average
price per bag was as low as Rs. 190.2 when the cartel was not
operating, but jumped to Rs. 227.9 before the announcement of the
budget in June 2003. The prevailing price in September 2003 is Rs.
223.8, which shows a difference of only 1.8% than the pre-budget
price, notwithstanding a 25% reduction in the CED rate.
Table 6: Average Retail Price of Cement
Date Price (Rs. per bag)
06-03-2003 190.2
03-04-2003 212.0
29-05-2003 227.9
19-06-2003 226.1
24-07-2003 225.8
13-08-2003 224.2
21-08-2003 224.4
28-08-2003 223.8
11-09-2003 223.8
The prevalence of high retail price is even more disturbing in view
of the fact that most of the cement plants have already converted to
coal, a much cheaper heating fuel than furnace oil, thereby reducing
the cost of production. Thus, the continuation of higher than market-
clearing price is viewed by consumers as excessive profitability of
the cement manufacturers that requires corrective measures.

30
Even though the Monopoly Control Authority (MCA) in 1998 had
exercised its power to break the collusive arrangement between
cement manufacturers, but it was not a successful attempt, partly
due to weak enforcement of the writ of the law and partly due to
political pressures.13 With the reemergence of the cartel, the MCA
has again issued notices to the manufacturers but to no avail.
Simultaneously, two meetings have been held in August 2003
between the Ministry of Industries and the Cement Manufacturers to
review the possible impact of recent duty reduction. The view of the
Ministry that the manufacturers have not passed on the benefits of
duty reduction to the consumers appears to have been acknowledged
with a promise to lower the prices of cement within a month. Not
only there is a need to keep this promise, but also the whole episode
requires careful monitoring by the relevant authorities.
Concluding Remarks
There are a number of unanswered questions regarding cement
industry in Pakistan and each one of them requires further probing.
The first question pertains to the quality of the feasibility studies and
their approval by the concerned departments before the
establishment of industrial units. One wonders why in the case of
cement manufacturing feasibility studies went so terribly wrong to
create an idle capacity of nearly 50%? Who is responsible for
assessing the current and future demand and its trade flows? Why
industrial units are sanctioned when there is no domestic demand for
the product? Is there lack of coordination at the national and
provincial levels that results into this kind of mismatch?
It is also amazing to see how conveniently the indigenous capability
to build cement plants has been wasted in favor of imported plant
13 The MCA intervened under the Monopolies and Restrictive Trade Practices (Control and Prevention) Ordinance, 1970 and directed cement manufacturers to break their cartel, reverse the
cement price to pre-October 98 level and to remove the restrictions on the utilization of productive
capacity with immediate effect. The manufacturers did not comply with these orders on legal pretexts, even though they were later fined for non-compliance.

31
and machinery, which is not only costly but also requires foreign
exchange. Moreover the idle capacity of the imported equipment is
even more distressing as it creates distortions in the system, which
leads to exploitation.
All across the world it is common to observe that firms have
incentives to acquire market power – the discretionary power to
control prices – either through collusive arrangements or through
erecting artificial barriers. Such practices are defeated through the
application of ‘competition policy’ duly supported by the required
legislation.14 Additionally, the nature of factors, explicit or implicit,
that create impediments in the enforcement of law are carefully
assessed to undertake remedial measures. In this respect, the
question is does MCA have enforcement powers? It is been five
years that the initial judgment was passed by the Authority but the
matter is still lingering.
Besides government departments to share the blame, the onus also
falls on the manufacturers of cement for the prevailing market
situation. Almost all of the available evidence, either related to
reduction of government taxes or switching of plants to cost
effective mode of production and drastic reduction of retail price of
cement when the cartel appears to be falling apart, point to the fact
that something is seriously wrong with the supply situation. There is
a credibility problem on the part of the manufacturers. If, as a group,
they think they have valid reasons to maintain higher retail prices,
they will have to come clean to explain their position. After all, the
consumers are not all that naïve not to understand the real factors
behind their exploitation.
From consumers’ side, it is valid to ask who is there to protect their
interests. Along side the government who has to ensure that
14 See ‘A Framework for the Design and Implementation of Competition Law and Policy’, a joint publication of the World Bank and OECD (1999), Washington D. C.: The World Bank.

32
consumers face market rather than monopoly prices. What has been
the scope of work of such institutions as Consumers Protection
Agency, if there is any? While the developed economies do have
strong advocacy groups to safeguard the interests of consumers, the
situation in Pakistan is as murky as it could be.
Three additional concerns that are essentially consequential in
nature but require mentioning. The first relates to the switching of
cement plants from furnace oil to coal fired plants and in this respect
the environmental cost of this substitution needs to be ascertained.15
It is a common understanding that the burning of coal with sulphur
content has serious environmental consequences. There are,
nonetheless, techniques available whereby sulphur emission could
be reduced to a significant level. However, this requires that a
foolproof monitoring system be in place to avoid major
environmental catastrophe.
It is also necessary that the required infrastructure, i.e., road/ railway
be in place at the earliest to meet future coal needs of the cement and
other industries relying on cheaper fuel. A consistent and cost
effective supply of coal will have to be ensured so that industrial
structure built around locally available cheap heating fuel continues
its production without worrying about input constraints.
Furthermore, price stability of coal will have to be maintained.
Finally, revenue stability for the government is yet another area of
concern. The evidence suggests that the revenue cost of slashing of
CED has been fairly significant. This loss may be compensated if
the plants start operating at full capacity. However, until such time,
there is a possibility that this budgetary measure may result into
revenue shortfall.
15 The Environment Report on Cement Sector prepared in September 2000 under the Environmental
Technology Program for Industry (ETPI) is not up-to-date as far as the environmental cost of coal-fired plants is concerned. This aspect needs to be studied on priority basis.

33
III
Pakistan’s Experience with
WTO Agreements on Market Access16
Introduction
WTO Agreements have posed multi-faceted challenges for most of
the developing countries due to their extensive coverage and
plethora of documentation. While the agreements related to customs
valuation, intellectual property rights (IPRs), trade in services, and
issues related to investment, agriculture, textile and clothing, and
sanitary measures have been designed to provide opportunities for
unrestricted international trade flows, they have serious implications
for developing countries (DgCs), including Pakistan. The anticipated
benefits of trade have been marginal so far despite the fact that the
agreements call for greater market access through reduction in tariff
and non-tariff barriers. One of the reasons for this malaise is that
while DgCs have increasingly acceded to the requirements of the
agreements, the flow of exports from these countries is being
restricted by the developed world through strict trade defense
measures. There is no denying that ever since its adoption in 1995,
anti-dumping option has been exercised rather extensively by the
USA and the EU countries and so is the evidence related to
countervailing duties, subsidies, and safeguard measures [WTO,
Annual Report (2003)]. This tendency seems to be continuing even
today, albeit at a slower pace. The recent debacle at the Cancun
Conference has once again raised questions about realization of the
estimated benefits of liberalization and globalization, as the so-
called Quad group of major importers (the USA, the EU, Canada,
and Japan) is still not ready to withdraw protective barriers against
imports of agriculture and textile from the developing world.
16 Authors: Dr. Ather Maqsood Ahmed, Member (FR&S) and Mr. Mir Ahmed Khan, Statistical Officer (FR&S), CBR. They are grateful to Mr. Riaz A. Malik, Chairman CBR for insightful comments.
34
The present study seeks to focus on Pakistan’s experience with
market access initiatives under WTO Agreements. With a brief
review of the existing tariff structure and trade defense measures,
the paper concentrates on the enactment of trade defense laws in
Pakistan and their enforcement.
The Binding Structure of Tariffs
Interestingly, there is no legally binding agreement that sets out the
targets for tariff reductions, i.e., by what percentage they were to be
cut as a result of the Uruguay Round. However, at the end of the
Uruguay Round negotiations, individual countries had listed their
commitments in schedules annexed to Marrakesh Protocol to the
GATT 1994, which became the lengthy binding agreement for the
reduced tariff rates [WTO (1999)].17
Tariff Reduction and Rationalization in Pakistan
Until recently Pakistan’s taxation system was overwhelmingly
dependent on the international trade taxes including import and
export duties. Besides being a sure source of government revenues,
high rates of duties were used to protect domestic industry from
unhealthy international competition. However, this high level of
protection not only generated gross inefficiencies in the system as
the quality of the goods produced by the domestic industry suffered
badly, but it also became a major impediment to growth through its
adverse impacts on exports and further industrialization.
To circumvent these concerns, broad based tariff reform program
was initiated in the second half of the 1980s. Since then the
maximum tariff on import duties has been curtailed gradually from
125% in FY 90-91 to 80% in FY 93-94 and 65% in FY 95-96.
Currently, the maximum tariff rate is 25% and the number of slabs
has also been reduced to only four i.e., 5%, 10%, 20%, and 25%.
17 See ‘Trading into the Future: The World Trade Organization’, revised second edition, April 1999.
35
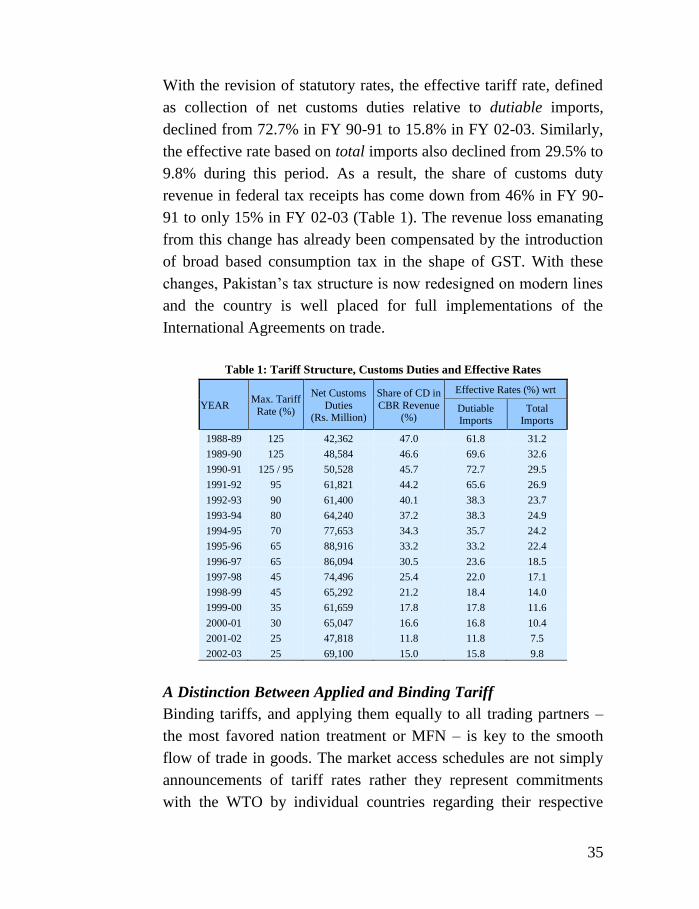
With the revision of statutory rates, the effective tariff rate, defined
as collection of net customs duties relative to dutiable imports,
declined from 72.7% in FY 90-91 to 15.8% in FY 02-03. Similarly,
the effective rate based on total imports also declined from 29.5% to
9.8% during this period. As a result, the share of customs duty
revenue in federal tax receipts has come down from 46% in FY 90-
91 to only 15% in FY 02-03 (Table 1). The revenue loss emanating
from this change has already been compensated by the introduction
of broad based consumption tax in the shape of GST. With these
changes, Pakistan’s tax structure is now redesigned on modern lines
and the country is well placed for full implementations of the
International Agreements on trade.
Table 1: Tariff Structure, Customs Duties and Effective Rates
YEAR Max. Tariff
Rate (%)
Net Customs
Duties (Rs. Million)
Share of CD in
CBR Revenue (%)
Effective Rates (%) wrt
Dutiable Imports
Total Imports
1988-89 125 42,362 47.0 61.8 31.2
1989-90 125 48,584 46.6 69.6 32.6
1990-91 125 / 95 50,528 45.7 72.7 29.5
1991-92 95 61,821 44.2 65.6 26.9
1992-93 90 61,400 40.1 38.3 23.7
1993-94 80 64,240 37.2 38.3 24.9
1994-95 70 77,653 34.3 35.7 24.2
1995-96 65 88,916 33.2 33.2 22.4
1996-97 65 86,094 30.5 23.6 18.5
1997-98 45 74,496 25.4 22.0 17.1
1998-99 45 65,292 21.2 18.4 14.0
1999-00 35 61,659 17.8 17.8 11.6
2000-01 30 65,047 16.6 16.8 10.4
2001-02 25 47,818 11.8 11.8 7.5
2002-03 25 69,100 15.0 15.8 9.8
A Distinction Between Applied and Binding Tariff
Binding tariffs, and applying them equally to all trading partners –
the most favored nation treatment or MFN – is key to the smooth
flow of trade in goods. The market access schedules are not simply
announcements of tariff rates rather they represent commitments
with the WTO by individual countries regarding their respective

36
tariff structures. In the case of developed countries, these binding
commitments of rates – also known as the bound (tariff) rates – are
generally the rates actually charged, thus reducing the distinction
between applied and bound rates. For developing countries bound
rates are somewhat higher than the applied rates, so the bound rates
serve as ceilings, which are difficult to change.
Notwithstanding the fact that the applied and bound tariffs have
largely coincided and the average tariffs are also low, tariff peaks
and escalation in developed countries are major impediments
towards unrestricted flow of exports from DgCs. The evidence
shows how tariff rates increase progressively from one stage of
processing to another. While unfinished products face lowest tariff
rates, the highest rates are applied to semi-finished and finished
products, thus depriving DgCs of their comparative advantage in the
exports of agriculture and agro-based finished products.18
Table 2: Tariff Escalation in the Quad Countries & Pakistan
Stages of
Processing
Food, Beverages &
Tobacco
Textile & Leather
Products Chemicals
Basic
Metal All Sectors
USA 1 3.20 2.20 2.00 0.30 2.20
2001 2 9.00 9.80 4.60 2.10 5.20
3 13.10 10.30 4.10 2.50 5.70
Canada 1 7.90 1.00 1.50 0.00 3.90
2002 2 6.80 7.00 2.90 0.90 3.90
3 34.30 13.50 4.70 3.00 8.90
EU (15) 1 12.40 0.90 1.70 0.00 7.30
2002 2 19.10 6.70 4.50 1.90 4.90
3 18.80 9.70 3.80 0.00 7.00
Japan 1 25.40 9.80 2.50 0.40 14.60
2002-03 2 30.30 6.80 2.80 1.10 4.90
3 22.60 12.00 2.00 3.00 7.80
Pakistan 1 12.10 10.10 13.20 14.70 11.80
2001 2 19.20 23.70 13.90 15.40 17.50
3 29.20 29.20 21.10 30.00 23.60
Note: Tariff Escalation by 2-digit ISIC Industry Code.
Source: WTO Annual Report (2003)
18 A number of studies have shown that undue restrictions not only promote rent seeking activities, but
the net welfare loss is also substantial, see R. Feenstra (1995) ‘Estimating the Effects of Trade Policy’
in Handbook of International Economics, Volume III, Amsterdam: North Holland., pp 1553-1595.

37
Binding Structure of Tariff: The argument in favor of binding
structure of tariff is that it reduces uncertainties related to
profitability of traders and investors by providing substantially
higher degree of assurance about market security and access. While
most of the developed countries have bound close to 100% of their
industrial tariff lines, for the developing countries as a group this
percentage has increased from 21% to 73% (Table 3). As far as the
tariff structure in Pakistan is concerned, nearly 32% of the product
lines were bound since FY 95-96 at various rates. However, with the
application of a formula whereby bound rates are set at applied rates
plus 50, this percentage has risen to 98.4, thus ranking Pakistan
amongst the top in the developing countries group. The only
exceptions to the binding structure are commodities that lie outside
the currently applicable four slabs.
Table 3: Scope of Bindings, Average and Bound Tariff Rates
on Industrial Products for Selected WTO Members
Share of
Bound
Lines (%)
Average Final
Bound Rate
Average
Applied rate Year
Canada 100.0 5.7 4.2 2002
USA 100.0 4.0 4.4 2001
EU 100.0 4.0 4.1 2002
Japan 98.7 3.8 3.9 2002-03
Australia 95.5 11.6 4.7 2001-02
Argentina 100.0 31.8 13.4 2000
South Africa 95.7 18.1 10.9 2002
Bangladesh 0.9 50.0 21.9 1999-00
India 68.2 36.2 31.0 2001-02
Pakistan 36.5 36.0 20.1 2001-02
Source: Table II.1, WTO Annual Report (2003)
Trade Defense Measures
The WTO even though takes a clear stand on freer trade through the
removal of tariff and non-tariff barriers, there are nonetheless certain
exceptions to these rules. The Organization provides a whole host of
effective tools in the form of anti-dumping, countervailing duties
and safeguard measures that allow member countries to protect their
38
economies temporarily against the inflow of illegal and cheaper
imports threatening the domestic economy. The WTO Agreements
related to trade defense measures and Pakistan’s initiatives on these
matters are discussed in the following.
Agreement on Anti-Dumping Measures: Dumping being a
debatable issue has attracted enormous attention across the world.
Dumping refers to price discrimination between national markets,
i.e., when an exporter sells a product for export to the importing
country at a lower price than the price at which the same product is
sold on its own or other markets. Dumping is undertaken with three
main objectives of getting rid of surpluses, capturing new markets,
and to reap benefits of scale economies. The literature distinguishes
between three types of dumping: (a) persistent dumping which
occurs when the elasticity of demand for a product in the world
market is higher than the elasticity of demand in the domestic
market; (b) predatory dumping which refers to temporary price
discrimination to attain monopoly status; and (c) sporadic dumping
to get rid of excess supply due to over production. Dumping even
though raises consumer welfare of the importing country, at least in
the short run, but since it also hurts the producers, the outcome is not
Pareto-optimal.
Trade defense measures such as anti-dumping is one of the tools
permitted under WTO on the pretext of protecting domestic industry
including newly established and infant industry, which require time
to flourish. Article VI of GATT allowed countries to take action
against dumping.19 However, for establishing an anti-dumping case,
there must be a proof of dumped imports, injury to the domestic
industry and establishment of cause and effect relationship between
them. When these conditions are proven beyond any shadow of
19 There are many different ways of calculating but the agreement narrows down the range of possible
actions. Usually, the price prevailing in exporter’s domestic market or price charged by the exporter in
another country or a calculation exporter’s production cost including other expenses and normal profits
is used to calculate product’s ‘normal value’.

39
doubt, then anti-dumping duties can be levied to increase the price
of imported good vis-à-vis the domestic goods. It is important that
anti-dumping measures must expire five years after the date of
imposition, unless an investigation shows that ending the measure
would lead to injury. Similarly, anti-dumping investigations are to
end immediately in cases where the authorities determine that the
margin of dumping is insignificantly small.
Anti-Dumping Investigations and Imposition of Measures: Ever
since its permission under WTO in 1995, the number of the
‘initiated’ anti-dumping investigations has increased sharply, which
raises concerns about the appropriate use of these provisions. The
number of initiations notified by the members to WTO during 1995-
2001 has been 1868 (Table 4). Of these the number of cases against
whom measures have been imposed are 1059 that constitutes 57% of
the initiated cases. The largest user of anti-dumping provisions
during the past seven years are: USA (257), India (248), the EU
(247), and Argentina (166). The countries most affected by these
investigations are China who is facing 261 cases, the Republic of
Korea (139), USA (103) and Taiwan (96) [WTO Annual Report
(2003)]. The investigations are most frequently targeted against base
metals and articles thereof (38% of the initiations in 2001),
chemicals (17%), and rubber and rubber products (14.4%). Within
the base metal category, nearly 85% of the investigations initiated in
2001 were related to steel products. Pakistani products, especially
textile exports have also been at the receiving end. In the past the
EU has opted for anti-dumping investigations and levy of duty on
grey cloth; Japan on cotton yarn, and USA on cotton towel.20
Anti-dumping Law & its Implementation in Pakistan: Pakistan has
already promulgated Anti Dumping Ordinance, 2000 in December
2000. The National Tariff Commission (NTC) has been empowered
20 A recent attempt by the EU to impose anti-dumping duty on bed linen has been successfully
negotiated between the two trading partners to reach at an amicable understanding on trade flows.
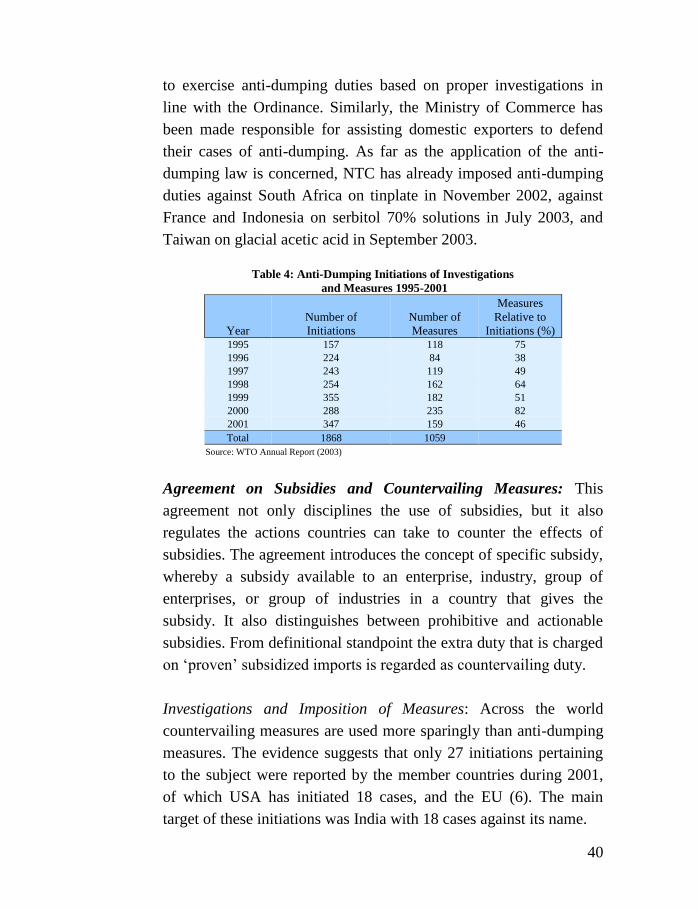
40
to exercise anti-dumping duties based on proper investigations in
line with the Ordinance. Similarly, the Ministry of Commerce has
been made responsible for assisting domestic exporters to defend
their cases of anti-dumping. As far as the application of the anti-
dumping law is concerned, NTC has already imposed anti-dumping
duties against South Africa on tinplate in November 2002, against
France and Indonesia on serbitol 70% solutions in July 2003, and
Taiwan on glacial acetic acid in September 2003.
Table 4: Anti-Dumping Initiations of Investigations
and Measures 1995-2001
Year
Number of
Initiations
Number of
Measures
Measures
Relative to
Initiations (%) 1995 157 118 75
1996 224 84 38
1997 243 119 49
1998 254 162 64
1999 355 182 51
2000 288 235 82
2001 347 159 46
Total 1868 1059
Source: WTO Annual Report (2003)
Agreement on Subsidies and Countervailing Measures: This
agreement not only disciplines the use of subsidies, but it also
regulates the actions countries can take to counter the effects of
subsidies. The agreement introduces the concept of specific subsidy,
whereby a subsidy available to an enterprise, industry, group of
enterprises, or group of industries in a country that gives the
subsidy. It also distinguishes between prohibitive and actionable
subsidies. From definitional standpoint the extra duty that is charged
on ‘proven’ subsidized imports is regarded as countervailing duty.
Investigations and Imposition of Measures: Across the world
countervailing measures are used more sparingly than anti-dumping
measures. The evidence suggests that only 27 initiations pertaining
to the subject were reported by the member countries during 2001,
of which USA has initiated 18 cases, and the EU (6). The main
target of these initiations was India with 18 cases against its name.
41
Enactment and Application of Law in Pakistan: To bring conformity
with the WTO agreement, Pakistan in January 2001 promulgated the
Countervailing Duties Ordinance, 2001 to ensure protection to
domestic producers against illegal subsidized exports. NTC has the
enforcement powers to impose countervailing duties. As far as the
implementation of the countervailing measures against Pakistan is
concerned, USA and South Africa have targeted only two products,
i.e., shop towel and bed linen for levying countervailing duties.
Agreement on Safeguard Measures: Agreement on Safeguard
Measures under Article 19 of GATT was always available, but used
very infrequently. Under the WTO Agreement, a member may
restrict imports of a product temporarily, i.e., take safeguard action,
if its domestic industry is injured or threatened with injury caused by
a surge in imports. The criteria for assessing the nature of injury are
clearly spelled out in the agreement. However, if a country decides
to exercise its option to safeguard its imports, this action has to be
reciprocal. As a general principle, the exporting country can seek
compensation through consultation, otherwise the exporting country
can take an equivalent retaliatory action.
Implementation of Safeguard Measures: The safeguard measures are
being used more frequently in recent years by the WTO members as
compared to earlier period. The WTO Secretariat has been formally
notified that 85 safeguard investigations have been initiated since
1999 of which definitive safeguard measures have been only 41.
Regarding Pakistani products, only combed cotton yarn has been
affected by measures initiated by USA. Nonetheless, this action was
found illegal by the authorized body on the ground that it was not
consonant with the Agreement on Textile and Clothing. However,
by the time the decision was communicated, the period of action had
already lapsed.
42
Enactment and Application of Law in Pakistan: In response to WTO
Safeguards Measures Agreement, Pakistan has promulgated
Safeguard Ordinance, 2002 to deal with any significant injury or
threat of injury due to abrupt rise in the volume of imports. Like
anti-dumping and countervailing duties, NTC has also been
entrusted with the enforcement and administration of the agreement
on safeguard measures.
Concluding Observations
Pakistan’s compliance to various agreements related to market
access has been fairly significant. But optimal benefits of unilateral
submission to these agreements have not materialized for the simple
reason that while the developed countries are demanding
unrestricted access to markets in the developing world, the same has
been denied by them. Agricultural subsidies and slower than
anticipated phasing out of the textile quota restrictions are the major
stumbling blocks for the success of the WTO Agreements on market
access. The failure of the recent round of Ministerial Conference at
Cancun is a clear manifestation of this concern.
On the issue of application of trade defense measures it appears that
one of the reasons for its misuse is the absence of established criteria
to initiate cases against the ‘alleged’ violators. It has been observed
that initially the developed world and now India and Argentina have
started to extensively use the option of trade defense measure to
deny market access to exporting countries. In contrast, very few
cases have been initiated and investigated in Pakistan. One reason
could be that it is difficult to prove material injury to the domestic
industry, especially when foreign currencies are appreciating and
there is incomplete pass-through of exchange rate. There is
likelihood though, that the pace of such cases may increase with
passage of time. Indeed, looking at India’s recent rapid pace, there
are already some concerns among the block of developed countries
giving rise to initial talk about the need to curb this outlet.

43
IV
WTO Agreement on Customs Valuation: Pakistan’s Experience in Historical Perspective21
Price is what you pay. Value is what you get.
Background
In this world everything has value but its precise nature is often
unknown. Customs valuation is the procedure used by customs
officials to determine the value of the imported goods for the
purposes of calculating the right amount of import duty. This is a
delicate issue as an incorrect valuation means importers are
undercharged for duty. This in turn causes loss to the national
exchequer and also creates unfair competition for the local
manufacturers in the market. On the other hand, if importers
especially investors are unsure how the value will be calculated, the
business of importing goods for investment becomes unpredictable.
Poor Customs valuation procedures defies protection to the local
industry and can act as a deterrent for bona fide traders, since
importers need to be sure how much duty their goods will attract in
order to decide whether or not a profit could be made by importing
goods. Thus, the need for accurate assessment of imported goods is
crucial from various angles. The purpose of the present study is to
analyse Pakistan’s experience with respect to adoption of customs
valuation agreements in historical perspective. The difficulties in the
implementation of these agreements are discussed and certain
corrective measures are suggested.
Brussels Definition of Value, 1953
The need for a uniform valuation method was felt soon after the end
of the 2nd world war so that the trading partners could apply same
valuation method to avoid confusion and misunderstandings
21 Author: Mr. Irfan-ur-Rehman Khan, Second Secretary, Customs Valuation, CBR.
44
between them. As a result, the ‘Brussels Definition of Value’ (BDV)
was adopted on 28 July 1953.22 This international convention on
valuation procedure agreed by majority of countries was based on
notional concept of value. The price of the goods was considered as
the price the goods would fetch in the open market independent of
the buyer or seller.
GATT Valuation Agreement, 1989
Despite the designed uniformity of valuation in the BDV system, it
was no more than a notional concept devoid of reality and actual
transaction value between the buyer and seller. The arbitrary system
of valuation was, thus, considered a non-tariff barrier (NTB), which
required improvement. In an effort to introduce positive valuation
system, the Agreement on Implementation of Article VII of the
GATT was adopted in 1979 and entered into force on 1st January
1989. Its aim was to establish a fair, uniform and neutral system for
the valuation of goods for levying of customs duty, conforming to
commercial realities and outlawing the use of arbitrary or fictitious
customs value.
WTO Valuation Agreement, 1995
The Agreement was further amended during the Uruguay Round of
multilateral trade negotiations. In 1995, the WTO adopted the
Article VII of the GATT, which is now called the WTO Agreement
on Customs Valuation. Over 145 countries have adopted the new
valuation convention for calculation of customs duty on goods. The
valuation code states that the value of goods shall be the
transactional value, that is, the price paid or payable for the goods
sold for export. However, if the declared customs value is in doubt,
the Customs administrations have the right to request further
information to determine the accuracy of the declared value of the
22 The Definition was embodied in the Convention on the Valuation for Goods for Customs Purposes
on December 15, 1950. For further details, see ‘Customs Valuation Considerations’ by World Customs Organization.

45
goods. If doubt continues, the agreement provides the customs
officials with a number of options, to be applied sequentially, to
ensure the declared customs value is correct or reasonably correct.
The sequential options are:
(a) Transaction value of identical goods: The value of identical
goods can be used to ascertain the transaction value if the goods
are the same in all respects. This includes physical
characteristics, quality and reputation, production in the same
country as the goods being valued and production by the
producer of the same goods being valued. If these conditions are
met, slight differences in appearance of goods do not necessarily
disqualify the goods being used in a comparison to calculate the
transaction value.
(b) Transaction value of similar goods: Customs officials can also
use the transaction value of similar goods when the transaction
value of imported goods is in doubt. Customs officials have
recourse to this option if the similar goods:
Closely resemble the goods being valued in terms of
component materials and characteristics;
Are capable of performing the same functions;
Are commercially interchangeable with the goods being
valued; and are being sold to the same country of
importation as the goods being valued.
(c) Deduction value: When the doubt continues even when the
above two options have been exercised, the customs value can
be determined on the basis of the unit price at which the
imported goods (or identical or similar goods) are sold to an
unrelated buyer in the greatest aggregate quantity in the country
of importation. The greatest number of units sold at one price
represents the greatest aggregate quantity. To determine the
greatest aggregate quantity, all sales at a given price are taken
together and the sum of all the units of goods sold at the price
compared with the sum of all the units of goods sold at any other
46
price. Because this method entails using the sale price of
imported goods, deductions are necessary to reduce the price to
the appropriate customs value. Examples of deductions that
must be made include commission, the sum of profits and
general expenses added in connection with sales, transport costs
and corresponding insurance costs.
(d) Computed value: Computed value determines customs value on
the basis of the cost of production of the goods being valued,
plus an amount for the profit and general expenses usually
reflected in sales from the country of exportation to the country
of importation of goods of the same class or kind. Computed
value is the sum total of production costs plus profit, general and
other expenses.
(e) Fallback method: Even after going through the previous options
the doubt about the correct customs value still persists, customs
value may be determined using reasonable means on the basis of
data available in the country of importation. The reasonable
means must be consistent with the principles and general
provisions of Article VII of GATT. Some methods of
calculation are determined not to be ‘reasonable means’ under
the agreement and are prohibited. They include:
The sale price of goods made in the country of importation;
A system that provides for customs purposes the higher of
two alternative values;
The price of goods in the domestic market of the country of
exportation
The cost of production (other than the computed values
determined for the identical or similar goods),
The price of goods for the export to a country other than the
country of importation,
Minimum customs values and arbitrary or fictitious values.
It is important to note that neither the importer nor the customs
administration is entitled to select the valuation method. As

47
indicated, the order set out above is binding. However, the exception
to the rule is where the Agreement states that the importer may
request that the order in which the deductive method and the
computed value are applied be reversed.
Benefits of a Well Functioning Valuation System
The WTO Agreement is intended to provide a single system that is
fair, uniform and neutral for the valuation of imported goods for
customs purposes, conforming to commercial realities and
outlawing the use of arbitrary or fictitious customs values. The
Agreement, by its positive concept of value, recognizes that customs
valuation should, as far as possible, be based on the actual price of
the goods to be valued. The uniform, predictable and transparent
application of customs valuation facilitates international trade. In
determining customs value the WTO Valuation Agreement is the
sole valuation system for worldwide application. The Agreement
adopts a positive approach by providing a direct link between the
collection of duties and commercial reality. The Agreement is also
neutral, it is easy to apply where there is a price actually paid or
payable, which is the case for most transactions, and the precision
and clarity of the Agreement help minimize disputes between traders
and customs administrations, thus expediting cargo clearance
operations. However, since the valuation code is dependent on post
clearance audit, it is more effective in countries where a larger part
of the economy is documented and the audit procedures are
effectively placed.
Adoption of the New System by Pakistan
Before embarking on the new system, the customs valuation of
imported goods in Pakistan was carried out on the basis of the
Import Trade Price (ITP) under BDV. ITP manuals were updated at
regular intervals and used extensively. Pakistan continued to follow
the BDV system of valuation until 1995. Even though the new
system under WTO was adopted by a majority of the member

48
nations in 1995, Pakistan postponed its implement until January
2000 by availing the concession in the Agreement for developing
countries. On 1st January 2000 Pakistan implemented the new
GATT CODE of Valuation. Under this new valuation code, the
price paid or payable subject to certain additions was taken as the
transactional value for duty purposes. The earlier system of Import
Trade Price manual, a catalogue of minimum values fixed for
frequently imported goods used to ensure minimum assessable
values, was discarded. Accordingly, the legislative changes were
brought into the Customs Act, 1969 in Sections 25 and 30 through
Finance Bill, 1999.
Apprehensions and Excitement: Soon after the implementation of
the new system, there was a sense of euphoria among the importers
that the practice of enhancing the value as per the ITP manual will
come to an end and they will be able to get their goods cleared on
whatever the value they declare on the invoice. On the other hand,
the customs staff was apprehensive and fearful that the new change
would result in huge shortfall in revenue collection due to two
reasons:
1. The collection of customs duties and sales tax takes place at
different customs collectorates, some of which are located in
remote areas having limited support facilities and proper
means of communication. Compared to this, majority of the
importers operate from major cities; and
2. The adoption of new concept of transactions value might
increase the incidence of incorrect declaration taking benefit
of the switchover to new system and resultantly there is loss
to the government exchequer.
In an effort to overcome this problem of incorrect declaration of
import value, the customs department prepared a comprehensive
catalogue of values of frequently imported goods, the valuation
database (VDB) consisting of 27000 items, to serve as basis to
49
compare goods value declared by the importers. This was an
intelligent move by the customs to utilize the same data that was
available in the abandoned ITP for VDB database. However, the
trade bodies agitated on the VDB being followed like a holy script
by the customs field offices despite the fact that it was used only for
reference purposes. The CBR later on withdrew it. The statistics
show that this change resulted in an insignificant shortfall in revenue
collection for the reason that the customs department was already
accepting the invoice values of major volume of imports by
multinationals.
Implementation Issues and Corrective Measures
The implementation of the WTO Agreement in Pakistan has not
been smooth entirely. The difficulties are faced in a number of areas
such as the inability to conduct post importation audit due to
inadequate record keeping by small scale importers, tackling the
menaces of under-invoicing and commercial fraud, development of
an effective mechanism against trade defense measures, preparation
of the reference value guide, and fixation of minimum value
etcetera. Since these issues are critical in nature and require
corrective measures, a brief discussion is warranted.
Risk-based Audit Management: The customs valuation is designed
as an audit based system. Traditionally the customs documentary
checking and physical examination connected with importations and
exportations used to take place before the goods were released. For
audits to be meaningful and time bound, the two approaches to
customs audit usually followed were: the single bill of entry audit
approach and the importer wise audit approach. In the former
approach, each bill of entry is audited individually irrespective of
the importer and in the latter approach, all imports of an importer
during a period-usually a year, is taken as a whole and all
transactions regardless of the variety of imported goods are taken in
totality. Such audits are conducted at importers premises and all

50
financial statements of the importer’s business are taken into
consideration for audit. A risk profiling of importers under various
risk-based parameters proves to be a better audit management
approach in this respect.
The concept of post clearance audit (PCA) allows for speedier
clearance of the goods with the audit being performed subsequently
at the importer’s premises. The philosophy behind the concept of
acceptance of price paid or payable for the goods lies in the post
clearance Customs audit of importers records to verify that the price
paid or payable is also supported by documentary evidences. The
main purpose of audit is to ensure that there is no indirect payment
or any unaccounted payments made to the seller on account of the
goods imported. The audit also ensures that the importer is not
providing any free services or raw materials to the foreign seller for
the manufacturing of goods subsequently bought from the sellers.
For meaningful audit the availability of properly maintained records
of imports has to be ensured.
PCA is a new and important area for Pakistan Customs. It is yet to
be fully functional as the valuation department, which has been
given this task to audit, initially had a shortage of skilled customs
auditors. However, through extensive training programs and
practical experience gained through audits, the customs department
has developed an adequate resource base of experienced auditors.
Nonetheless, despite this strength, the successful implementation of
PCA in Pakistan requires effective enforcement and provision of
trade facilitating measures and simplified procedures in cargo
processing and valuation. To ensure maximum revenue yield, full
compliance with import/ export regulations and minimum
interference/ cost to legitimate trade are also primary considerations.
As far as record keeping for PCA is concerned, the experience has
shown that there is no problem of record maintenance in the case of

51
large enterprises, multinationals and local industries. However, in
the case of small and medium enterprises, there is a general
reluctance to this requirement. This is not a positive signal, as the
whole system may collapse if the record-keeping requirement is not
ensured and the resistance continues in the foreseeable future.
The Problems of Under Invoicing and Commercial Fraud: Under-
invoicing it is a method of evading customs duties and taxes by
declaring the value on the invoice less than the actual value. This
happens when the importer colludes with the foreign supplier and
makes an understated invoice where as the supplier gets the
remaining amount through informal channels such as hundi. The
second case scenario is where the importer prepares forged or fake
invoice, which shows less than actual value. This fake invoice
without the knowledge of foreign suppliers is submitted to customs
department for calculation of customs duties and taxes.
Interestingly, the WTO Agreement has no mechanism to check fake
invoicing except through PCA. In a way, the WTO Agreement only
deals with bona fide trade and ignores the reality of rampant fake
invoicing that is practiced throughout the world, including Pakistan.
The Agreement has a weak mechanism to reject the understated
value through manipulated invoices at the clearance stage. Similarly,
the mechanism is insufficient to check cases where there is group
under-invoicing. In such situations there are no evidences of higher
values available to doubt the declared value.
As a remedial measure, the Pakistan Customs has attempted to bring
more openness to the procedure of assessment. The details of goods
arrived and their assessed values previously cleared are now
available on CBR website. The customs department has started to
exercise the option of taking over goods from importers if someone
else offers higher value than the declared value to the customs.
These attempts to bring about transparency in the assessment of
goods have, to some extent, discouraged under-invoicing. It may,

52
however, be pointed out the above mentioned system is not part of
the WTO Agreement but an indigenously developed procedure
which has been further streamlined to make it more practical.
Non-supportive Role of Small Traders: The importance of the
agreement lies in the fact that it realized the significance of actual
import price being negotiated at a given period of time between the
buyer and the seller. The Agreement accommodates the bargain that
takes place between the two parties and accepts the actual agreed
price depending on the trade dynamics in that continuum of time.
Even though the commercial importers operating in Pakistan
welcomed the WTO agreement rather warmly, the same has not
been true in the case of local manufacturers who had strong
reservations on the ground that they have to compete in the local
market that is flooded with imported goods. Despite being a logical
claim, this contention has no basis as the new system envisages
competitive environment for everyone to operate. The Agreement
does have provisions to protect domestic industry if it is hurt by
non-competitive behavior of exporting countries, which means that
rather than non-compliance with the requirements of the new
system, the matter can be resolved amicably if raised at the
appropriate forum.
The occasional discrepancy in valuation of identical goods cleared
from north and south cities of Pakistan traders has been another area
of concern for traders. According to them, there have been instances
where identical goods cleared from Karachi were assessed at a value
different than at Lahore. In view of the seriousness of this concern,
CBR has already taken necessary corrective measures to ensure
uniformity of assessment throughout the country through better
coordination among various customs collectorates. As a result,
claims of discrepancy have dwindled significantly in the recent past.
53
The Issue of Dumping: The WTO anti-dumping agreement allows
governments to act against dumping where there is genuine injury to
the competing domestic industry. In order to do that the government
has to prove that dumping is taking place, calculate the extent of
dumping, and show that the dumping is causing injury or threatening
to do so. Extra import duty can be charged on a particular product
from a particular exporting country in order to bring its price closer
to the ‘normal value’ or to remove the injury to domestic industry in
the importing country.
Since anti-dumping measures often invite undue publicity and may
also strain relationships between countries, the best course of action
to avoid unpleasant situation is to use valuation as an invisible
measure. However, special expertise, especially in the areas of
customs valuation and PCA, is required for this to be used an
effective tool. The customs department can attempt to create the
necessary level of protection to the local industry through proper
and fair valuation of goods without disturbing the tariff structure.
Reference Value guide: Reference values are listed values of
frequently imported goods based on historical import data and
market surveys. Such list provides a baseline for the assessing
officer to judge whether or not the declared value is reasonably fair.
If it is decided to have recourse to secondary methods of assessment,
the reference values provide a working base value. However, in no
way the reference values are taken as fixed import trade prices.
There is need for comprehensive compilation of reference value
database. Such a value reference guide can be very useful tool for
the assessing officers and it will also help in maintaining uniformity
of assessment at all customs stations.
Minimum Values: Under the provisions of WTO Agreement on
Valuation developing countries can apply to WTO for maintaining
for certain period minimum values for certain imported items which
54
may hurt the local industry. This is legal recourse to check under
invoicing and protection of local industry. Recently the WTO
allowed Sri Lanka to maintain minimum values for second hand
vehicles. Pakistan has applied to WTO for this facility for several
items however; the request has not been accepted by WTO so far.
Concluding Remarks
Notwithstanding the fact that Pakistan has been an active partner in
establishing a free trade regime in the world as envisaged in the
WTO Agreement, but like other developing countries its ability to
implement each and every article of the Agreement in letter and
spirit is restricted by a number of factors. Pakistan has already taken
numerous innovative steps to deal with situations that are
exclusively related to it, however, there are other areas where a lot
more is desired. Among them, the effective implementation of post
clearance audit is the most essential step. Just as the importance of
audit cannot be denied when the taxation system is operating on
self-assessment basis, post clearance audit also assumes the central
position for the success of customs valuation. Thus, the cooperation
of the taxpayers in maintaining records of their business activities is
an essential ingredient of the system. Further steps are therefore
needed to persuade stakeholders to abide by this prerequisite of the
Agreement. Similarly, issues like fixing minimum value and
preparation of reference guide also require further attention to
mitigate friction between taxpayers and tax administrators.
55
V
CBR Reform Program: Introducing ‘Income Tax Assistant’23
Background
To facilitate voluntary compliance, taxpayers need to exhibit general
consent to pay taxes, whereas tax administrators need to increase the
efficiency of compliance procedures and the effectiveness of
taxpayer services. Responding to both of these ‘needs’, the CBR
reform plan places considerable emphasis on the importance of
effective taxpayer education and facilitation strategies to encourage
compliance with the tax laws. This new approach promotes the
concept of customer-oriented services to correct the adversarial
relationship between taxpayers and tax collectors. It also aims at
lowering taxpayers’ compliance costs. The drivers for taxpayers to
be compliant are twofold. Firstly, through compliance, which
envisages that:
o The tax burden is predictable;
o The tax burden is calculable and with penalties;
o There are minimal intrusions by tax officials;
o There is no need for “negotiated” tax liability;
o There is no fear of retribution;
o There is better control & knowledge of financial status of the
business.
Secondly, the repercussions of non-compliance are as follows:
o A fear of being caught;
o More intrusions by tax officials;
o More investigation;
o Assessments for undeclared tax with additional costs in the
form of interest, penalties and shame.
Central to the tax education and facilitation function is a strong and
well coordinated communications program which offers incentives
23 Author: Mr. Habib Fakhruddin, Member, Taxpayer Education and Facilitation, CBR.

56
for greater compliance, and develops a customer oriented, user
friendly supportive interface between tax administrators and the
taxpayers. The successful development of such a function requires a
significant cultural change as tax collectors move from a
‘confrontational’ mode to one of taxpayer service, assistance and
facilitation.
To facilitate this cultural shift, the Taxpayer Education and
Facilitation Function is in the process of introducing new
organizational structures, tasks and methods. A key objective is to
promote tax facilitation through the promotion of self-assessment of
tax liability. Self-assessment fixes the responsibility for declaring
tax liability on taxpayers thus freeing the resources to concentrate on
non-compliant taxpayers and non-registered traders representing
larger amounts of potential tax loss and unfair competition to
compliant taxpayers. Self-assessment also minimizes the
opportunities of interface with taxpayers and thus reducing the
number of negotiated settlements.
The recent endeavor in this respect is the development of extensive
literature on taxpayers’ education and facilitation and a software to
prepare income tax return, known as the Income Tax Assistant.24’25
The main features of this software are as follows.
About the Income Tax Assistant
‘Income Tax Assistant’ software is to assist taxpayers (individuals
and association of persons) in preparing their return of income
statement of final taxation, wealth statement and allied computation
and details for the tax year 2003 in accordance with the provisions
of Income Tax Ordinance, 2001. This software can be used for
24 The relevant literature is available on CBR Website: www.cbr.gov.pk.
25 While the beta version of the software prepared in collaboration with PRAL was released during the last week of August 2003, the final version was released on September 11, 2003.
57
multiple taxpayers and maintains the record of each taxpayer
separately.
Objectives: Income Tax assistant has been developed with the
following objectives:
o To assist and educate the taxpayers in preparation of their
Income Tax Return, Statements and allied computations etc.
o To eliminate human error/discretion and thereby ensuring
accuracy.
o To enhance voluntary compliance by reducing the compliance
cost and freeing the taxpayer from understanding the technical
language of income tax law, procedures and practices.
o To standardize the process
Ease & Benefits: The complexity of the tax laws to cater for current
pace of economic developments and the way commercial and non-
commercial transactions are affected cannot be avoided. However,
in this application a systematic flow using multiple submenu levels
has been adopted to over come the rigor of complexities and to
make the preparation of income tax returns etc. simple and user
friendly.
Diversity: Income Tax Assistant is not a tax calculator alone. It is an
extensive application based on artificial intelligence and covers the
following:
o Determination and computation of chargeable income under the
following heads:
(i) Income from salary
(ii) Income from property
(iii) Income from business, including preparation of
manufacturing, trading and profit and loss account,
bifurcation of business income attributable to
58
receipts/sales etc. subject to final taxation, admissible
depreciation, initial allowance and amortization etc.
(iv) Income from capital gains
(v) Income from other sources, including those subject to
final taxation
(vi) Foreign source income
o Sources of income exempt from tax
o Exclusions from income
o Determination and computation of gross tax, applicable tax
reductions and tax credits for donations, investments, annuity,
profit on debt etc.
o Advance income tax
o Additional tax
o Adjustment of prior years refunds
o Wealth Statement/Annual personal expenditure/Reconciliation
of wealth.
o Finally, the view and prints of Income Tax Return, Statement of
Final Taxation, Wealth Statement and a host of related reports
including the Application for Refund of Tax.
Limitations: This software has a limited application and may not
cater for complex and unique tax situations peculiar to any specific
taxpayer. Especially it does not cover tax situations involving more
than one business, brought forward business losses or unabsorbed
depreciation and calculation of additional tax.
Availability: Taxpayers can have a complimentary copy of the
‘Income Tax Assistant’ by submitting the registration form to the
Office of Member (TPE&F) personally or through fax [(051)-921-9215]
or by e-mail [[email protected]]. Any clarification or guidance
in this regard can also be obtained on telephone [(051)-920-3399].
[Your comments and suggestions will help us to achieve our objectives]