Embed Size (px)
Citation preview

Michael Wilkos, Senior Grants Officer
Community Research & Grants Management
Painting by Eric Shinn

359

1,864

22,370


802 people left Cleveland for Columbus
www.flickr.com/photos/67136606@N00
752 people left Dayton for Columbus

547 people left Youngstown for Columbus
Photo: Ohio Historical Society

481 people left Detroit for ColumbusPhoto: www.futurevintage.net
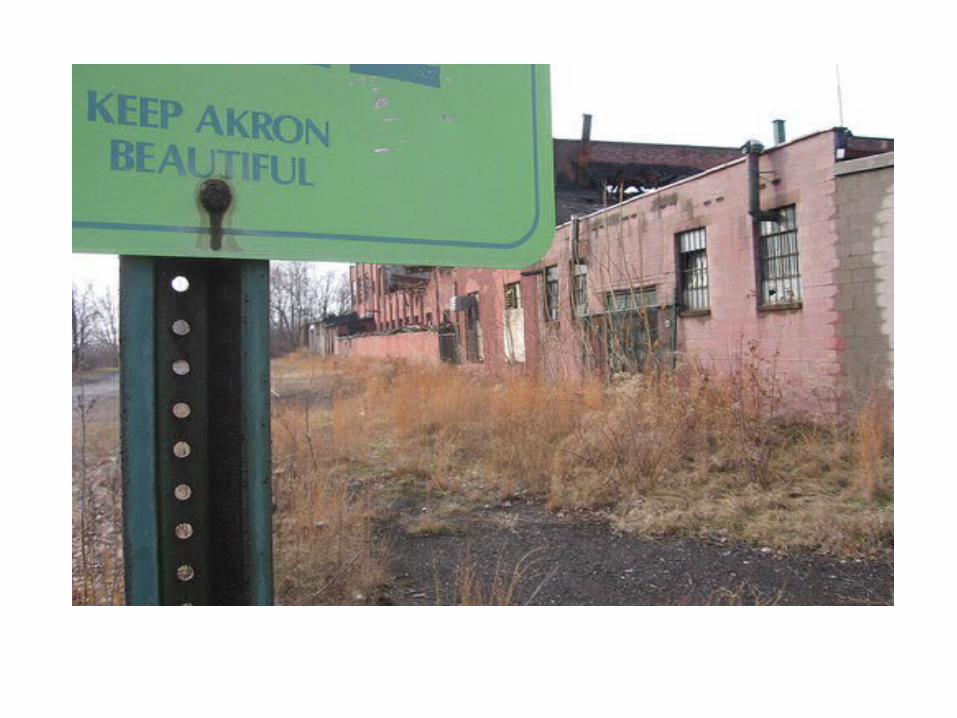
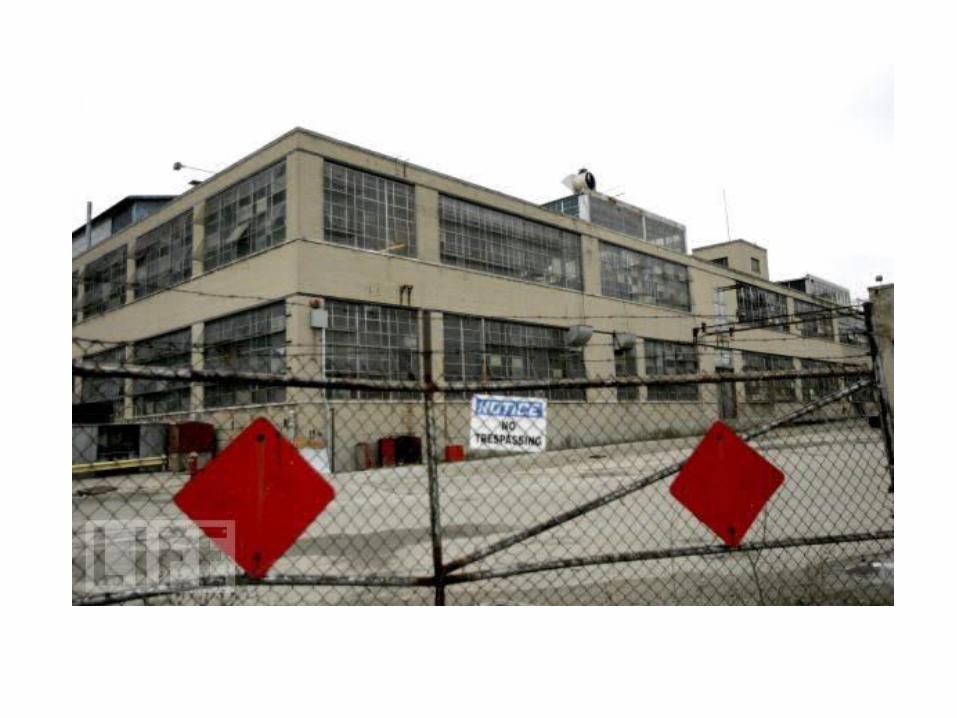
232 people left Akron for Columbus


264 people left Columbus for Phoenix

217 people left Columbus for Dallaswww.gettyimages.com

196 people left Columbus for Houstonwww.garybaumgarten.blogspot.com

180 people left Columbus for Charlottewww.gettyimages.com

159 people left Columbus for Atlantawww.atlanta-homes-guide.com
Source: Forbes Magazine

Foreign-Born Population | Franklin County
2%16,781
2.8%23,947 | +7,100
3.4%32,325 | +8,300
6.0%64,487 | +32,250
9.2%105,575 | +41,088
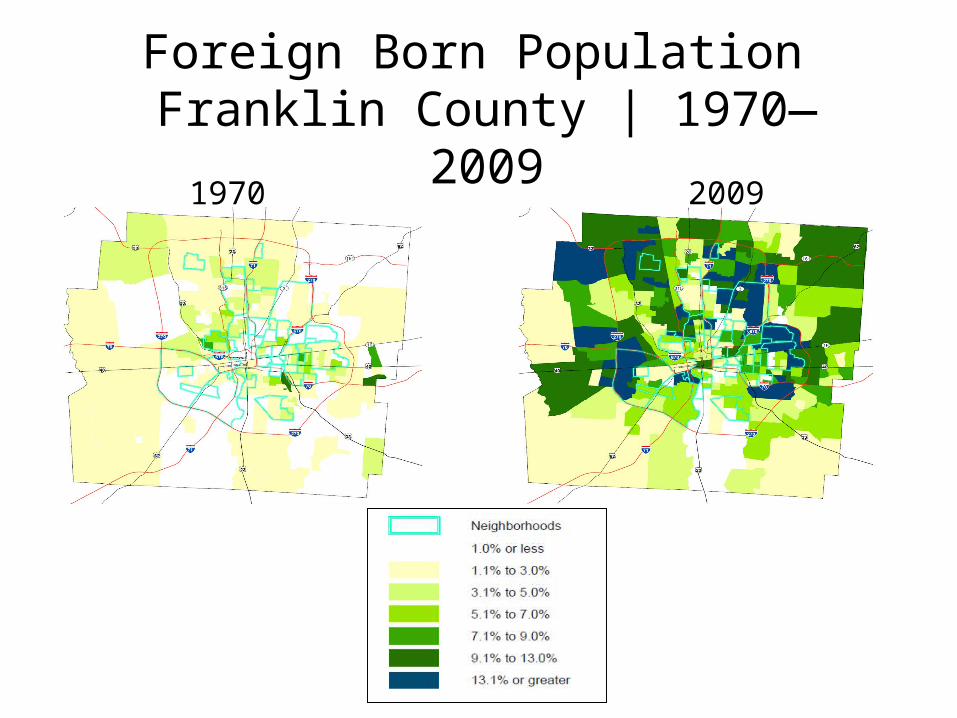
1970 2009
Foreign Born Population Franklin County | 1970—2009

132,360

Percentage Foreign BornCity of Columbus | 1900—2010
0%
2%
4%
6%
8%
10%
12%

The world is coming to Columbus…The world is coming to Columbus…
……to find opportunity to find opportunity
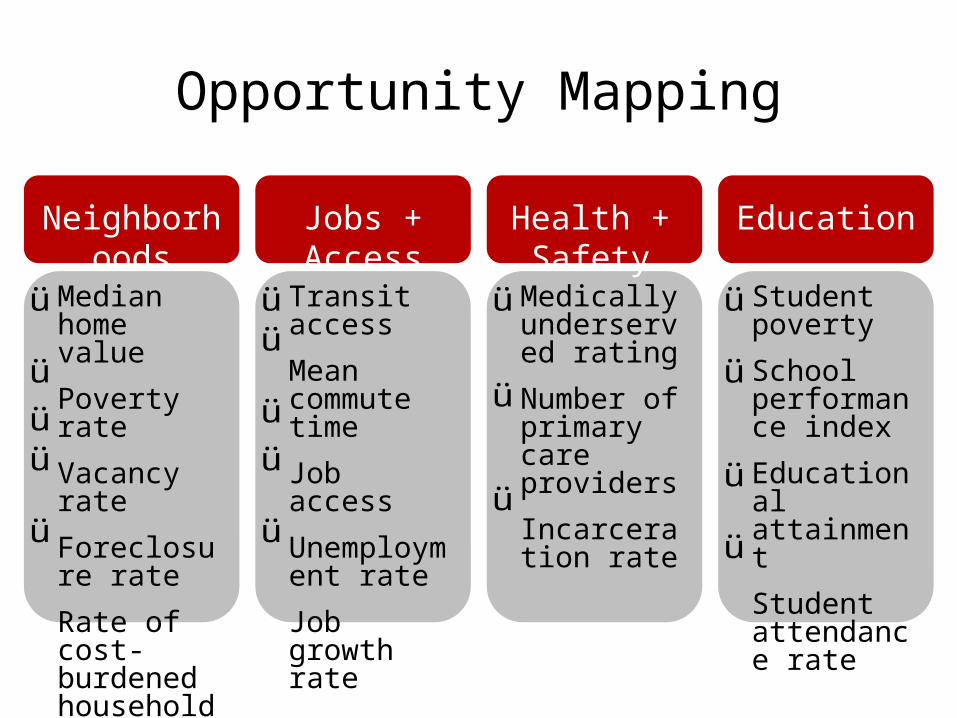
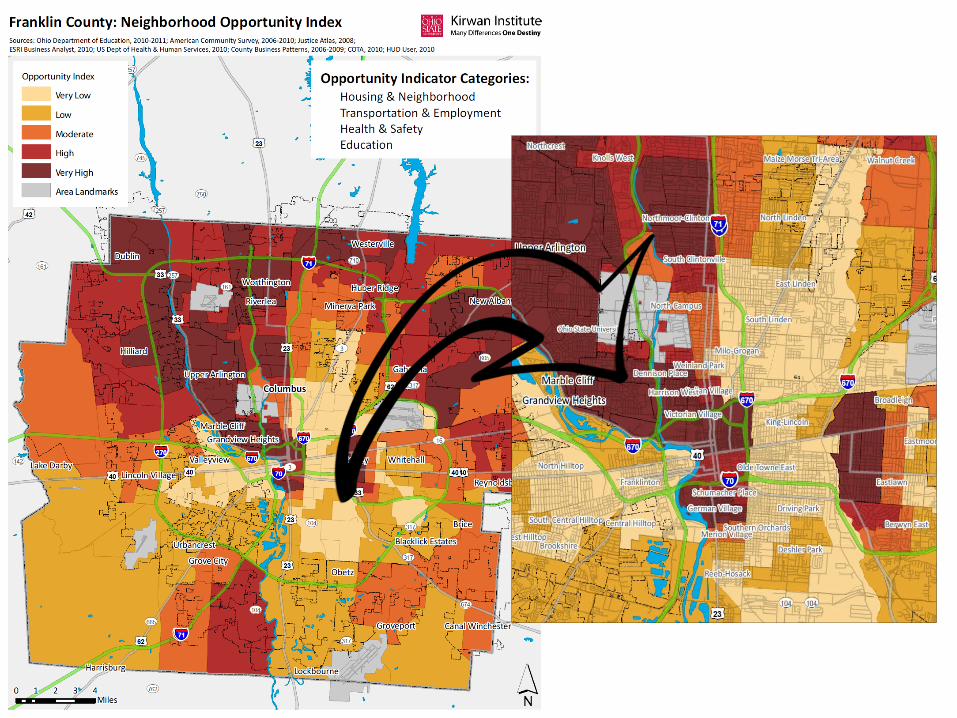
Opportunity Mapping
Median home value
Poverty rate
Vacancy rate
Foreclosure rate
Rate of cost- burdened households
Transit access
Mean commute time
Job access
Unemployment rate
Job growth rate
Medically underserved rating
Number of primary care providers
Incarceration rate
Student poverty
School performance index
Educational attainment
Student attendance rate
Neighborhoods
EducationHealth + Safety
Jobs + Access


Poverty Rate| Franklin County10.3%85,595
12.3%103,705 | +18,100
13.0%121,475 | +17,700
11.6%121,843 | +368
18.2%205,717 | +83,874

1970 2009
Poverty Rate Franklin County | 1970—2009

Growth in Economic Segregation% of Households Living in Poor Neighborhoods and % of Families Living in Affluent
Neighborhoods by Decade for the Columbus Region
8.810.7
12.6 13.916.57.8 5
9.7
13.6
15.6
0
5
10
15
20
25
30
35
1970 1980 1990 2000 2005/2009% Living in Affluent Neighborhoods
% Living in Poor Neighborhoods