Embed Size (px)
Citation preview
CHEMCAD Tutorials
132 CHEMCAD Version 6 User Guide
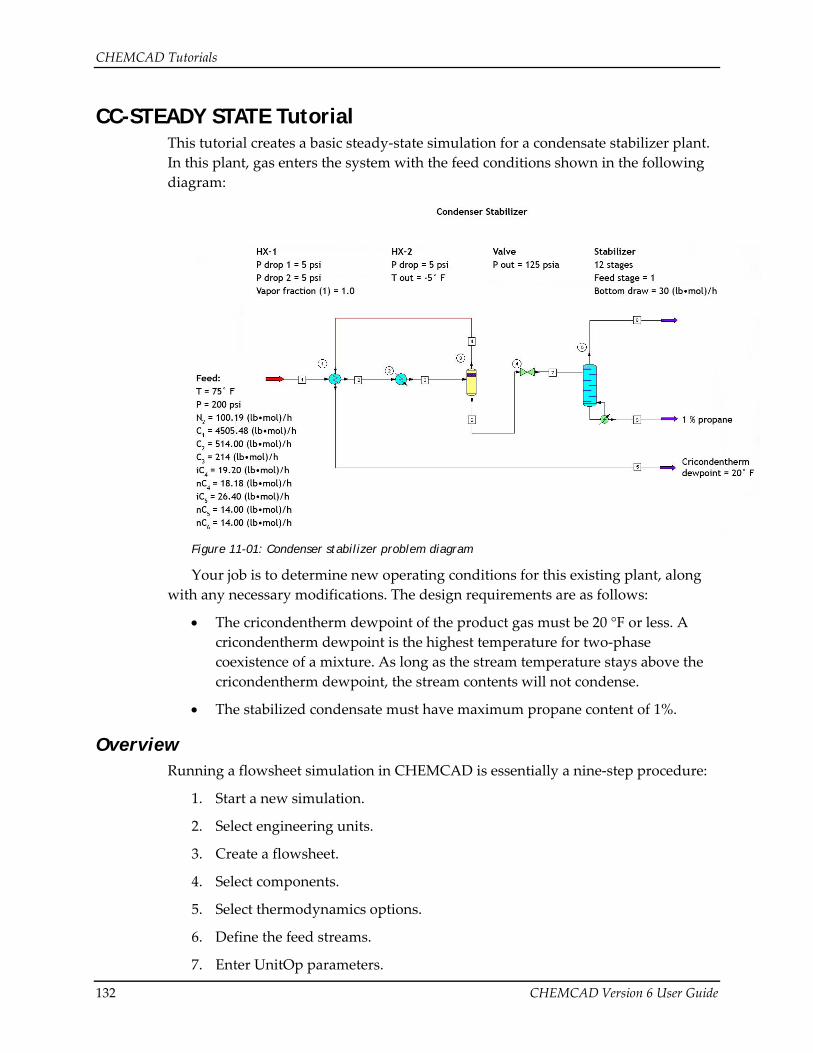
CC-STEADY STATE Tutorial This tutorial creates a basic steady‐state simulation for a condensate stabilizer plant. In this plant, gas enters the system with the feed conditions shown in the following diagram:
Figure 11-01: Condenser stabilizer problem diagram
Your job is to determine new operating conditions for this existing plant, along with any necessary modifications. The design requirements are as follows:
• The cricondentherm dewpoint of the product gas must be 20 °F or less. A cricondentherm dewpoint is the highest temperature for two‐phase coexistence of a mixture. As long as the stream temperature stays above the cricondentherm dewpoint, the stream contents will not condense.
• The stabilized condensate must have maximum propane content of 1%.
Overview Running a flowsheet simulation in CHEMCAD is essentially a nine‐step procedure:
1. Start a new simulation.
2. Select engineering units.
3. Create a flowsheet.
4. Select components.
5. Select thermodynamics options.
6. Define the feed streams.
7. Enter UnitOp parameters.
CHEMCAD Tutorials
CHEMCAD Version 6 User Guide 133
8. Run the simulation.
9. Review the results and print as needed.
The steps do not have to be performed in this order, nor do all of them have to be done for each flowsheet, but you should consider all steps for each problem.
Starting a New Simulation Start by creating a new simulation and giving it a name.
To do this, launch CHEMCAD and then Select File > Save to open the Save As dialog box. Navigate to the directory where you want to store the simulation (try My Simulations, located under My Documents) and give your simulation a name, leaving the type as CHEMCAD 6 (*.cc6). Then click Save to create the file and return to the main CHEMCAD window.
Note: Instead of saving all changes instantly, CHEMCAD now saves your simulation only when you use the Save command. This provides you with greater flexibility and gives you more control over your simulations, but it also means that you should save your work frequently. This is a sound practice for working in any software application, as it can help you avoid losing work in the event of a power problem or computer glitch.
Selecting Engineering Units Select Format > Engineering Units to open the Engineering Unit Selection dialog box.
The English units option is the default and is currently highlighted. To change the engineering units system, you would click the Alt SI, SI, or Metric button; you could then change any of the individual units as well. For this tutorial, you will use English units, so click Cancel to exit this dialog box without making changes.
Drawing the Flowsheet As described in Chapter 5, creating a flowsheet is a matter of placing UnitOp icons on the screen, connecting them with streams, and then adding various graphical objects to enhance the drawing.
Placing UnitOps 1. Start your flowsheet by adding an icon to represent the initial feed stream. In
the All UnitOps palette, find the Feed icon, which is an arrow pointing to the right. Click the Feed icon, then click in the workspace where you want to place the feed stream. When the feed stream arrow appears, go ahead and turn off the Feed drawing tool by right‐clicking any blank area of the workspace.
CHEMCAD Tutorials
134 CHEMCAD Version 6 User Guide
Note: At any time after drawing a feed stream or any UnitOp icon, you can click the icon to display the black sizing handles at each corner. With the icon selected this way, you can click the icon and drag it to a new location, or click any sizing handle and drag it outward or inward to resize the icon.
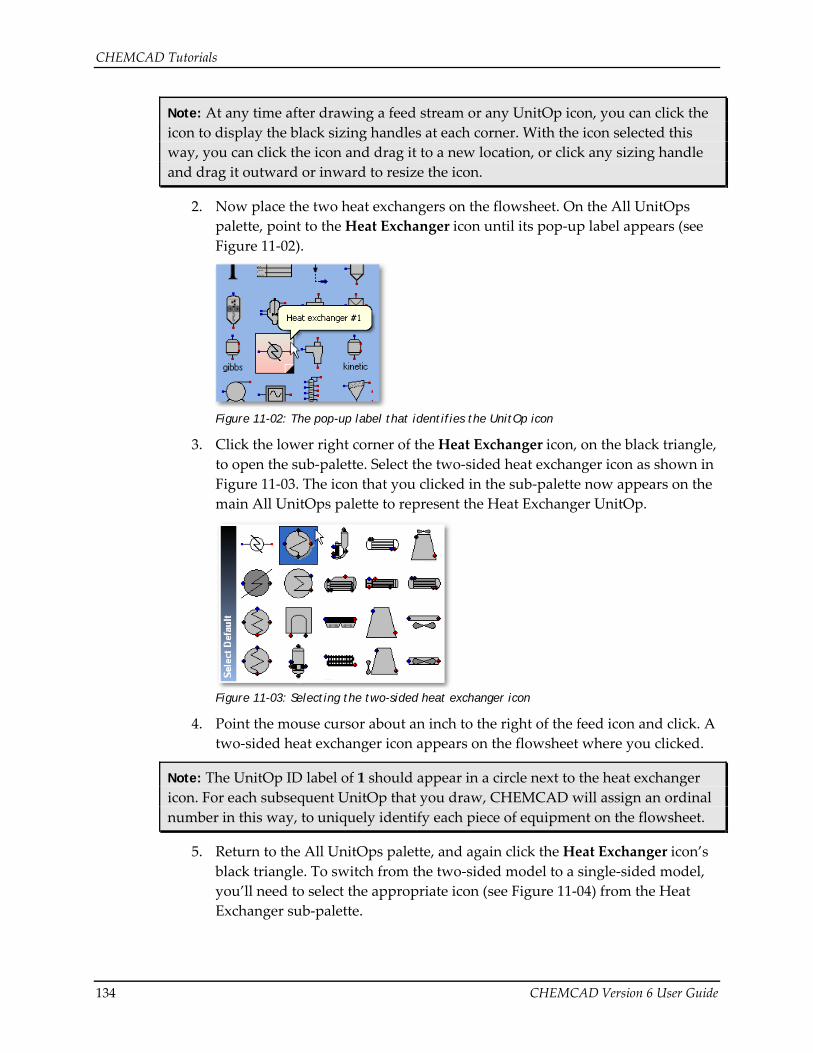
2. Now place the two heat exchangers on the flowsheet. On the All UnitOps palette, point to the Heat Exchanger icon until its pop‐up label appears (see Figure 11‐02).
Figure 11-02: The pop-up label that identifies the UnitOp icon
3. Click the lower right corner of the Heat Exchanger icon, on the black triangle, to open the sub‐palette. Select the two‐sided heat exchanger icon as shown in Figure 11‐03. The icon that you clicked in the sub‐palette now appears on the main All UnitOps palette to represent the Heat Exchanger UnitOp.
Figure 11-03: Selecting the two-sided heat exchanger icon
4. Point the mouse cursor about an inch to the right of the feed icon and click. A two‐sided heat exchanger icon appears on the flowsheet where you clicked.
Note: The UnitOp ID label of 1 should appear in a circle next to the heat exchanger icon. For each subsequent UnitOp that you draw, CHEMCAD will assign an ordinal number in this way, to uniquely identify each piece of equipment on the flowsheet.
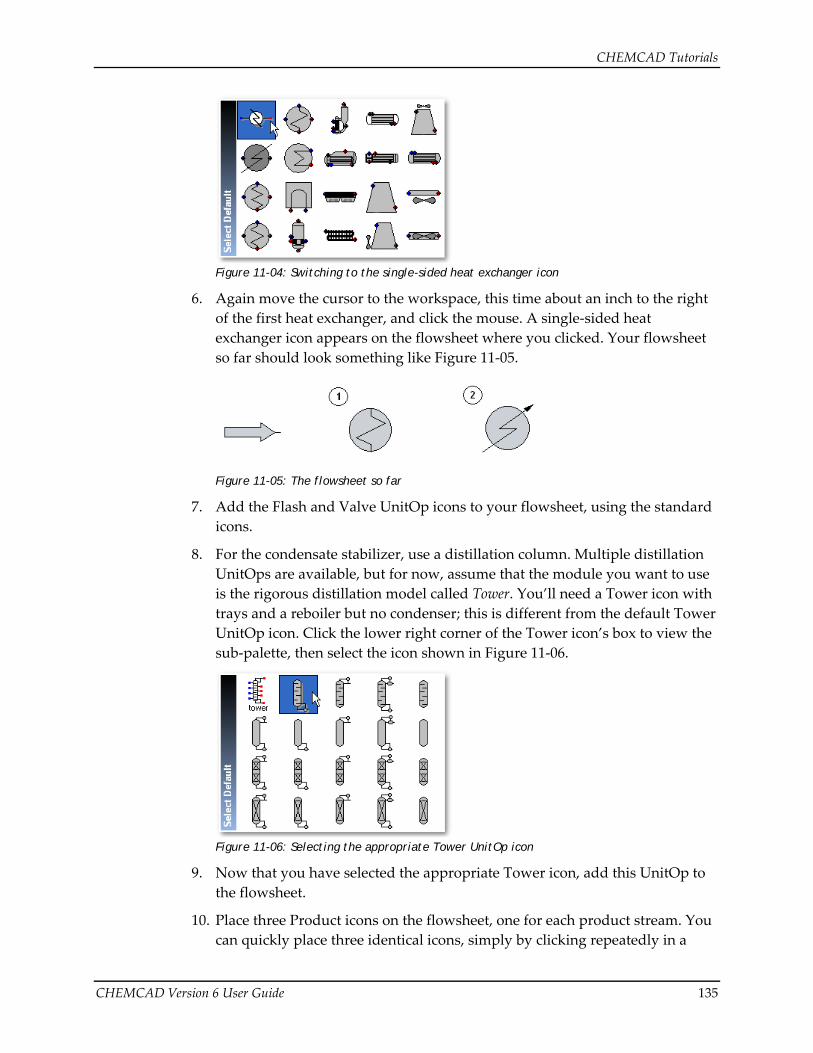
5. Return to the All UnitOps palette, and again click the Heat Exchanger icon’s black triangle. To switch from the two‐sided model to a single‐sided model, you’ll need to select the appropriate icon (see Figure 11‐04) from the Heat Exchanger sub‐palette.
CHEMCAD Tutorials
CHEMCAD Version 6 User Guide 135
Figure 11-04: Switching to the single-sided heat exchanger icon
6. Again move the cursor to the workspace, this time about an inch to the right of the first heat exchanger, and click the mouse. A single‐sided heat exchanger icon appears on the flowsheet where you clicked. Your flowsheet so far should look something like Figure 11‐05.
Figure 11-05: The flowsheet so far
7. Add the Flash and Valve UnitOp icons to your flowsheet, using the standard icons.
8. For the condensate stabilizer, use a distillation column. Multiple distillation UnitOps are available, but for now, assume that the module you want to use is the rigorous distillation model called Tower. You’ll need a Tower icon with trays and a reboiler but no condenser; this is different from the default Tower UnitOp icon. Click the lower right corner of the Tower icon’s box to view the sub‐palette, then select the icon shown in Figure 11‐06.
Figure 11-06: Selecting the appropriate Tower UnitOp icon
9. Now that you have selected the appropriate Tower icon, add this UnitOp to the flowsheet.
10. Place three Product icons on the flowsheet, one for each product stream. You can quickly place three identical icons, simply by clicking repeatedly in a
CHEMCAD Tutorials
136 CHEMCAD Version 6 User Guide
slightly different location. When you’ve clicked to create the third Product icon, right‐click to turn off the Product drawing tool.
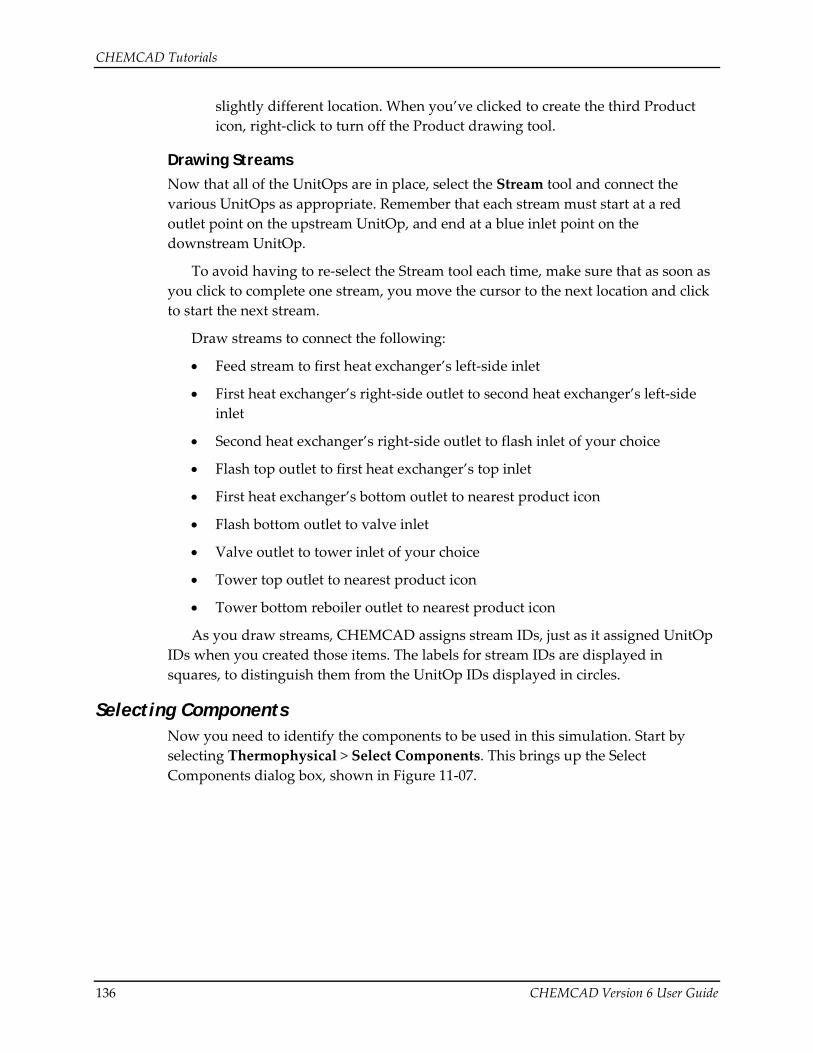
Drawing Streams Now that all of the UnitOps are in place, select the Stream tool and connect the various UnitOps as appropriate. Remember that each stream must start at a red outlet point on the upstream UnitOp, and end at a blue inlet point on the downstream UnitOp.
To avoid having to re‐select the Stream tool each time, make sure that as soon as you click to complete one stream, you move the cursor to the next location and click to start the next stream.
Draw streams to connect the following:
• Feed stream to first heat exchanger’s left‐side inlet
• First heat exchanger’s right‐side outlet to second heat exchanger’s left‐side inlet
• Second heat exchanger’s right‐side outlet to flash inlet of your choice
• Flash top outlet to first heat exchanger’s top inlet
• First heat exchanger’s bottom outlet to nearest product icon
• Flash bottom outlet to valve inlet
• Valve outlet to tower inlet of your choice
• Tower top outlet to nearest product icon
• Tower bottom reboiler outlet to nearest product icon
As you draw streams, CHEMCAD assigns stream IDs, just as it assigned UnitOp IDs when you created those items. The labels for stream IDs are displayed in squares, to distinguish them from the UnitOp IDs displayed in circles.
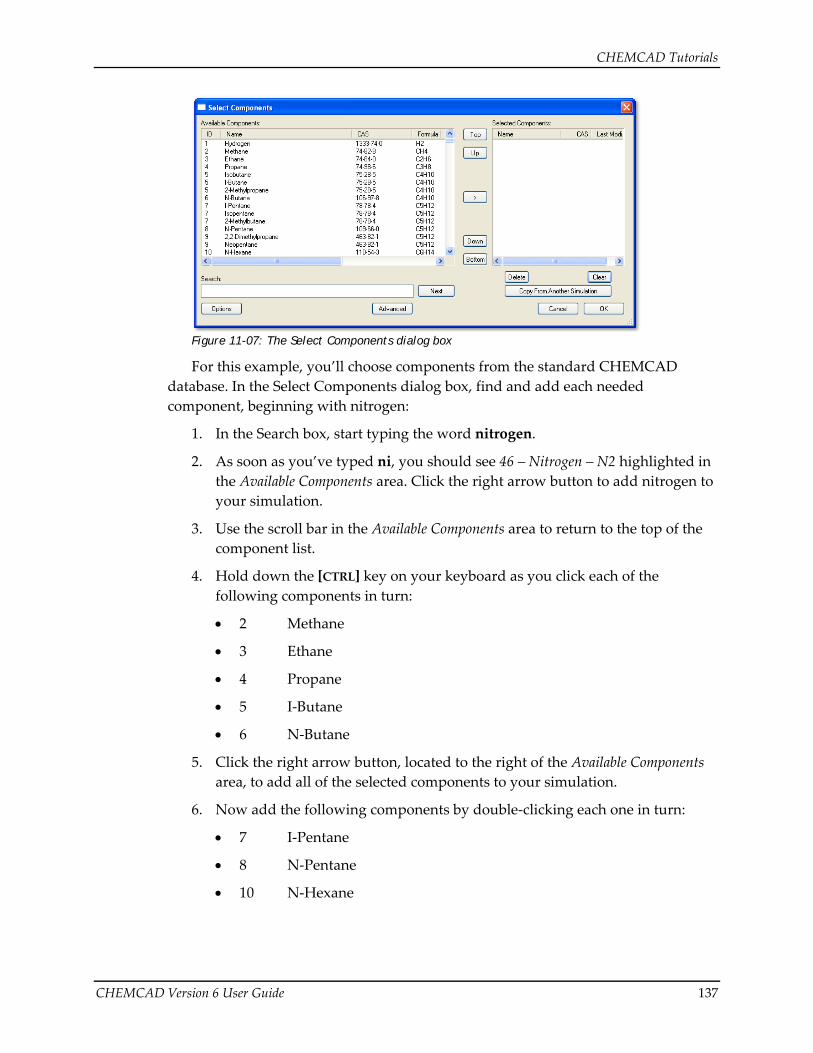
Selecting Components Now you need to identify the components to be used in this simulation. Start by selecting Thermophysical > Select Components. This brings up the Select Components dialog box, shown in Figure 11‐07.
CHEMCAD Tutorials
CHEMCAD Version 6 User Guide 137
Figure 11-07: The Select Components dialog box
For this example, you’ll choose components from the standard CHEMCAD database. In the Select Components dialog box, find and add each needed component, beginning with nitrogen:
1. In the Search box, start typing the word nitrogen.
2. As soon as you’ve typed ni, you should see 46 – Nitrogen – N2 highlighted in the Available Components area. Click the right arrow button to add nitrogen to your simulation.
3. Use the scroll bar in the Available Components area to return to the top of the component list.
4. Hold down the [CTRL] key on your keyboard as you click each of the following components in turn:
• 2 Methane
• 3 Ethane
• 4 Propane
• 5 I‐Butane
• 6 N‐Butane
5. Click the right arrow button, located to the right of the Available Components area, to add all of the selected components to your simulation.
6. Now add the following components by double‐clicking each one in turn:
• 7 I‐Pentane
• 8 N‐Pentane
• 10 N‐Hexane
CHEMCAD Tutorials
138 CHEMCAD Version 6 User Guide
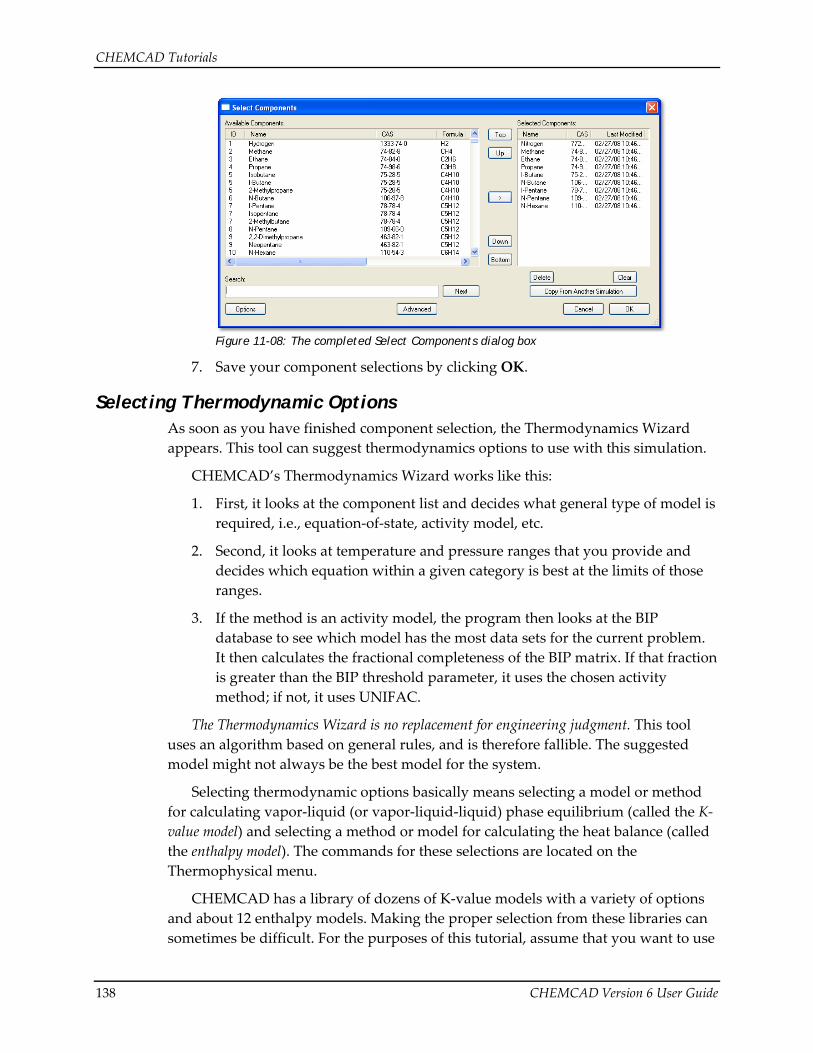
Figure 11-08: The completed Select Components dialog box
7. Save your component selections by clicking OK.
Selecting Thermodynamic Options As soon as you have finished component selection, the Thermodynamics Wizard appears. This tool can suggest thermodynamics options to use with this simulation.
CHEMCAD’s Thermodynamics Wizard works like this:
1. First, it looks at the component list and decides what general type of model is required, i.e., equation‐of‐state, activity model, etc.
2. Second, it looks at temperature and pressure ranges that you provide and decides which equation within a given category is best at the limits of those ranges.
3. If the method is an activity model, the program then looks at the BIP database to see which model has the most data sets for the current problem. It then calculates the fractional completeness of the BIP matrix. If that fraction is greater than the BIP threshold parameter, it uses the chosen activity method; if not, it uses UNIFAC.
The Thermodynamics Wizard is no replacement for engineering judgment. This tool uses an algorithm based on general rules, and is therefore fallible. The suggested model might not always be the best model for the system.
Selecting thermodynamic options basically means selecting a model or method for calculating vapor‐liquid (or vapor‐liquid‐liquid) phase equilibrium (called the K‐value model) and selecting a method or model for calculating the heat balance (called the enthalpy model). The commands for these selections are located on the Thermophysical menu.
CHEMCAD has a library of dozens of K‐value models with a variety of options and about 12 enthalpy models. Making the proper selection from these libraries can sometimes be difficult. For the purposes of this tutorial, assume that you want to use
CHEMCAD Tutorials
CHEMCAD Version 6 User Guide 139
the Peng‐Robinson method for both the K‐value and enthalpy calculations. Follow these steps to select your thermophysical options:
1. Accept the default temperature and pressure ranges in the Thermodynamics Wizard and click OK.
2. Click OK again to accept the wizard’s suggested method of SRK.
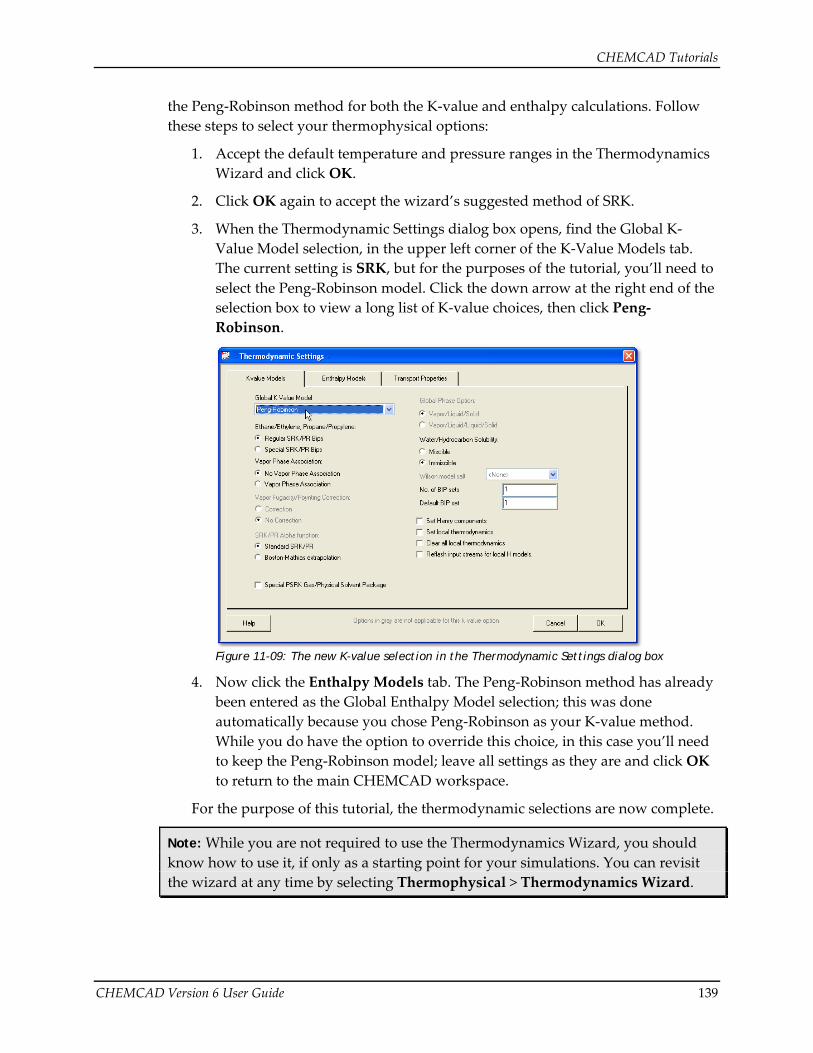
3. When the Thermodynamic Settings dialog box opens, find the Global K‐Value Model selection, in the upper left corner of the K‐Value Models tab. The current setting is SRK, but for the purposes of the tutorial, you’ll need to select the Peng‐Robinson model. Click the down arrow at the right end of the selection box to view a long list of K‐value choices, then click Peng‐Robinson.
Figure 11-09: The new K-value selection in the Thermodynamic Settings dialog box
4. Now click the Enthalpy Models tab. The Peng‐Robinson method has already been entered as the Global Enthalpy Model selection; this was done automatically because you chose Peng‐Robinson as your K‐value method. While you do have the option to override this choice, in this case you’ll need to keep the Peng‐Robinson model; leave all settings as they are and click OK to return to the main CHEMCAD workspace.
For the purpose of this tutorial, the thermodynamic selections are now complete.
Note: While you are not required to use the Thermodynamics Wizard, you should know how to use it, if only as a starting point for your simulations. You can revisit the wizard at any time by selecting Thermophysical > Thermodynamics Wizard.
CHEMCAD Tutorials
140 CHEMCAD Version 6 User Guide
Defining the Feed Streams Now it’s time to define your simulation’s feed stream. There are several ways that you can do this, but the quickest and most efficient way to define a single stream is to double‐click the stream line.
Note: Before you proceed, verify that your engineering units are set to English in the Engineering Unit Selection dialog box, as described earlier in this tutorial.
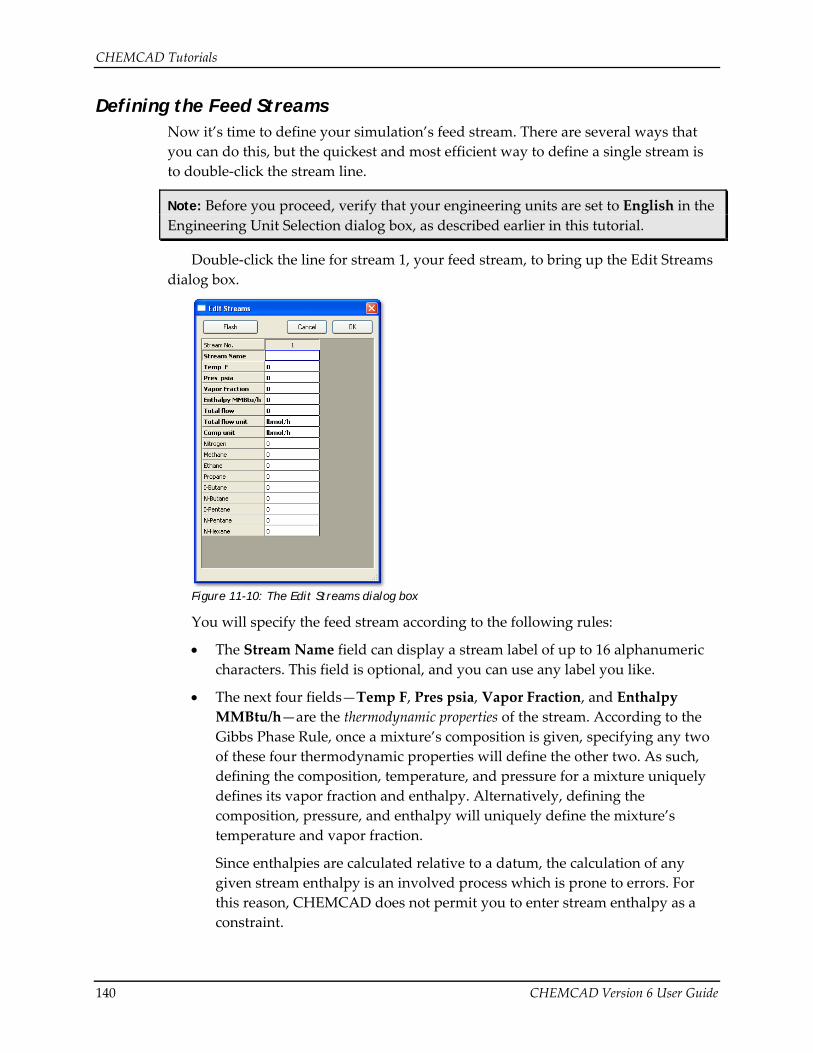
Double‐click the line for stream 1, your feed stream, to bring up the Edit Streams dialog box.
Figure 11-10: The Edit Streams dialog box
You will specify the feed stream according to the following rules:
• The Stream Name field can display a stream label of up to 16 alphanumeric characters. This field is optional, and you can use any label you like.
• The next four fields—Temp F, Pres psia, Vapor Fraction, and Enthalpy MMBtu/h—are the thermodynamic properties of the stream. According to the Gibbs Phase Rule, once a mixture’s composition is given, specifying any two of these four thermodynamic properties will define the other two. As such, defining the composition, temperature, and pressure for a mixture uniquely defines its vapor fraction and enthalpy. Alternatively, defining the composition, pressure, and enthalpy will uniquely define the mixture’s temperature and vapor fraction.
Since enthalpies are calculated relative to a datum, the calculation of any given stream enthalpy is an involved process which is prone to errors. For this reason, CHEMCAD does not permit you to enter stream enthalpy as a constraint.
CHEMCAD Tutorials
CHEMCAD Version 6 User Guide 141
In addition to defining the stream’s composition, you must define exactly two of the following properties: temperature, pressure, and vapor fraction. The two variables that you specify will display as red text, while the third variable and the value enthalpy will be displayed in black when you flash the stream.
An exception to this convention allows you to add heat duty with an empty stream. If you specify a total component flow rate of zero, you may specify a temperature, pressure, and enthalpy rate. A stream defined this way is treated as a heat duty, and is added to the heat balance of the unit. The temperature and pressure are arbitrary for this situation.
• The Total flow unit and Comp unit fields work together to provide a variety of ways to define stream compositions. If the selected comp unit is mole, mass, or volume fraction (either globally or locally), then the Total flow unit selection is available. If the selected comp unit is a flow or amount option, then the total flow rate becomes the sum of the component flow rates, and the Total flow unit selection is not available.
• If the Comp unit field selection is an amount flow unit (as opposed to a fractional unit), then the component flow rate values are automatically added as you enter them. The current sum is displayed in the Total flow field.
• You can click the Flash button at any time to perform a flash calculation using the currently specified composition and thermodynamic properties. This enables you to obtain flash calculations quickly and without leaving the dialog box.
• Fractions that do not add up to 1.0 are automatically normalized when you either click Flash or exit the dialog box.
With these rules and behaviors in mind, enter the data for your feed stream.
1. Begin with the stream temperature. Click the Temp F label, then click the empty field to its right. Type 75 and then press the down arrow key on your keyboard to continue.
2. Type 200 in the Pres psia field, then press the down arrow key several times until you arrive at the Nitrogen field.
Note: Before you continue, verify that the Comp unit field is set to lbmol/h.
3. Type 100.19 in the Nitrogen field, and then in similar fashion, type the following numbers in the corresponding fields:
• Methane: 4505.48
• Ethane: 514
• Propane: 214
• I‐Butane: 19.2
CHEMCAD Tutorials
142 CHEMCAD Version 6 User Guide
• N‐Butane: 18.18
• I‐Pentane: 26.4
• N‐Pentane: 14
• N‐Hexane: 14
4. Click OK to save this stream information and return to the main CHEMCAD workspace.
Enter UnitOp Parameters Now that you’ve specified your feed stream properties, it’s time to specify the characteristics of your UnitOps. The following sections address each UnitOp in turn.
Note: As with streams, you can enter UnitOp parameters in various ways, but for the purposes of this tutorial, we’ll use the quickest and simplest method, double‐clicking each UnitOp to access its specification dialog box.
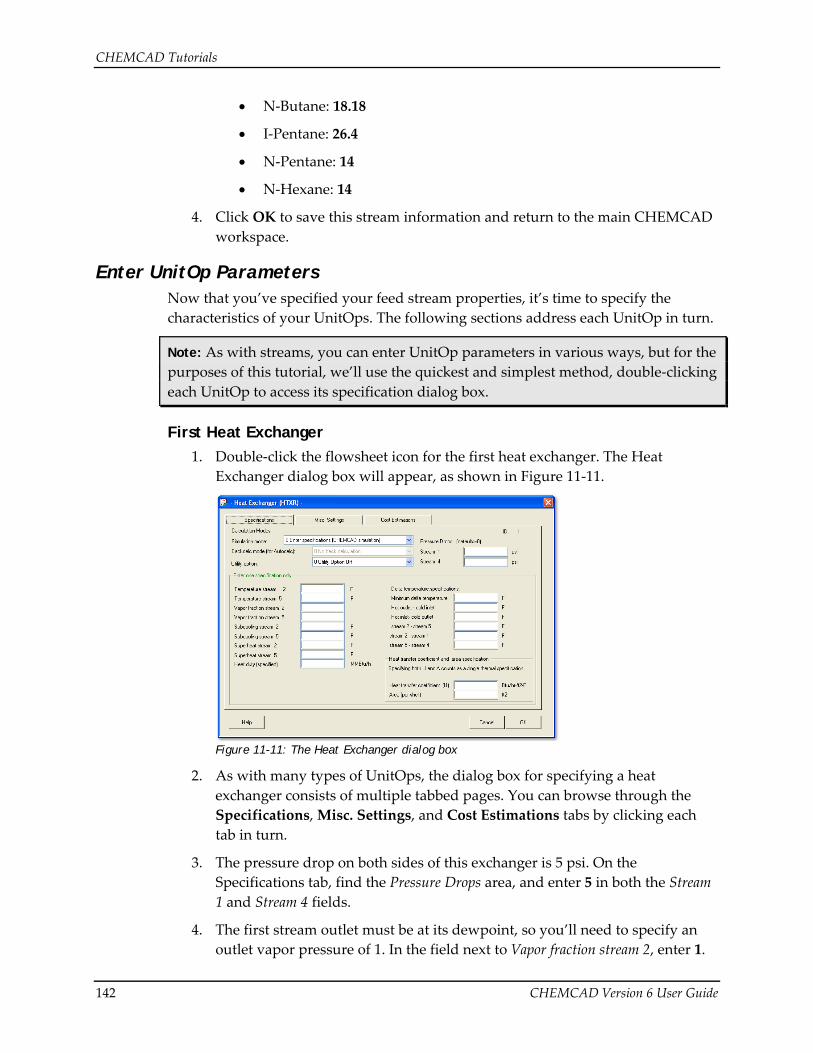
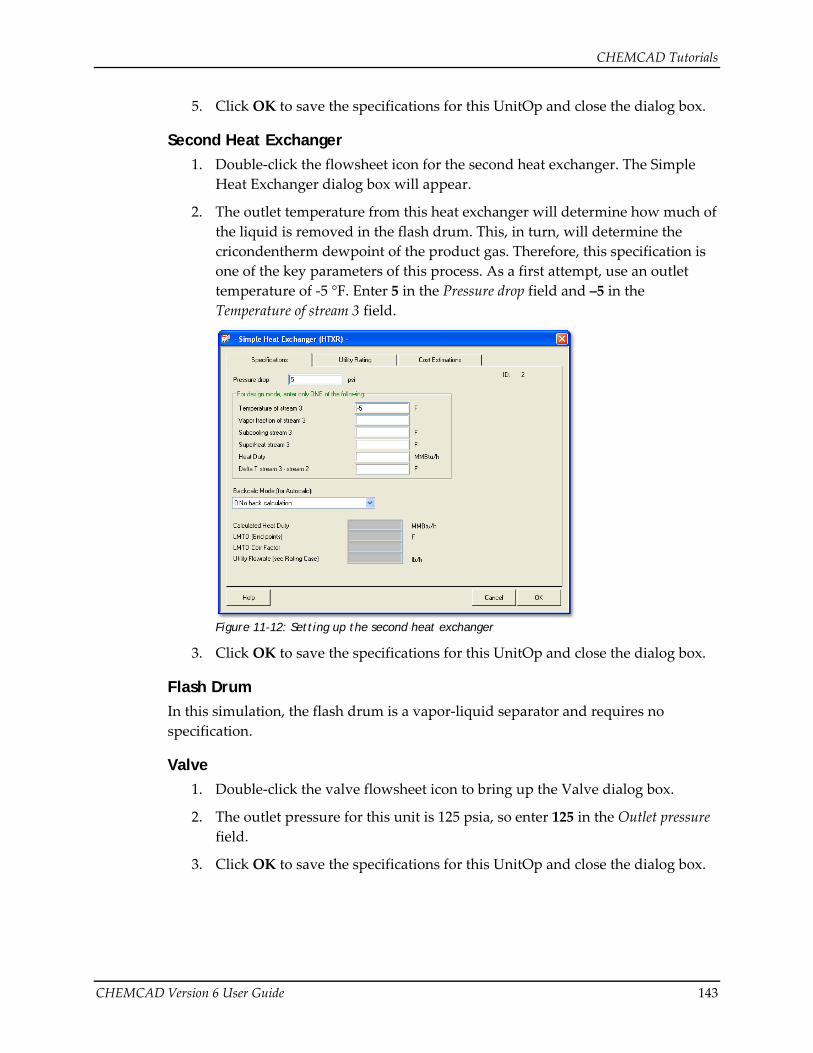
First Heat Exchanger 1. Double‐click the flowsheet icon for the first heat exchanger. The Heat
Exchanger dialog box will appear, as shown in Figure 11‐11.
Figure 11-11: The Heat Exchanger dialog box
2. As with many types of UnitOps, the dialog box for specifying a heat exchanger consists of multiple tabbed pages. You can browse through the Specifications, Misc. Settings, and Cost Estimations tabs by clicking each tab in turn.
3. The pressure drop on both sides of this exchanger is 5 psi. On the Specifications tab, find the Pressure Drops area, and enter 5 in both the Stream 1 and Stream 4 fields.
4. The first stream outlet must be at its dewpoint, so you’ll need to specify an outlet vapor pressure of 1. In the field next to Vapor fraction stream 2, enter 1.
CHEMCAD Tutorials
CHEMCAD Version 6 User Guide 143
5. Click OK to save the specifications for this UnitOp and close the dialog box.
Second Heat Exchanger 1. Double‐click the flowsheet icon for the second heat exchanger. The Simple
Heat Exchanger dialog box will appear.
2. The outlet temperature from this heat exchanger will determine how much of the liquid is removed in the flash drum. This, in turn, will determine the cricondentherm dewpoint of the product gas. Therefore, this specification is one of the key parameters of this process. As a first attempt, use an outlet temperature of ‐5 °F. Enter 5 in the Pressure drop field and –5 in the Temperature of stream 3 field.
Figure 11-12: Setting up the second heat exchanger
3. Click OK to save the specifications for this UnitOp and close the dialog box.
Flash Drum In this simulation, the flash drum is a vapor‐liquid separator and requires no specification.
Valve 1. Double‐click the valve flowsheet icon to bring up the Valve dialog box.
2. The outlet pressure for this unit is 125 psia, so enter 125 in the Outlet pressure field.
3. Click OK to save the specifications for this UnitOp and close the dialog box.
CHEMCAD Tutorials
144 CHEMCAD Version 6 User Guide
Stabilizer Tower 1. Double‐click the tower icon to open the TOWR Distillation Column dialog
box. Note that the settings for this UnitOp are divided into five tabs.
2. On the General tab, enter the following:
• Colm press drop: 5
• No. of stages: 12
• Feed tray for stream: 1
3. Click the Specifications tab to make specifications for the column. This column has no condenser or side streams, so you will only be making specifications for the reboiler. Drop down the list of options for Select reboiler mode, and select the mode called 4 Bottom mole flowrate.
4. Now you need to specify the numeric value of the reboiler flow rate. In the Specification field immediately to the right of your reboiler mode selection, enter a value of 30.
5. Click OK to save the specifications for this UnitOp and return to the main CHEMCAD workspace.
All of the data entry for the flowsheet is now complete. Before you continue, you should save your simulation. As noted earlier, it’s a good idea to do this periodically as you build the simulation, but completion of your UnitOp specifications is a particularly good time to stop and save.
Run the Simulation To run the simulation, click the Run All button on the toolbar.
The program first rechecks the data and lists any errors and warnings in the Messages pane. In this case, you should have no errors, although you will have warnings about estimates you have not given. You can ignore these warnings and proceed by clicking Yes. The calculation will then proceed.
When the run finishes, a message box appears: Recycle calculation has converged. To close this dialog box and clear the screen, click OK.
Review the Results and Print as Needed Before running and printing reports and plots, you should review the simulation to verify whether it meets the design criteria set out for this problem.
Checking the Cricondentherm Dewpoint If you have chosen the proper outlet temperature for the second heat exchanger, the cricondentherm dewpoint for the product gas stream (stream 5) will be 20 °F or less. The cricondentherm dewpoint, you will recall, is the highest dewpoint temperature a mixture will ever see at any pressure. The simplest way to identify the highest
CHEMCAD Tutorials
CHEMCAD Version 6 User Guide 145
dewpoint temperature of the product gas is to plot all of the dewpoint temperatures of the product gas, i.e., to plot a phase envelope.
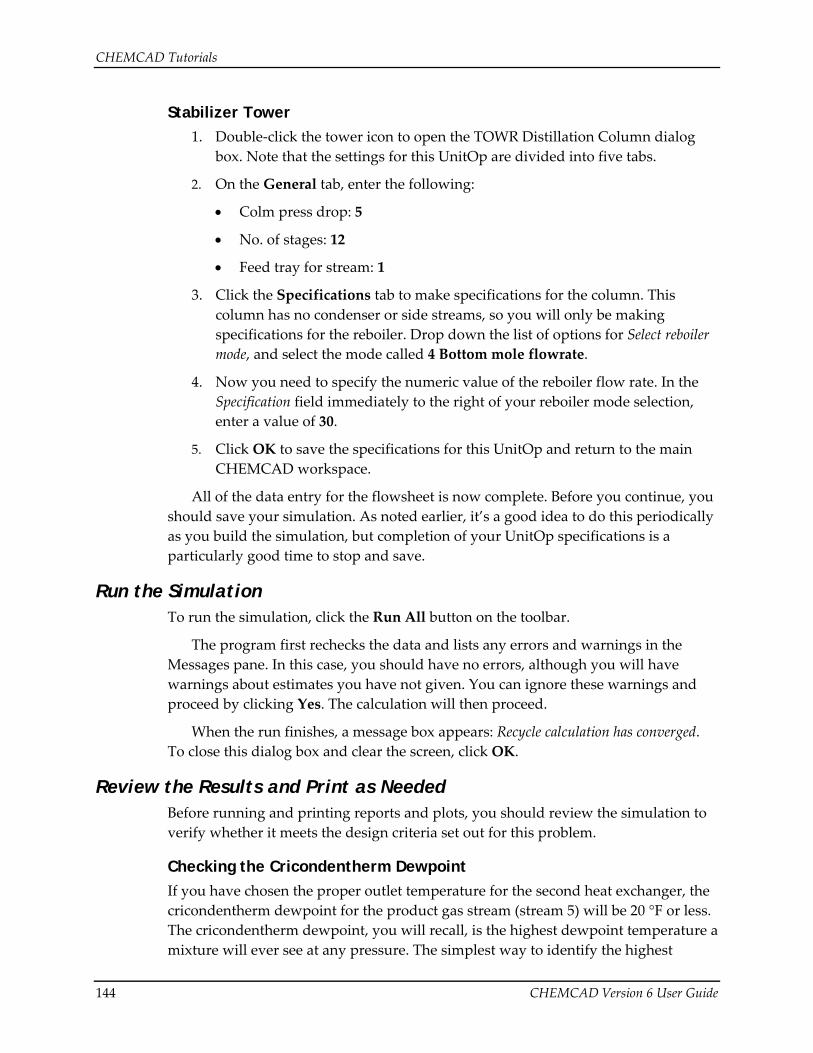
1. Start with the Plot menu, which provides access to all types of graphical reports. Select Plot > Phase Envelopes. In the Select Streams dialog box, specify stream 5, then click OK to bring up the Phase Envelope dialog box.
2. No entries are required on this screen since you only need to look at the dewpoint line, but to make the plot more interesting, display the 0.25 and the 0.5 vapor fraction lines in addition to the normal phase envelope boundaries. Complete the dialog box as shown in Figure 11‐13.
Figure 11-13: Plotting vapor fraction lines along with the cricondentherm dewpoint
3. Click OK to continue. CHEMCAD perform the required flash calculations to generate the specified phase envelope. Phase envelope results are produced in two formats:
• A numerical tabulation (table) of the temperature, pressure, vapor fraction, vapor compressibility factor, and the liquid compressibility factor
• A graphical plot of temperature and pressure for each vapor fraction line requested
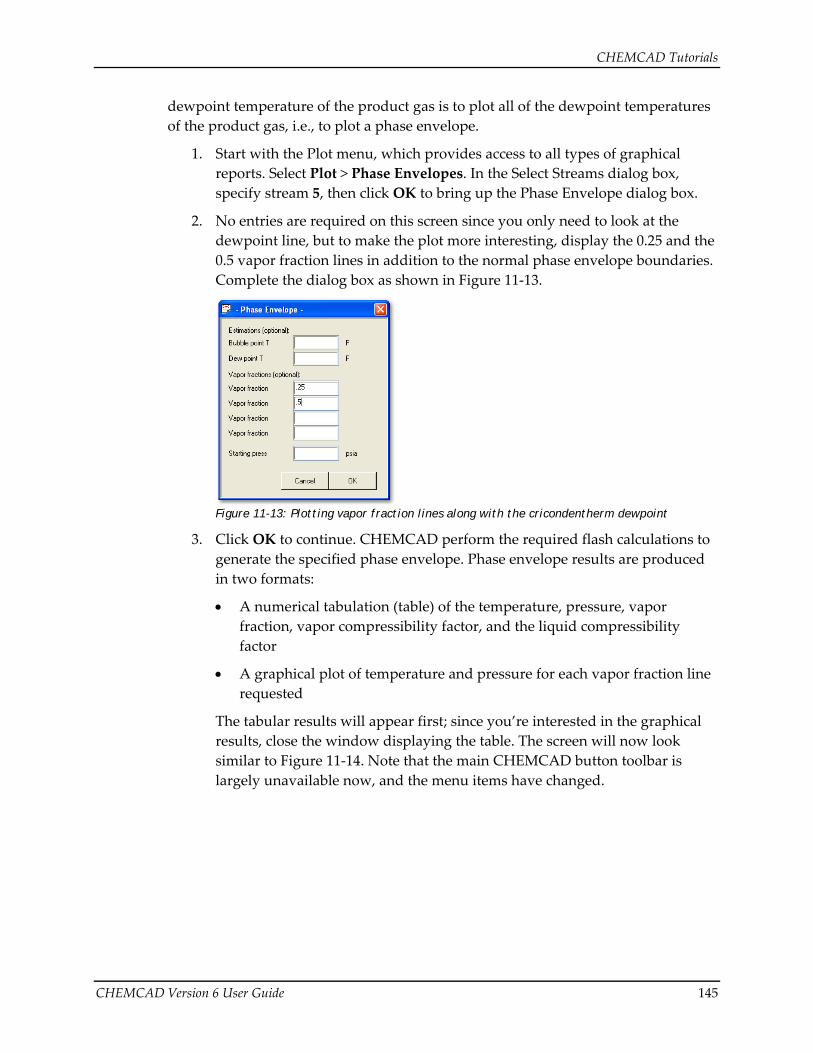
The tabular results will appear first; since you’re interested in the graphical results, close the window displaying the table. The screen will now look similar to Figure 11‐14. Note that the main CHEMCAD button toolbar is largely unavailable now, and the menu items have changed.
CHEMCAD Tutorials
146 CHEMCAD Version 6 User Guide
Figure 11-14: Phase envelope plot results
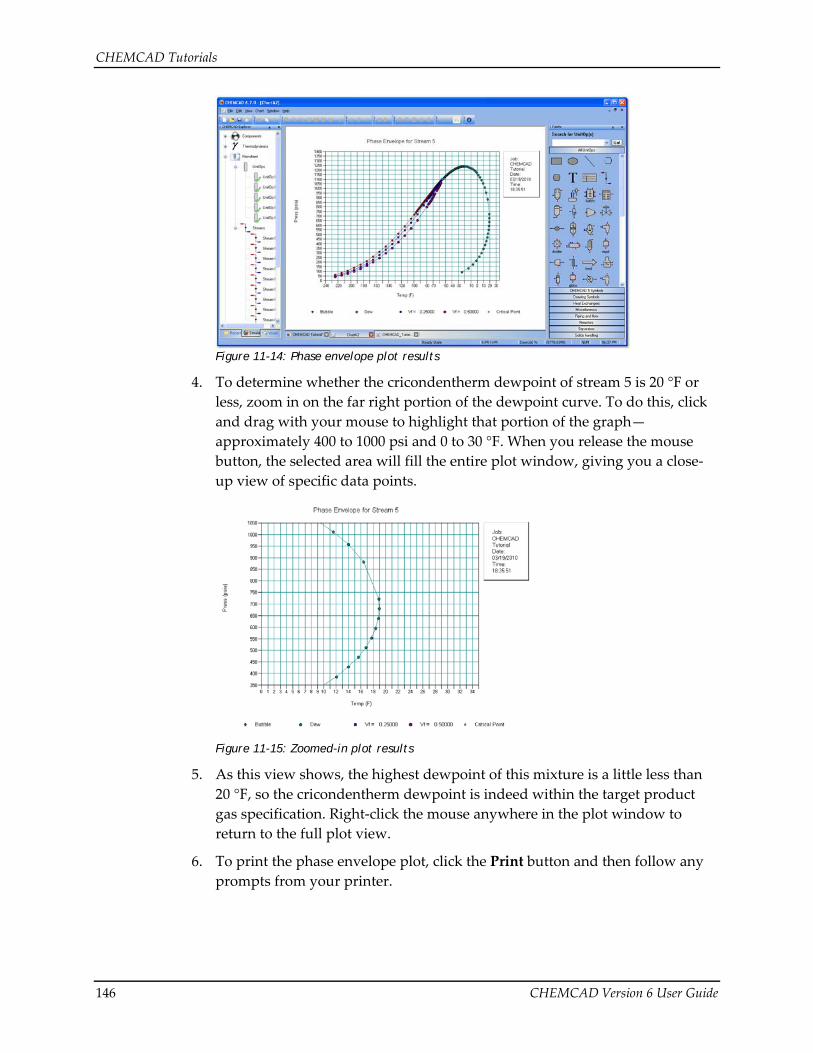
4. To determine whether the cricondentherm dewpoint of stream 5 is 20 °F or less, zoom in on the far right portion of the dewpoint curve. To do this, click and drag with your mouse to highlight that portion of the graph—approximately 400 to 1000 psi and 0 to 30 °F. When you release the mouse button, the selected area will fill the entire plot window, giving you a close‐up view of specific data points.
Figure 11-15: Zoomed-in plot results
5. As this view shows, the highest dewpoint of this mixture is a little less than 20 °F, so the cricondentherm dewpoint is indeed within the target product gas specification. Right‐click the mouse anywhere in the plot window to return to the full plot view.
6. To print the phase envelope plot, click the Print button and then follow any prompts from your printer.
CHEMCAD Tutorials
CHEMCAD Version 6 User Guide 147
7. You can also try the following to practice working with plots in CHEMCAD:
• Edit the text of the plot title (in this case, Phase Envelope for Stream 5) or the graph axis labels by selecting Chart > Edit Titles. In the Chart Titles dialog box, make any desired changes and then click OK to view the updated chart.
• Select Chart > Edit to open the Chart Explorer, which provides access to settings for color, size, layout, and various other aspects of the plot presentation.
8. Return to the main simulation window by clicking the chart tab’s red x button, or leave the chart window open and click the main simulation tab at the bottom left of the CHEMCAD workspace.
Checking the Bottoms Stream Purity This problem also requires that the percent of propane in stream 9 be 1%. You can check to see if you’ve achieved this specification by checking the stream composition report available on the Report menu. First, though, you’ll need to set the flow units for the stream composition.
1. Select Report > Set Flow Units to bring up the View Flow Rate Unit dialog box. Click the Mole % button and then click OK to apply this selection and close the dialog box.
2. Now select Report > Stream Compositions > Select Streams. In the Select Streams dialog box, type 9 and then click OK to continue.
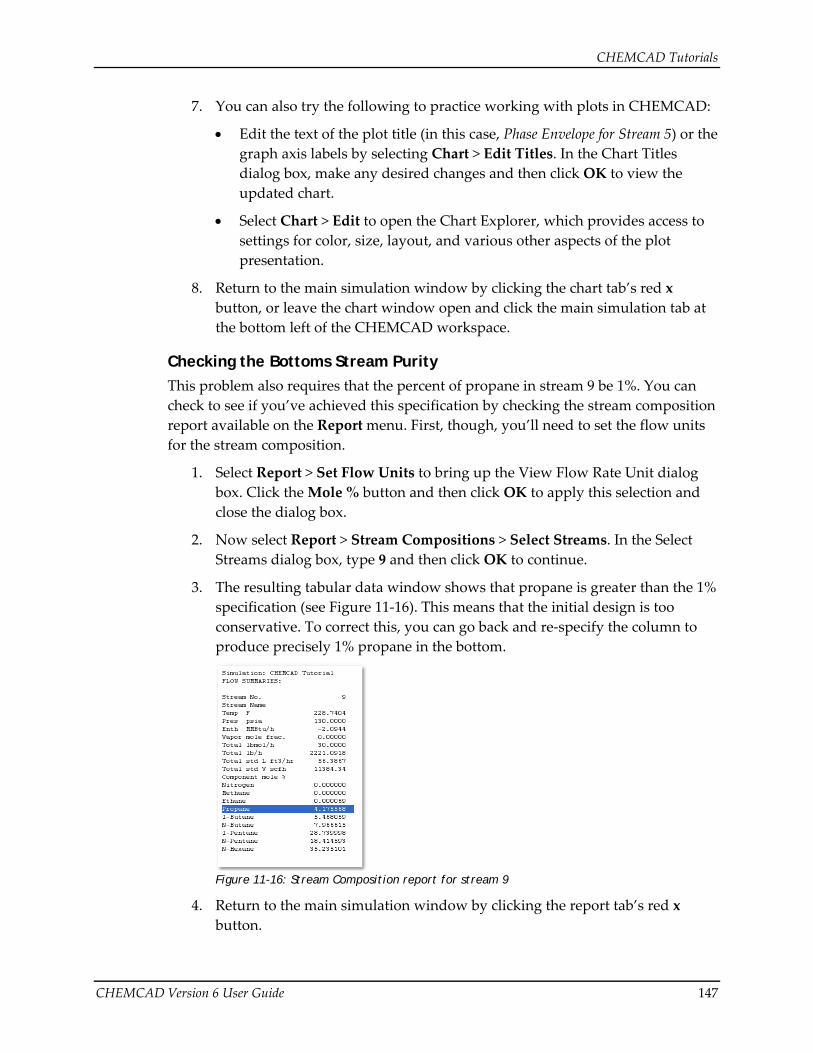
3. The resulting tabular data window shows that propane is greater than the 1% specification (see Figure 11‐16). This means that the initial design is too conservative. To correct this, you can go back and re‐specify the column to produce precisely 1% propane in the bottom.
Figure 11-16: Stream Composition report for stream 9
4. Return to the main simulation window by clicking the report tab’s red x button.
CHEMCAD Tutorials
148 CHEMCAD Version 6 User Guide
Re-running the Simulation You can now re‐run the stabilizer, specifying that you want 1% propane in the bottom.
1. Double‐click the Tower UnitOp to bring up the TOWR Distillation Column dialog box for the stabilizer.
2. Click the Specifications tab. You need to change the reboiler mode from 4 Bottom mole flowrate to a purity specification. Click the Select reboilers mode drop‐down list and select 6 Bottom component mole fraction.
3. With this change of mode, you need to specify the desired purity and the component for which it is being specified. In the Specification field, enter .01. In the Component drop‐down list, select 4 Propane.
4. Click OK to save your changes and return to the main CHEMCAD workspace.
5. You can now re‐run the calculations for the condensate stabilizer. While you could accomplish this using the Run All command, it’s more efficient to re‐run only the UnitOp that you have changed. The quickest way to do this is to right‐click the UnitOp icon on the flowsheet and select Run this UnitOp. Run the Tower UnitOp using this method.
As soon as you see the Run finished message in the bottom left corner of the CHEMCAD window, you can check on the propane content of the bottom stream. You’ve already seen how to get a detailed Stream Composition report; you can also use the Flowsheet Quickview feature to get instant stream information without even clicking the mouse.
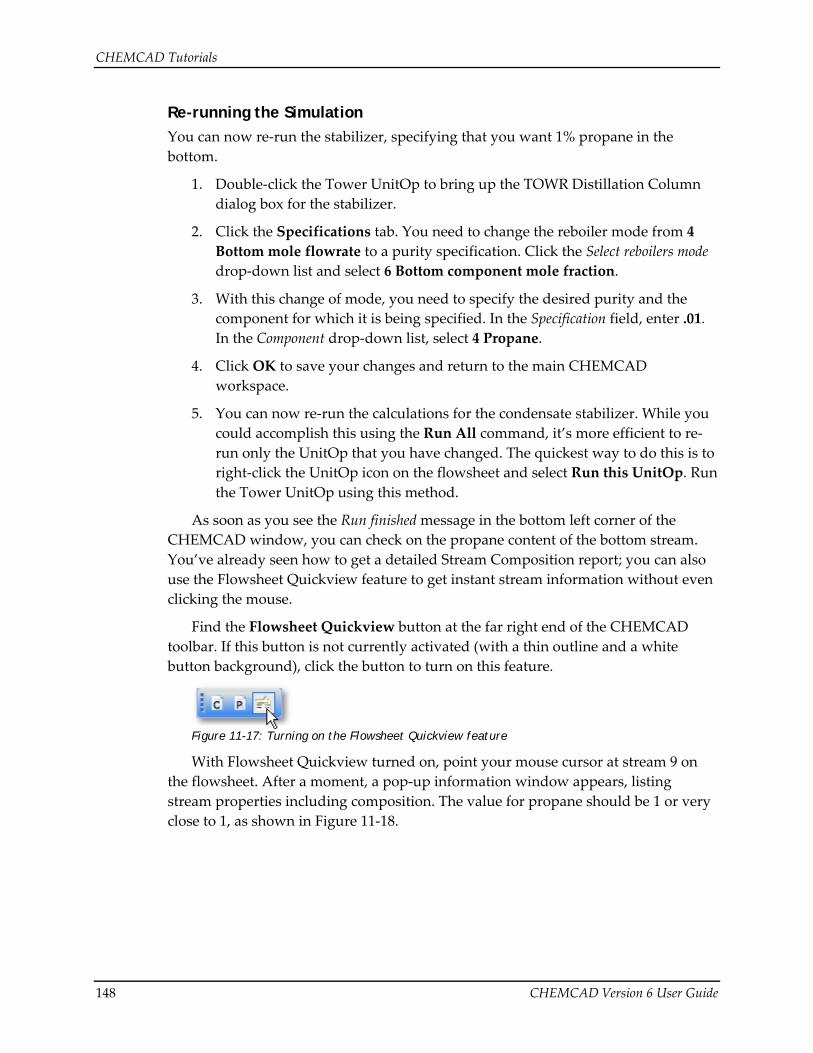
Find the Flowsheet Quickview button at the far right end of the CHEMCAD toolbar. If this button is not currently activated (with a thin outline and a white button background), click the button to turn on this feature.
Figure 11-17: Turning on the Flowsheet Quickview feature
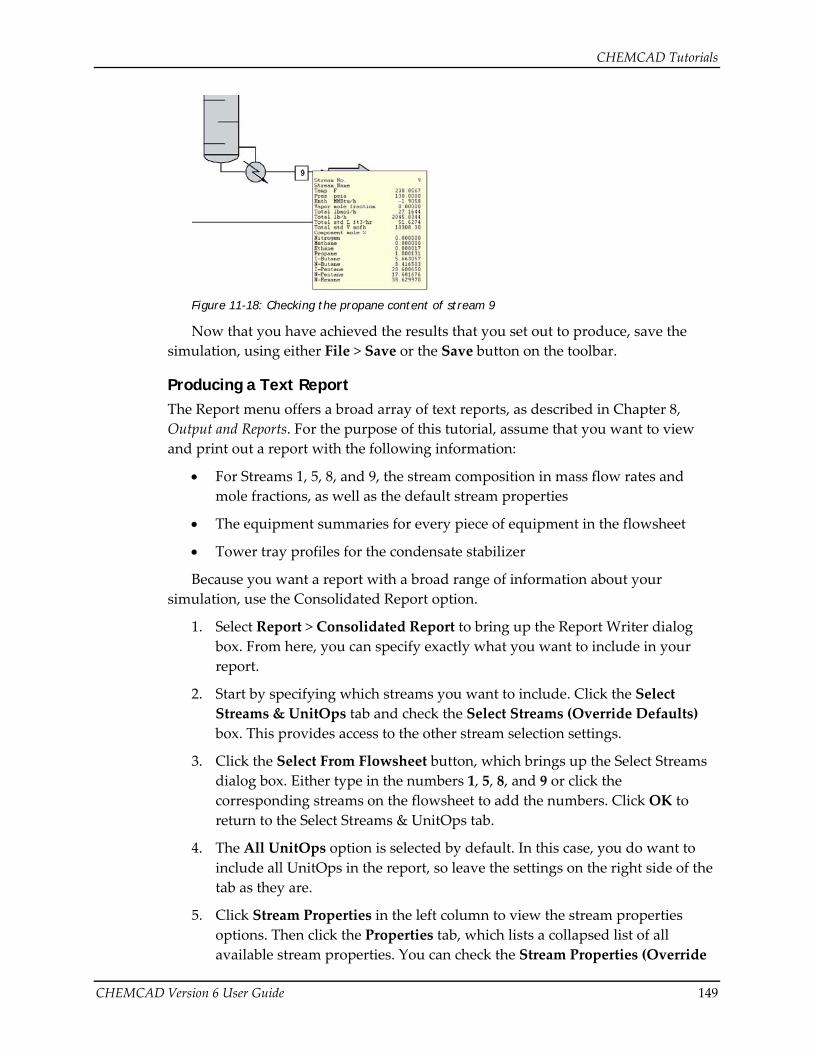
With Flowsheet Quickview turned on, point your mouse cursor at stream 9 on the flowsheet. After a moment, a pop‐up information window appears, listing stream properties including composition. The value for propane should be 1 or very close to 1, as shown in Figure 11‐18.
CHEMCAD Tutorials
CHEMCAD Version 6 User Guide 149
Figure 11-18: Checking the propane content of stream 9
Now that you have achieved the results that you set out to produce, save the simulation, using either File > Save or the Save button on the toolbar.
Producing a Text Report The Report menu offers a broad array of text reports, as described in Chapter 8, Output and Reports. For the purpose of this tutorial, assume that you want to view and print out a report with the following information:
• For Streams 1, 5, 8, and 9, the stream composition in mass flow rates and mole fractions, as well as the default stream properties
• The equipment summaries for every piece of equipment in the flowsheet
• Tower tray profiles for the condensate stabilizer
Because you want a report with a broad range of information about your simulation, use the Consolidated Report option.
1. Select Report > Consolidated Report to bring up the Report Writer dialog box. From here, you can specify exactly what you want to include in your report.
2. Start by specifying which streams you want to include. Click the Select Streams & UnitOps tab and check the Select Streams (Override Defaults) box. This provides access to the other stream selection settings.
3. Click the Select From Flowsheet button, which brings up the Select Streams dialog box. Either type in the numbers 1, 5, 8, and 9 or click the corresponding streams on the flowsheet to add the numbers. Click OK to return to the Select Streams & UnitOps tab.
4. The All UnitOps option is selected by default. In this case, you do want to include all UnitOps in the report, so leave the settings on the right side of the tab as they are.
5. Click Stream Properties in the left column to view the stream properties options. Then click the Properties tab, which lists a collapsed list of all available stream properties. You can check the Stream Properties (Override
CHEMCAD Tutorials
150 CHEMCAD Version 6 User Guide
Defaults) box to explore the various properties and see which ones are selected, but for the purpose of this tutorial, use the default settings on this tab.
6. Click Stream Composition in the left column to view the stream composition options. Then click the Stream Compositions tab, which lists available and selected flow options. Click the Stream Composition (Override Defaults) box to gain access to these options. Keep the Mass Flow Rate option, and double‐click Mole Fractions in the left column to add this option to the list of selected flow options at right.
7. Finally, verify that the Tray profile report section is included in the Consolidated Report. You can also delete any report sections that you don’t need, and re‐order the desired sections to suit your needs.
8. Click Generate to run and display the report. You can now review the results, re‐run if desired, save the report for later use, and print the report as needed.
9. When you finish reviewing and working with the report, click Cancel to close the Report Writer dialog box and return to the main CHEMCAD workspace.
Generating a Process Flow Diagram As you know, the streams and UnitOps on a flowsheet only tell part of the story of your process. Fortunately, CHEMCAD provides many features to help you add the extra content needed to turn a plain flowsheet into a full‐fledged process flow diagram (PFD) for others to review and use.
To prepare your finished simulation to be printed as a PFD, you’ll add a stream databox containing the heat and material balance for the entire flowsheet. You’ll place that databox underneath the flowsheet diagram and then add a title to the area above the flowsheet. Finally, you will create a new layer in this simulation and assign the PFD‐specific items to that layer, so that you can hide them from view when working and display them again quickly for printing.
Follow these steps to prepare and print the PFD:
1. Start by zooming out to give yourself more workspace. If you use a mouse that is equipped with a scroll wheel between the mouse buttons, you can point at the center of your flowsheet and roll the scroll wheel down a few clicks to zoom out. If you don’t have a scroll wheel, you can select View > Zoom Options > Out.
2. Now place the databox containing the heat and material balance for this flowsheet. Select Format > Add Stream Box to bring up the Select Streams dialog box. Because you want to include all streams, leave the settings the way they are and click OK to continue.
CHEMCAD Tutorials
CHEMCAD Version 6 User Guide 151
3. In the Databox Property Options dialog box, review the default selections, indicated by checked boxes. For the purposes of this tutorial, leave the selections as they are and click OK to continue.
4. In the Databox Settings dialog box, you can indicate whether to use dividing lines within the box. Accept the default settings here and click OK.
5. The stream databox appears in the upper left corner of the CHEMCAD workspace, but you want to place it below the flowsheet. The databox is already selected, so point your mouse cursor anywhere inside the box and then click and drag to reposition it. Move the databox until it is centered below the flowsheet diagram.
Note: You can also resize a databox by selecting the box and then clicking and dragging any of the sizing handles at the corners. Drag in to make the databox smaller, or out to make it larger; notice that the text adjusts in size to fit the box.
6. Now place a title on the PFD to describe the process. In the All UnitOps or Drawing Symbols palette, find and select the Text tool.
7. Move the cursor to a point somewhere above the flowsheet and click the primary mouse button. A vertical insertion point line begins to blink where you have clicked. Type the words Condensate Stabilizer PFD and then click any blank spot on the CHEMCAD workspace.
8. To make this text larger, select Format > Font. In the Font dialog box, change the Size setting to 18 and then click OK.
9. Click and drag the new heading to center it above the flowsheet diagram.
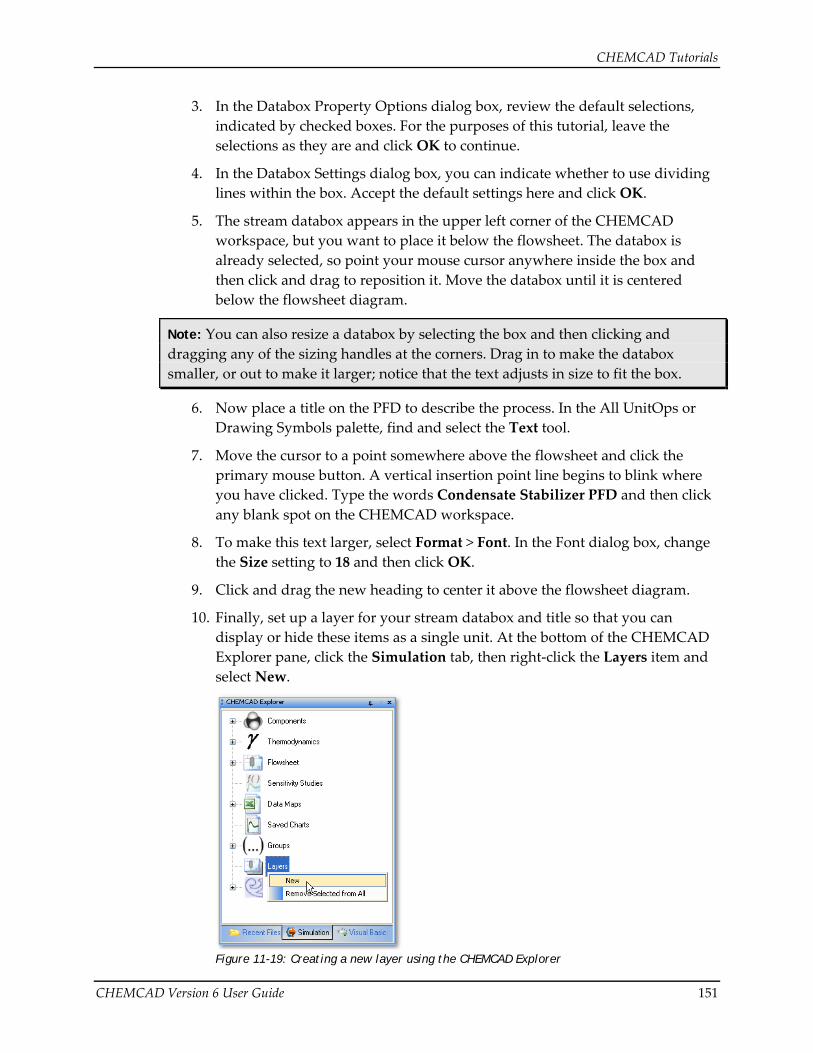
10. Finally, set up a layer for your stream databox and title so that you can display or hide these items as a single unit. At the bottom of the CHEMCAD Explorer pane, click the Simulation tab, then right‐click the Layers item and select New.
Figure 11-19: Creating a new layer using the CHEMCAD Explorer
CHEMCAD Tutorials
152 CHEMCAD Version 6 User Guide
11. In the New Layer dialog box, type a name for the new layer. For this example, name the layer PFD Elements, then click OK to create the layer.
12. Now add the two PFD elements to the layer. Click the title that you placed above the flowsheet, then hold down the [SHIFT] key and click inside the stream databox that you placed below the flowsheet. Both items should now be selected, with small black boxes visible in each corner.
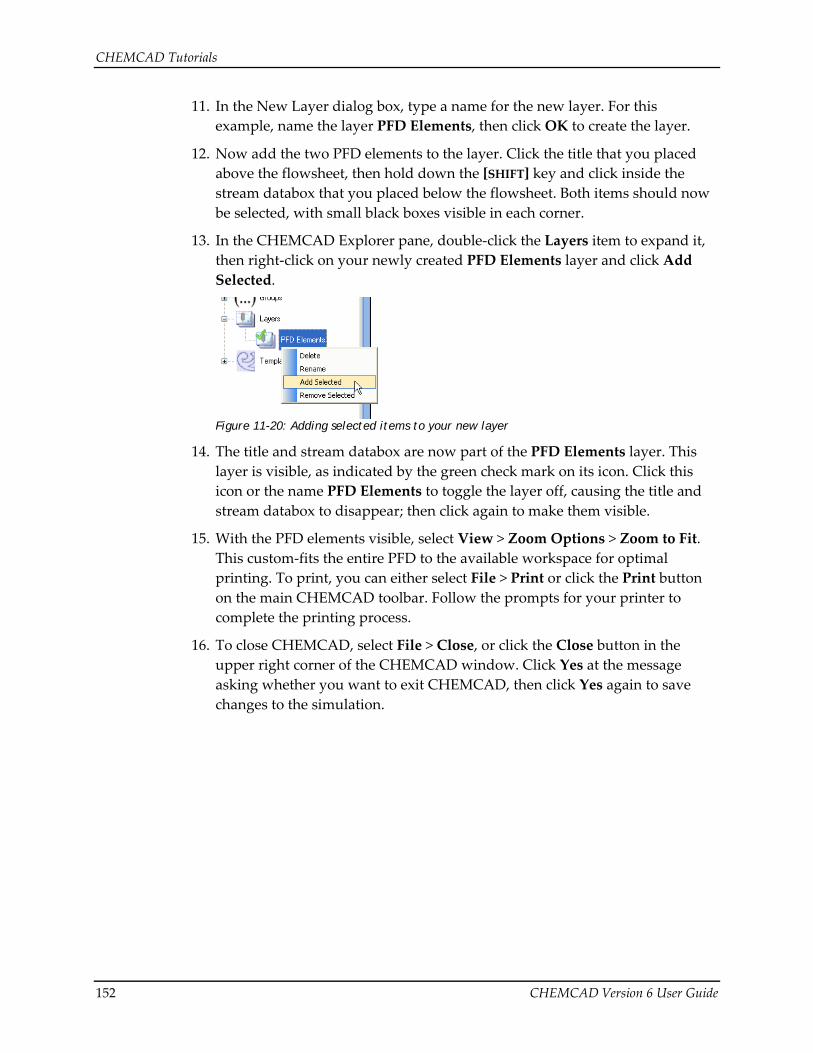
13. In the CHEMCAD Explorer pane, double‐click the Layers item to expand it, then right‐click on your newly created PFD Elements layer and click Add Selected.
Figure 11-20: Adding selected items to your new layer
14. The title and stream databox are now part of the PFD Elements layer. This layer is visible, as indicated by the green check mark on its icon. Click this icon or the name PFD Elements to toggle the layer off, causing the title and stream databox to disappear; then click again to make them visible.
15. With the PFD elements visible, select View > Zoom Options > Zoom to Fit. This custom‐fits the entire PFD to the available workspace for optimal printing. To print, you can either select File > Print or click the Print button on the main CHEMCAD toolbar. Follow the prompts for your printer to complete the printing process.
16. To close CHEMCAD, select File > Close, or click the Close button in the upper right corner of the CHEMCAD window. Click Yes at the message asking whether you want to exit CHEMCAD, then click Yes again to save changes to the simulation.