Embed Size (px)
Citation preview
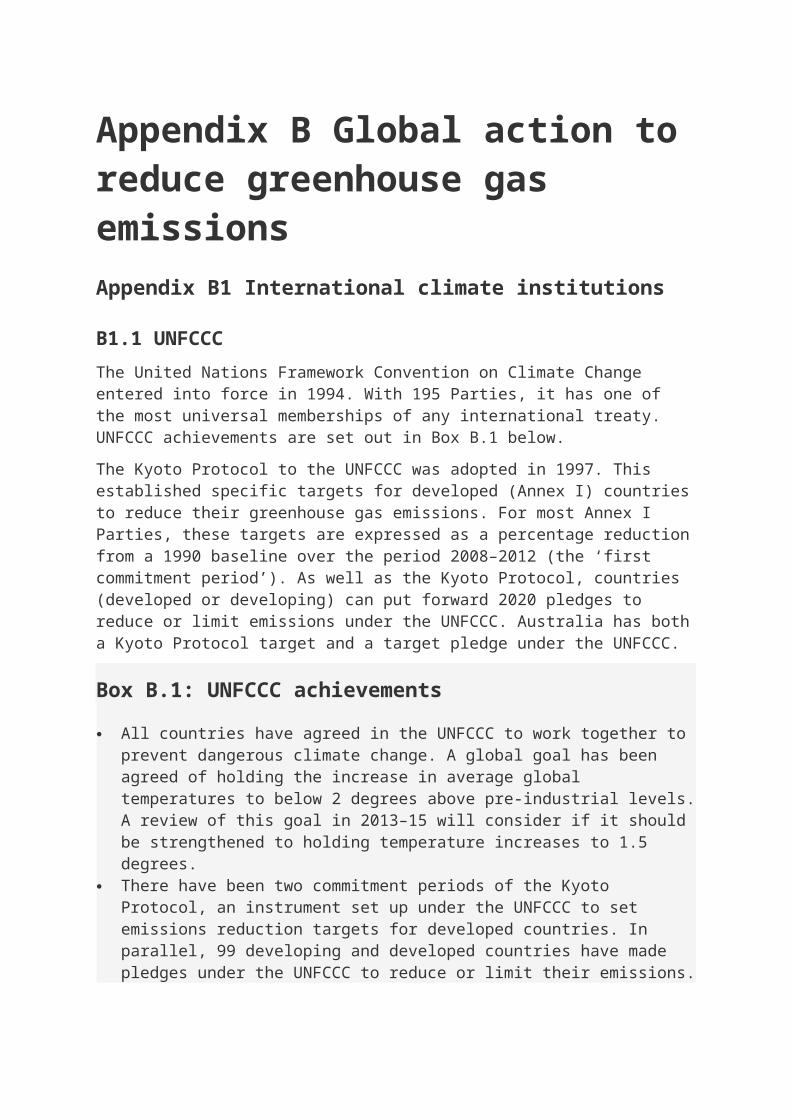
Appendix B Global action to reduce greenhouse gas emissionsAppendix B1 International climate institutions
B1.1 UNFCCCThe United Nations Framework Convention on Climate Change entered into force in 1994. With 195 Parties, it has one of the most universal memberships of any international treaty. UNFCCC achievements are set out in Box B.1 below.
The Kyoto Protocol to the UNFCCC was adopted in 1997. This established specific targets for developed (Annex I) countries to reduce their greenhouse gas emissions. For most Annex I Parties, these targets are expressed as a percentage reduction from a 1990 baseline over the period 2008–2012 (the ‘first commitment period’). As well as the Kyoto Protocol, countries (developed or developing) can put forward 2020 pledges to reduce or limit emissions under the UNFCCC. Australia has both a Kyoto Protocol target and a target pledge under the UNFCCC.
Box B.1: UNFCCC achievements All countries have agreed in the UNFCCC to work together to prevent
dangerous climate change. A global goal has been agreed of holding the increase in average global temperatures to below 2 degrees above pre-industrial levels. A review of this goal in 2013–15 will consider if it should be strengthened to holding temperature increases to 1.5 degrees.
There have been two commitment periods of the Kyoto Protocol, an instrument set up under the UNFCCC to set emissions reduction targets for developed countries. In parallel, 99 developing and developed countries have made pledges under the UNFCCC to reduce or limit their emissions.
At the Conference of the Parties (COP) in Durban in 2011, Parties agreed to work towards a new ‘protocol, another legal instrument or an agreed outcome with legal force under the Convention’ (UNFCCC Dec 1/CP.17). This will be applicable to all countries and is intended to be negotiated by 2015, with effect from 2020. The details of the new agreement, including its legal form, what it will contain and how it will differentiate between countries, remain to be negotiated.

The UNFCCC has encouraged better data collection, reporting and transparency of countries’ emissions. All countries have measurement, reporting and verification requirements, and most are up to date with their reports. Annex I countries, including Australia, have more stringent requirements than other countries. The least developed countries receive financial and technical support to help them meet their requirements and build their capacity.
The UNFCCC has created a global market for emissions offsets, the Clean Development Mechanism (CDM). This began in 2006, has registered more than 1,650 projects and is anticipated to produce offsets amounting to more than 2.9 billion tonnes of CO2-e to the end of 2012 (UNFCCC 2013). Participation in the CDM has allowed some countries to build their domestic capacity to take climate action.
The UNFCCC has created a mechanism to reduce emissions from forestry activities in developing countries. The REDD+ mechanism (Reducing Emissions from Deforestation and Forest Degradation in Developing Countries) aims to address the approximately 17 per cent of global emissions from forest activities (United Nations 2009).
Through the UNFCCC, many developing countries have been given support for their mitigation and adaptation activities. From 2010–12, developed countries agreed to provide US$30 billion in ‘fast-start’ climate finance. Australia pledged A$599 million as its share of this global effort and has delivered on this commitment. There is also agreement to long-term financing for developing countries’ climate actions, with Annex I countries collectively agreeing to provide US$100 billion by 2020 from public and private sources in the context of mitigation action from developing countries.
Ninety-nine countries have made pledges under the UNFCCC. Thirty-seven countries also have targets under the second commitment period of the Kyoto Protocol from 2013–2020—Australia, Belarus, all 28 EU members, Iceland, Liechtenstein, Monaco, Kazakhstan, Norway, Switzerland and Ukraine. Australia’s Kyoto Protocol commitment is set out in Box B.2.
Russia, Japan and New Zealand did not take second commitment period targets, and the United States did not take a target in either commitment period. Canada has formally withdrawn from the Protocol. All Annex I countries, including those without targets under the second commitment period of the Kyoto Protocol, have 2020 targets under the UNFCCC.
Box B.2: Australia’s Kyoto Protocol commitment and recommended 2020 goals The Kyoto Protocol uses a budget approach to defining national commitments; these are expressed as a percentage of 1990 emissions.
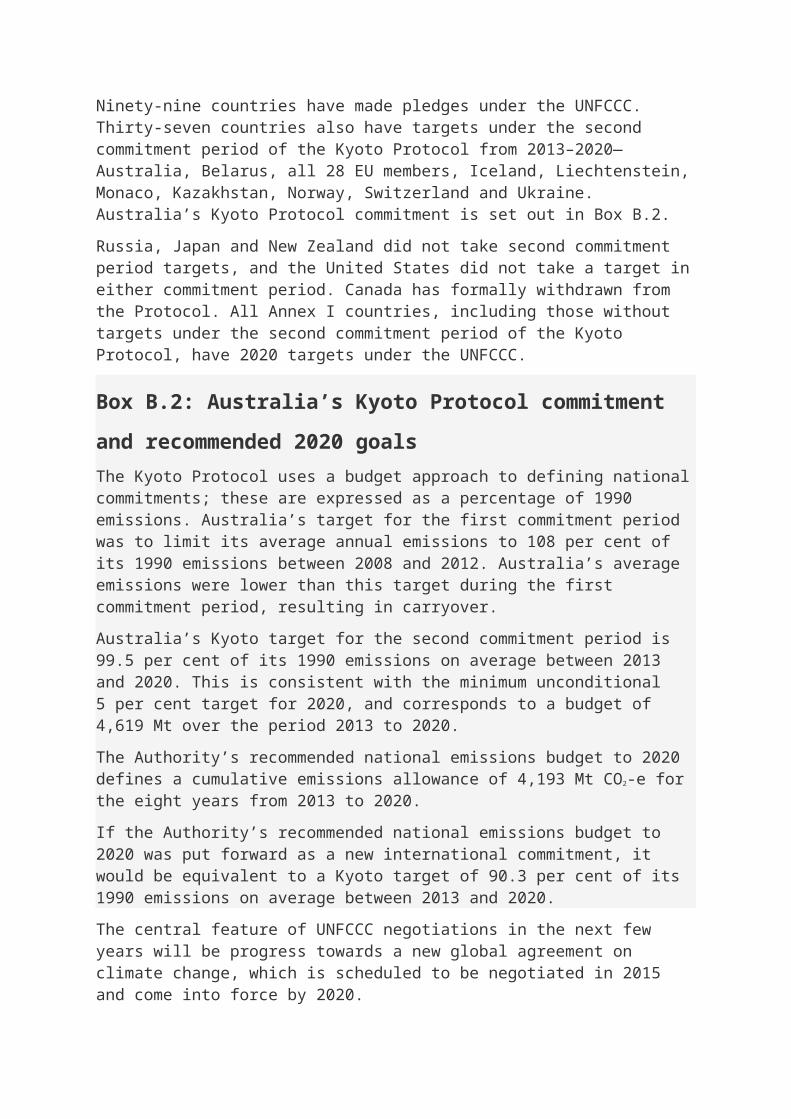
Australia’s target for the first commitment period was to limit its average annual emissions to 108 per cent of its 1990 emissions between 2008 and 2012. Australia’s average emissions were lower than this target during the first commitment period, resulting in carryover.
Australia’s Kyoto target for the second commitment period is 99.5 per cent of its 1990 emissions on average between 2013 and 2020. This is consistent with the minimum unconditional 5 per cent target for 2020, and corresponds to a budget of 4,619 Mt over the period 2013 to 2020.
The Authority’s recommended national emissions budget to 2020 defines a cumulative emissions allowance of 4,193 Mt CO2-e for the eight years from 2013 to 2020.
If the Authority’s recommended national emissions budget to 2020 was put forward as a new international commitment, it would be equivalent to a Kyoto target of 90.3 per cent of its 1990 emissions on average between 2013 and 2020.
The central feature of UNFCCC negotiations in the next few years will be progress towards a new global agreement on climate change, which is scheduled to be negotiated in 2015 and come into force by 2020.
B1.2 UNFCCC market mechanismsTo help meet their targets, countries can use market-based mechanisms, including the CDM and Joint Implementation (JI). The CDM allows emissions reduction projects in developing countries to earn certified emission reduction (CER) credits, which can be used by countries to meet their targets. JI is similar to the CDM but the credits are generated from countries with Kyoto Protocol targets. For both market mechanisms, projects to reduce emissions are proposed by developers and then reviewed independently by an international body. If the project is approved, credits are granted equal to the amount of emissions avoided due to the project compared to a business-as-usual baseline.
B1.3 Other international climate initiativesThere is a range of cooperative international climate initiatives underway outside of the UNFCCC. These allow countries to exchange practical ideas about reducing emissions and include:
research and development into low-emissions technologies, such as carbon capture and storage, renewable energy and approaches to reduce emissions from agriculture
commitments to reduce or phase out fossil fuel subsidies including under the G20
linking of emissions trading schemes, such as those of the EU and Norway, and proposed links between California and Quebec, and Switzerland and the EU
bilateral and regional agreements targeting particular areas of climate change policy; for example, short-lived gases such as methane and hydrofluorocarbons through the Climate and Clean Air Coalition, and carbon markets through the World Bank Partnership for Market Readiness.
Other international initiatives that address climate change include the Montreal Protocol on Substances that Deplete the Ozone Layer (the Montreal Protocol), which was designed to ‘phase out’ a range of gases to protect the ozone layer by destroying them safely and replacing them with substitutes. Many of the gases covered by the Montreal Protocol drive global warming as well as damaging the ozone layer, so the phase-out has had a significant positive impact on climate change. The Montreal Protocol has been one of the most successful international initiatives to reduce greenhouse gas emissions.
Emissions from international aviation and maritime activities are currently not counted towards individual country emissions or targets under the UNFCCC. Both have nearly doubled in the last 10 years. Discussions to reduce emissions from these sectors occur in the International Maritime Organization and the International Civil Aviation Organization.
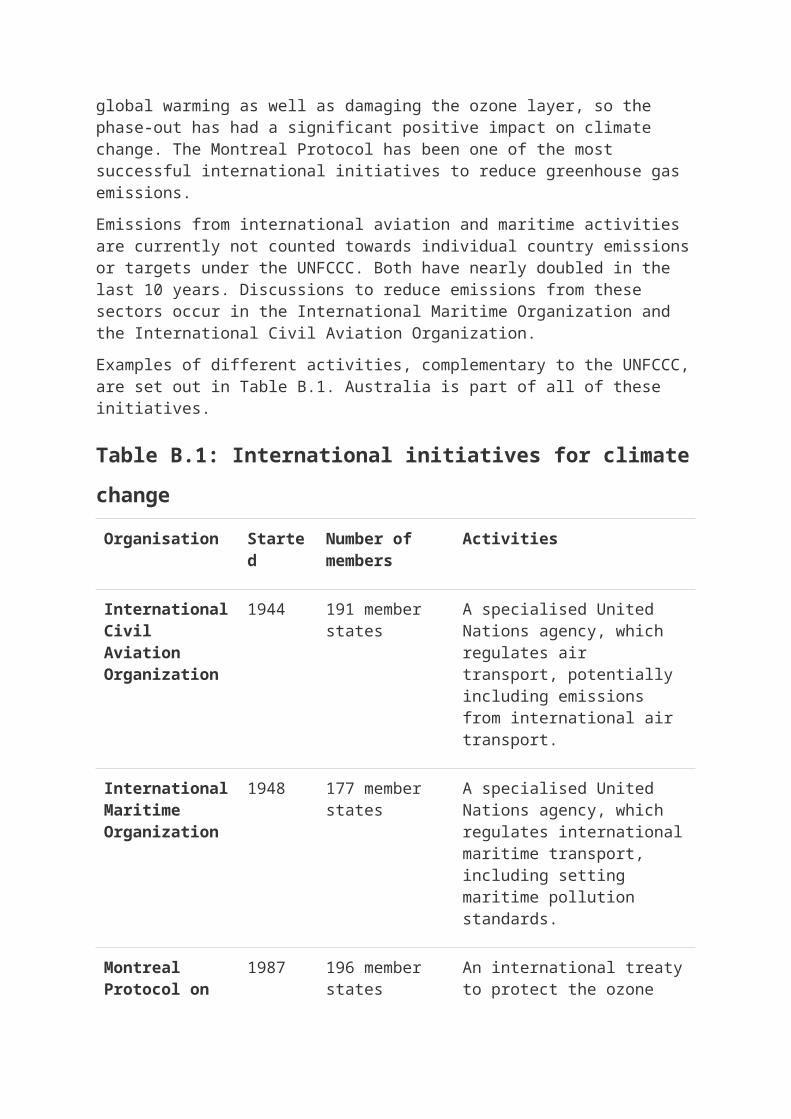
Examples of different activities, complementary to the UNFCCC, are set out in Table B.1. Australia is part of all of these initiatives.
Table B.1: International initiatives for climate change Organisation Starte
dNumber of members
Activities
International Civil Aviation Organization
1944 191 member states
A specialised United Nations agency, which regulates air transport, potentially including emissions from international air transport.
International Maritime Organization
1948 177 member states
A specialised United Nations agency, which regulates international
Organisation Started
Number of members
Activities
maritime transport, including setting maritime pollution standards.
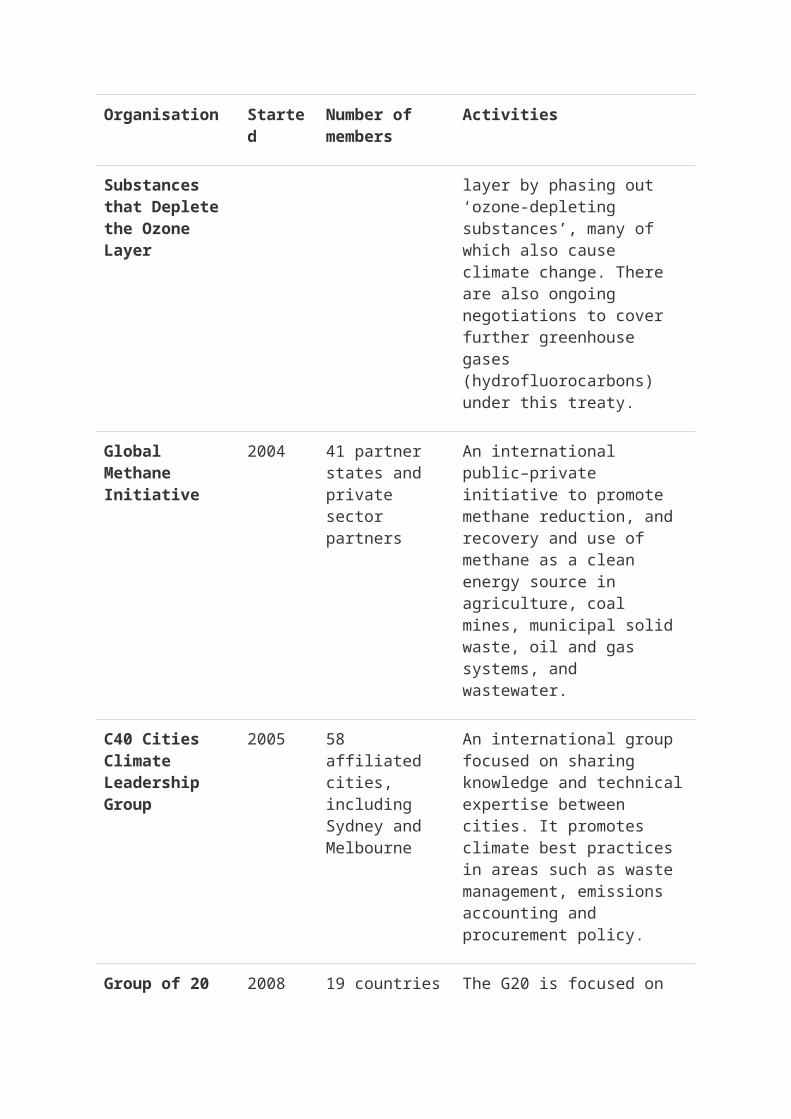
Montreal Protocol on Substances that Deplete the Ozone Layer
1987 196 member states
An international treaty to protect the ozone layer by phasing out ‘ozone-depleting substances’, many of which also cause climate change. There are also ongoing negotiations to cover further greenhouse gases (hydrofluorocarbons) under this treaty.
Global Methane Initiative
2004 41 partner states and private sector partners
An international public–private initiative to promote methane reduction, and recovery and use of methane as a clean energy source in agriculture, coal mines, municipal solid waste, oil and gas systems, and wastewater.
C40 Cities Climate Leadership Group
2005 58 affiliated cities, including Sydney and Melbourne
An international group focused on sharing knowledge and technical expertise between cities. It promotes climate best practices in areas such as waste management, emissions accounting and procurement policy.
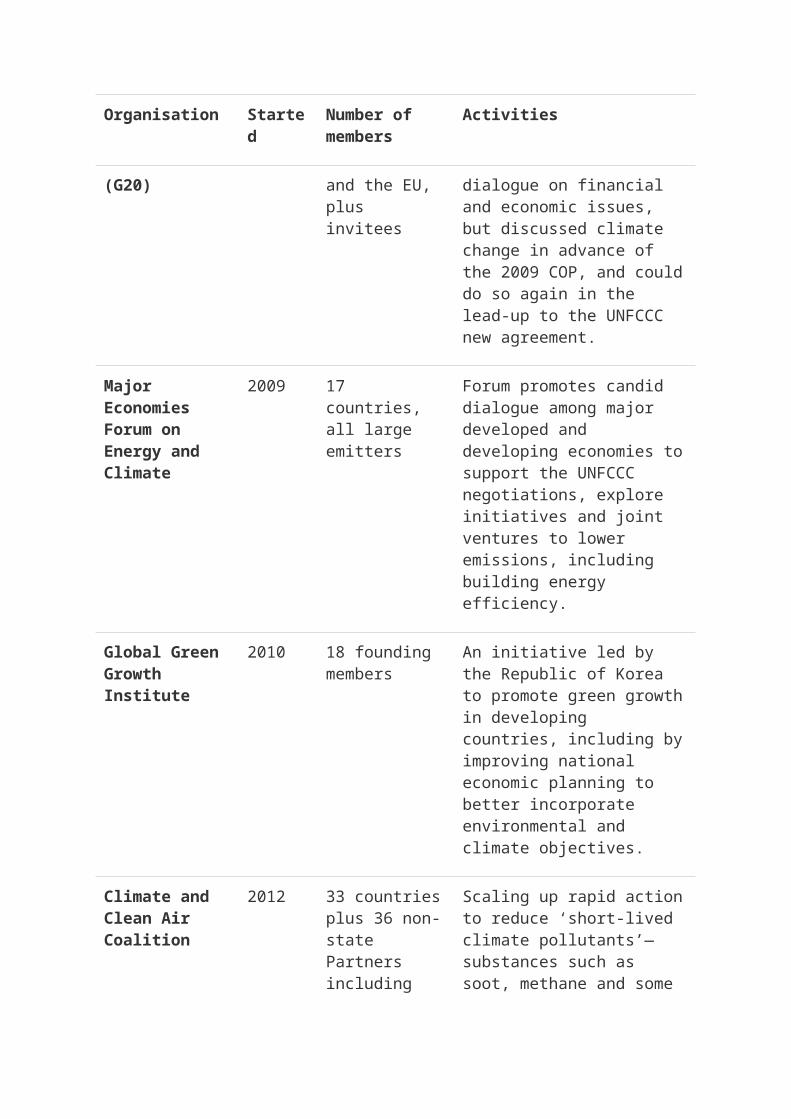
Group of 20 (G20)
2008 19 countries and the EU, plus invitees
The G20 is focused on dialogue on financial and economic issues, but
Organisation Started
Number of members
Activities
discussed climate change in advance of the 2009 COP, and could do so again in the lead-up to the UNFCCC new agreement.
Major Economies Forum on Energy and Climate
2009 17 countries, all large emitters
Forum promotes candid dialogue among major developed and developing economies to support the UNFCCC negotiations, explore initiatives and joint ventures to lower emissions, including building energy efficiency.
Global Green Growth Institute
2010 18 founding members
An initiative led by the Republic of Korea to promote green growth in developing countries, including by improving national economic planning to better incorporate environmental and climate objectives.
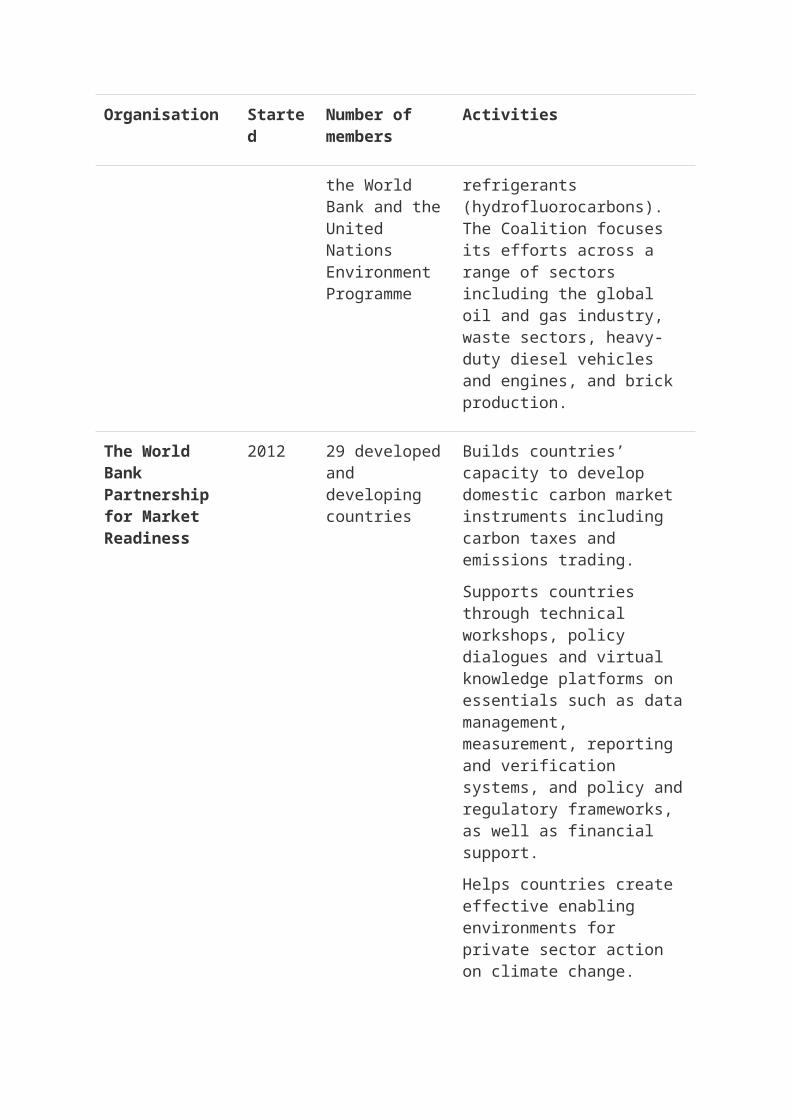
Climate and Clean Air Coalition
2012 33 countries plus 36 non-state Partners including the World Bank and the United Nations Environment Programme
Scaling up rapid action to reduce ‘short-lived climate pollutants’—substances such as soot, methane and some refrigerants (hydrofluorocarbons). The Coalition focuses its efforts across a range of sectors including the global oil and gas industry, waste sectors, heavy-duty diesel vehicles and engines, and brick production.
Organisation Started
Number of members
Activities
The World Bank Partnership for Market Readiness
2012 29 developed and developing countries
Builds countries’ capacity to develop domestic carbon market instruments including carbon taxes and emissions trading.
Supports countries through technical workshops, policy dialogues and virtual knowledge platforms on essentials such as data management, measurement, reporting and verification systems, and policy and regulatory frameworks, as well as financial support.
Helps countries create effective enabling environments for private sector action on climate change.
Sources: All information sourced from each initiative’s website
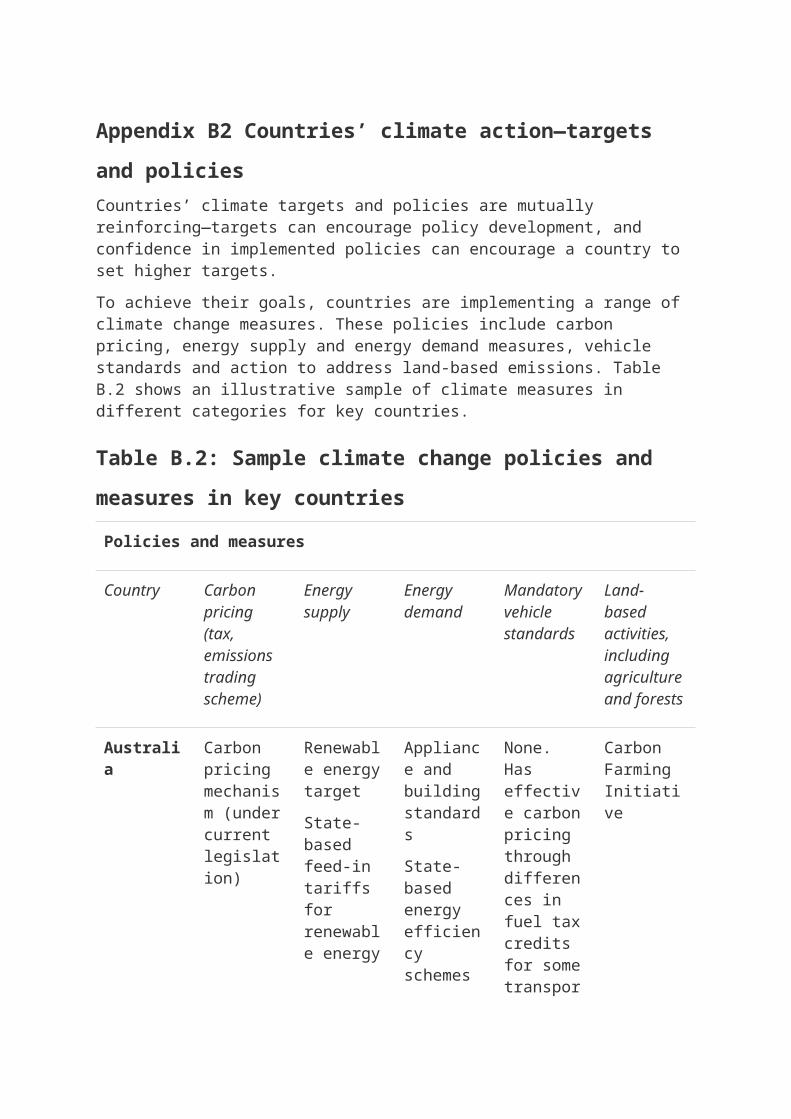
Appendix B2 Countries’ climate action—targets and policiesCountries’ climate targets and policies are mutually reinforcing—targets can encourage policy development, and confidence in implemented policies can encourage a country to set higher targets.
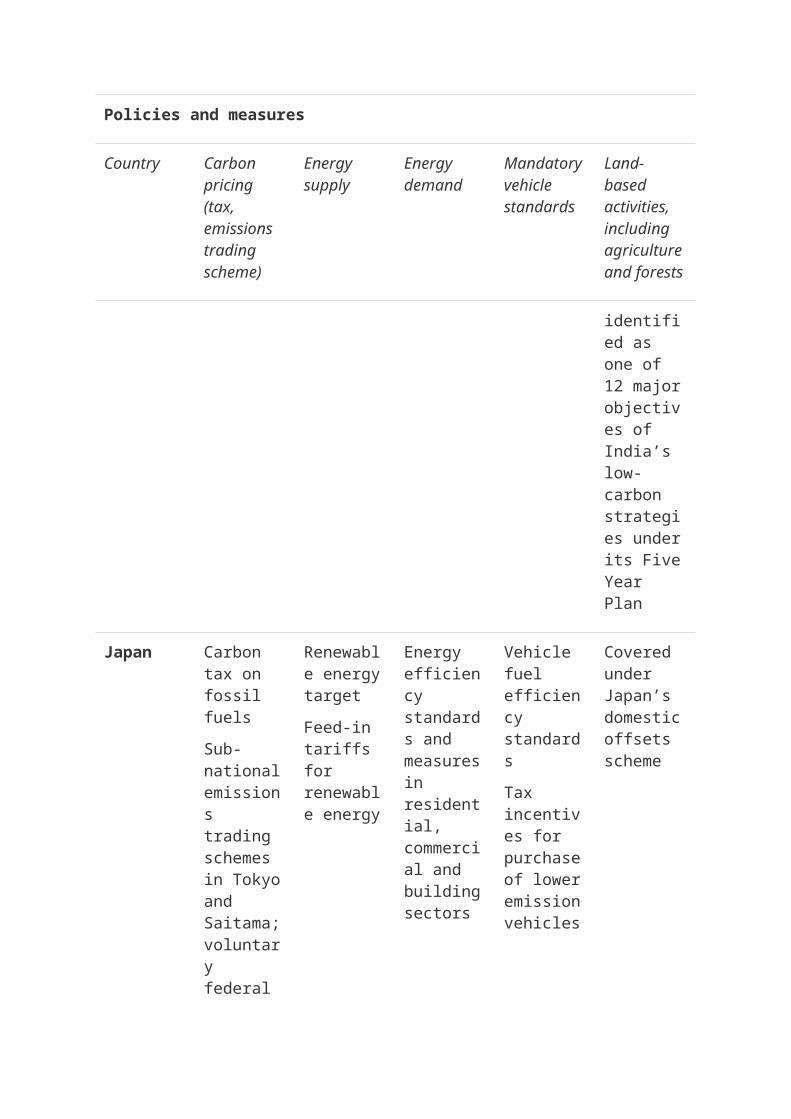
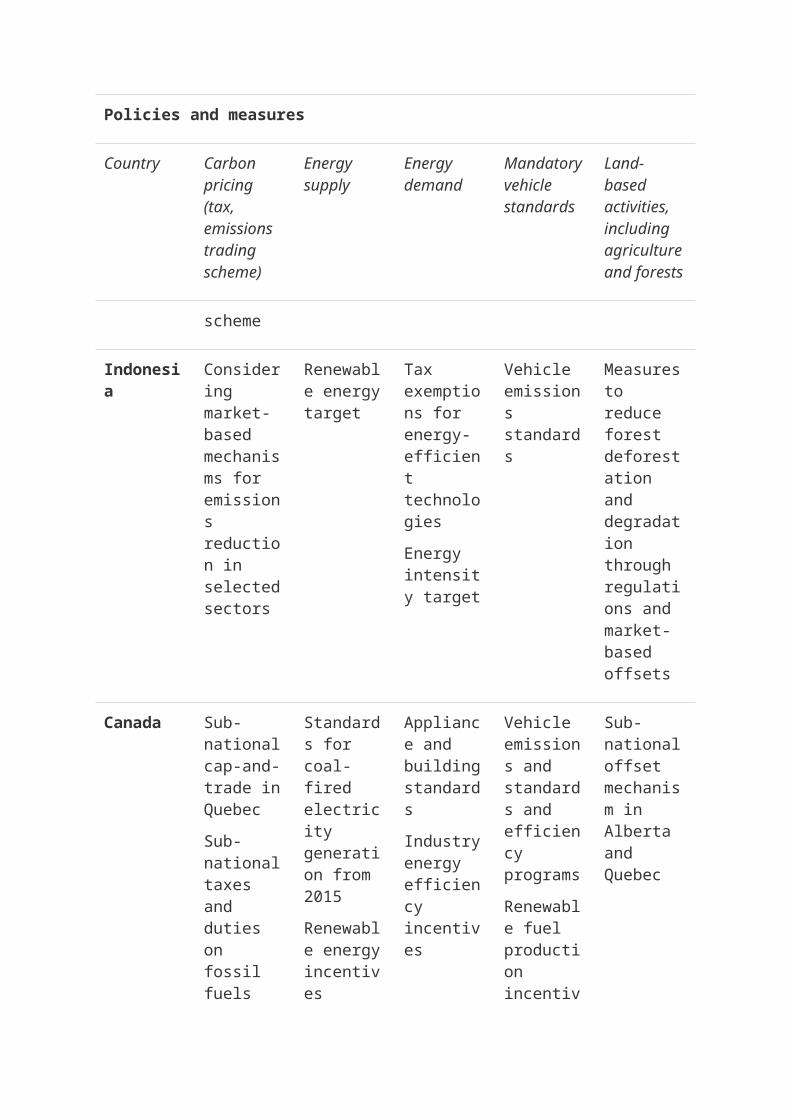
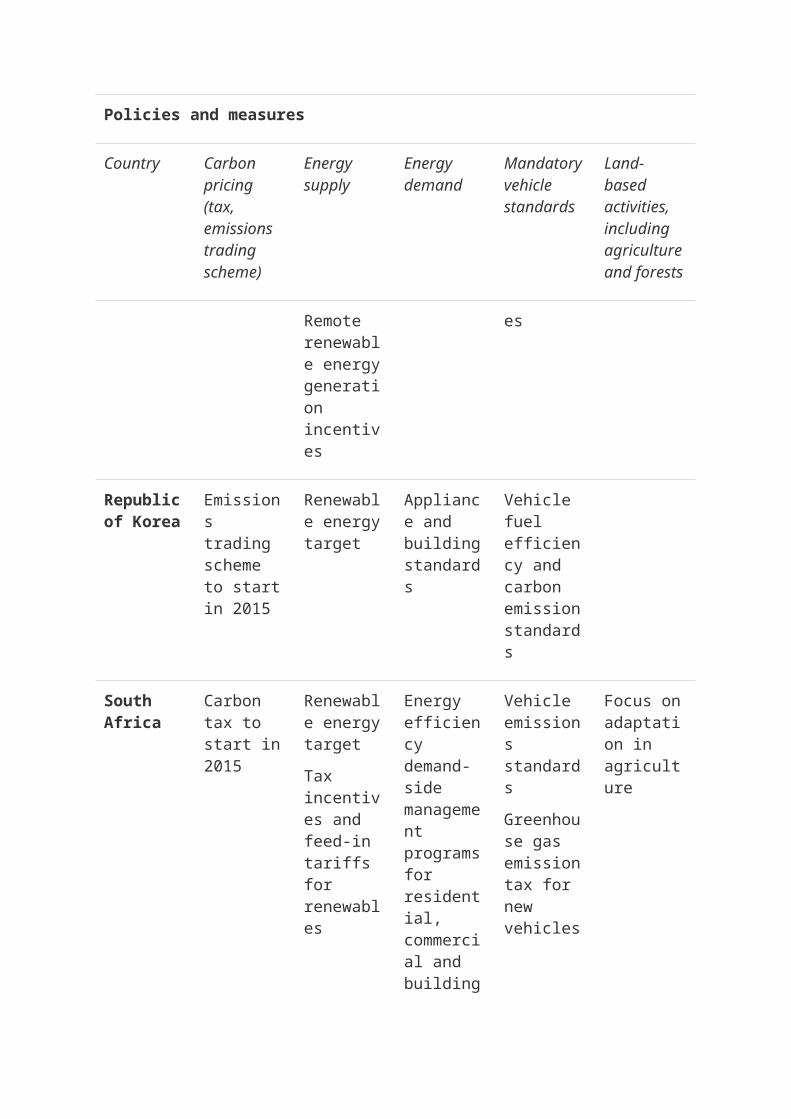
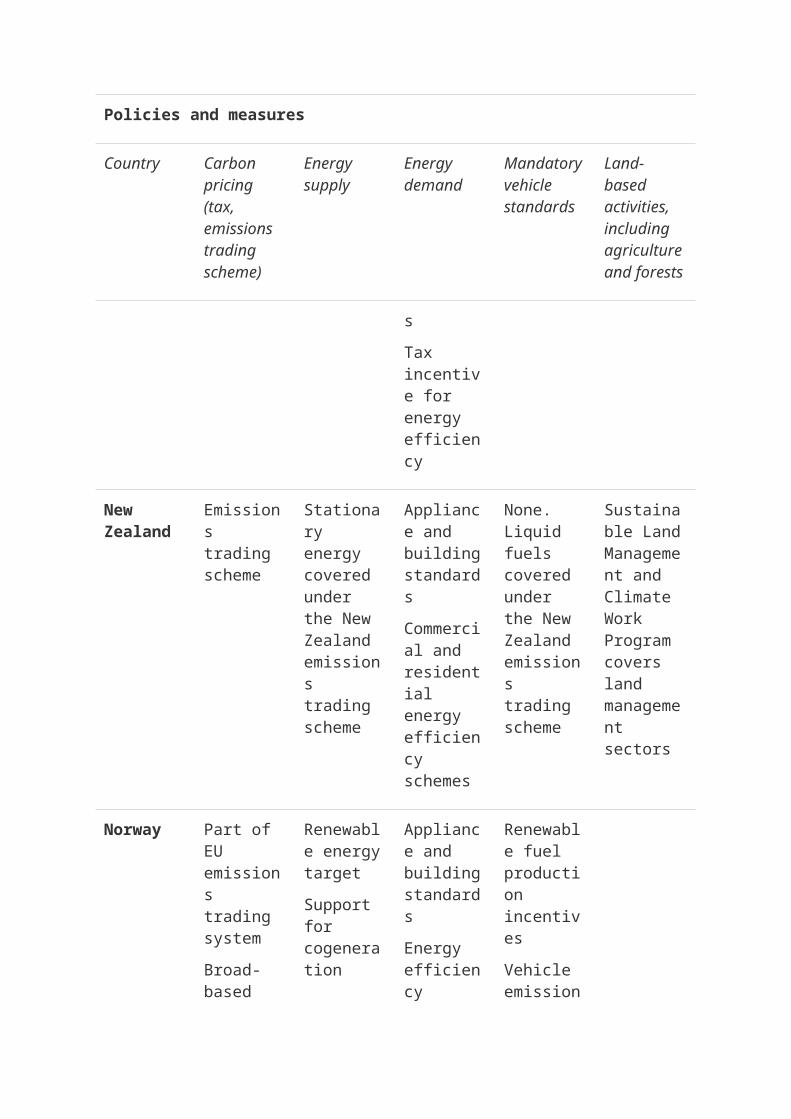
To achieve their goals, countries are implementing a range of climate change measures. These policies include carbon pricing, energy supply and energy demand measures, vehicle standards and action to address land-based emissions. Table B.2 shows an illustrative sample of climate measures in different categories for key countries.
Table B.2: Sample climate change policies and measures in key countriesPolicies and measures
Country Carbon pricing (tax, emissions trading scheme)
Energy supply
Energy demand
Mandatory vehicle standards
Land-based activities, including agriculture and forests
Australia Carbon pricing mechanism (under current legislation)
Renewable energy target
State-based feed-in tariffs for renewable energy
Appliance and building standards
State-based energy efficiency schemes
None. Has effective carbon pricing through differences in fuel tax credits for some transport
Carbon Farming Initiative
China Pilot emissions trading
Renewable energy
Appliance and building
Vehicle fuel efficiency
National reforestation efforts

Policies and measures
Country Carbon pricing (tax, emissions trading scheme)
Energy supply
Energy demand
Mandatory vehicle standards
Land-based activities, including agriculture and forests
schemes planned for seven provinces and cities. The first five began in 2013.
Plans to design a national emissions trading scheme or carbon tax
target
Feed-in tariff support for solar, wind and biomass power
Closure of inefficient small and medium-sized coal plants and industrial facilities
standards
Energy efficiency target
Industrial energy efficiency retrofits
standards
Vehicle emissions standards planned
to meet forest coverage target
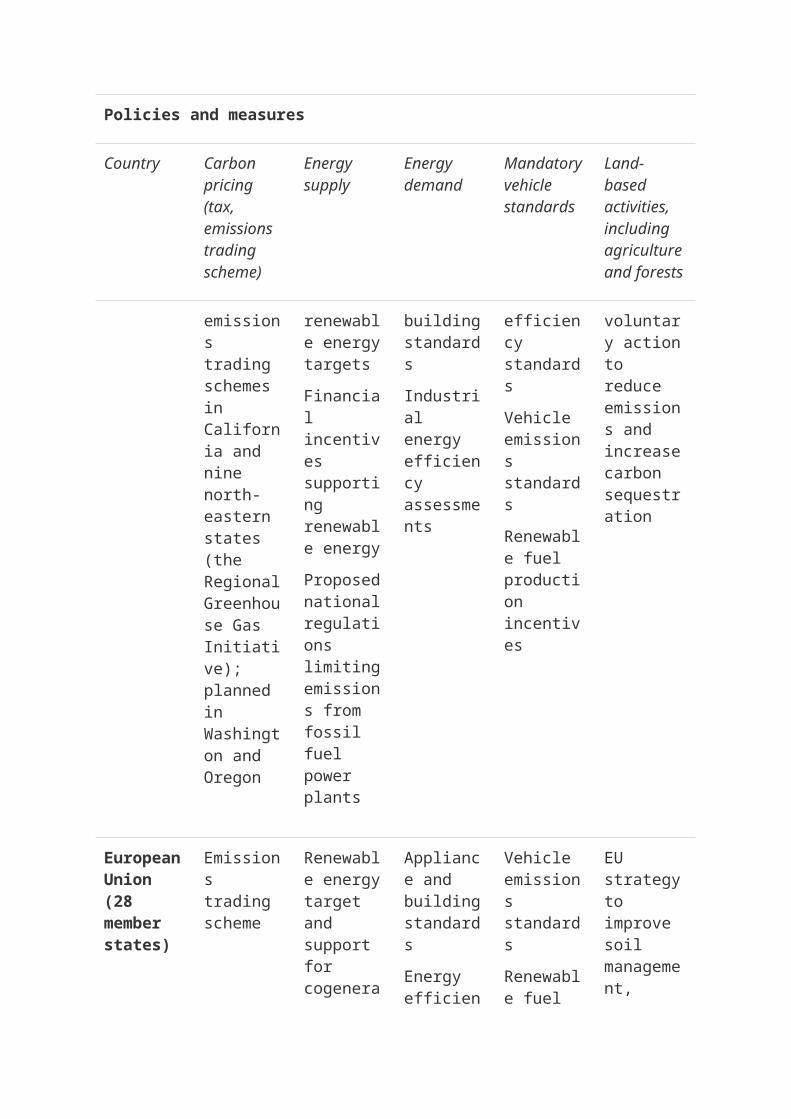
United States
Sub-national emissions trading schemes in California and nine north-eastern states (the Regional Greenhouse Gas
Sub-national renewable energy targets
Financial incentives supporting renewable energy
Proposed national regulation
Appliance and building standards
Industrial energy efficiency assessments
Vehicle fuel efficiency standards
Vehicle emissions standards
Renewable fuel production incentives
Support for voluntary action to reduce emissions and increase carbon sequestration
Policies and measures
Country Carbon pricing (tax, emissions trading scheme)
Energy supply
Energy demand
Mandatory vehicle standards
Land-based activities, including agriculture and forests
Initiative); planned in Washington and Oregon
s limiting emissions from fossil fuel power plants
European Union(28 member states)
Emissions trading scheme
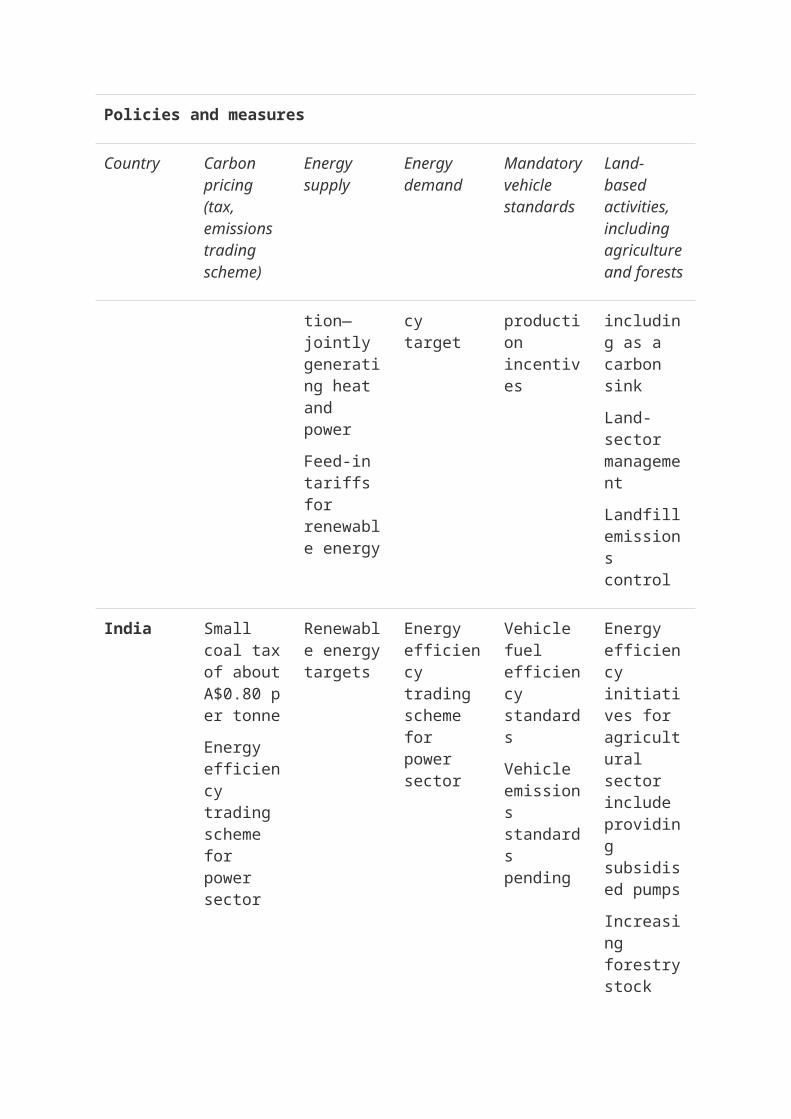
Renewable energy target and support for cogeneration—jointly generating heat and power
Feed-in tariffs for renewable energy
Appliance and building standards
Energy efficiency target
Vehicle emissions standards
Renewable fuel production incentives
EU strategy to improve soil management, including as a carbon sink
Land-sector management
Landfill emissions control
India Small coal tax of about A$0.80 per tonne
Renewable energy targets
Energy efficiency trading scheme for power
Vehicle fuel efficiency standards
Energy efficiency initiatives for agricultur

Policies and measures
Country Carbon pricing (tax, emissions trading scheme)
Energy supply
Energy demand
Mandatory vehicle standards
Land-based activities, including agriculture and forests
Energy efficiency trading scheme for power sector
sector
Vehicle emissions standards pending
al sector include providing subsidised pumps
Increasing forestry stock identified as one of 12 major objectives of India’s low-carbon strategies under its Five Year Plan
Japan Carbon tax on fossil fuels
Sub-national emissions trading schemes in Tokyo and Saitama; voluntary
Renewable energy target
Feed-in tariffs for renewable energy
Energy efficiency standards and measures in residential, commercial and building sectors
Vehicle fuel efficiency standards
Tax incentives for purchase of lower emission vehicles
Covered under Japan’s domestic offsets scheme
Policies and measures
Country Carbon pricing (tax, emissions trading scheme)
Energy supply
Energy demand
Mandatory vehicle standards
Land-based activities, including agriculture and forests
federal scheme
Indonesia
Considering market-based mechanisms for emissions reduction in selected sectors
Renewable energy target
Tax exemptions for energy-efficient technologies
Energy intensity target
Vehicle emissions standards
Measures to reduce forest deforestation and degradation through regulations and market-based offsets
Canada Sub-national cap-and-trade in Quebec
Sub-national taxes and duties on fossil fuels
Standards for coal-fired electricity generation from 2015
Renewable energy incentives
Remote renewable energy generation
Appliance and building standards
Industry energy efficiency incentives
Vehicle emissions and standards and efficiency programs
Renewable fuel production incentives
Sub-national offset mechanism in Alberta and Quebec
Policies and measures
Country Carbon pricing (tax, emissions trading scheme)
Energy supply
Energy demand
Mandatory vehicle standards
Land-based activities, including agriculture and forests
incentives
Republic of Korea
Emissions trading scheme to start in 2015
Renewable energy target
Appliance and building standards
Vehicle fuel efficiency and carbon emission standards
South Africa
Carbon tax to start in 2015
Renewable energy target
Tax incentives and feed-in tariffs for renewables
Energy efficiency demand-side management programs for residential, commercial and buildings
Tax incentive for energy efficiency
Vehicle emissions standards
Greenhouse gas emission tax for new vehicles
Focus on adaptation in agriculture
New Zealand
Emissions trading scheme
Stationary energy covered under the
Appliance and building
None. Liquid fuels covered
Sustainable Land Management and
Policies and measures
Country Carbon pricing (tax, emissions trading scheme)
Energy supply
Energy demand
Mandatory vehicle standards
Land-based activities, including agriculture and forests
New Zealand emissions trading scheme
standards
Commercial and residential energy efficiency schemes
under the New Zealand emissions trading scheme
Climate Work Program covers land management sectors
Norway Part of EU emissions trading system
Broad-based domestic carbon tax
Renewable energy target
Support for cogeneration
Appliance and building standards
Energy efficiency target
Renewable fuel production incentives
Vehicle emissions standards
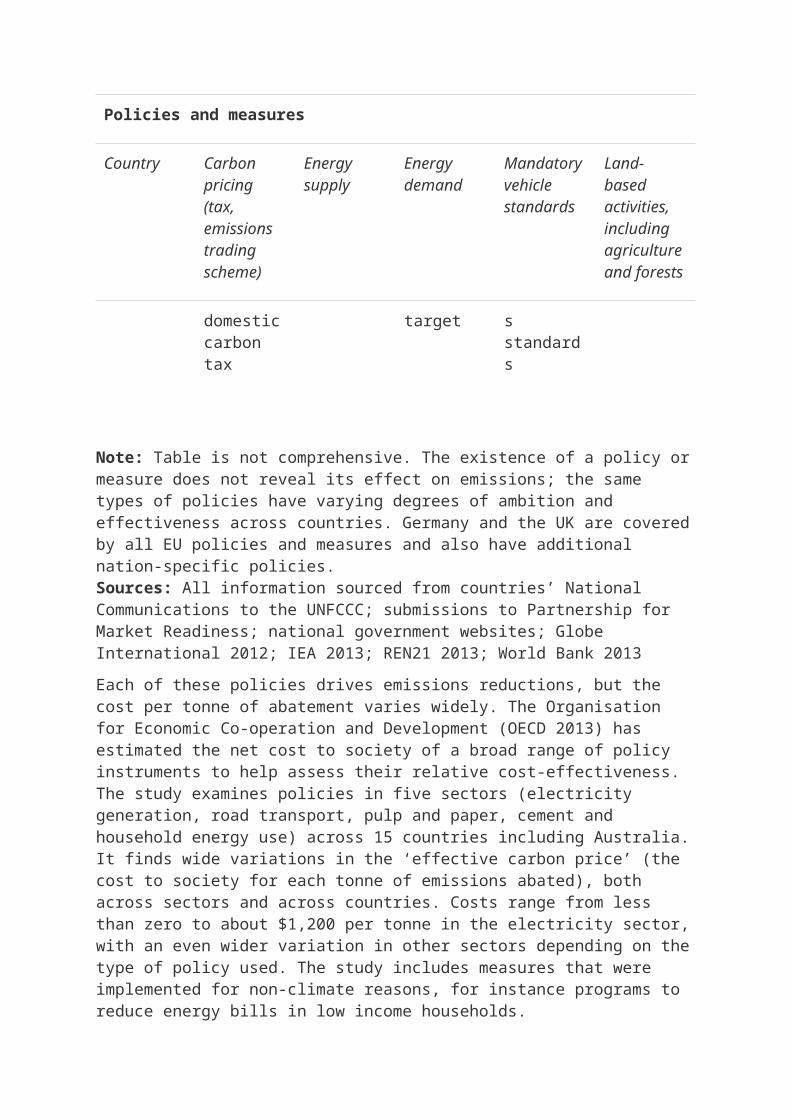
Note: Table is not comprehensive. The existence of a policy or measure does not reveal its effect on emissions; the same types of policies have varying degrees of ambition and effectiveness across countries. Germany and the UK are covered by all EU policies and measures and also have additional nation-specific policies.Sources: All information sourced from countries’ National Communications to the UNFCCC; submissions to Partnership for Market Readiness; national government websites; Globe International 2012; IEA 2013; REN21 2013; World Bank 2013
Each of these policies drives emissions reductions, but the cost per tonne of abatement varies widely. The Organisation for Economic Co-operation
and Development (OECD 2013) has estimated the net cost to society of a broad range of policy instruments to help assess their relative cost-effectiveness. The study examines policies in five sectors (electricity generation, road transport, pulp and paper, cement and household energy use) across 15 countries including Australia. It finds wide variations in the ‘effective carbon price’ (the cost to society for each tonne of emissions abated), both across sectors and across countries. Costs range from less than zero to about $1,200 per tonne in the electricity sector, with an even wider variation in other sectors depending on the type of policy used. The study includes measures that were implemented for non-climate reasons, for instance programs to reduce energy bills in low income households.
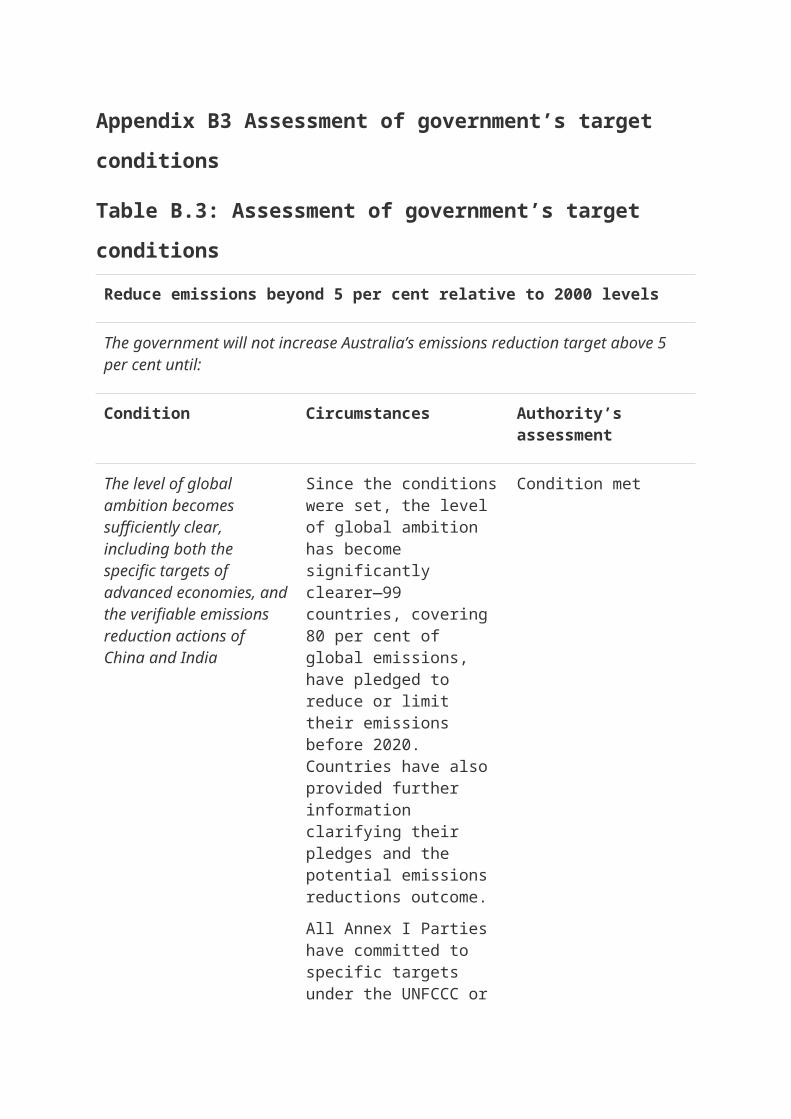
Appendix B3 Assessment of government’s target conditions
Table B.3: Assessment of government’s target conditionsReduce emissions beyond 5 per cent relative to 2000 levels
The government will not increase Australia’s emissions reduction target above 5 per cent until:
Condition Circumstances Authority’s assessment
The level of global ambition becomes sufficiently clear, including both the specific targets of advanced economies, and the verifiable emissions reduction actions of China and India
Since the conditions were set, the level of global ambition has become significantly clearer—99 countries, covering 80 per cent of global emissions, have pledged to reduce or limit their emissions before 2020. Countries have also provided further information clarifying their pledges and the potential emissions reductions
Condition met
outcome.
All Annex I Parties have committed to specific targets under the UNFCCC or Kyoto Protocol.
Many developing countries, including China and India, have pledged 2020 emissions reductions targets or actions under the UNFCCC. They have also agreed to increased measurement, reporting and verification of their emissions and their pledged action through biennial update reports, including national inventories.
Details of pledges can be found at www.unfccc.int.
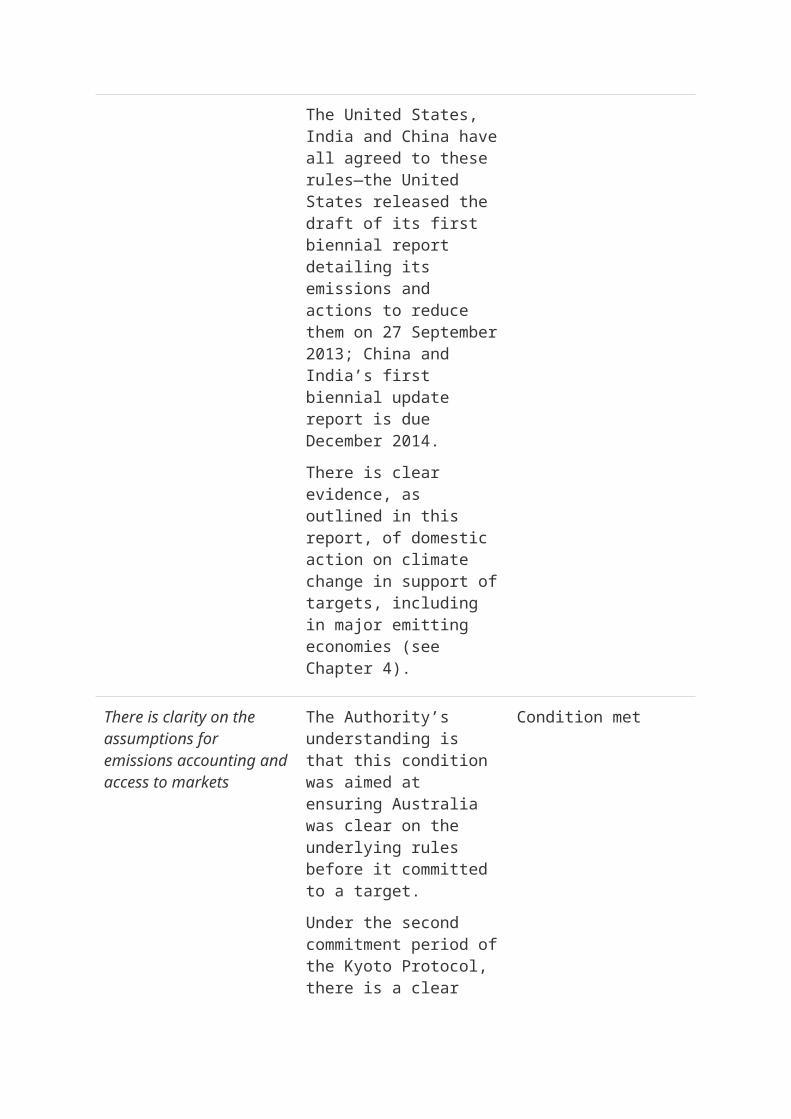
The credibility of those commitments and actions is established, for example, by way of a robust global agreement or commitments to verifiable domestic action on the part of the major emitters including the United States, India and China
In a series of UNFCCC decisions, countries have agreed to a robust international method for measuring, reporting and verifying emissions, and progress towards pledged targets and actions through biennial reports. This supports the credibility of all countries’ commitments and domestic actions. The United States, India
Condition met
and China have all agreed to these rules—the United States released the draft of its first biennial report detailing its emissions and actions to reduce them on 27 September 2013; China and India’s first biennial update report is due December 2014.
There is clear evidence, as outlined in this report, of domestic action on climate change in support of targets, including in major emitting economies (see Chapter 4).
There is clarity on the assumptions for emissions accounting and access to markets
The Authority’s understanding is that this condition was aimed at ensuring Australia was clear on the underlying rules before it committed to a target.
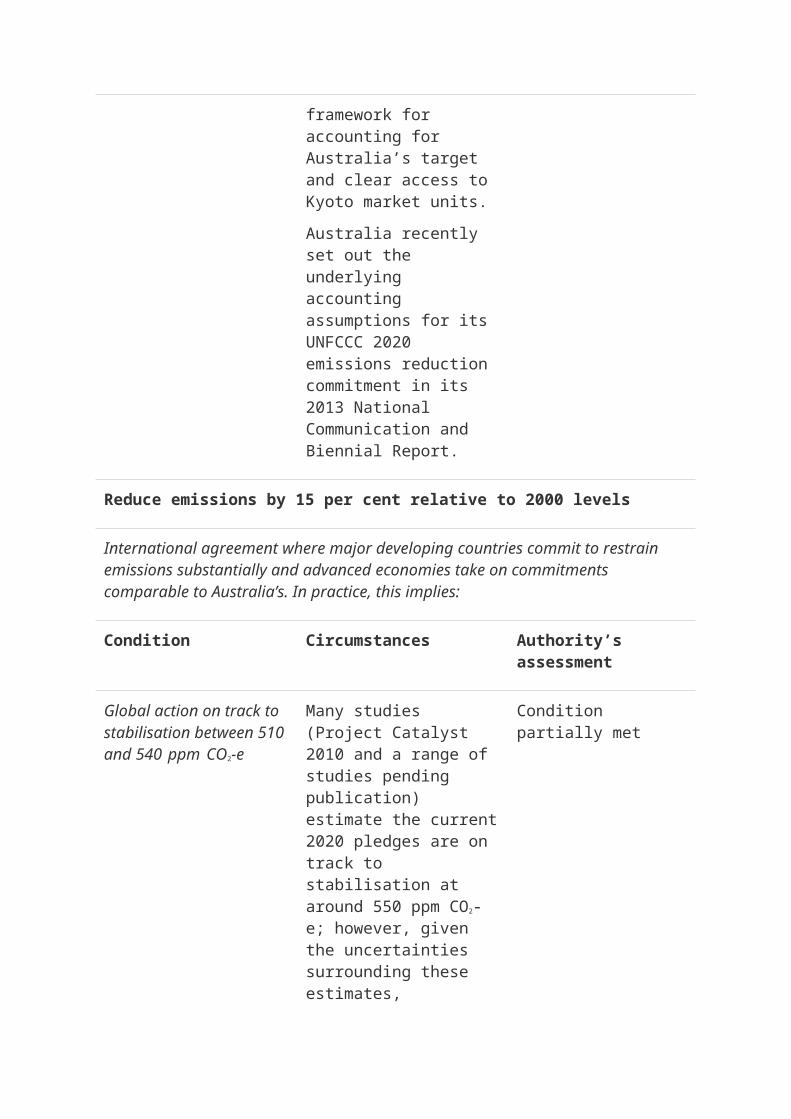
Under the second commitment period of the Kyoto Protocol, there is a clear framework for accounting for Australia’s target and clear access to Kyoto market units.
Australia recently set out the underlying accounting assumptions for its
Condition met
UNFCCC 2020 emissions reduction commitment in its 2013 National Communication and Biennial Report.
Reduce emissions by 15 per cent relative to 2000 levels
International agreement where major developing countries commit to restrain emissions substantially and advanced economies take on commitments comparable to Australia’s. In practice, this implies:
Condition Circumstances Authority’s assessment
Global action on track to stabilisation between 510 and 540 ppm CO2-e
Many studies (Project Catalyst 2010 and a range of studies pending publication) estimate the current 2020 pledges are on track to stabilisation at around 550 ppm CO2-e; however, given the uncertainties surrounding these estimates, stabilisation at 510–540 ppm cannot be ruled out, depending on the level of post-2020 action.
Condition partially met
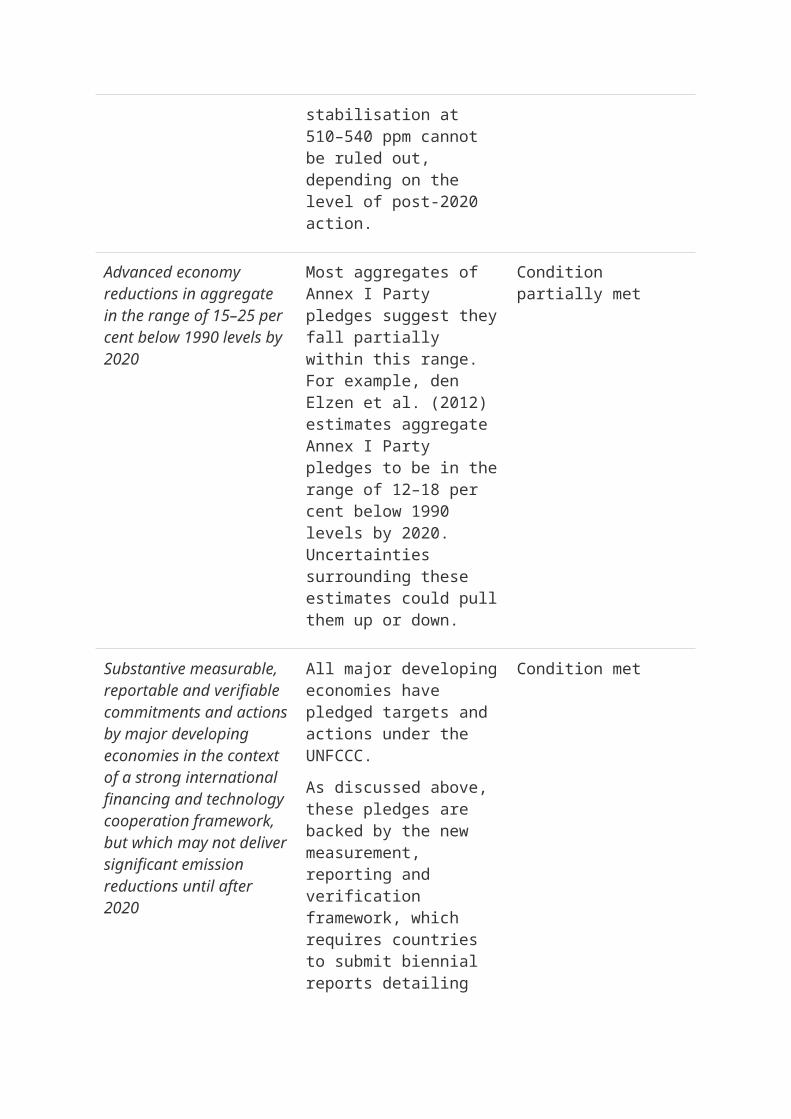
Advanced economy reductions in aggregate in the range of 15–25 per cent below 1990 levels by 2020
Most aggregates of Annex I Party pledges suggest they fall partially within this range. For example, den Elzen et al. (2012) estimates aggregate Annex I Party pledges to be in the range of 12–18 per cent below
Condition partially met
1990 levels by 2020. Uncertainties surrounding these estimates could pull them up or down.
Substantive measurable, reportable and verifiable commitments and actions by major developing economies in the context of a strong international financing and technology cooperation framework, but which may not deliver significant emission reductions until after 2020
All major developing economies have pledged targets and actions under the UNFCCC.
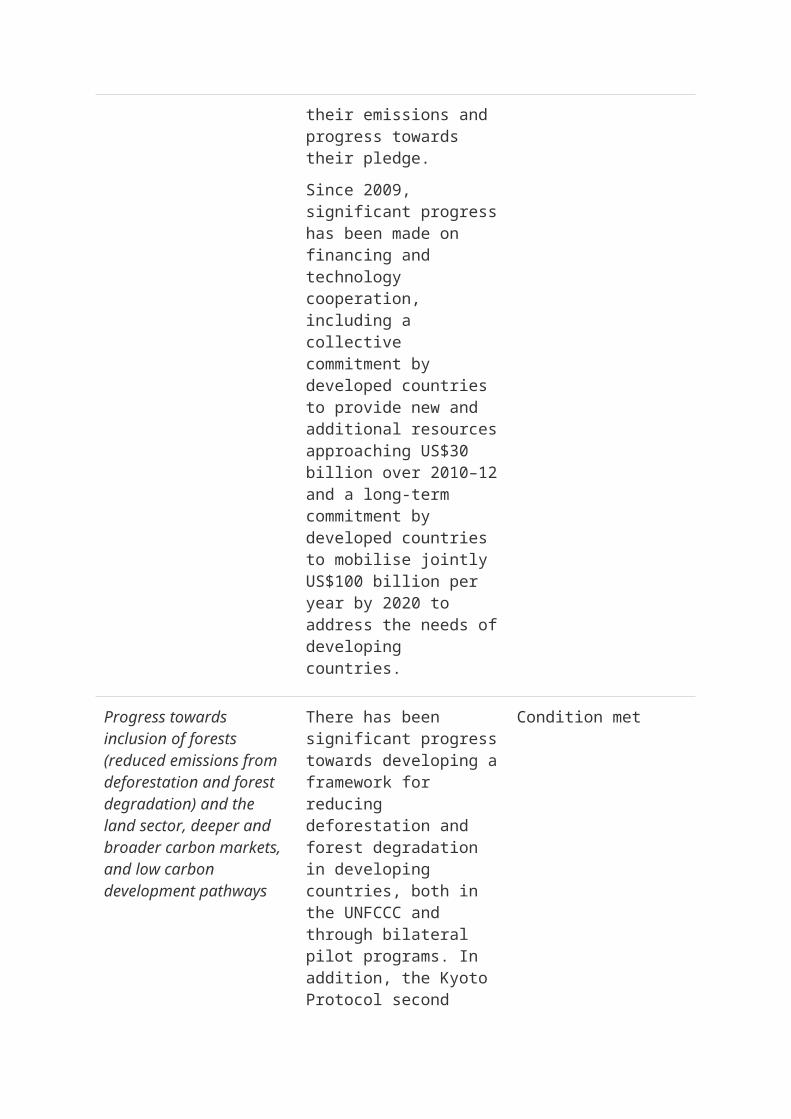
As discussed above, these pledges are backed by the new measurement, reporting and verification framework, which requires countries to submit biennial reports detailing their emissions and progress towards their pledge.
Since 2009, significant progress has been made on financing and technology cooperation, including a collective commitment by developed countries to provide new and additional resources approaching US$30 billion over 2010–12 and a long-term commitment by developed countries to mobilise jointly US$100 billion per year by 2020 to address the needs of developing countries.
Condition met

Progress towards inclusion of forests (reduced emissions from deforestation and forest degradation) and the land sector, deeper and broader carbon markets, and low carbon development pathways
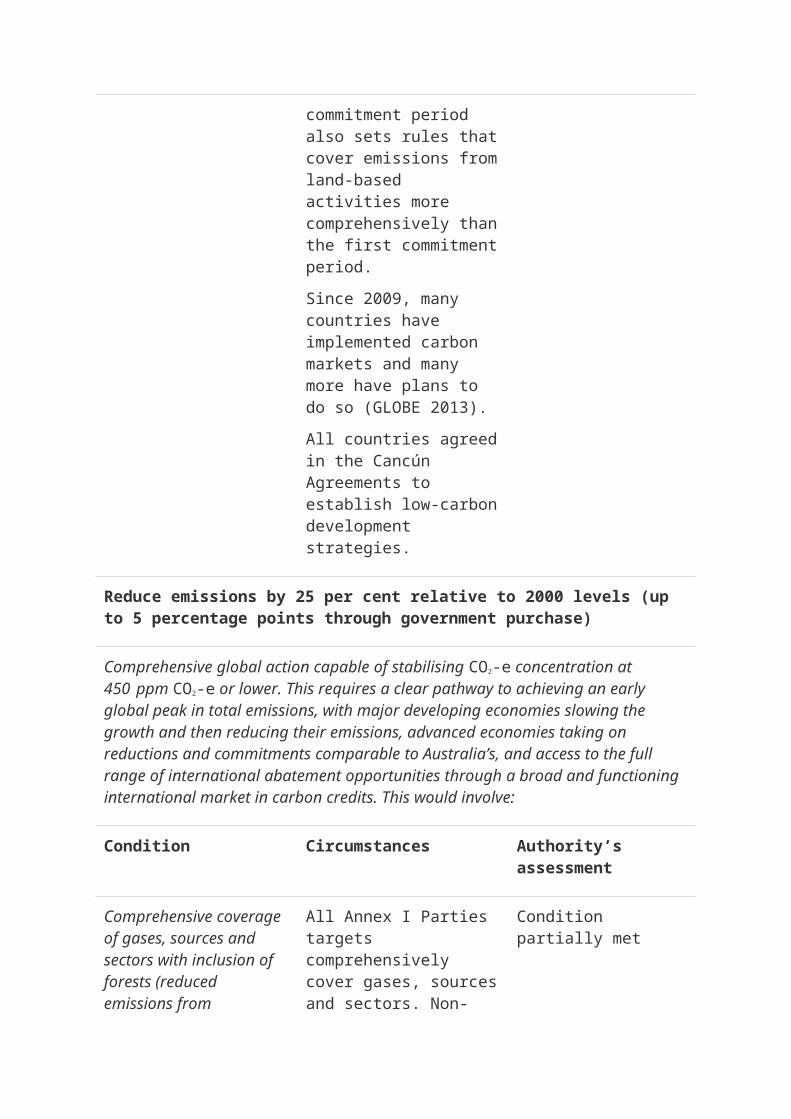
There has been significant progress towards developing a framework for reducing deforestation and forest degradation in developing countries, both in the UNFCCC and through bilateral pilot programs. In addition, the Kyoto Protocol second commitment period also sets rules that cover emissions from land-based activities more comprehensively than the first commitment period.
Since 2009, many countries have implemented carbon markets and many more have plans to do so (GLOBE 2013).
All countries agreed in the Cancún Agreements to establish low-carbon development strategies.
Condition met
Reduce emissions by 25 per cent relative to 2000 levels (up to 5 percentage points through government purchase)
Comprehensive global action capable of stabilising CO2-e concentration at 450 ppm CO2-e or lower. This requires a clear pathway to achieving an early global peak in total emissions, with major developing economies slowing the growth and then reducing their emissions, advanced economies taking on reductions and commitments comparable to Australia’s, and access to the full range of international abatement opportunities through a broad and functioning international market in carbon credits. This would involve:
Condition Circumstances Authority’s assessment
Comprehensive coverage of gases, sources and sectors with inclusion of forests (reduced emissions from deforestation and forest degradation) and the land sector (including soil carbon initiatives (for example, biochar) if scientifically demonstrated) in the agreement
All Annex I Parties targets comprehensively cover gases, sources and sectors. Non-Annex I Party pledges vary in their coverage of gases, sources and sectors.
The Kyoto Protocol second commitment period comprehensively covers greenhouse gases (not covered by the Montreal Protocol), sources and sectors. The second commitment period of the Kyoto Protocol allows countries to elect grazing land, which would include removals from soil carbon initiatives (Australia has chosen to elect grazing land for its second commitment period target).
As discussed above, significant progress towards developing a framework for reducing deforestation and forest degradation in developing countries.
Condition partially met
Clear global trajectory, where the sum of all economies’ commitments is
As discussed above, most studies estimate the pledges aggregate to a stabilisation of
Condition not yet met
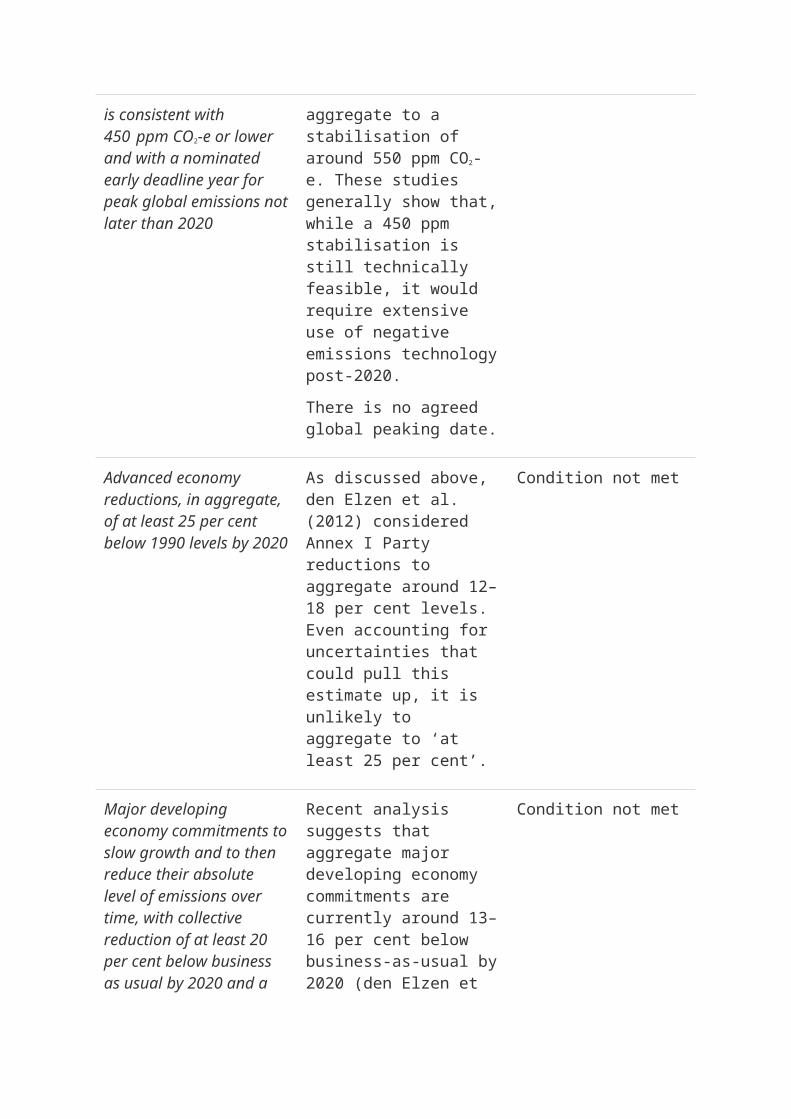
consistent with 450 ppm CO2-e or lower and with a nominated early deadline year for peak global emissions not later than 2020
around 550 ppm CO2-e. These studies generally show that, while a 450 ppm stabilisation is still technically feasible, it would require extensive use of negative emissions technology post-2020.
There is no agreed global peaking date.
Advanced economy reductions, in aggregate, of at least 25 per cent below 1990 levels by 2020
As discussed above, den Elzen et al. (2012) considered Annex I Party reductions to aggregate around 12–18 per cent levels. Even accounting for uncertainties that could pull this estimate up, it is unlikely to aggregate to ‘at least 25 per cent’.
Condition not met
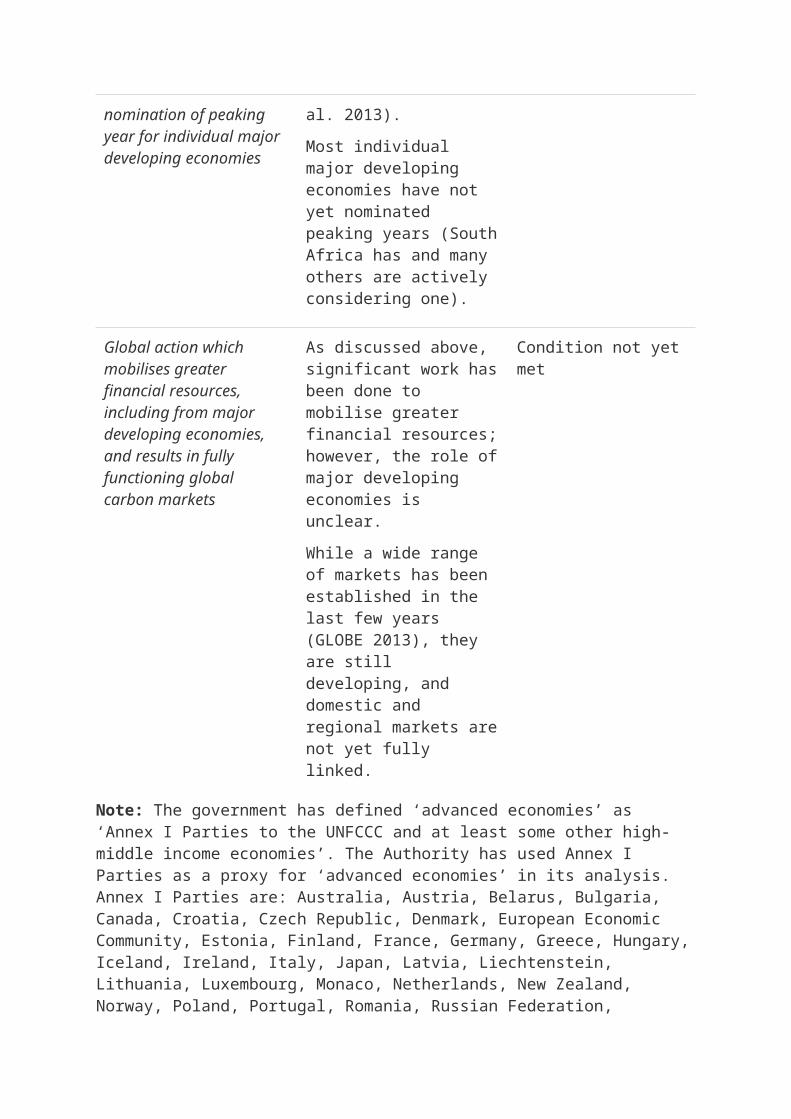
Major developing economy commitments to slow growth and to then reduce their absolute level of emissions over time, with collective reduction of at least 20 per cent below business as usual by 2020 and a nomination of peaking year for individual major developing economies
Recent analysis suggests that aggregate major developing economy commitments are currently around 13–16 per cent below business-as-usual by 2020 (den Elzen et al. 2013).
Most individual major developing economies have not yet nominated peaking years (South Africa has and many others are actively considering one).
Condition not met
Global action which As discussed above, Condition not yet
mobilises greater financial resources, including from major developing economies, and results in fully functioning global carbon markets
significant work has been done to mobilise greater financial resources; however, the role of major developing economies is unclear.
While a wide range of markets has been established in the last few years (GLOBE 2013), they are still developing, and domestic and regional markets are not yet fully linked.
met
Note: The government has defined ‘advanced economies’ as ‘Annex I Parties to the UNFCCC and at least some other high-middle income economies’. The Authority has used Annex I Parties as a proxy for ‘advanced economies’ in its analysis. Annex I Parties are: Australia, Austria, Belarus, Bulgaria, Canada, Croatia, Czech Republic, Denmark, European Economic Community, Estonia, Finland, France, Germany, Greece, Hungary, Iceland, Ireland, Italy, Japan, Latvia, Liechtenstein, Lithuania, Luxembourg, Monaco, Netherlands, New Zealand, Norway, Poland, Portugal, Romania, Russian Federation, Slovakia, Slovenia, Spain, Sweden, Switzerland, Turkey, Ukraine, United Kingdom of Great Britain and Northern Ireland, and United States of America. The government has defined ‘major developing economies’ as ‘non- members of the Major Economies Forum’. These countries are Brazil, China, India, Indonesia, Republic of Korea, Mexico and South Africa.Source: Climate Change Authority
Appendix B4 Comparing 2020 targets
B4.1 Data and assumptionsHow Australia’s 2020 targets compare with that of other countries is an important question. This appendix considers some of the assumptions and limitations involved in comparing Australia’s targets to those of other countries that underpin the analysis in Chapter 4.
In choosing data and a method to compare emissions targets, considerations include:
limitations on comparing targets expressed in different ways assumptions around the ‘base year’ or defined common reference year
for targets.
The four measures used in Chapter 4 provide guidance on the relative ambition of countries’ targets; however, these are neither comprehensive nor conclusive, either singularly or together. Many factors influence how ambitious a target is, including the level of development, population growth, access to technology, and industrial base and natural resource endowments.
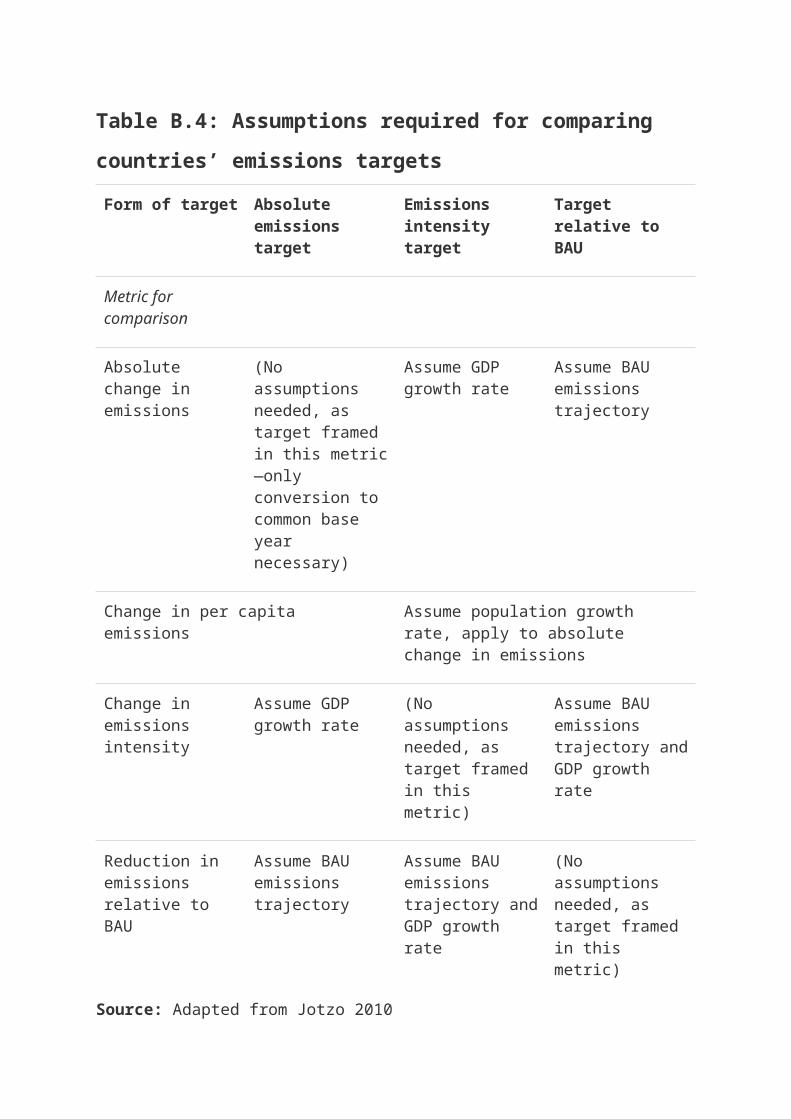
Each measure requires different data and assumptions to be made, and different assumptions will alter the results. Table B.4 provides a summary. The absolute change requires data on historical emissions. Per person emissions require data on historical emissions and also assumptions on population growth. Emissions intensity requires data on historical GDP and assumptions on future GDP. Business-as-usual (BAU) is the most complex and requires a range of assumptions, many of which are contestable.
Table B.4: Assumptions required for comparing countries’ emissions targetsForm of target Absolute
emissions target
Emissions intensity target
Target relative to BAU
Metric for comparison
Absolute change in emissions
(No assumptions needed, as target framed in this metric—only conversion to common base year necessary)
Assume GDP growth rate
Assume BAU emissions trajectory
Change in per capita emissions Assume population growth rate, apply to absolute change in emissions
Form of target Absolute emissions target
Emissions intensity target
Target relative to BAU
Change in emissions intensity
Assume GDP growth rate
(No assumptions needed, as target framed in this metric)
Assume BAU emissions trajectory and GDP growth rate
Reduction in emissions relative to BAU
Assume BAU emissions trajectory
Assume BAU emissions trajectory and GDP growth rate
(No assumptions needed, as target framed in this metric)
Source: Adapted from Jotzo 2010
The Authority has used high-quality and consistent information for as many as countries as possible. Comparisons are limited by the difficulties of finding accurate and comprehensive data for all countries.
Australian data is generally sourced from Commonwealth Government sources, including the Department of the Environment and Treasury. The Authority has used data from a range of sources for other countries. For example, emissions are from the United Nations emissions inventory database (for Annex I Parties) and the Climate Analysis Indicators Tool (CAIT) database (for other countries). The potential risk of using multiple sources is minimised by using data from credible sources that cover most of the countries.
B4.2 Choice of base yearThe Authority has chosen 2005 as a base year for the analysis in Chapter 4. Different countries express their targets against different base years. Australia generally uses 2000 levels; 1990 is used by many of the European countries; while China, India and the United States use 2005.
Depending on their circumstances, the perceived strength of different countries’ targets will look different depending on the base year. Base years affect the weight given to past effort versus future effort. Earlier base years capture changes that have occurred in the past. This might be emissions growth (for example, due to rapid economic growth) or contraction (possibly due to economic collapse or climate change policies). Taking these factors into account may be particularly justified for countries that, like Australia, have taken on previous commitments

from 1990, as they have already accepted the need for action from this point. On the other hand, later base years give a better indication of the future level of effort necessary to achieve the target.
B4.3 Comparing Australia’s target range with that of
other key countriesEach of the four measures the Authority uses to compare countries’ targets in the Targets and Progress Review provides a different way of comparing Australia’s efforts to others.
Changes in absolute emissions show the variation in total emissions levels in a country over time (see Figure B.1). Most developed countries have absolute emissions reduction targets under the UNFCCC. Developing countries’ targets may include short-term growth in absolute emissions to allow the country to develop and improve living standards.
An Australian 5 per cent target is not as strong as the targets of New Zealand, Norway, the United States and Canada. A 15 per cent target for Australia implies stronger reductions than the United States and Canada. While a 25 per cent target is at the stronger end of the countries compared, it is not as strong as the targets of New Zealand and Norway.
Figure B.1: Countries’ 2020 targets relative to 2005 levels
Note: To allow comparison across all countries, all emissions estimates use assessment report (AR2) methodology. The EU results do not include Croatia; however, this is unlikely to change the results given the relatively small size of its economy and emissions.
Sources for figures B.1–B.4 and Figure 4.3 in Chapter 4: Historical greenhouse gas emissions—Australia: Treasury and DIICCSRTE 2013; Annex I Parties: UNFCCC 2013; remaining countries: WRI 2013. This analysis uses WRI CAIT version 7. This differs from elsewhere in the report because of uncertainties over the accuracy of land use change data and because CAIT 2.0 does not include the full set of anthropogenic activities related to land use change emissions. The version 7 has been previously used in similar analysis and so allows for greater confidence in the land use change data. GDP: IMF 2013; EU (27) GDP for 2020 estimated by CCA from OECD 2013b. Population: Treasury and DIICCSRTE 2013 (Australia); United Nations 2013 (other countries). Projected BAU 2020 emissions: Treasury and DIICCSRTE 2013 where available (EU projection is for EU (25)), otherwise national projections.
Emissions intensity reflects the ratio of economy-wide greenhouse gas emissions per unit of GDP (see Figure B.2). Reductions in emissions intensity demonstrate a country’s intended rate of economic decarbonisation. China and India have framed their UNFCCC targets as reductions in emissions intensity.
Australia currently has a relatively high emissions intensity compared with other countries, even other developed countries with high levels of fossil fuel production and use, such as the United States and Canada.
All of Australia’s targets would result in 2020 emissions intensity levels that are more intensive than most developed countries, including the EU, US and Japanese targets.
Figure B.2: Emissions intensity of countries, 2005 levels and 2020 targets
Source: See Figure B.1
Changes relative to BAU emissions levels give a comparative measure of the effect of targets on emissions and the effectiveness of climate change policies (see Figure B.3). Many developing countries, including South Africa and Indonesia, have 2020 targets as reductions from BAU projections.
Projecting BAU emissions is difficult, and different definitions or assumptions can lead to substantially different estimates. The uncertainty is much higher for developing countries, which are often in the process of building large-scale infrastructure to lift their populations out of poverty. The way such infrastructure is built can have a significant impact on a country’s future emissions levels.
Previous work considering targets against BAU scenarios has attempted to grapple with the difficulty of using BAU (see Jotzo 2010 and Pew Center 2011). Jotzo notes the International Energy Agency and Energy Information Administration reflect the continuation of existing policies into the future and exclude potential future policies. These projections of countries’ BAU emissions levels will be significantly lower than a BAU scenario that removes the effect of existing climate change policies.
The Treasury and DIICCSRTE 2013 modelling is used for figures B.1–B.4 and Figure 4.3 in Chapter 4 to compare countries’ 2020 targets with their projected BAU levels as estimated from the GTEM reference case. The no price scenario from the Monash Multi-Regional Forecasting model (MMRF) is used for Australia. This allows for greater comparability, as each country’s BAU projections are based on the same set of assumptions. The Authority’s analysis on this metric is limited to only those countries included in the modelling, which means a smaller set of countries than used in the rest of the comparison analysis.
The Republic of Korea’s national BAU projections are used to estimate its 2020 target because it is not separately identified in the modelling and it has a target relative to BAU.
In some cases, differences in national BAU projections can arise from countries estimating higher BAU levels than the estimates of external sources. This would then help to make it easier for the country to meet its target. Den Elzen et al. (2013) show that most national BAU projections of developing countries are higher than those estimated by external sources.
An Australian 25 per cent target is estimated to be the strongest reduction from BAU of all the countries compared. An Australian 15 per cent target remains one of the strongest targets of the countries compared. The Australian 5 per cent target is estimated to be not as strong as the targets of South Africa, the US and Indonesia, and stronger than Canada and the EU’s minimum targets.
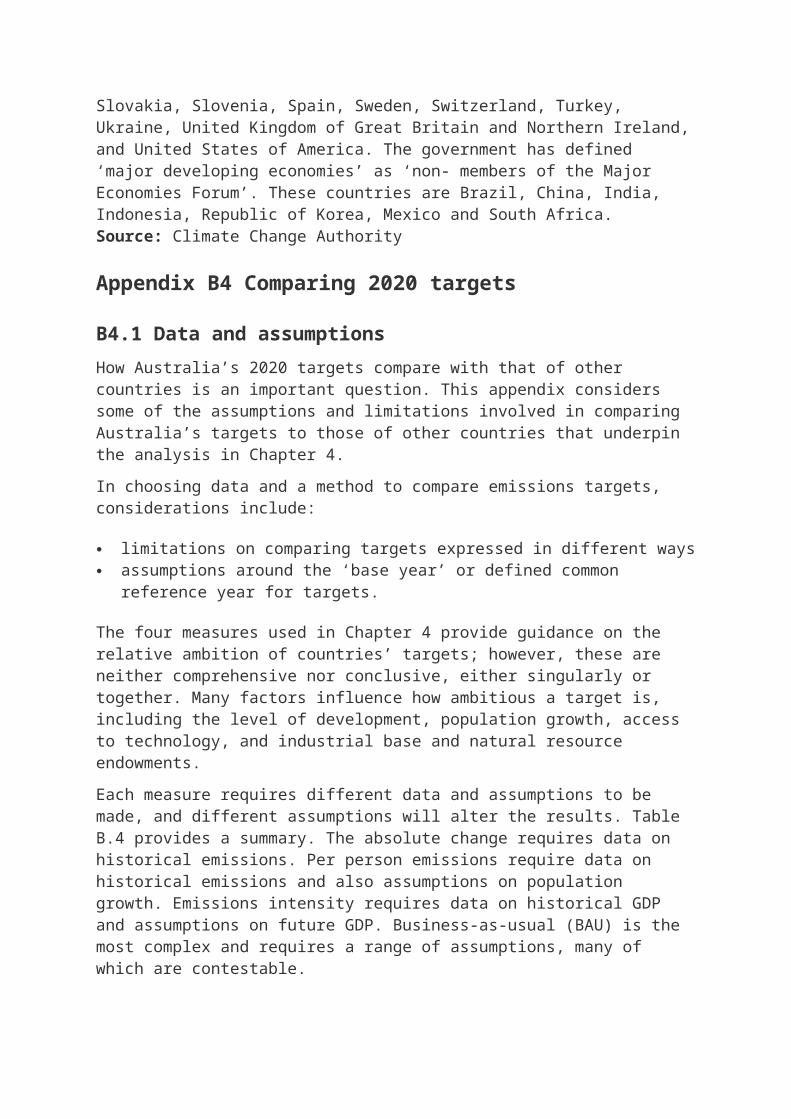
Figure B.3: Percentage change in emissions under countries’ targets relative to BAU levels at 2020
Note: The Republic of Korea is not included in Figure B.3 as it is not part of Treasury and DIICCSRTE 2013 modelling. It has a target of 30 per cent below its BAU, which is close to Australia’s 15 per cent target. Source: See Figure B.1
Per person reductions remove population growth as a variable and provide links to the contraction and convergence and equity discussions in Chapter 8 (see Figure B.4).
Australia has the highest per person emissions in 2005 of the key countries compared.
Australian 5 and 15 per cent targets would see it continue to have the highest per person emissions of the group in 2020. An Australian 25 per cent target means it would have the second-highest emissions per person in 2020 after Canada.
Figure B.4: Per person emissions of countries, 2005 levels and 2020 targets
Source: See Figure B.1