Embed Size (px)
Citation preview


CCPRC Meeting, Recession Impact on ECERichard N. BrandonOctober 30, 2009

Demand for ECE? Employment Trends
Women usually leave labor force in recession Female-dominated professions more protection,
stimulus: health care, education Demand for ECE based partially on employment
Sep-
08
Oct-0
8
Nov-0
8
Dec-0
8
Jan-
09
Feb-
09
Mar
-09
Apr-0
9
May
-09
Jun-
09
Jul-0
9
Aug-0
9
Sep-
090.910
0.920
0.930
0.940
0.950
0.960
0.970
0.980
0.990
1.000
1.010
Trends in Employment/Population Male vs. Female; Sept 2008-2009
Men 20+ Women 20+
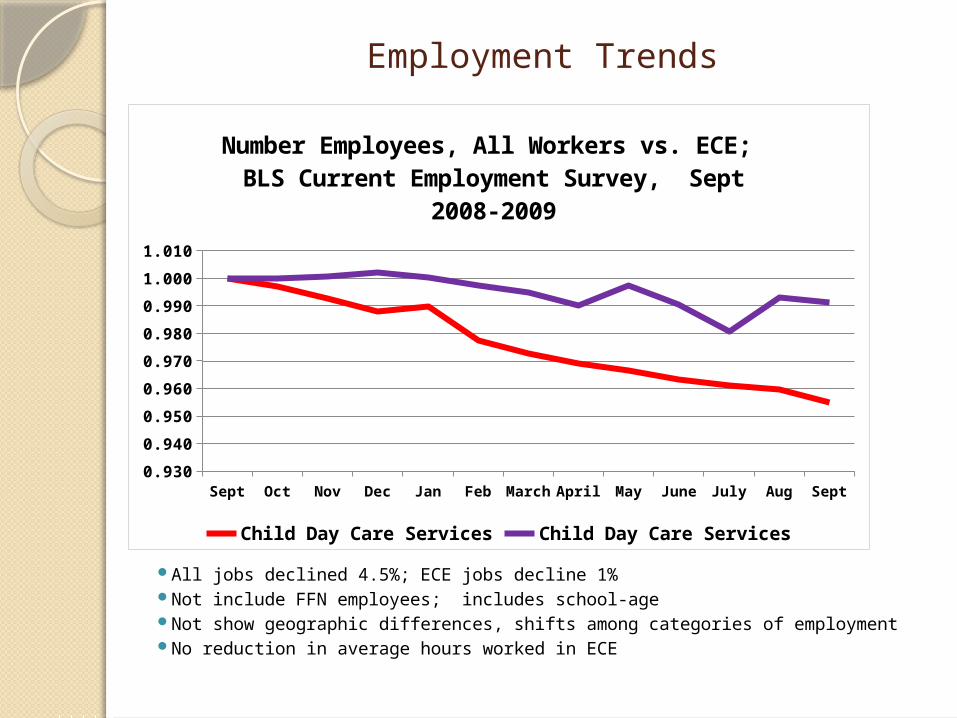
All jobs declined 4.5%; ECE jobs decline 1% Not include FFN employees; includes school-age Not show geographic differences, shifts among categories of employment No reduction in average hours worked in ECE
Employment Trends
Sept Oct Nov Dec Jan Feb March April May June July Aug Sept0.930
0.940
0.950
0.960
0.970
0.980
0.990
1.000
1.010
Number Employees, All Workers vs. ECE; BLS Current Employment Survey, Sept
2008-2009
Civilian, Non-farm Child Day Care Services


Outside Forces Affecting Child Care Markets: Insights
into Market Dynamics
Child Care Policy Research Consortium Annual Meeting
October 29, 2009
Roberta Weber, Oregon State University

Child Care as a Market
A market is the collection of buyers and sellers that, through their potential interactions, determine the price of a product or set of products.
In child care and early education, market describes how some parents and child care providers connect with one another.

Not All Providers Charge Fees and Not All Fees are Market-Based
Majority of relatives do not charge a fee Head Start and some other publicly funded
programs do not charge a fee Among those that do charge parents, only
some charge market prices• Market prices established through arm’s
length transactions• Prior relationships between parent and
provider likely to affect price Access to free care and nonmarket prices
constrains price

Child Care and Education Market is Complex
Market operates as a set of submarkets differentiated by:• Age of child• Type of care• Schedule• Geographic location
Market prices reflect differences between submarkets
Recession effects likely to vary across submarkets

County Demographic Characteristics are Associated with Child Care Prices
Housing prices were found to be strongly correlated with child care prices. • Minnesota – Fair market rent and average earnings were
positively associated with child care prices (Davis & Li, 2005). • Wisconsin – Child care prices were found to be highly
correlated with median gross rent across ages and type of provider (> 0.71). Also significantly correlated with prices was percent urban and median family income (approximately 0.70 across ages and type of care).
• Oregon – Child care prices were most highly correlated with median housing costs (0.85) and mean gross rent (0.83). These patterns continue but to a lesser extent for household income, urban/rural classification, population, and percent urban.
• Illinois – Housing costs (median rent, median home value, median real estate taxes) were highly correlated (>0.80) with prices for both centers and family child care.
• California – Factors highly correlated with child care prices were median home value (>0.52), mean gross rent (>0.48), median real estate taxes (>0.46), and median household income
For all of these states, income was correlated but the association was weaker(>0.42)

Market Forces—Providers (Supply-Side)
Average wages (+) Housing Prices (+) Regulation (mixed) Average quality (+) Public spending (+)

Market Forces—Parents (Demand-Side)
Population of children (+) Family structure
• Average number of children per family (-)• Single parent (-)
Income (+ but complex)• Household or• Female earnings
Employment level (+) Urbanization (+)

System Fueled Predominantly by Demand-Based Funding
Major demand-based public funding--$13.4 billion• Subsidy—CCDF, TANF, & State estimated at $10 billion
(USDHHS, 2009;Schulman & Blank, 2008)• Child and Dependent Care Tax Credit and DCAP
estimated at $3.4 billion (U.S. DHHS, 2005) Major supply-based public funding--$9.4 billion
• Head Start/Early Head Start estimated at $6.9 billion (USDHSS, 2008)
• Universal pre-kindergarten estimated at $2.5 billion (Barnett, Hustedt, Robin, & Schulman, 2004)
Parent fees estimated $43.9 billion (Johnson, 2005)

Factors Related to Recession Effects on Child Care and Early Education
Community-level socio-economic factors :• Household income stable or declining• Employment level declining
Public expenditures • Supply-based • Demand-based
Recession effects likely to vary by:• Community• Within community by child care submarket

Davis, E.E., & Li, N.C. (in press). Regional variation in child care prices: A cross-state analysis. Journal of Regional Analysis and Policy, 39 (1), 40-54.
Davis, E.E., Li, N., Weber, R.B., & Grobe, D. (2009, February). Child care subsidies and child care markets: Evidence from three states. Technical Report. Retrieved June 2, 2009 from Oregon State University, Family Policy Program Web site at: http://www.hhs.oregonstate.edu/hdfs/sites/default/files/PriceStudy_Final2.pdf
Ficano, C.K.C. (2006). Child care market mechanisms: Does policy affect the quantity of care?Social Science Review, 80: 453-84.
National Association of Child Care Resource and Referral Agencies. (2009). Parents and the high price of child care. Available at Child Care and Early Education Research Connections at http://www.childcareresearch.org/location/16163
NACCRRA. (2009). The impact of the recession on child care: A survey of local child care resource and referral agencies. Available at Child Care and Early Education Research Connections at
http://www.childcareresearch.org/location/15513
NCCIC. (2008, December). Impact of the economic downturn on state child care funding and subsidy policies (No. 601). An NCCIC Information Product. Available from NCCIC at http://nccic.acf.hhs.gov/index.cfm
Weber, R.B., Davis, E.E., & Grobe, D. (2009, November). Identifying thin child care markets: A conceptual and empirical approach to describing communities with atypical forces on child care supply and demand. Paper presented at APPAM Annual Research Conference.
Weber, R.B., Grobe, D., Davis, E.E., Kreader, J.L., & Pratt, C.C. (2007, May). Practices and policies: Market rate surveys in states, territories, and tribes. Retrieved on July 20, 2009 from Oregon Child Care Research Partnership at http://www.hhs.oregonstate.edu/hdfs/sites/default/files/Survey-of-States-Report-FINAL-05_30.pdf


Providers and the Recession:
Insights from Urban Institute Research
Gina Adams and Monica Rohacek
The Urban Institute
CCPRC Annual ConferenceOctober 2009

Sources
Insights gleaned from UI work on providers – specifically:
Understanding Quality in Context: Child Care Centers, Communities, Markets, and Public Policy* (Rohacek, Adams, and Kisker, under review)
Research on vouchers and child care providers from Child Care Providers and the Subsidy System* (various publications available and forthcoming)
* More information on these studies at end of handout

Possible Research Concerns
What are providers experiencing in relation to economic downturn?
How are providers (specifically center-based providers) responding?
What does this mean for children and families?

Overarching Theme
Likely to see different responses for different providers, because provider behavior shaped by complexity of interacting factors:
Individual provider characteristics
Program characteristics
Market/community context
Policy context (combined federal, state, and local)
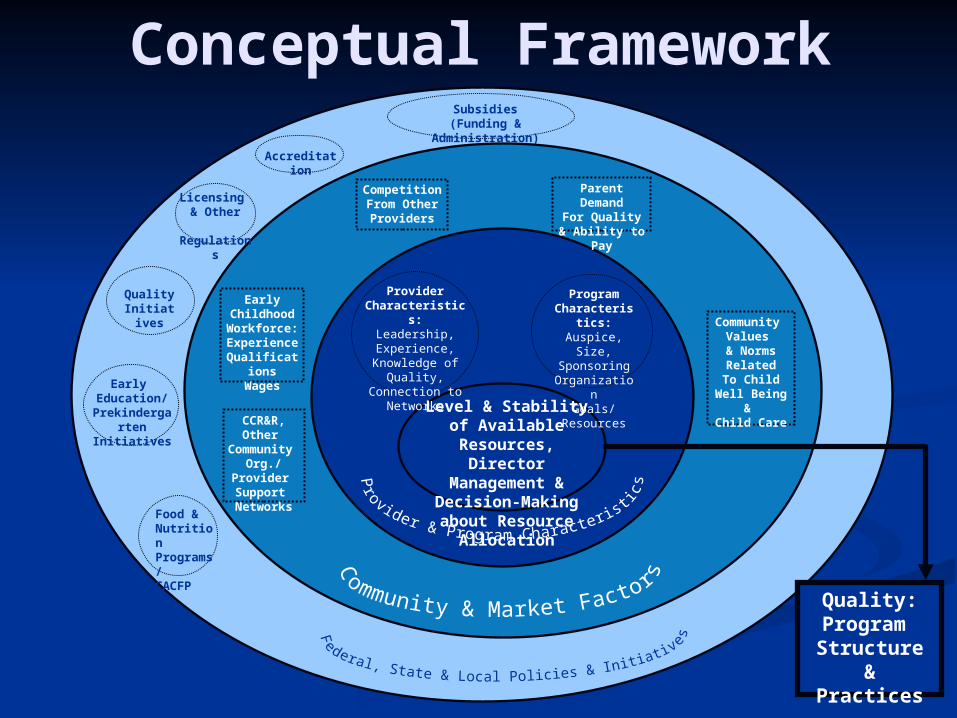
Conceptual FrameworkSubsidies
(Funding & Administration)
Level & Stabilityof Available Resources,
Director Management & Decision-Making about
Resource Allocation
Provider Characteristics:
Leadership, Experience,
Knowledge of Quality, Connection
to Networks
Program Characteristics:
Auspice, Size,Sponsoring
OrganizationGoals/Resources
Community Values
& NormsRelatedTo Child
Well Being & Child Care
CompetitionFrom Other
Providers
Early ChildhoodWorkforce:Experience
QualificationsWages
CCR&R, Other
Community Org./Provider
Support Networks
Early Education/
PrekindergartenInitiatives
Parent DemandFor Quality
& Ability to Pay
QualityInitiatives
Licensing & Other
Regulations
Food & NutritionPrograms/CACFP
Quality:Program Structure
& Practices
Accreditation

What Providers Experienced
Some providers reported drops in enrollment – due to decreases in private pay parents or decreases in vouchers due to subsidy cuts
Others holding steady but indicated concerns that this would occur

Strategies to Deal With Reductions in Revenue…
Delaying payment of bills
Reducing staff hours (difficult tradeoff with laying off staff)
Combining partially-enrolled classrooms/closing one class
Forgoing teacher salary increases
Reducing benefits
continued…

…Strategies to Deal With Reductions in Revenue
Putting plans for program improvement on hold (including capital improvements, sending teachers to school)
Reducing own salary or putting own funds into program operation
Delaying fee increases Making adjustments to keep families
(reducing or waiving fees, accepting families with less optimal schedules, accepting families otherwise might reject)
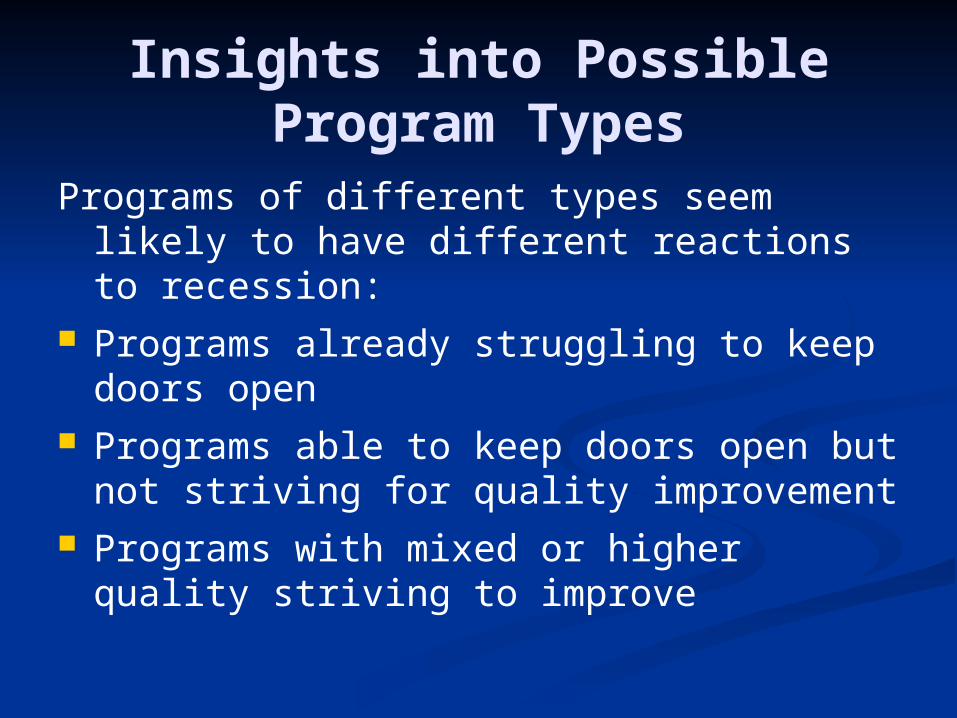
Insights into Possible Program Types
Programs of different types seem likely to have different reactions to recession:
Programs already struggling to keep doors open
Programs able to keep doors open but not striving for quality improvement
Programs with mixed or higher quality striving to improve

Insights into Key Dimensions
Related to Program Types Resource levels, and how used Provider leadership, motivation, vision* Provider financial management authority
and ability* Flexibility in allocating resources*
* Highlights importance of provider and program level information – do not have good measures

Insights on Voucher Patterns
Willingness to accept vouchers (and how many) shaped by:
Provider characteristics (motivation, financial and business management abilities and goals)
Whether have alternatives to vouchers * (private pay parents, other income sources, or other funding streams)
Perception of, and experience with, voucher policies/ practices, and with families receiving vouchers
Whether actually serve families with vouchers, and how many, also depends upon # of families with vouchers applying to the program. Related to parent demand, voucher funding*, and provider outreach.
*Likely to be affected by recession

Implications for Research Assessments of the impact of the recession must
allow for a diversity of reactions or effects While preliminary, may be able to use provider
types and key dimensions to simplify – challenge is that several dimensions are ones for which we do not currently have good measures
Consider (or explore) contextual complexities while designing research, as different factors likely to be in play for different providers in different communities
Consider collecting/using complementary data to inform analysis if needed, given limitations of datasets to capture multiple levels of information
Be aware of contextual factors in interpreting data


3 QUESTIONS – Table Discussion
Are you aware of state-level efforts to assess the effects of the recession?
What research questions would help us learn from the recession?
What data sources could be used to help answer these questions?
We will be collecting these…