Embed Size (px)
Citation preview

CCS-M T4 Training Course Data set for work shops Compiled by Rita Sande Rød and Fridtjof Riis Geological data from NPD Barents Sea Atlas (2013): http://www.npd.no/Global/Norsk/3-Publikasjoner/Rapporter/CO2-ATLAS-Barents-sea-2013.pdf Some gas volumes have been modified and are not real. The data set contains different classes of information which are typically used in the evaluation of CO2 storage.
1. Background and site selection
2. Evaluation of storage capacity

1. Background and site selection
Overview map of study area with bathymetry and coastline, discoveries/fields (red- gas, green- oil), gas pipelines (orange) and environmentally restricted zone (gray). Numbers show recoverable gas reserves for each structure. Total recoverable gas reserves Snøhvit area (methane + CO2) 260 BSm3 Annual gas production (methane + CO2) 4.6 MSm3/y Annual need for CO2 injection 2.1 Mt/y Volumes are based on real data, but adjusted to a case where CO2 content is 20 % (for exercice purpose)
129
30 13
55 15
7
12
50 % CO2
Bathymetry
200 km
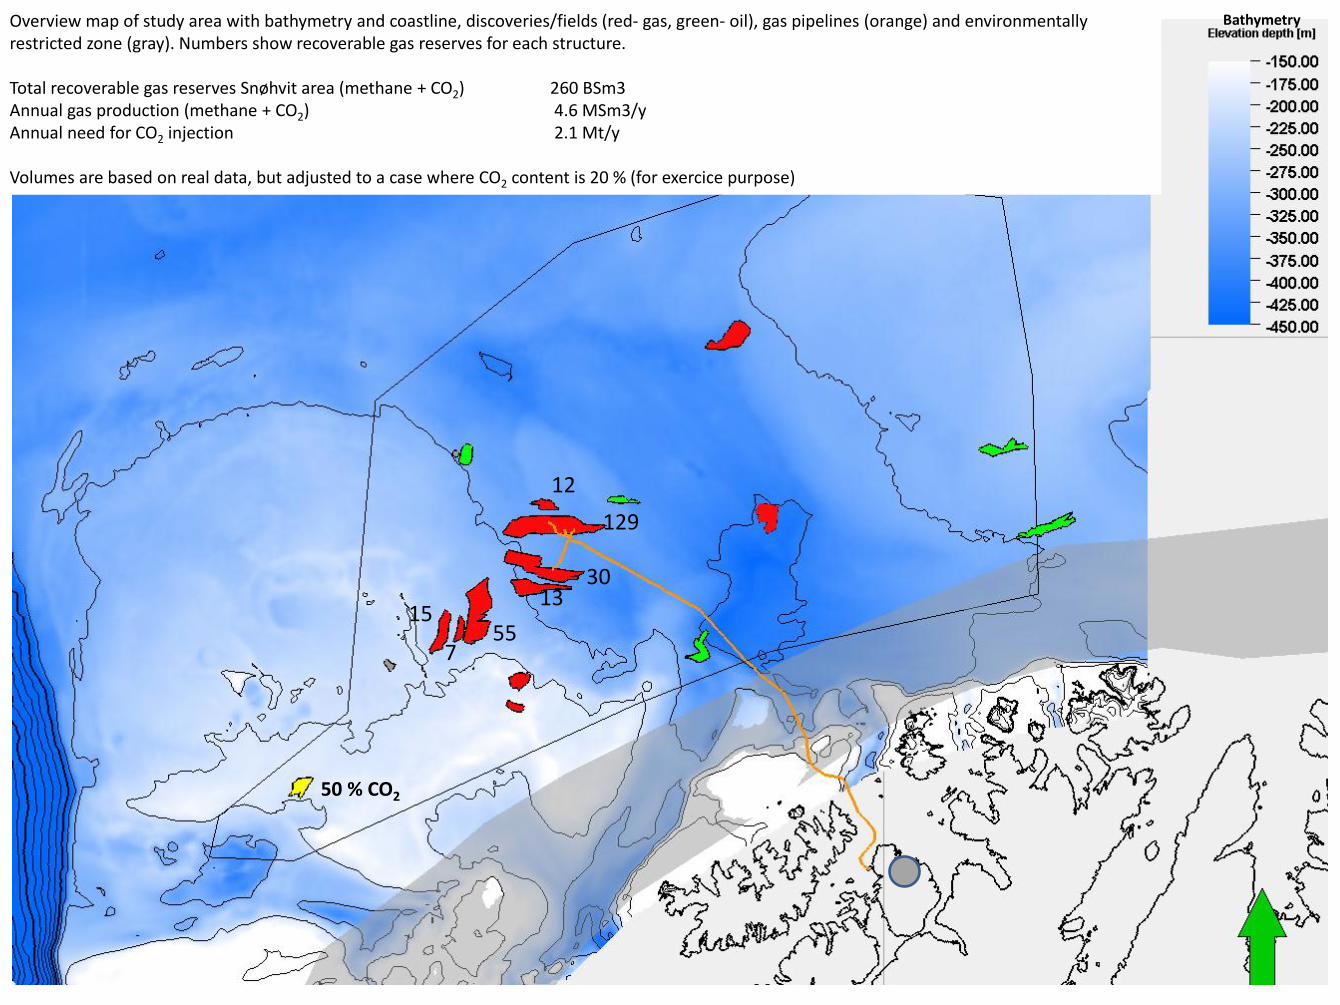
Location map showing populated areas
Finland Russia
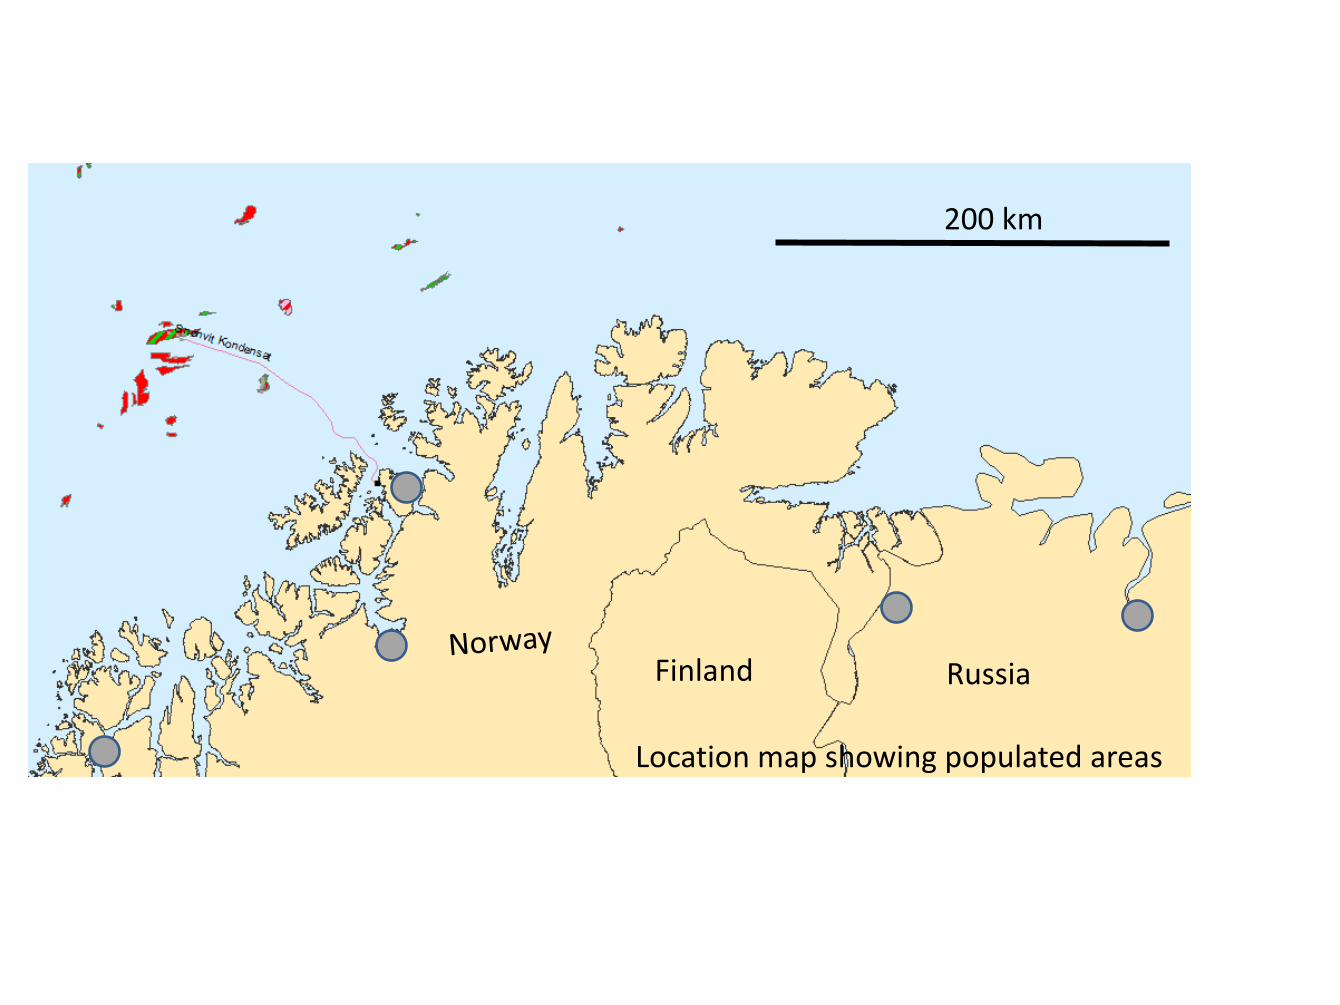
Location of seismic profiles and well cross section Red line: Major faults
20 km
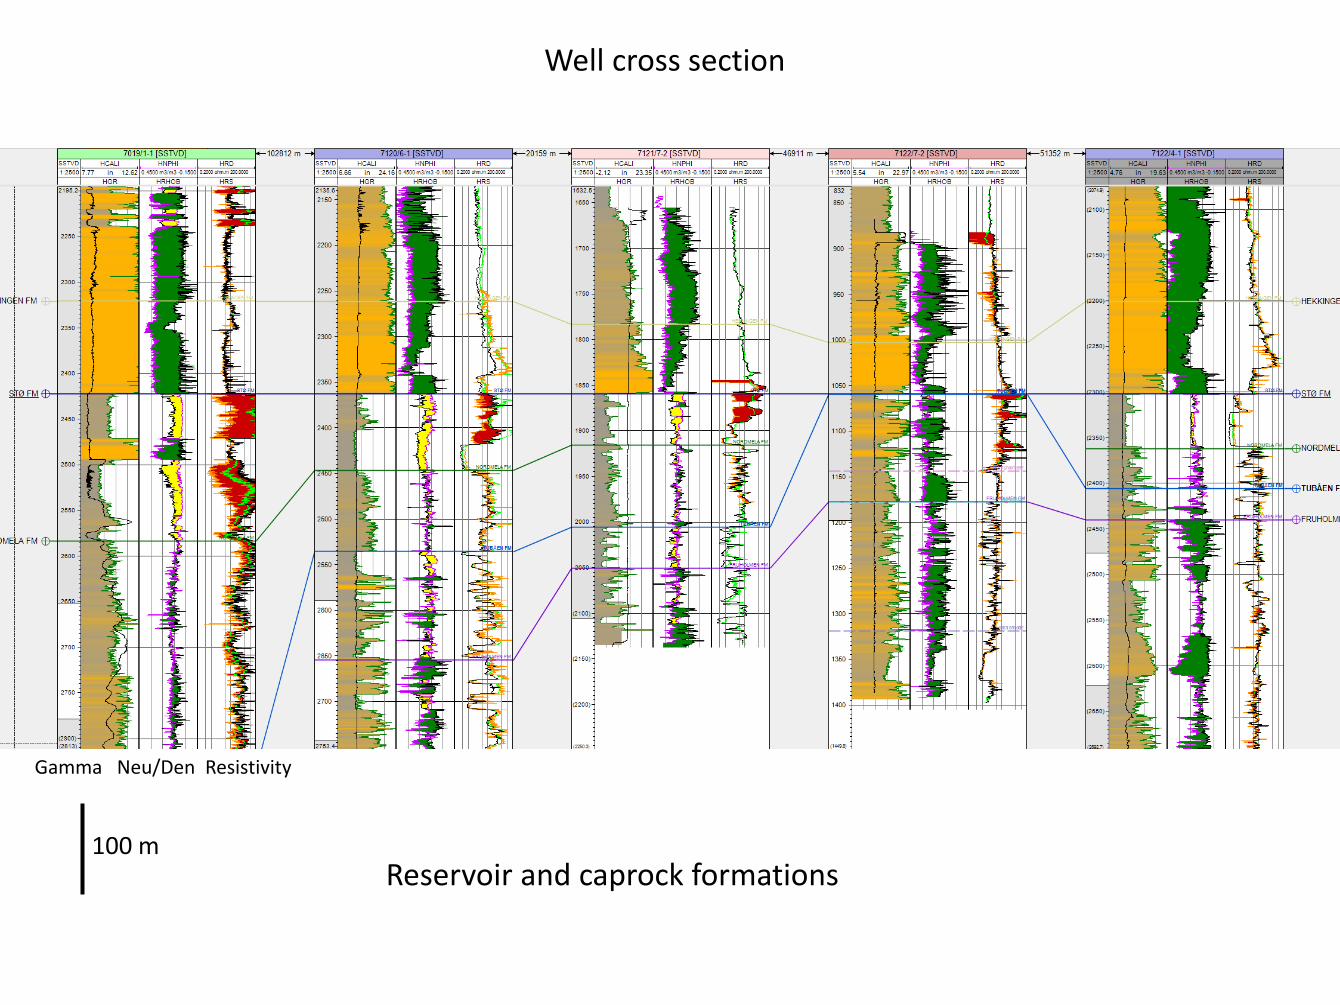
Well cross section
Gamma Neu/Den Resistivity
100 m Reservoir and caprock formations
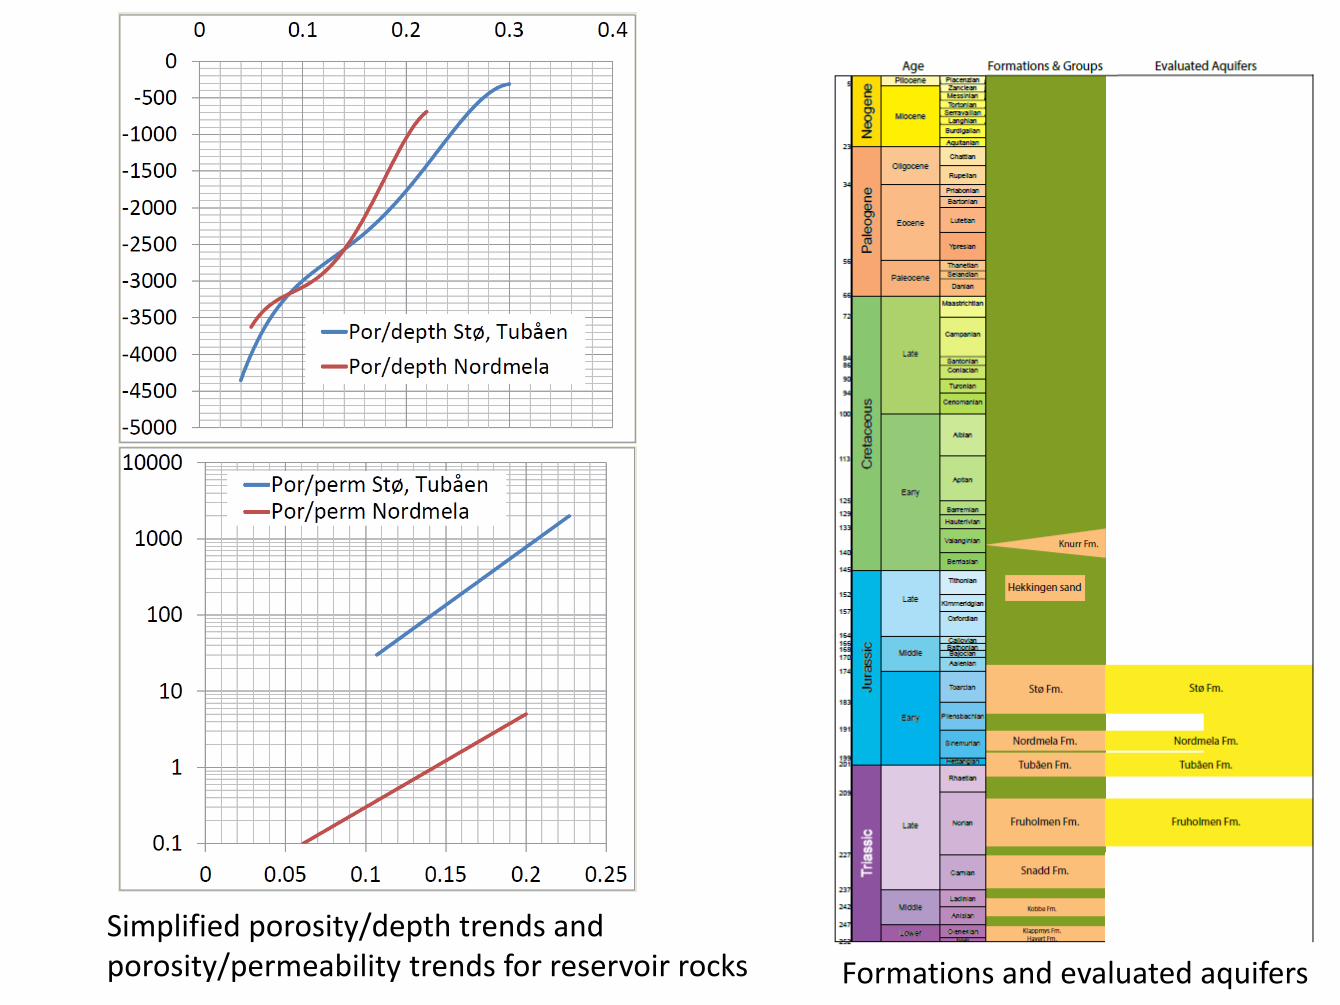
Simplified porosity/depth trends and porosity/permeability trends for reservoir rocks Formations and evaluated aquifers
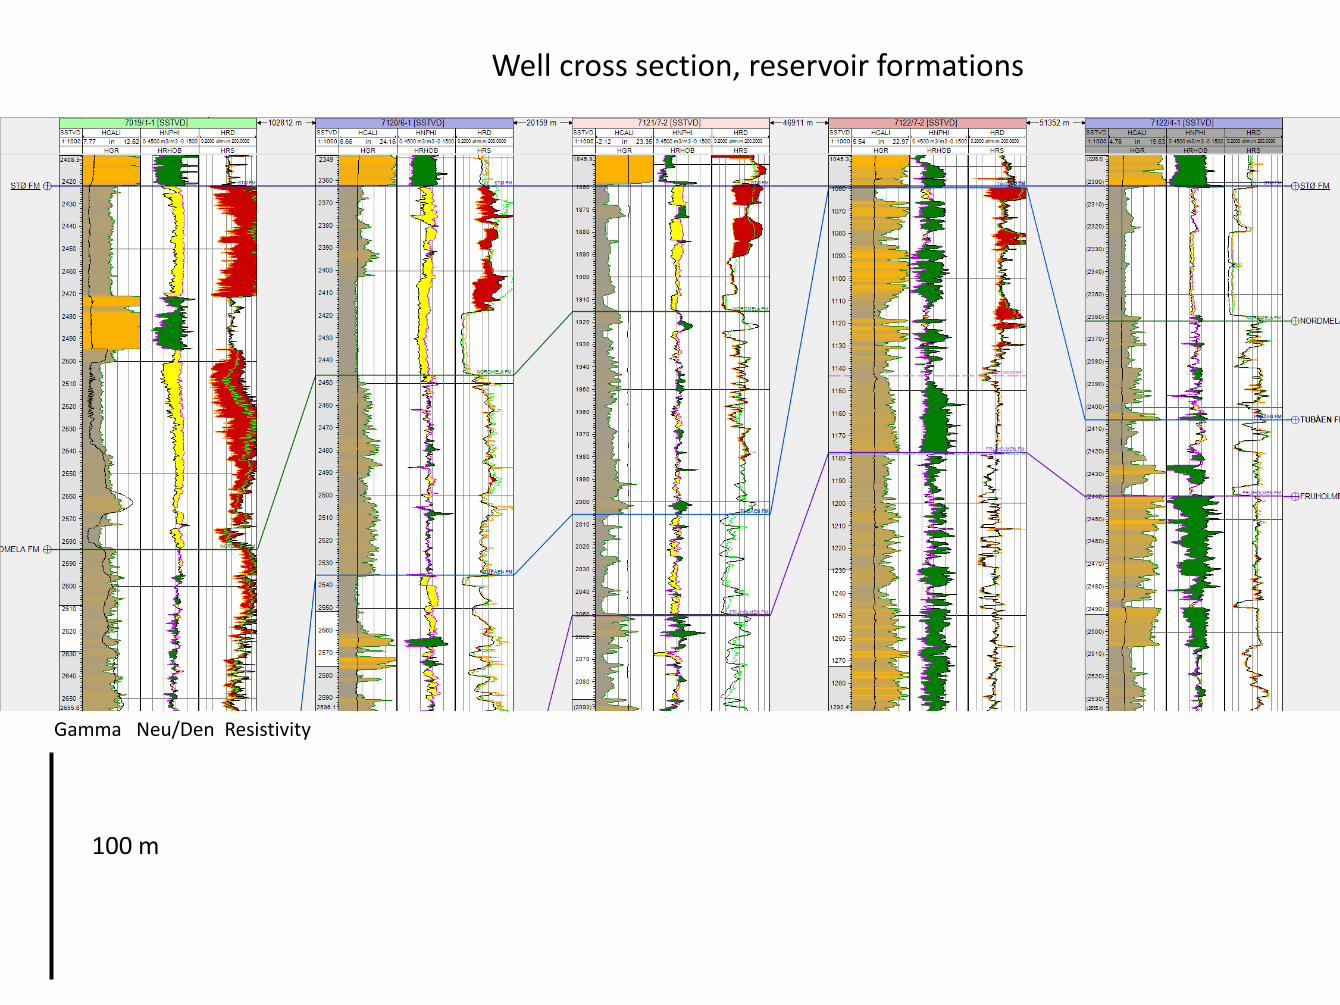
Well cross section, reservoir formations
Gamma Neu/Den Resistivity
100 m

Well tops:
Core photos of 7120/6-1 Stø, Nordmela and Tubåen Fm
All cores, indicating oil stain from a paleo oil zone
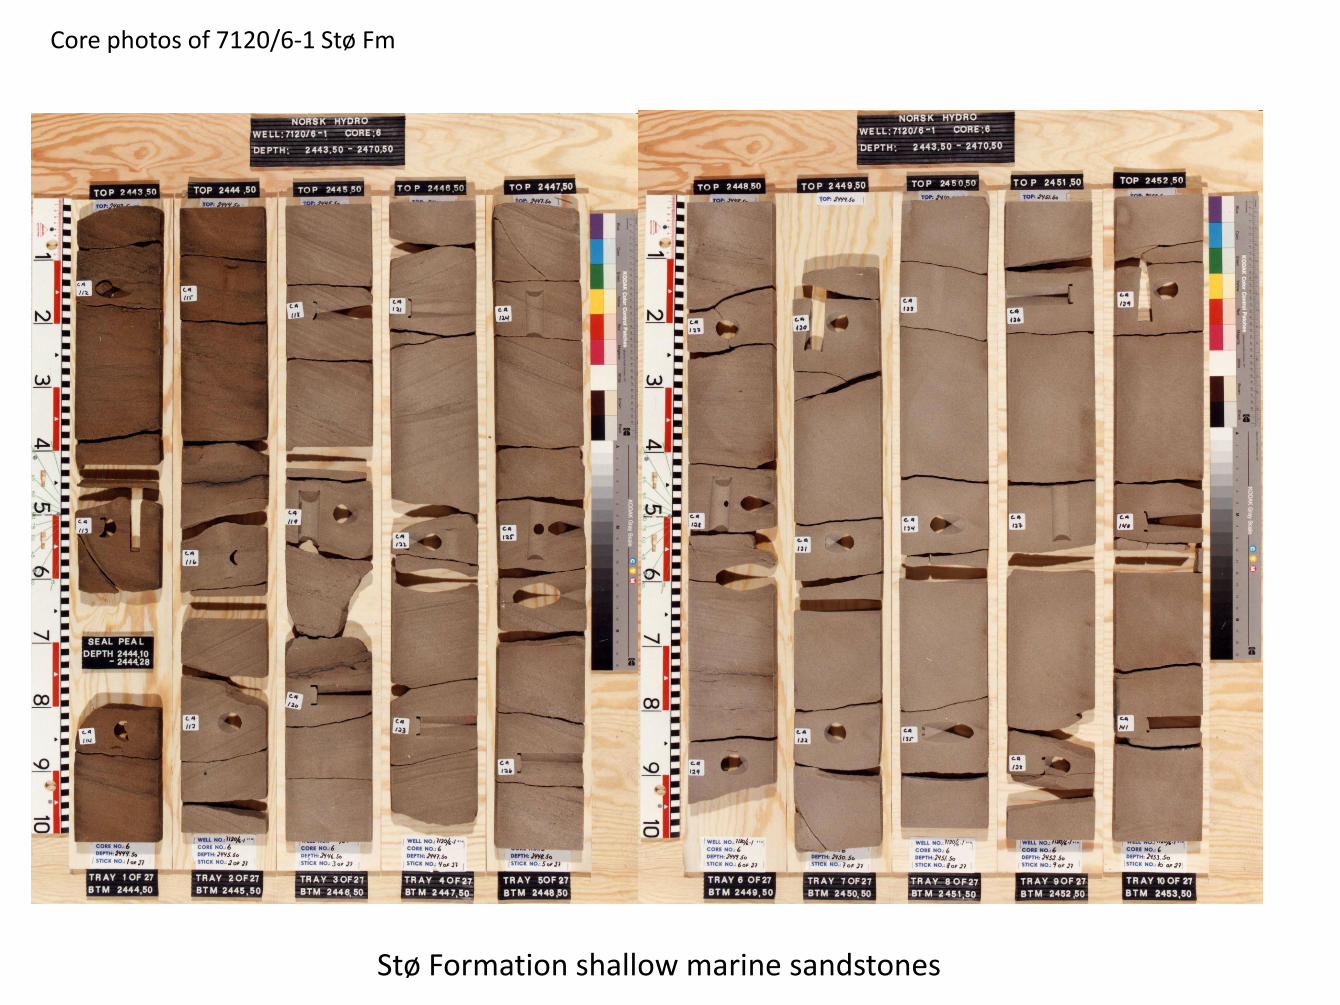
Core photos of 7120/6-1 Stø Fm
Stø Formation shallow marine sandstones
Core photos of 7120/6-1 Nordmela Fm
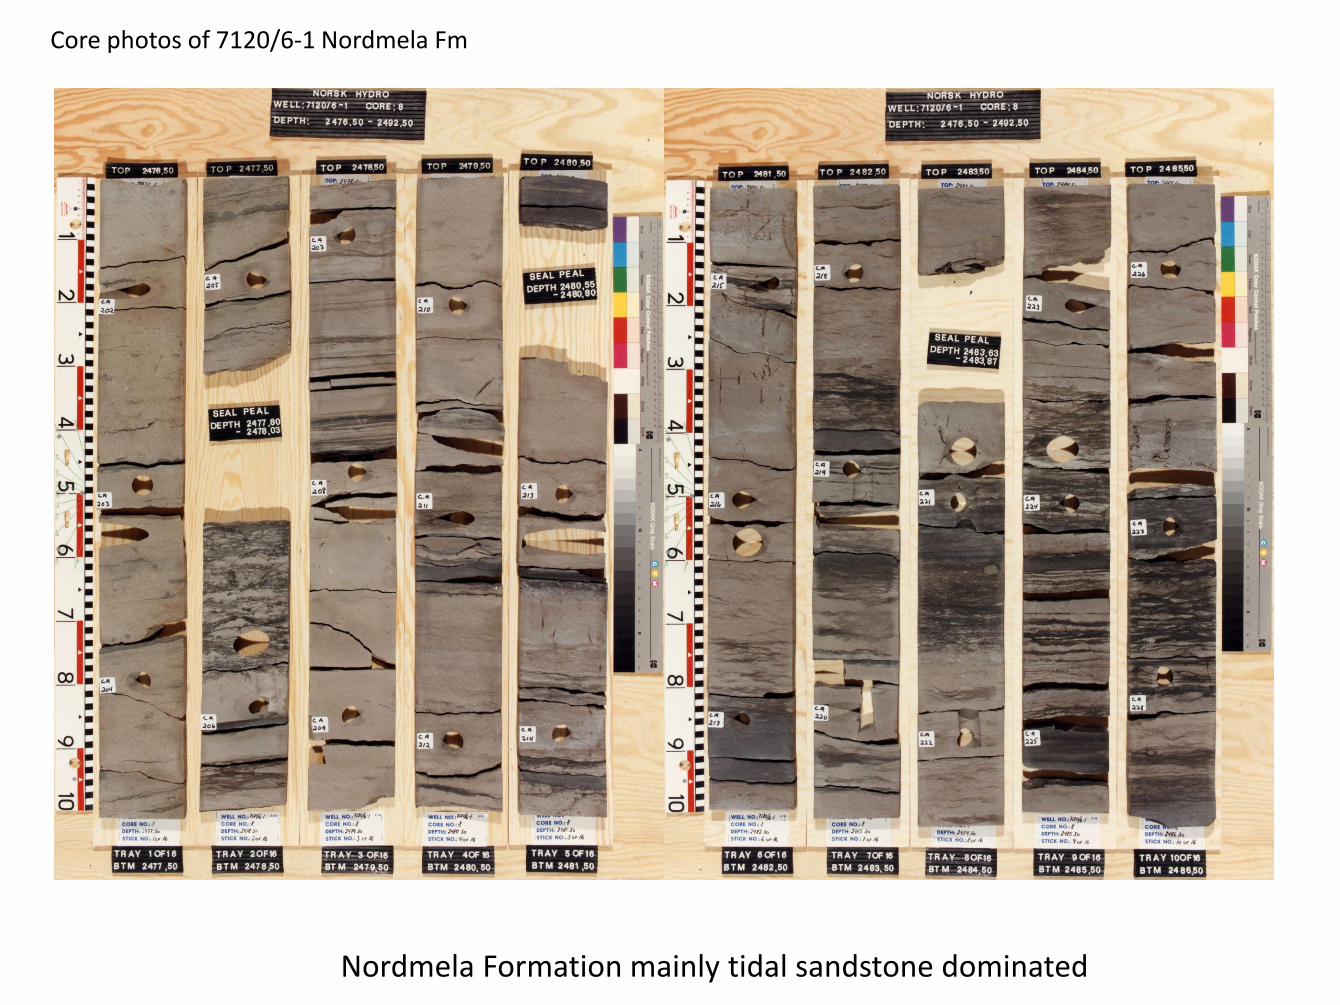
Nordmela Formation mainly tidal sandstone dominated
Core photos of 7120/6-1 Tubåen Fm
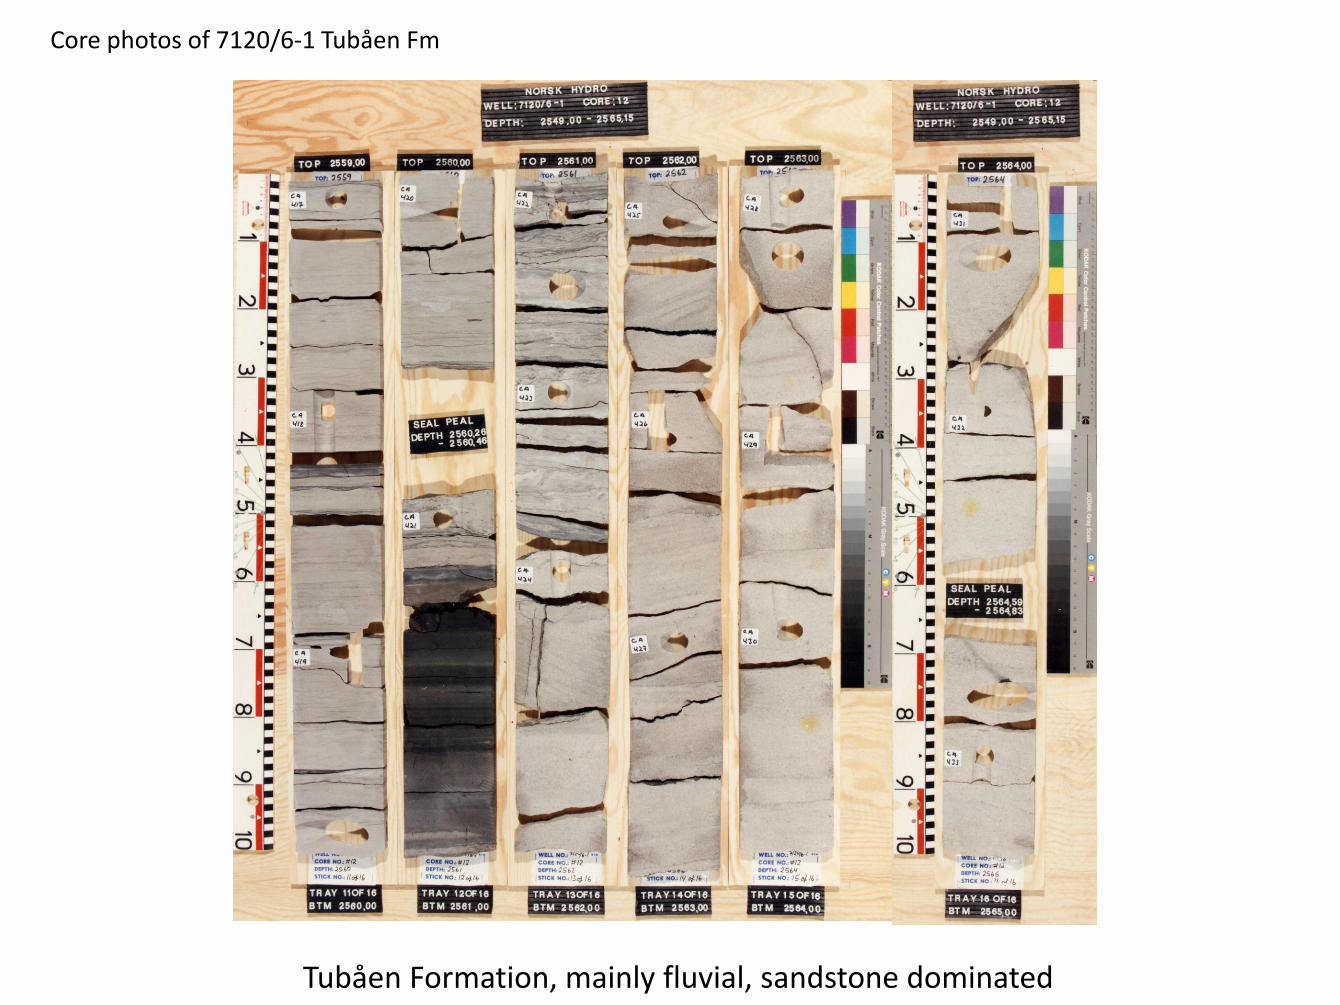
Tubåen Formation, mainly fluvial, sandstone dominated
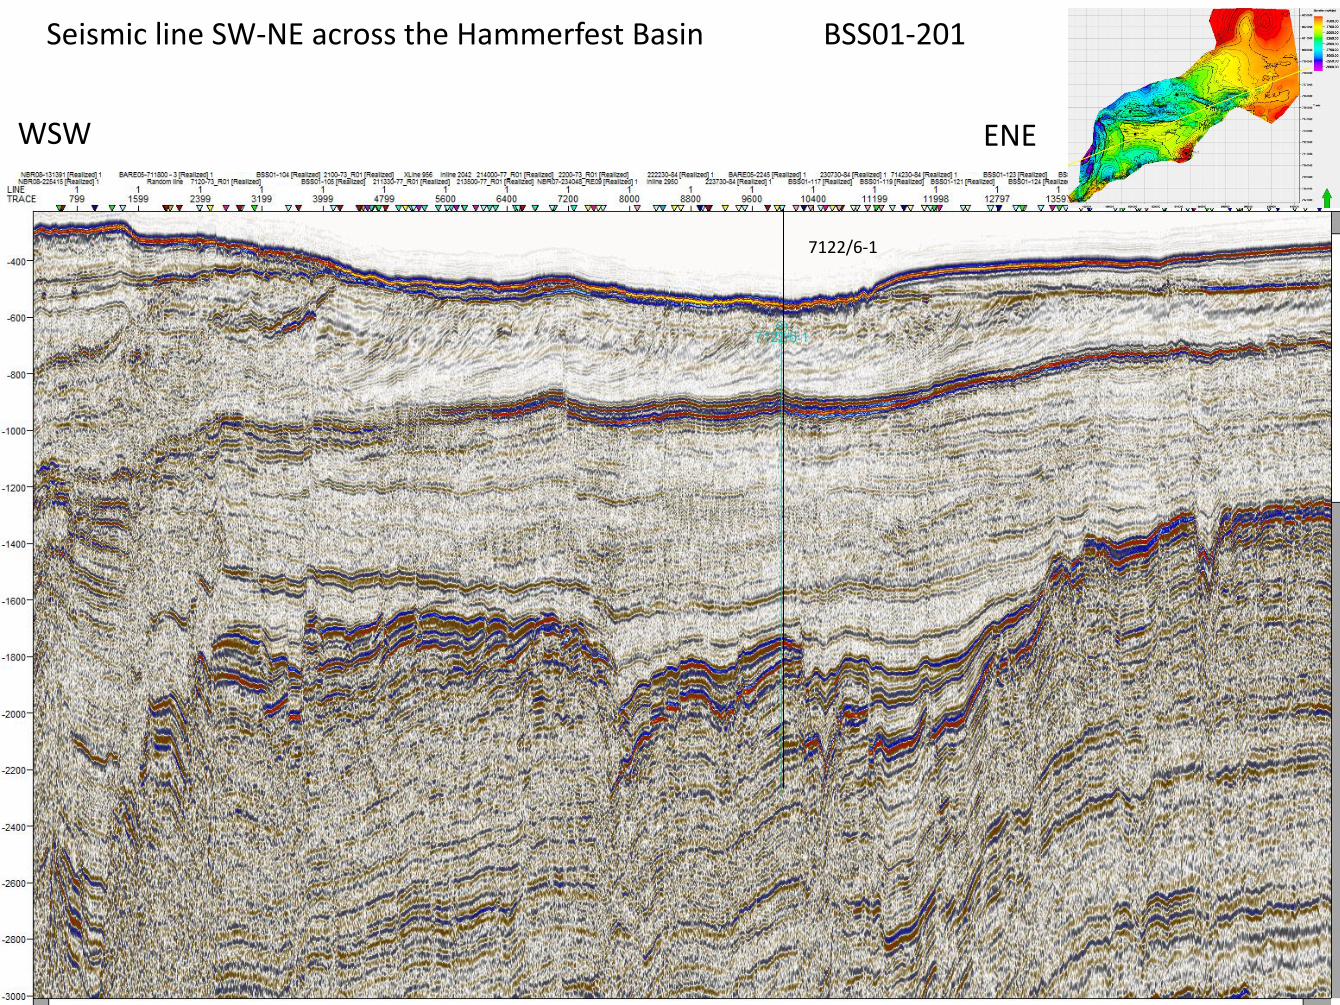
BSS01-201 Seismic line SW-NE across the Hammerfest Basin
7122/6-1
WSW ENE
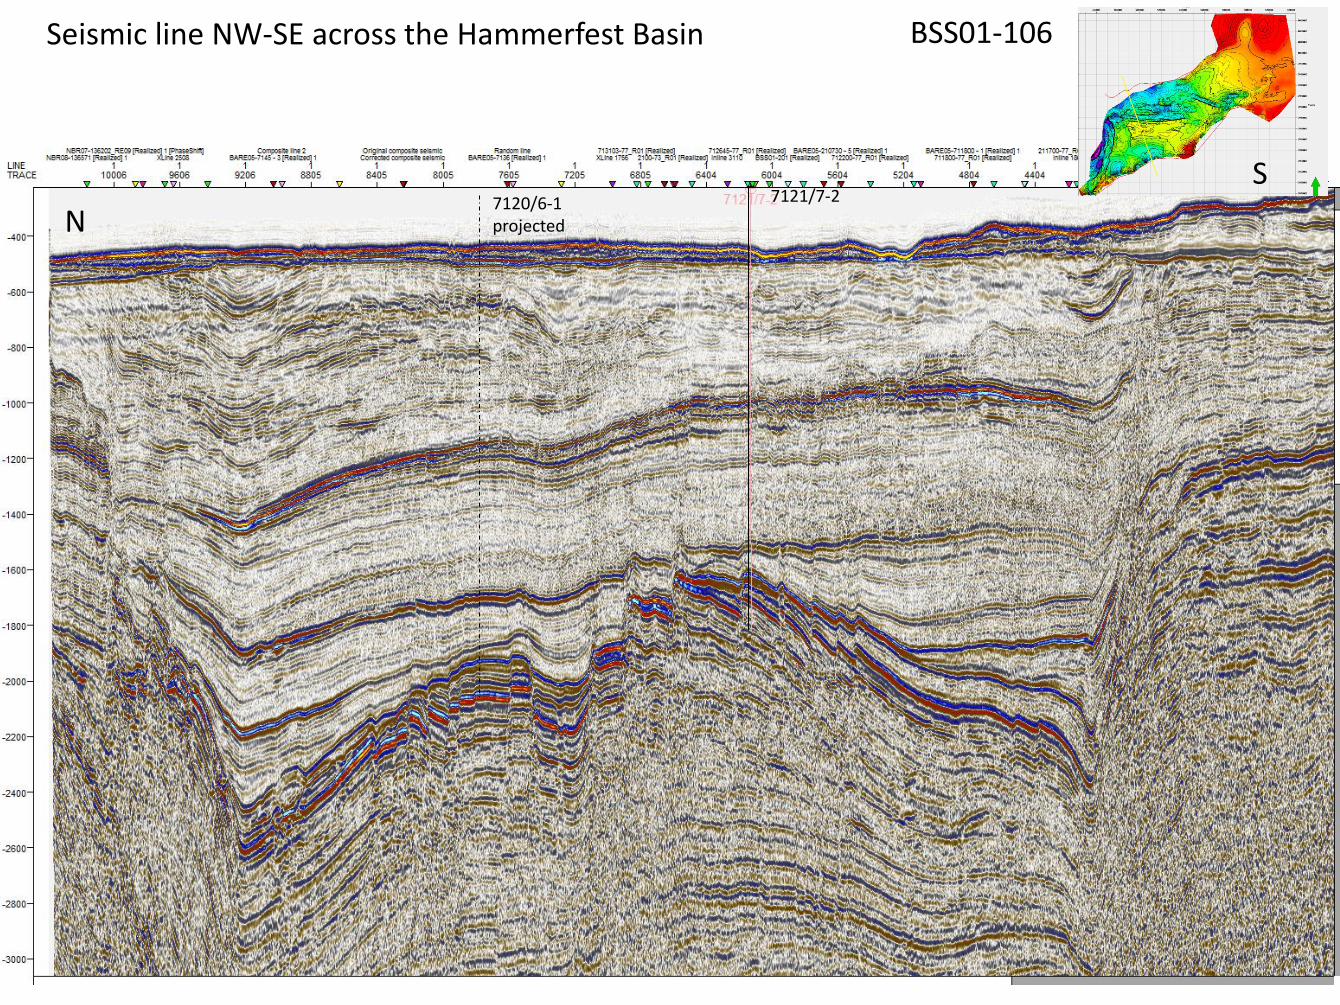
BSS01-106 Seismic line NW-SE across the Hammerfest Basin
7121/7-2 7120/6-1 projected N
S

Seal: thinning, gas leaks, faulting.
Communication towards the sea floor. North east part of Jurassic aquifer.
N S
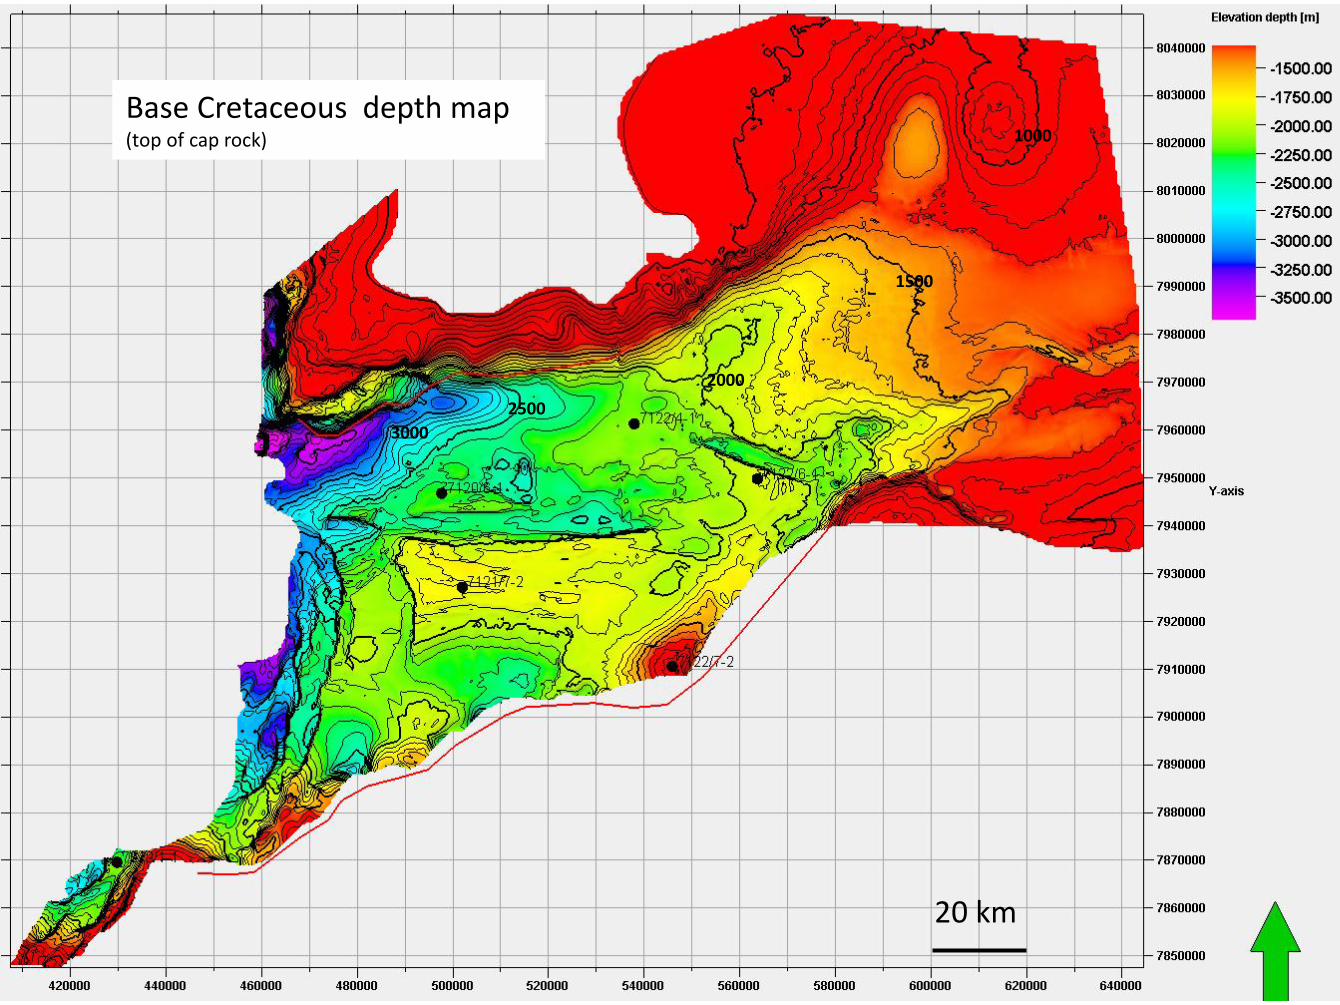
Base Cretaceous depth map (top of cap rock)
1500
2000
2500
3000
1000
20 km
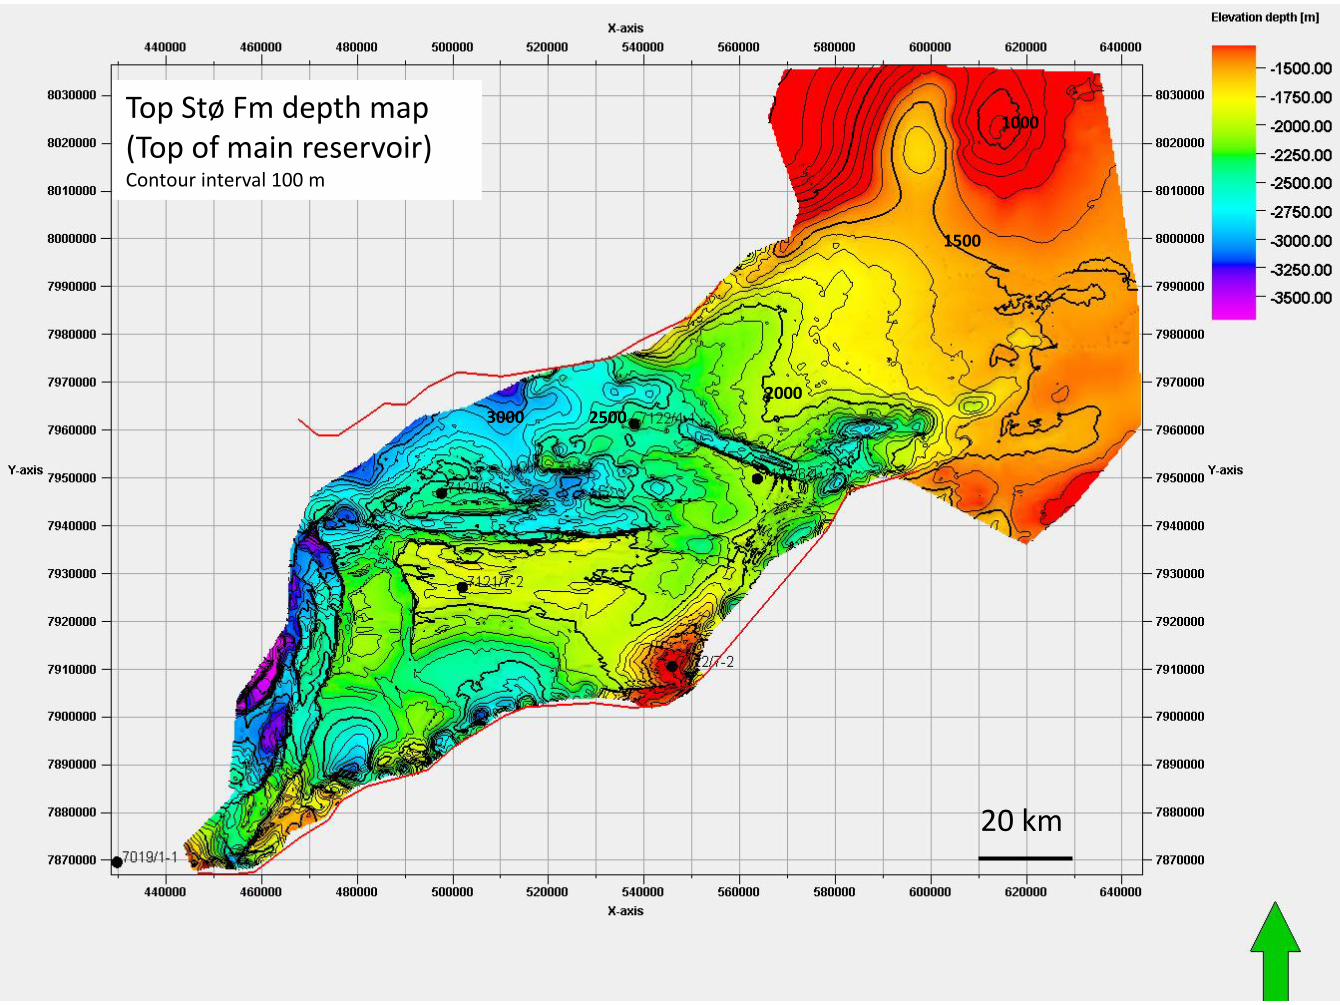
Top Stø Fm depth map Top Stø Fm depth map (Top of main reservoir) Contour interval 100 m
1500
2000
2500 3000
1000
20 km
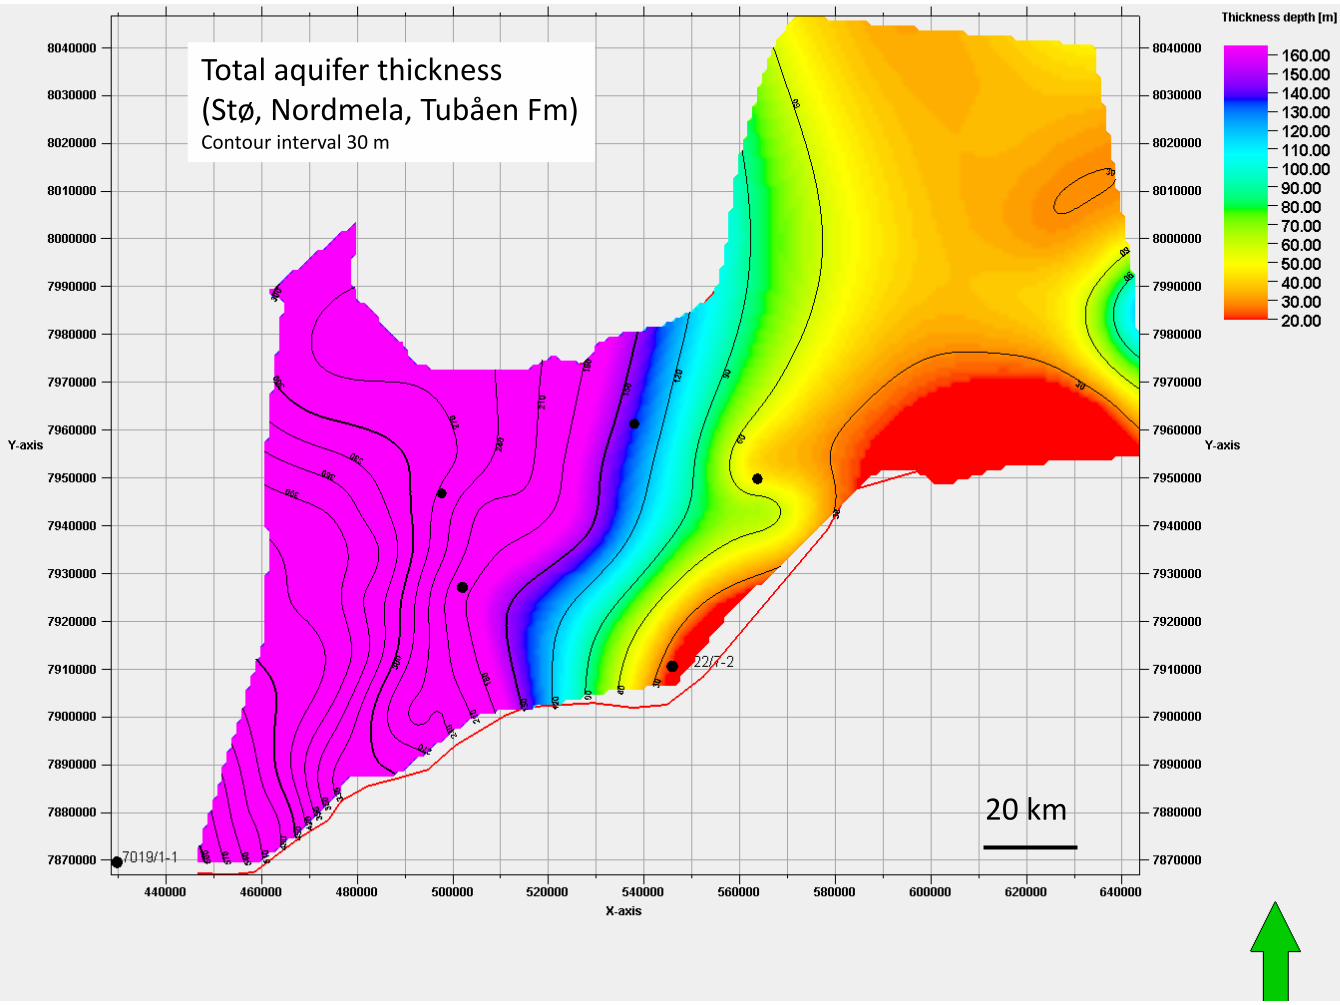
Total aquifer thickness (Stø, Nordmela, Tubåen Fm) Contour interval 30 m
20 km
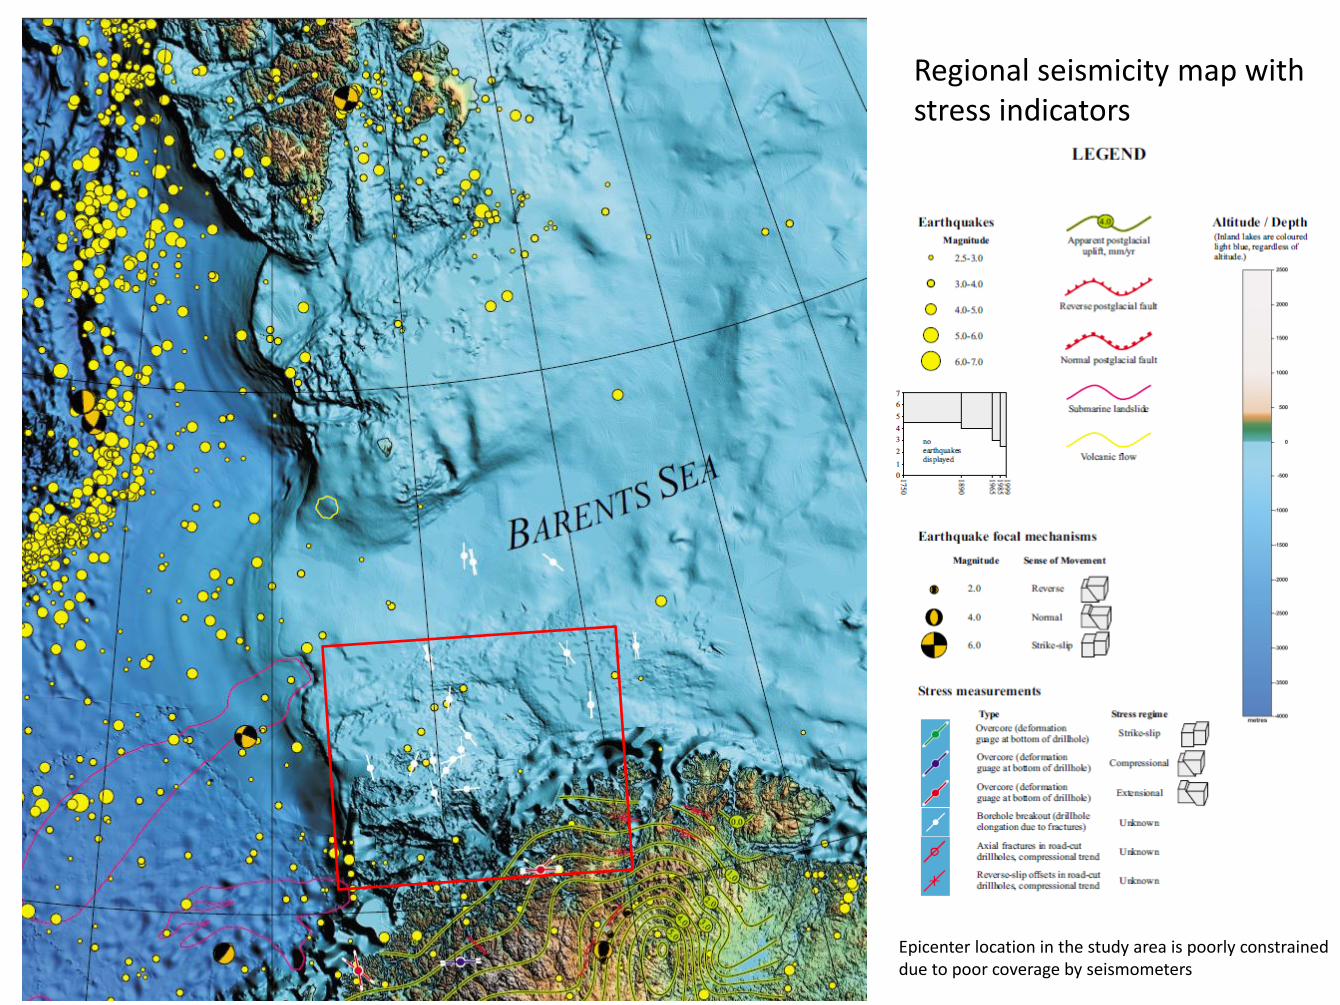
Regional seismicity map with stress indicators
Epicenter location in the study area is poorly constrained due to poor coverage by seismometers
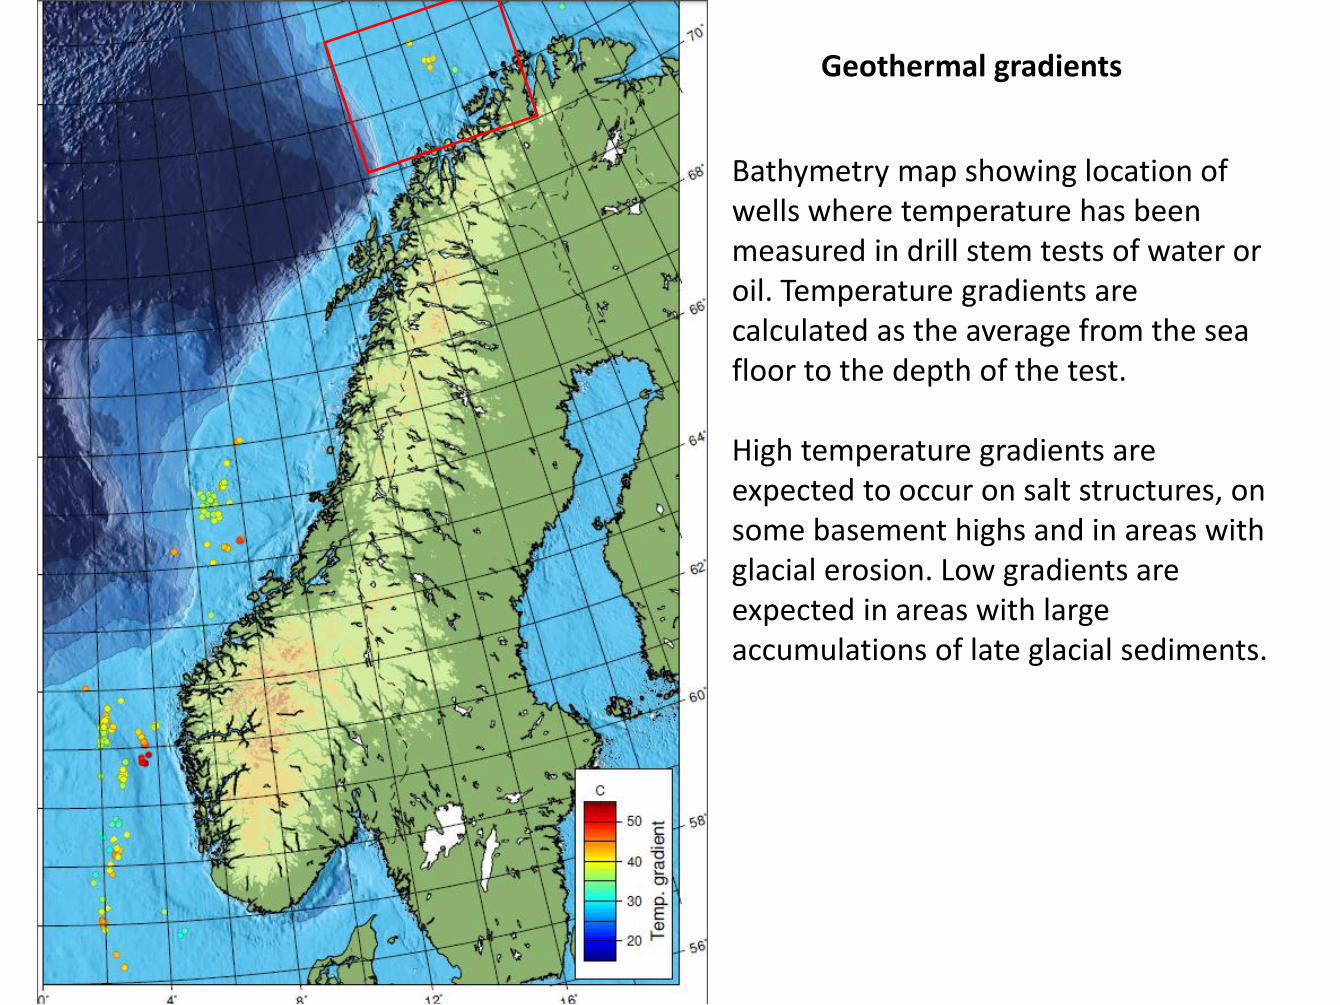
Geothermal gradients
Bathymetry map showing location of wells where temperature has been measured in drill stem tests of water or oil. Temperature gradients are calculated as the average from the sea floor to the depth of the test. High temperature gradients are expected to occur on salt structures, on some basement highs and in areas with glacial erosion. Low gradients are expected in areas with large accumulations of late glacial sediments.
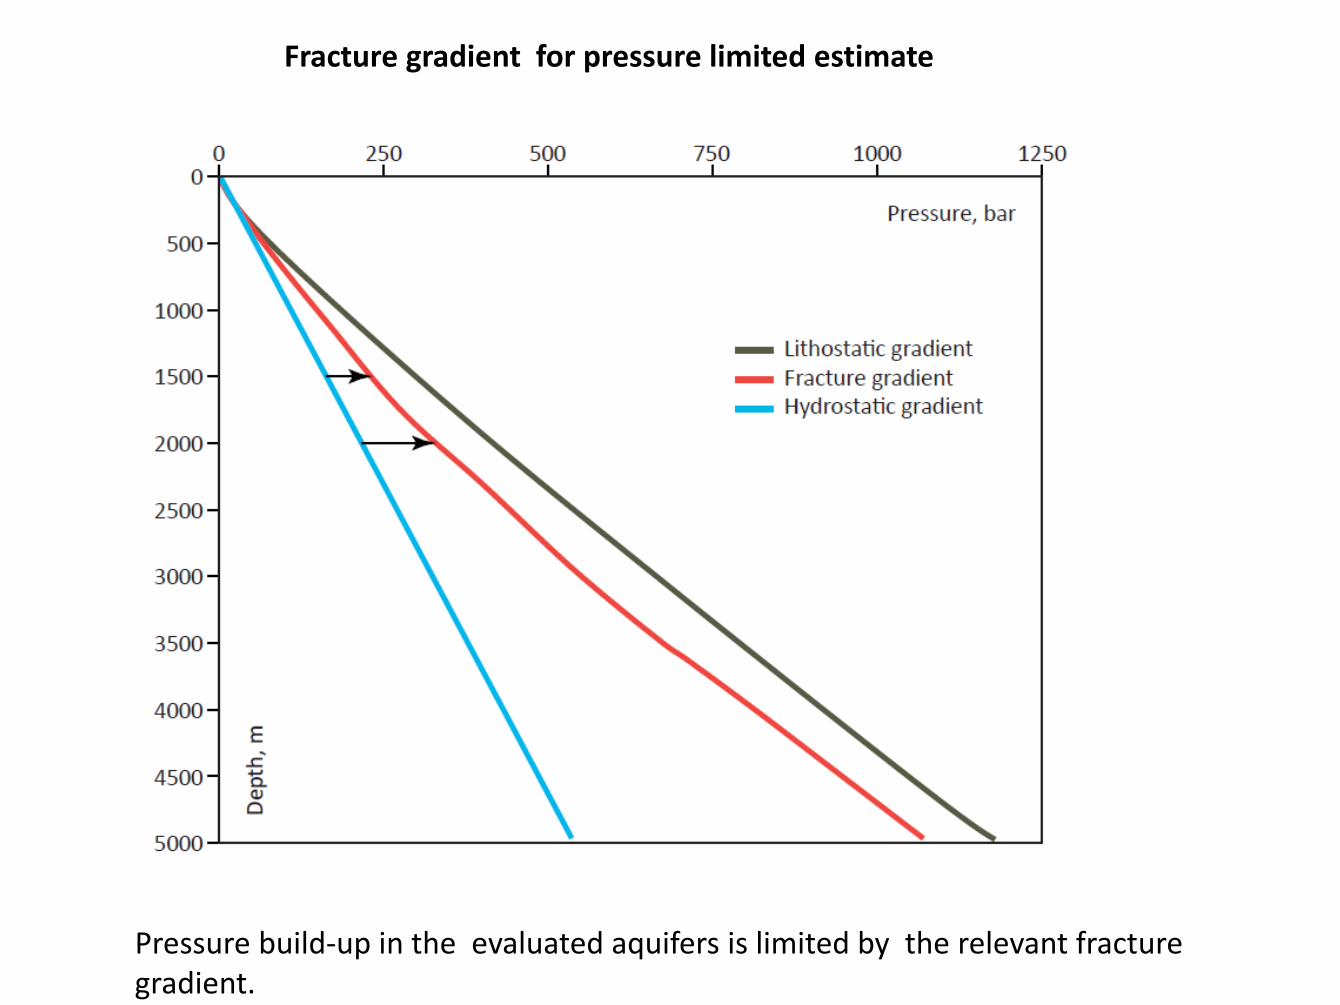
Fracture gradient for pressure limited estimate
Pressure build-up in the evaluated aquifers is limited by the relevant fracture gradient.
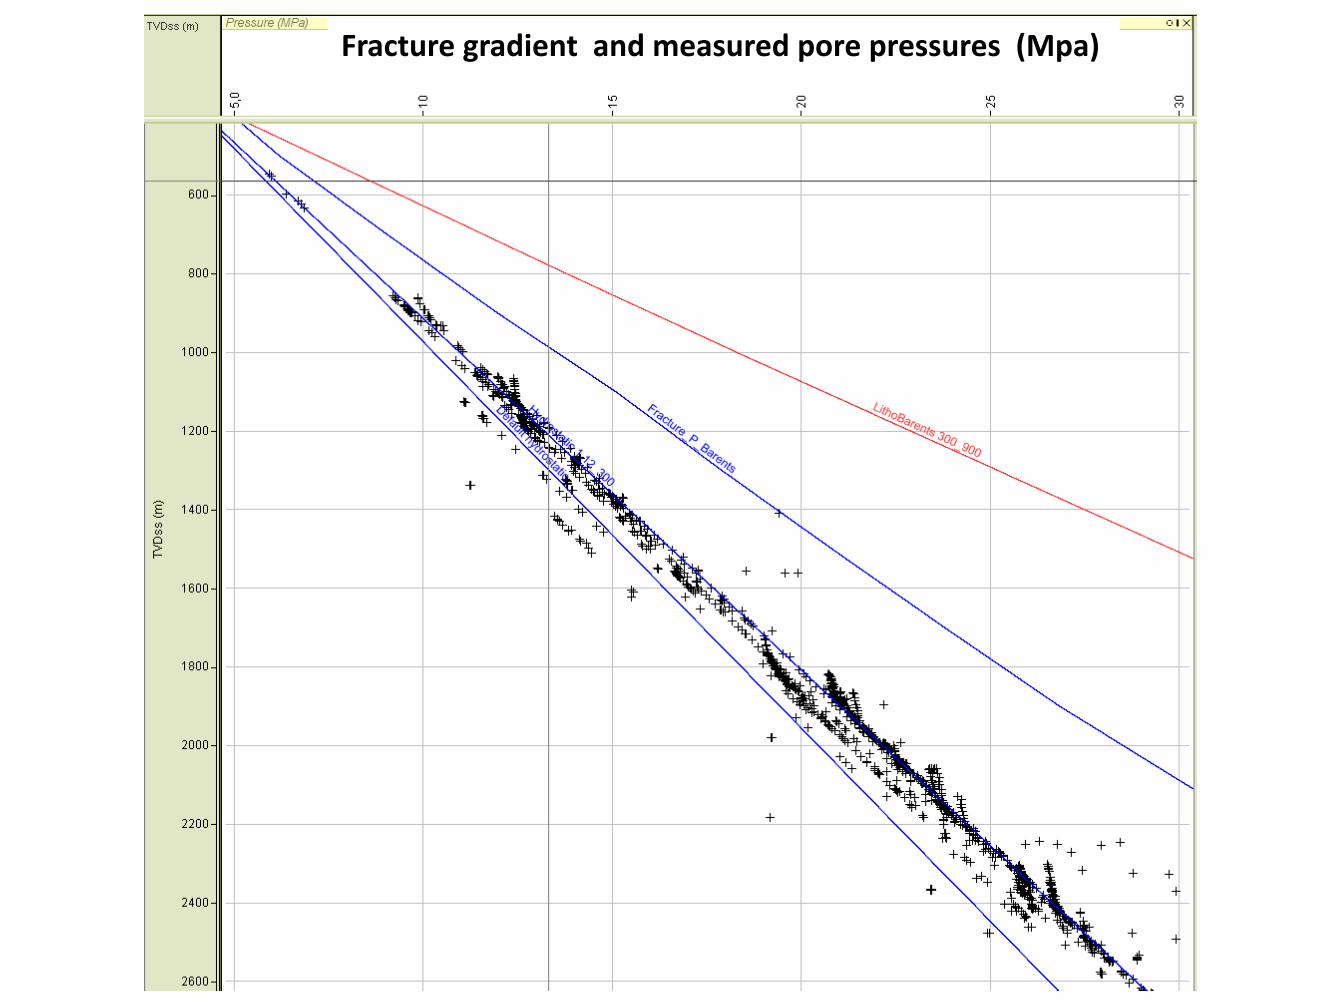
Fracture gradient and measured pore pressures (Mpa)
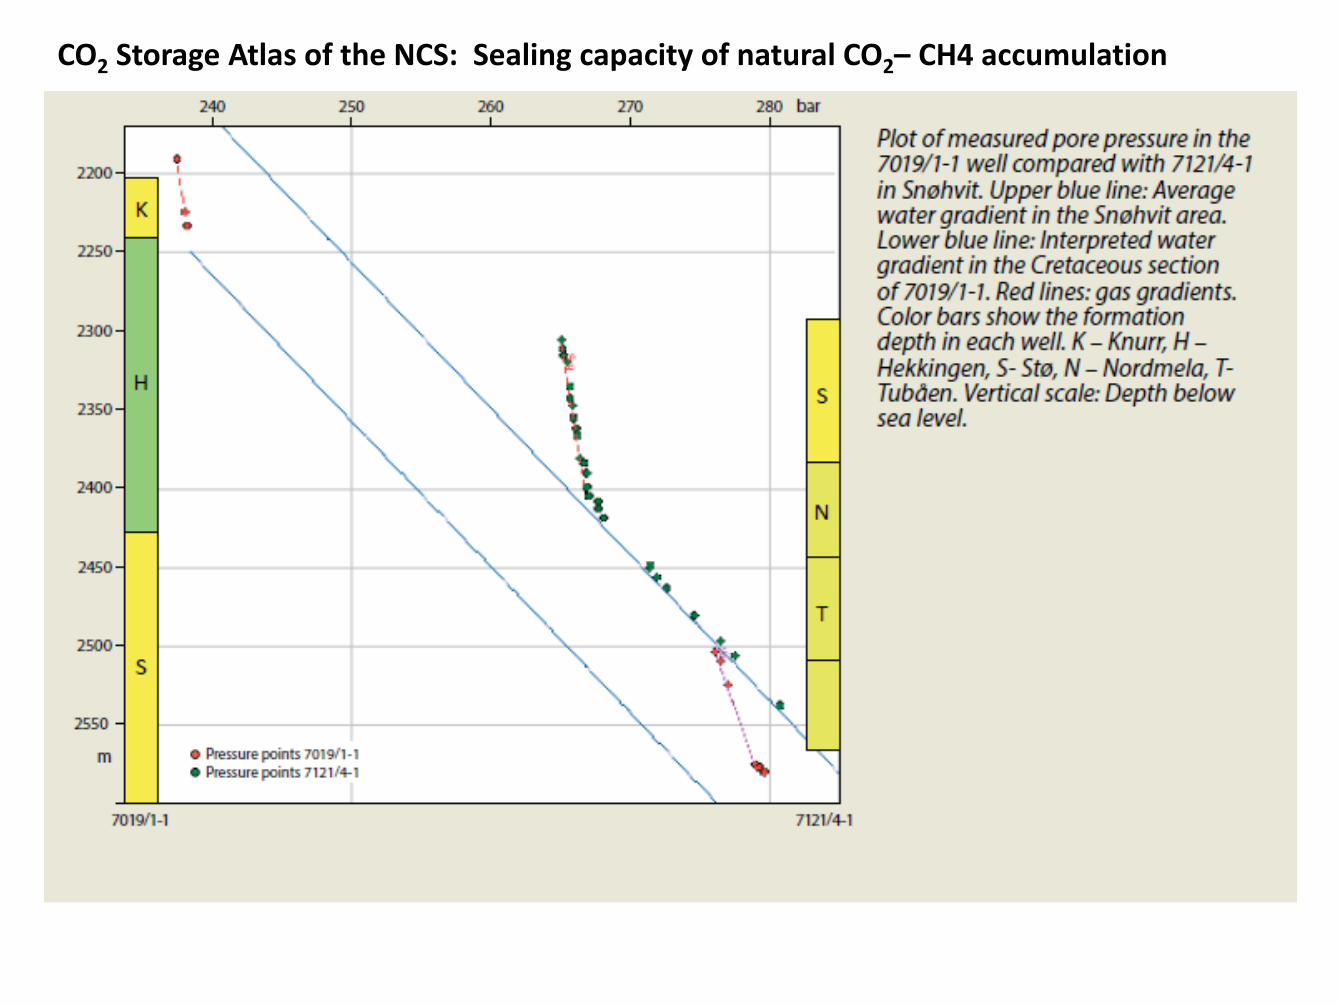
CO2 Storage Atlas of the NCS: Sealing capacity of natural CO2– CH4 accumulation
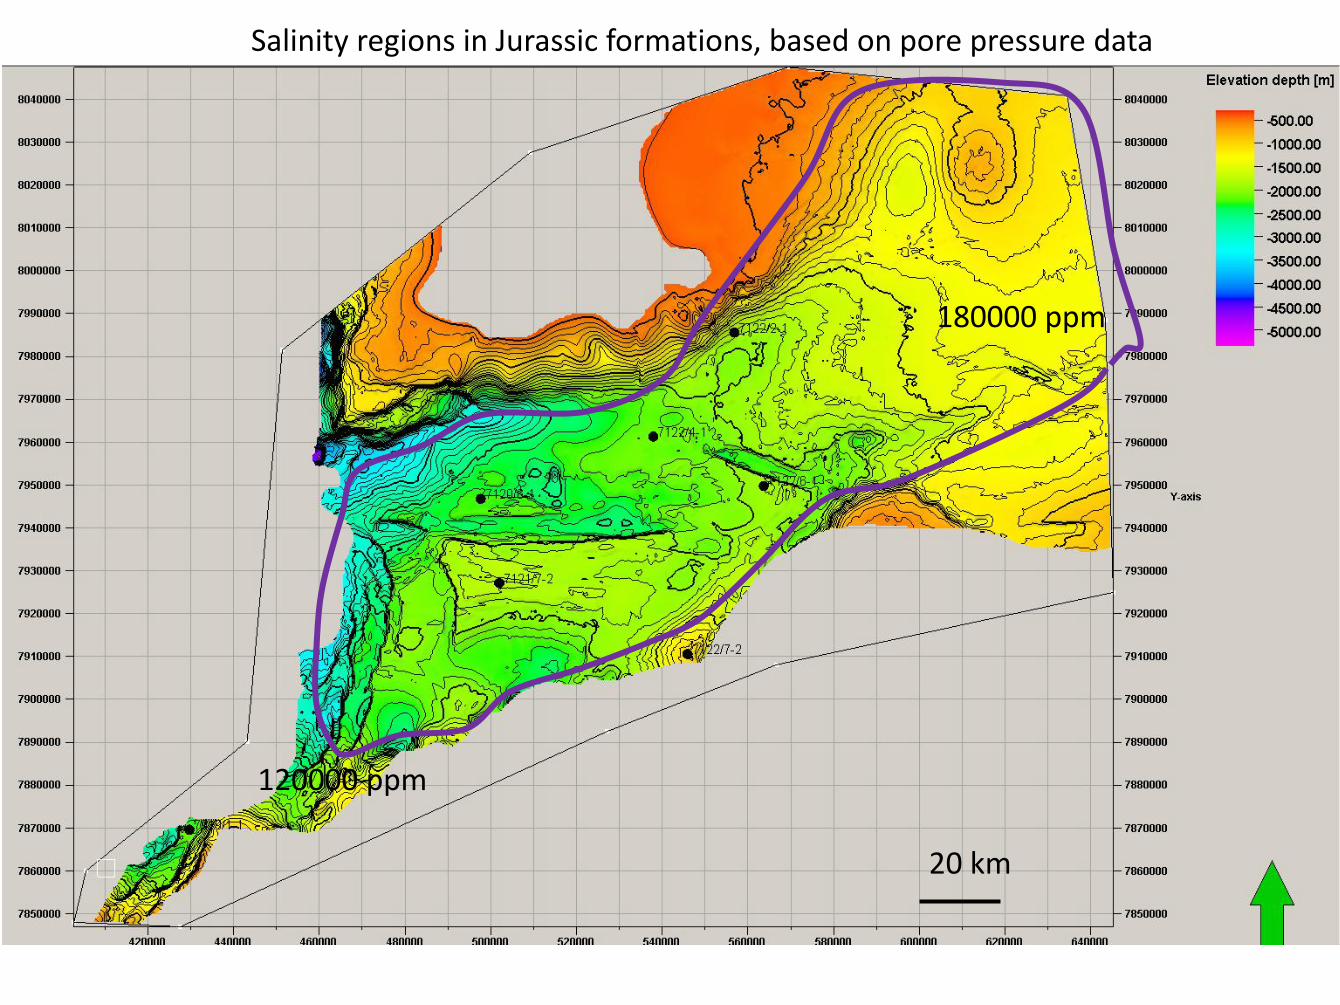
180000 ppm
120000 ppm
Salinity regions in Jurassic formations, based on pore pressure data
20 km
2. Maps for evaluation of capacity
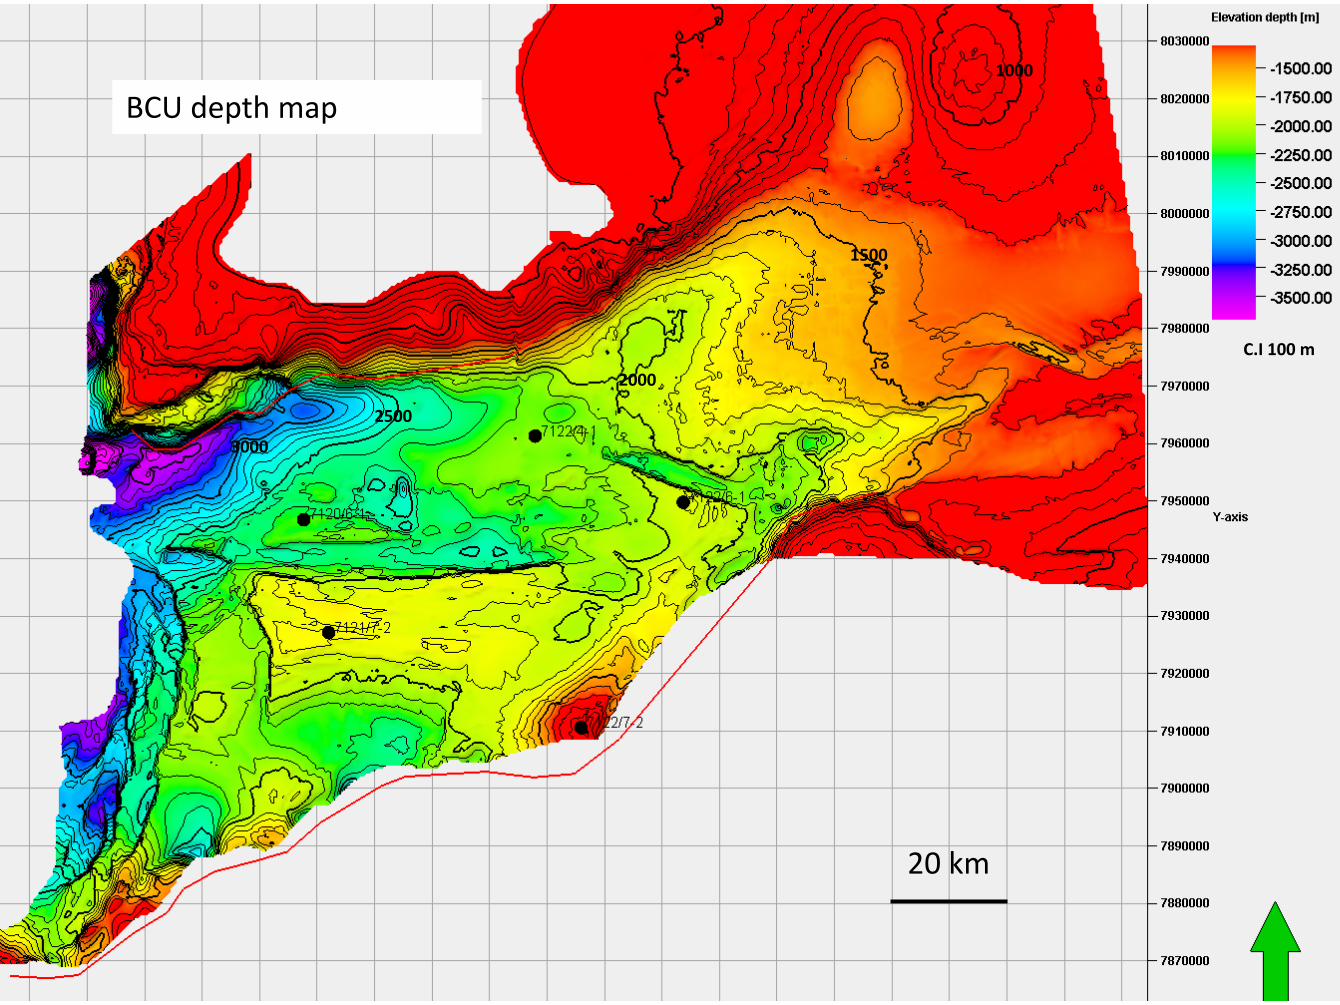
BCU depth map
1500
2000
2500
3000
1000
C.I 100 m
20 km
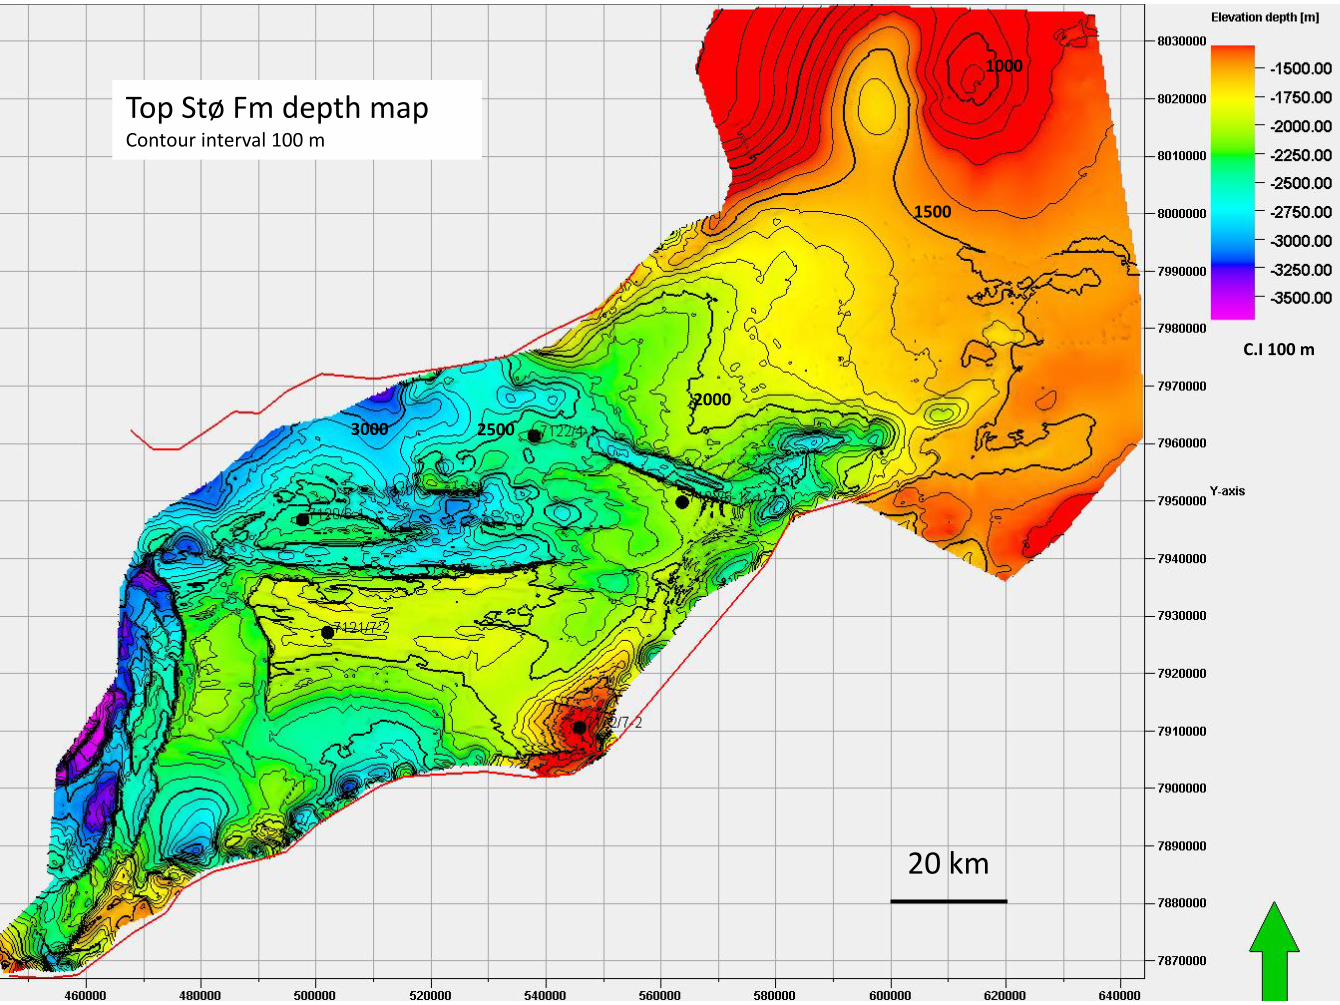
Top Stø Fm depth map Contour interval 100 m
1500
2000
2500 3000
1000
C.I 100 m
20 km
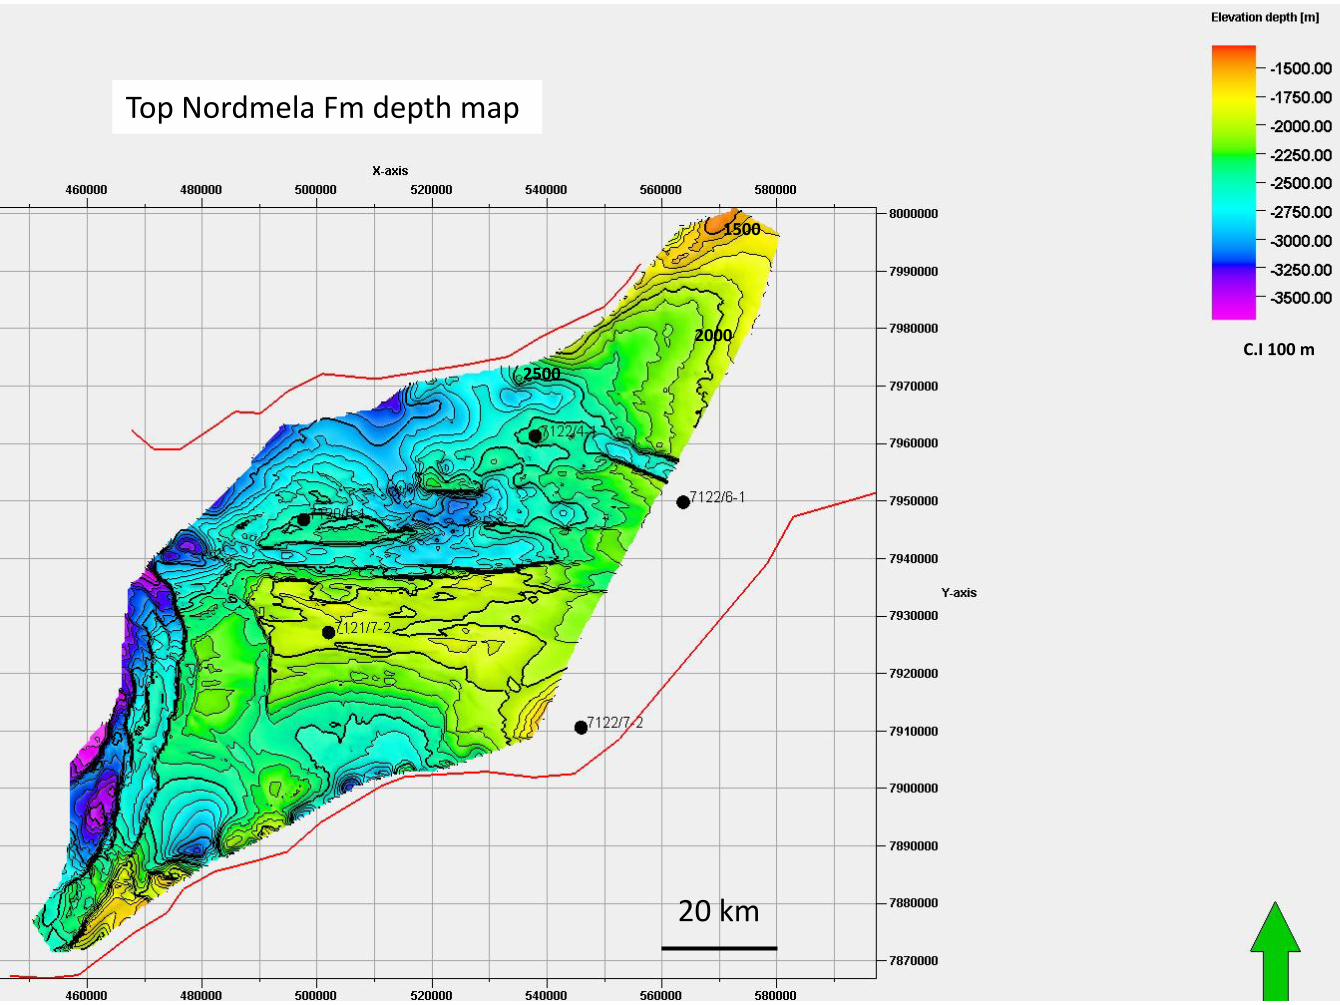
Top Nordmela Fm depth map
1500
2000
2500
C.I 100 m
20 km
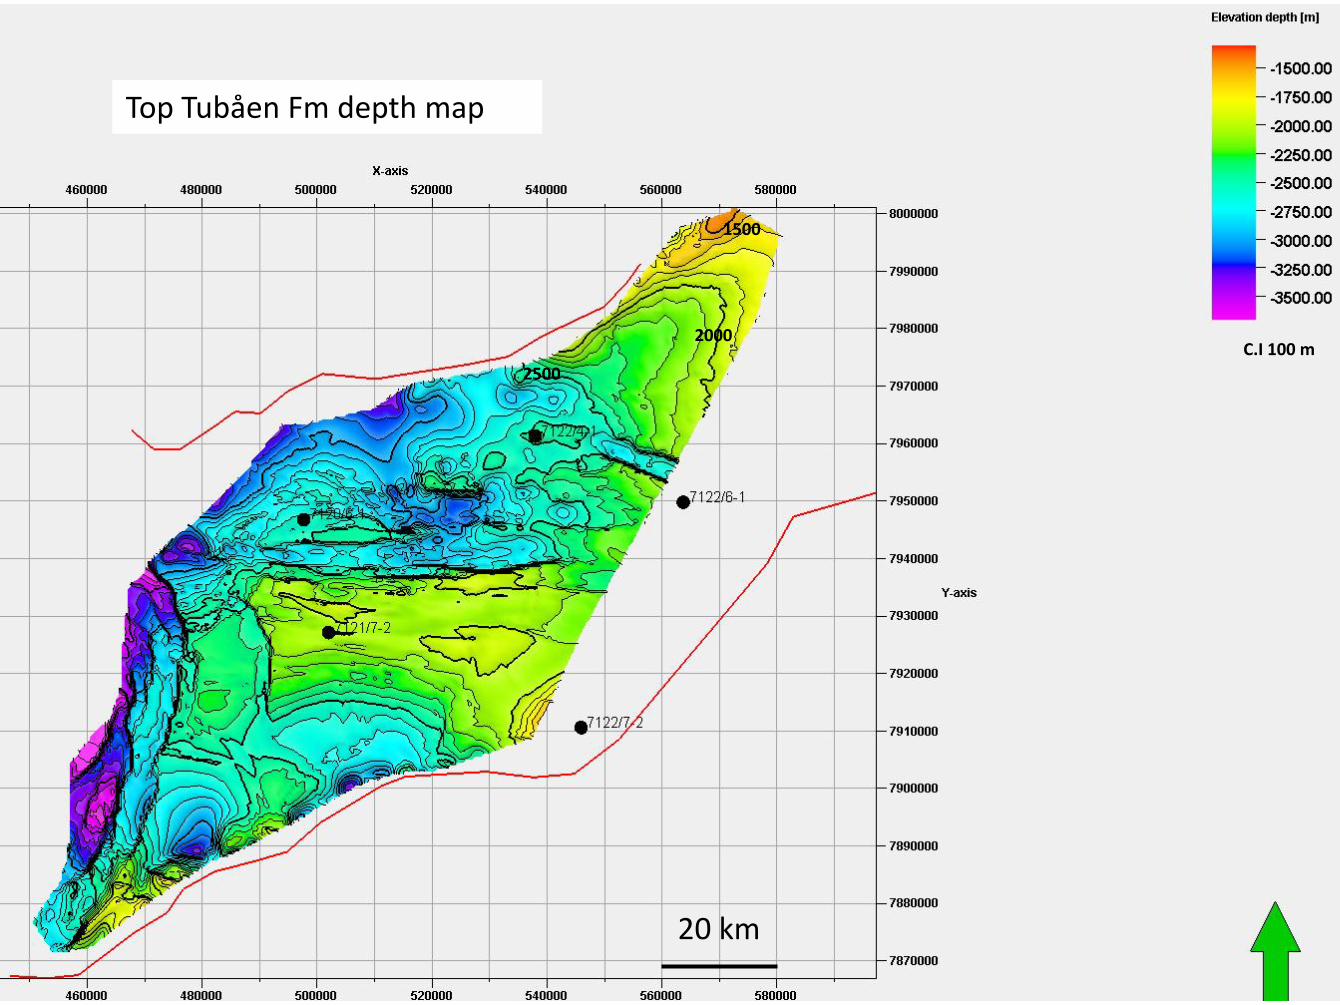
Top Tubåen Fm depth map
1500
2000
2500
C.I 100 m
20 km
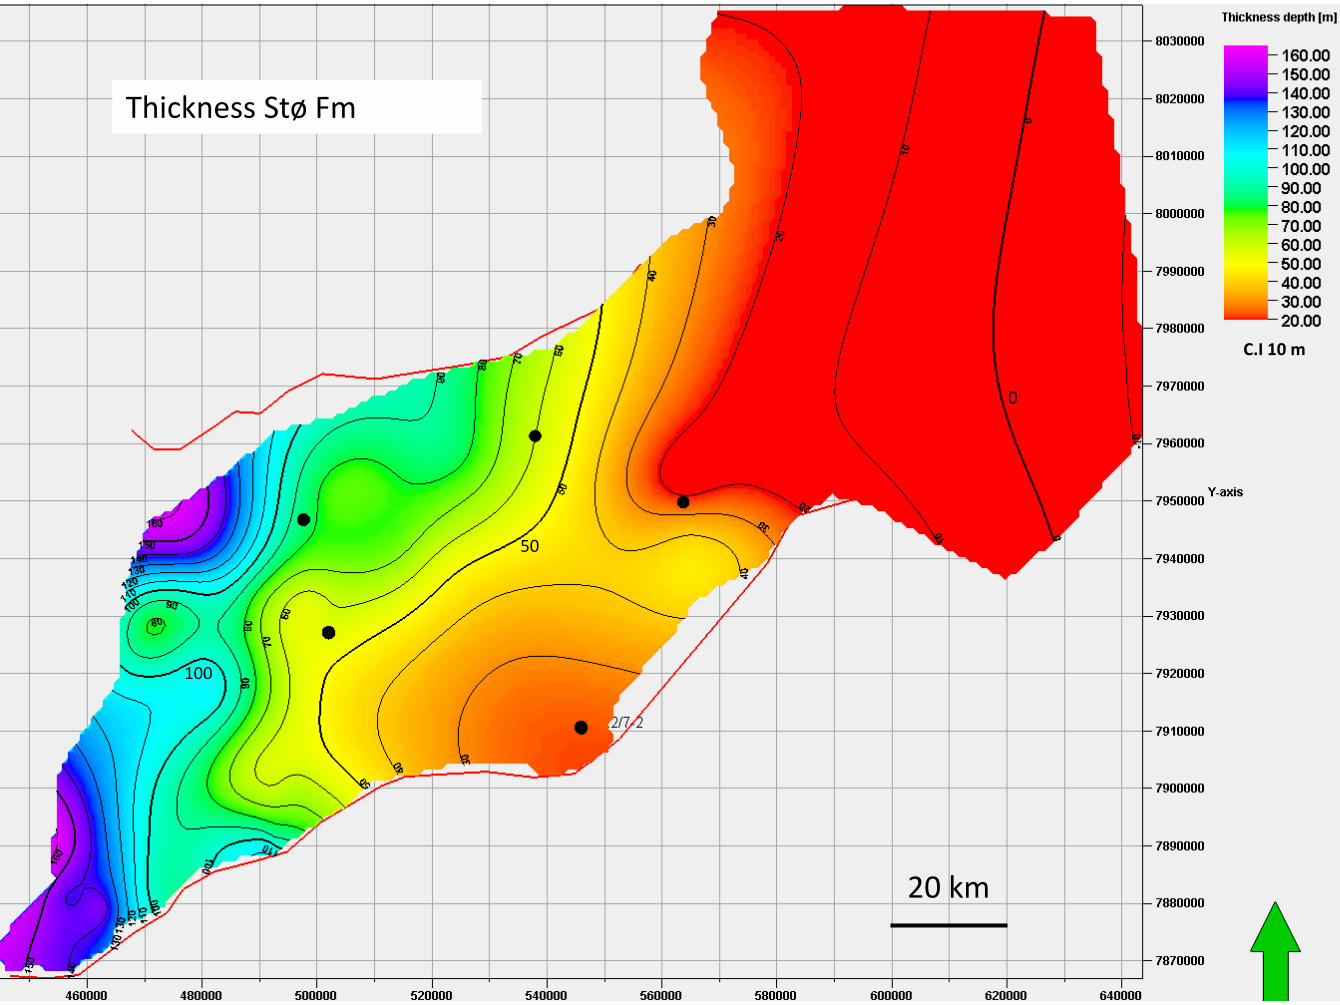
Thickness Stø Fm
C.I 10 m
0
50
100
20 km
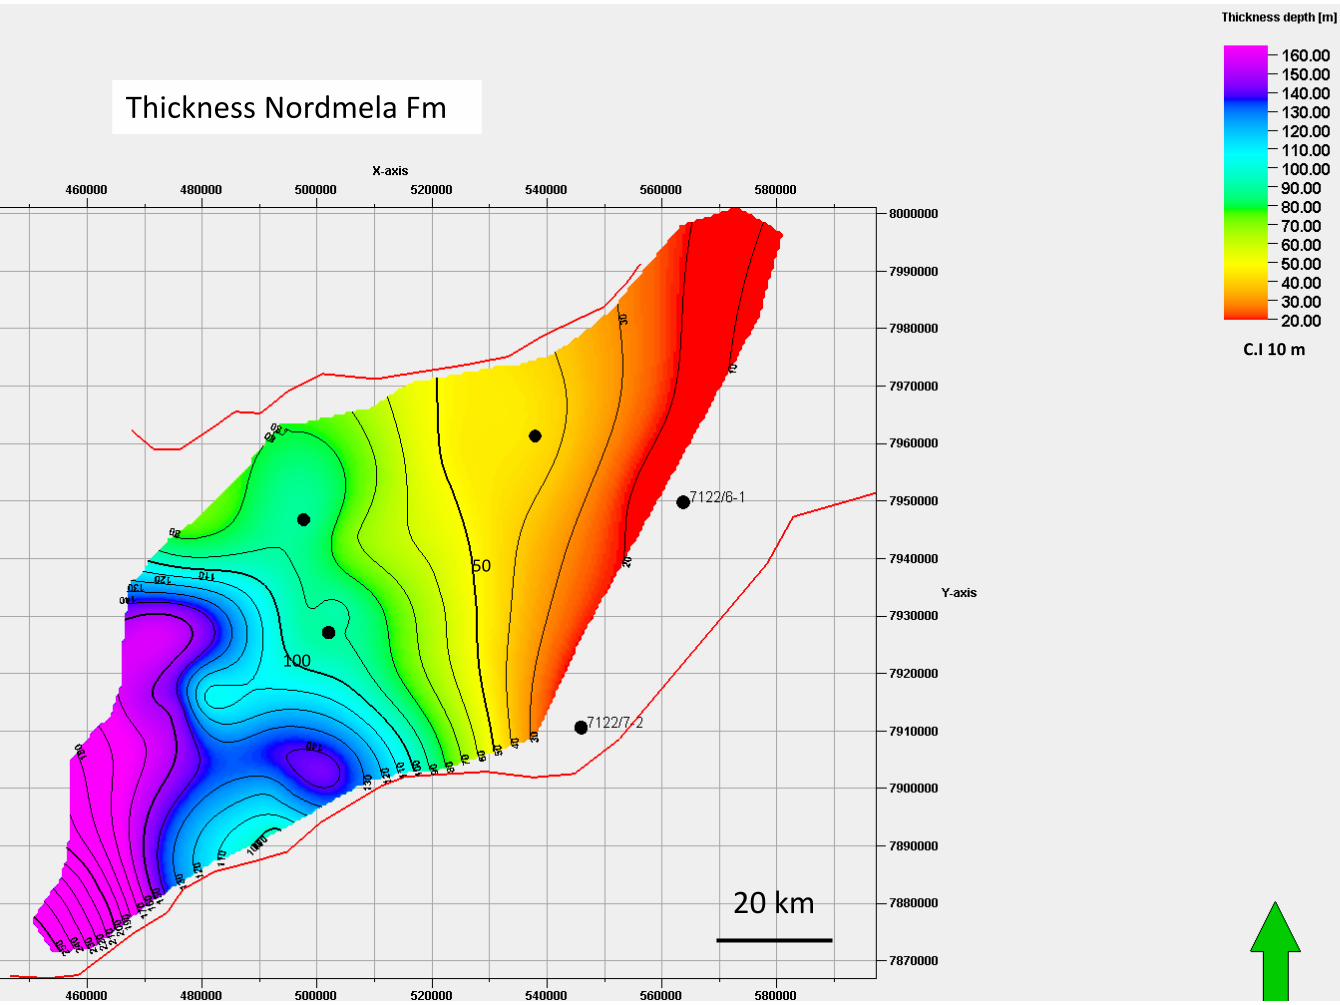
Thickness Nordmela Fm
50
100
C.I 10 m
20 km
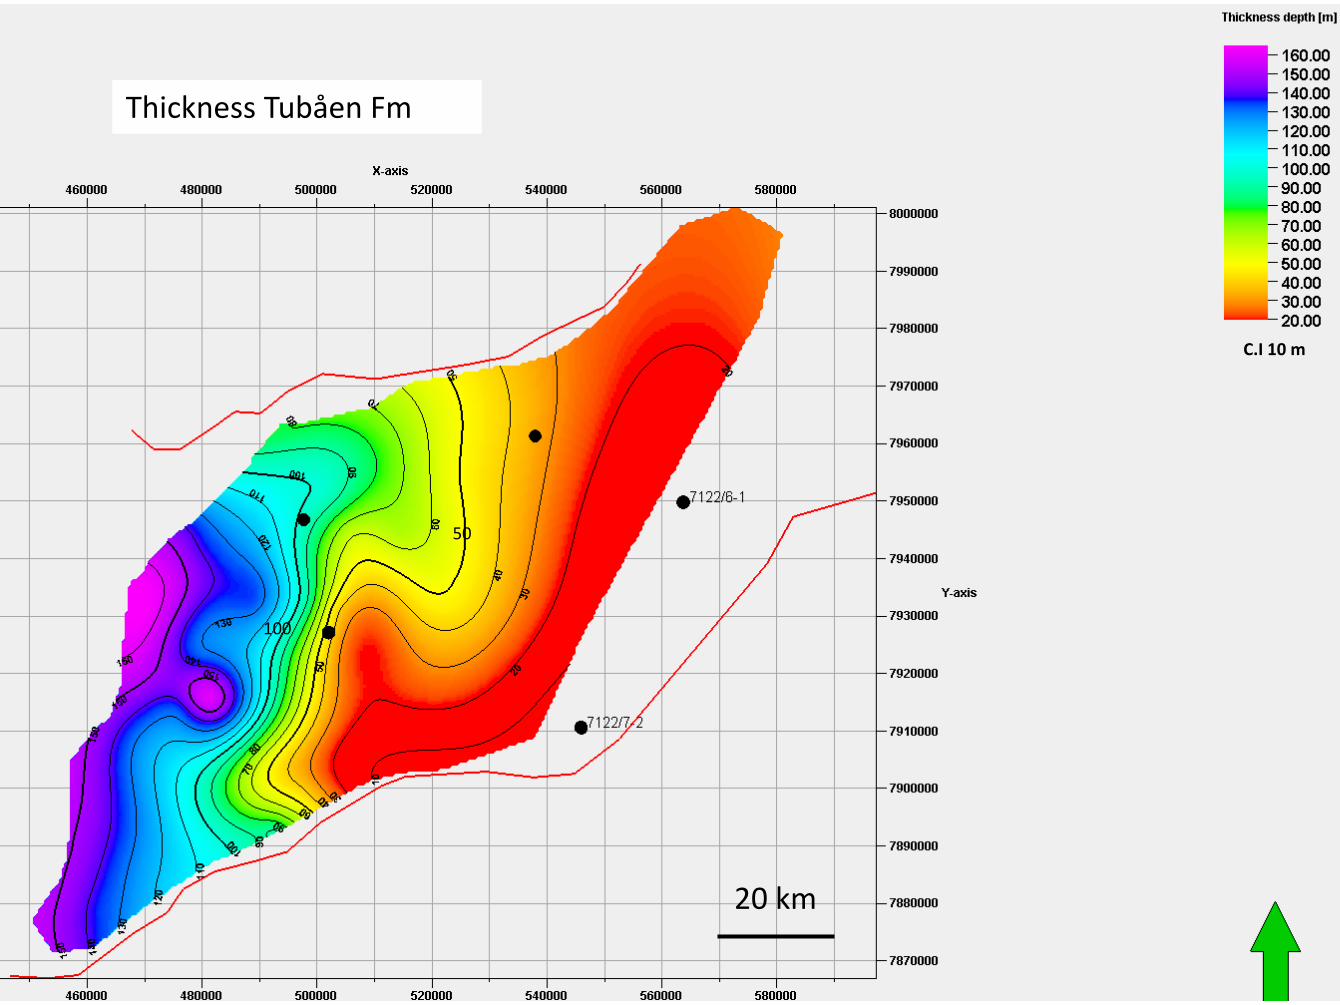
Thickness Tubåen Fm
50
100
C.I 10 m
20 km
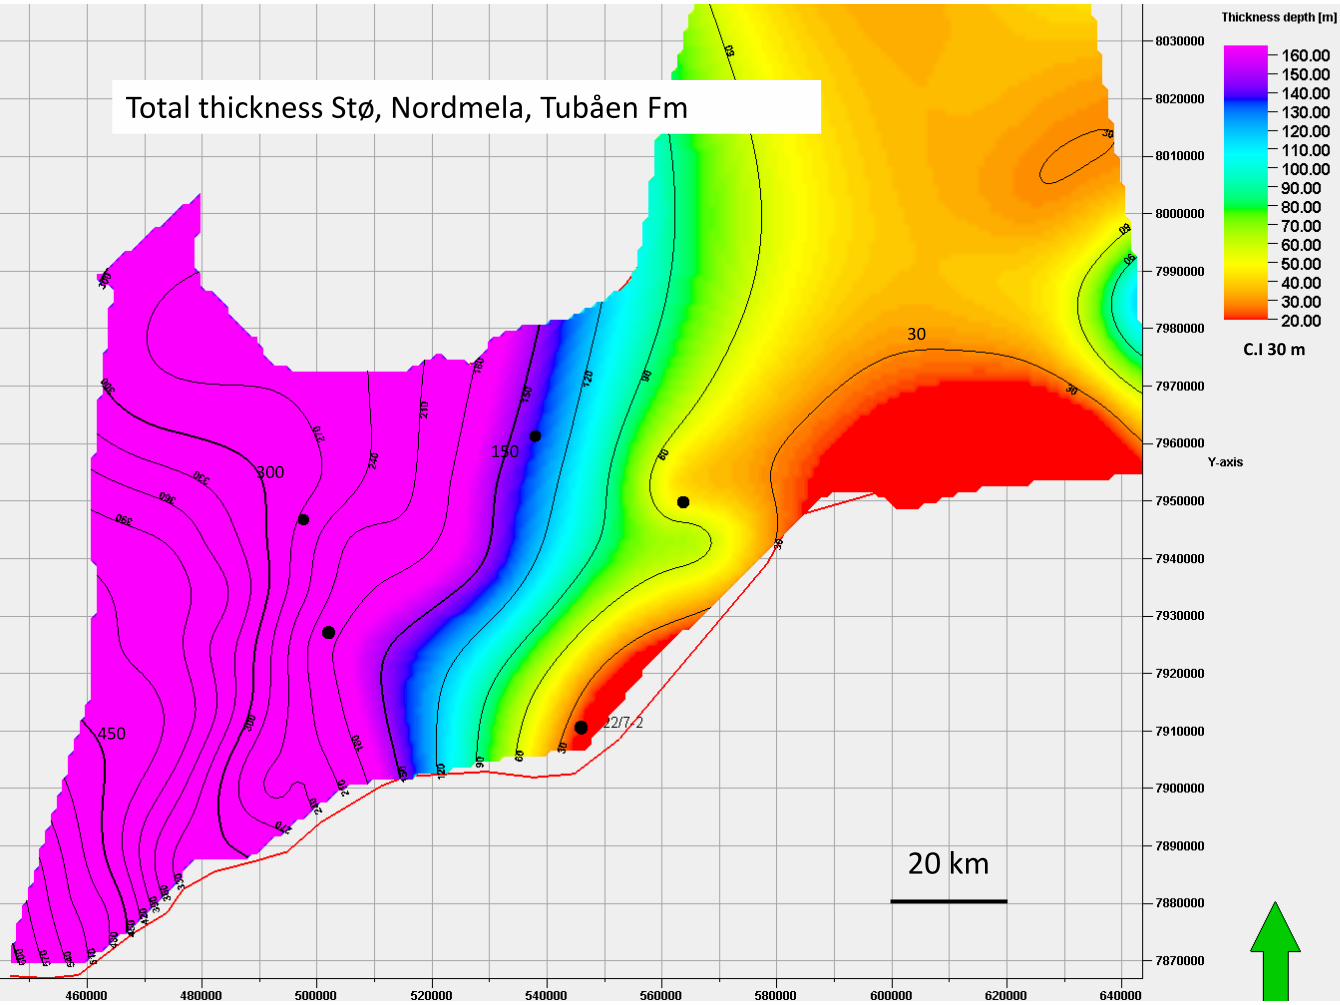
Total thickness Stø, Nordmela, Tubåen Fm
C.I 30 m 30
150 300
450
20 km
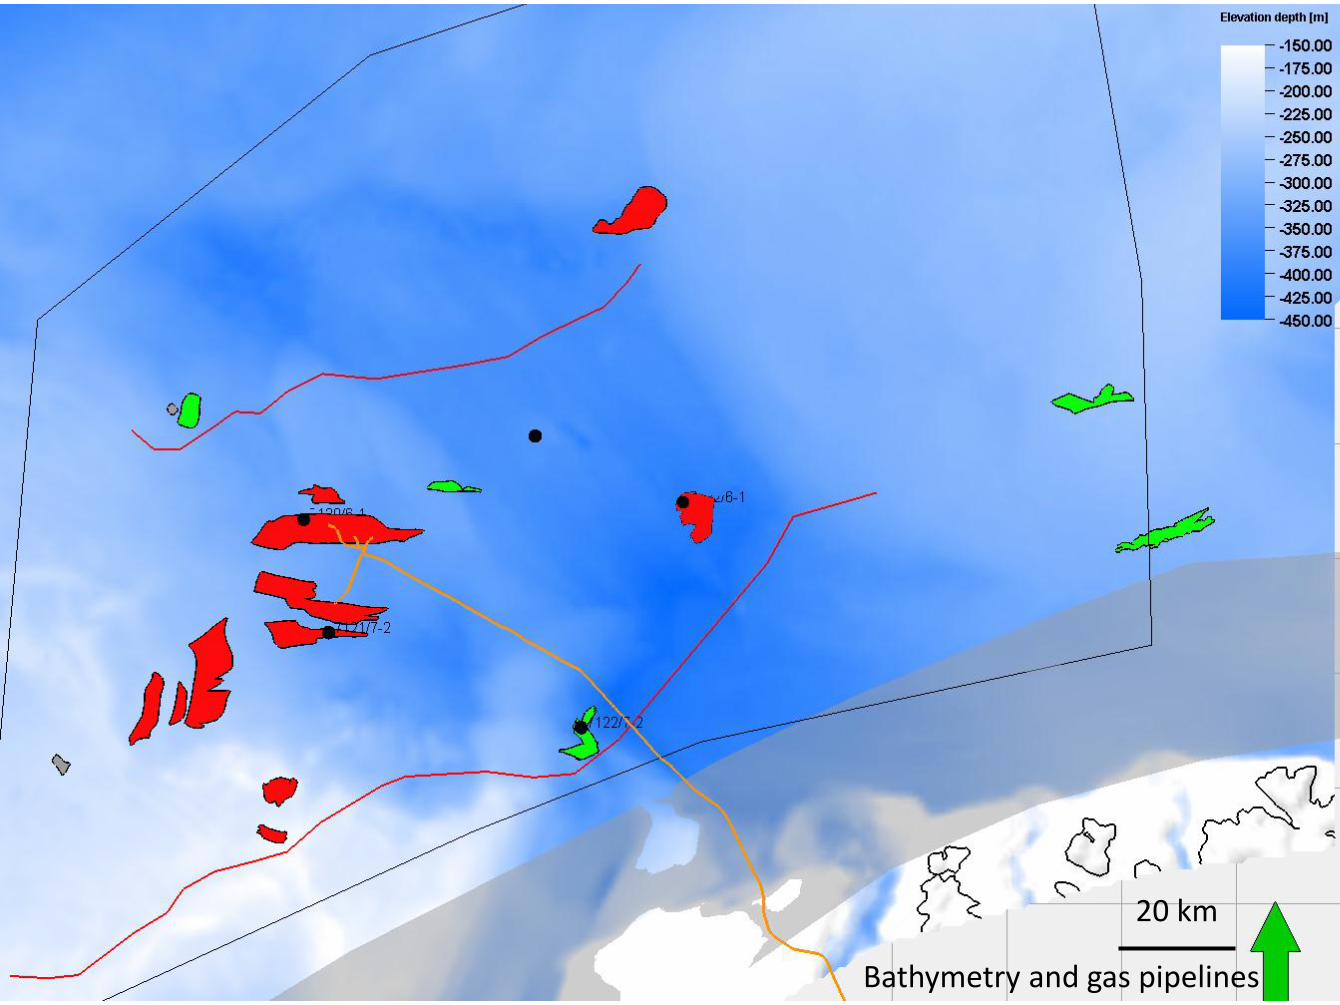
Bathymetry and gas pipelines
20 km