Embed Size (px)
Citation preview
8/9/2019 CDGK Solid Waste Management
http://slidepdf.com/reader/full/cdgk-solid-waste-management 1/17
CDGK SOLID WASTE MANAGEMENT
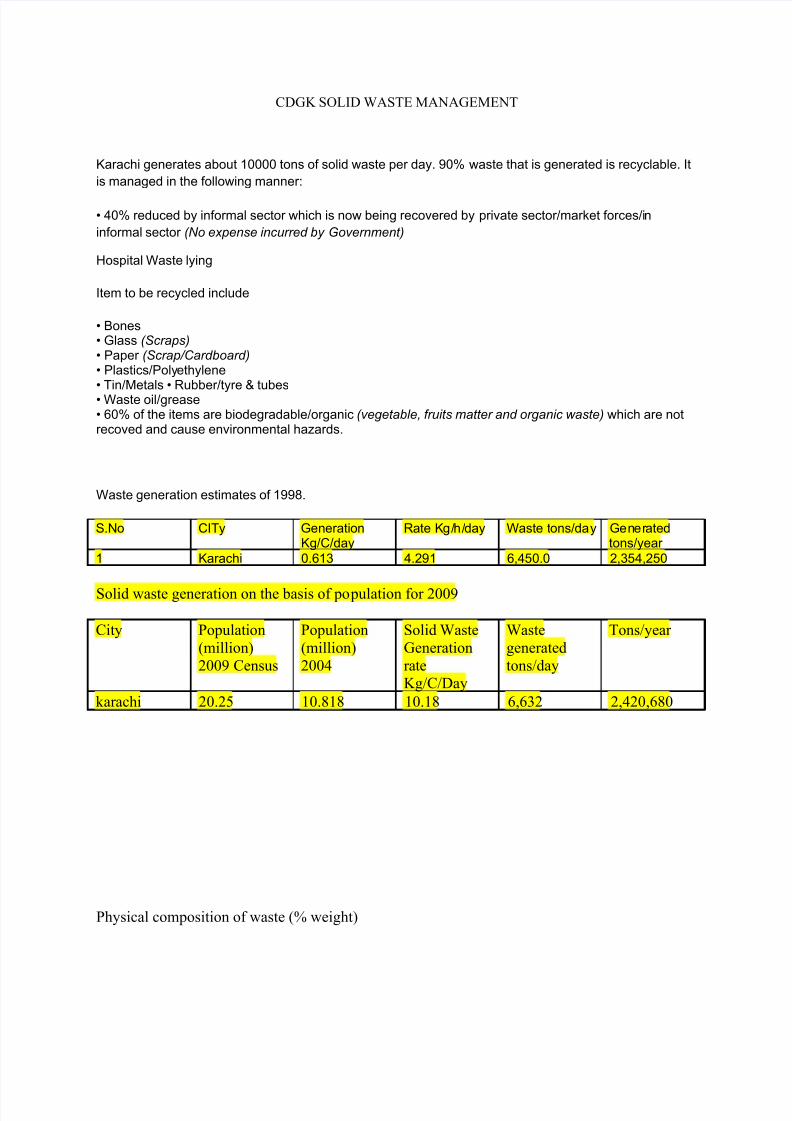
Karachi generates about 10000 tons of solid waste per day. 90% waste that is generated is recyclable. It
is managed in the following manner:
• 40% reduced by informal sector which is now being recovered by private sector/market forces/in
informal sector (No expense incurred by Government)
Hospital Waste lying
Item to be recycled include
• Bones• Glass (Scraps)• Paper (Scrap/Cardboard)• Plastics/Polyethylene• Tin/Metals • Rubber/tyre & tubes• Waste oil/grease• 60% of the items are biodegradable/organic (vegetable, fruits matter and organic waste) which are notrecoved and cause environmental hazards.
Waste generation estimates of 1998.
S.No CITy GenerationKg/C/day
Rate Kg/h/day Waste tons/day Generatedtons/year
1 Karachi 0.613 4.291 6,450.0 2,354,250
Solid waste generation on the basis of population for 2009
City Population
(million)
2009 Census
Population
(million)
2004
Solid Waste
Generation
rateKg/C/Day
Waste
generated
tons/day
Tons/year
karachi 20.25 10.818 10.18 6,632 2,420,680
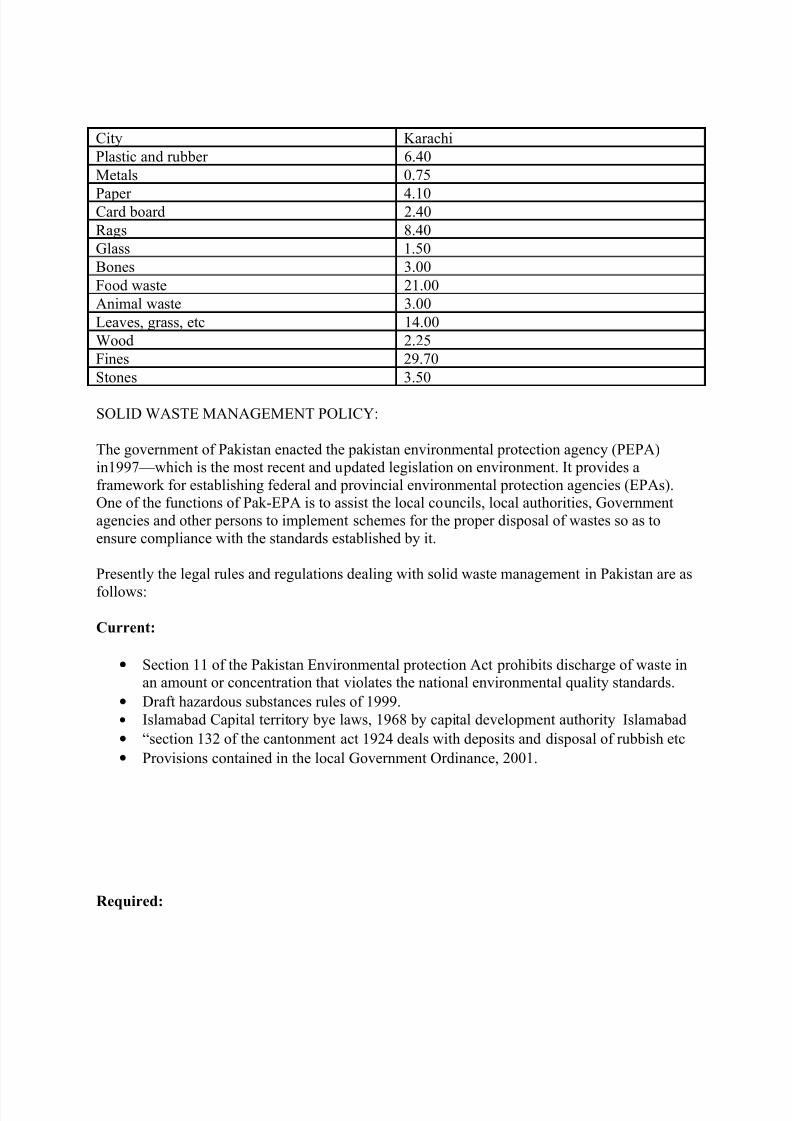
Physical composition of waste (% weight)
8/9/2019 CDGK Solid Waste Management
http://slidepdf.com/reader/full/cdgk-solid-waste-management 2/17
8/9/2019 CDGK Solid Waste Management
http://slidepdf.com/reader/full/cdgk-solid-waste-management 3/17
The rules and guidelines that are yet to be introduced include:
• Basic Recycling rules
• Waste management rules
• E-Waste Management rules
• Development of Environmental Performance Indicators (EPI)• Eco-Labeling guidelines and its promotion
• Adoption of life cycle assessment approaches
• Guidelines for environmentally sound collection and disposal
• Guidelines for model landfill site
Total Garbage (Town wise)=10000.00 tons/day
8/9/2019 CDGK Solid Waste Management
http://slidepdf.com/reader/full/cdgk-solid-waste-management 4/17
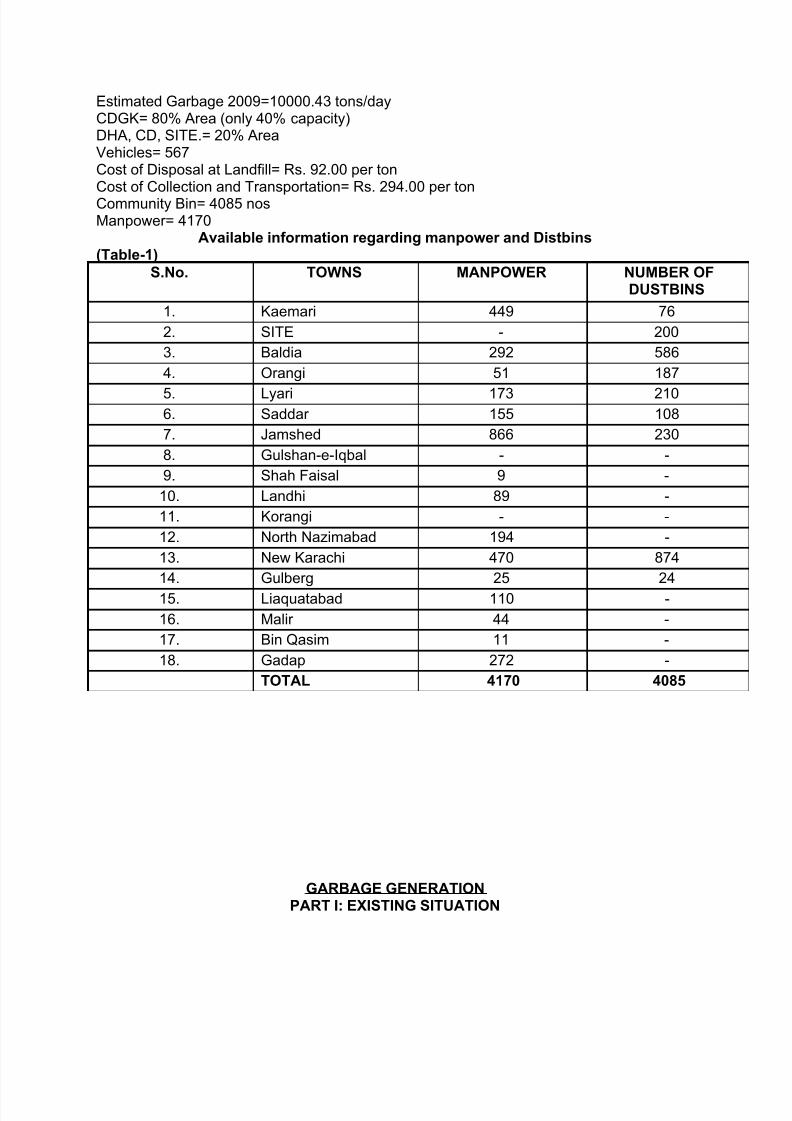
Estimated Garbage 2009=10000.43 tons/dayCDGK= 80% Area (only 40% capacity)DHA, CD, SITE.= 20% AreaVehicles= 567Cost of Disposal at Landfill= Rs. 92.00 per tonCost of Collection and Transportation= Rs. 294.00 per tonCommunity Bin= 4085 nosManpower= 4170
Available information regarding manpower and Distbins(Table-1)
S.No. TOWNS MANPOWER NUMBER OFDUSTBINS
1. Kaemari 449 76
2. SITE - 200
3. Baldia 292 586
4. Orangi 51 187
5. Lyari 173 2106. Saddar 155 108
7. Jamshed 866 230
8. Gulshan-e-Iqbal - -
9. Shah Faisal 9 -
10. Landhi 89 -
11. Korangi - -
12. North Nazimabad 194 -
13. New Karachi 470 874
14. Gulberg 25 24
15. Liaquatabad 110 -
16. Malir 44 -
17. Bin Qasim 11 -
18. Gadap 272 -
TOTAL 4170 4085
GARBAGE GENERATIONPART I: EXISTING SITUATION
8/9/2019 CDGK Solid Waste Management
http://slidepdf.com/reader/full/cdgk-solid-waste-management 5/17
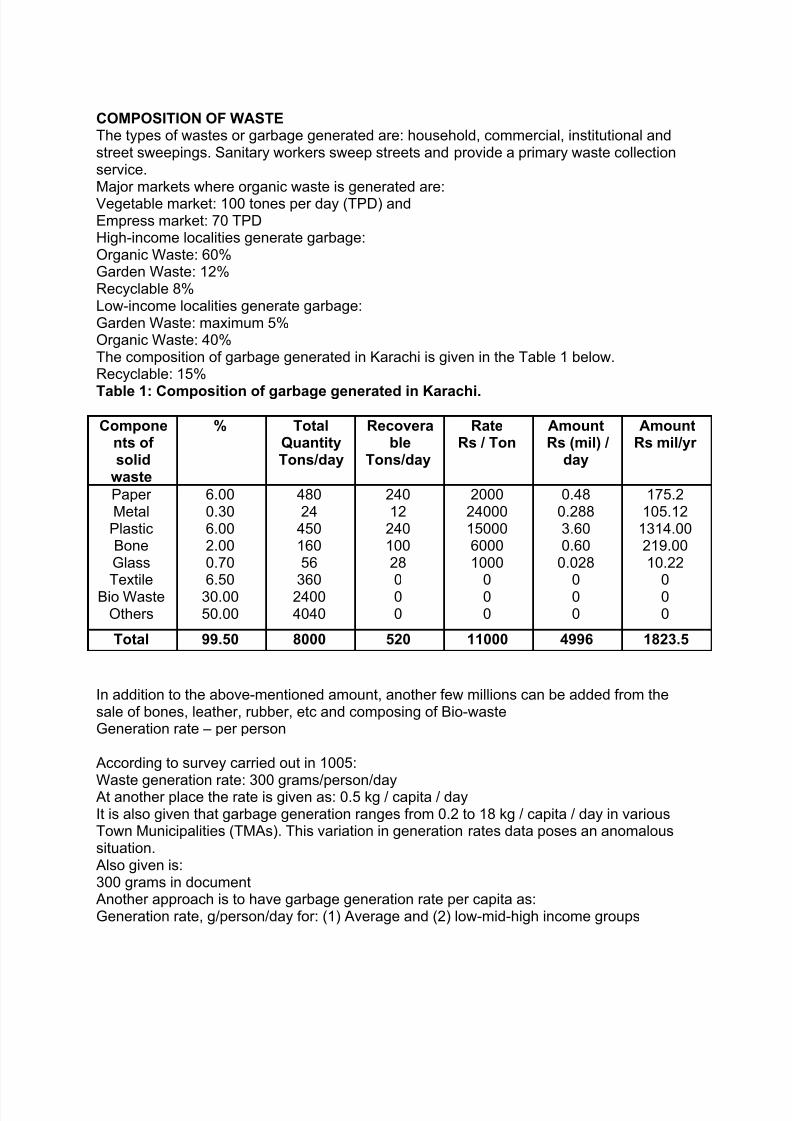
COMPOSITION OF WASTEThe types of wastes or garbage generated are: household, commercial, institutional andstreet sweepings. Sanitary workers sweep streets and provide a primary waste collectionservice.Major markets where organic waste is generated are:Vegetable market: 100 tones per day (TPD) andEmpress market: 70 TPDHigh-income localities generate garbage:Organic Waste: 60%Garden Waste: 12%Recyclable 8%Low-income localities generate garbage:Garden Waste: maximum 5%Organic Waste: 40%The composition of garbage generated in Karachi is given in the Table 1 below.Recyclable: 15%
Table 1: Composition of garbage generated in Karachi.
Components of solid
waste
% TotalQuantityTons/day
Recoverable
Tons/day
RateRs / Ton
AmountRs (mil) /
day
AmountRs mil/yr
Paper MetalPlasticBoneGlassTextile
Bio WasteOthers
6.000.306.002.000.706.5030.0050.00
48024
45016056
36024004040
24012
24010028000
2000240001500060001000
000
0.480.2883.600.60
0.028000
175.2105.12
1314.00219.0010.22
000
Total 99.50 8000 520 11000 4996 1823.5
In addition to the above-mentioned amount, another few millions can be added from thesale of bones, leather, rubber, etc and composing of Bio-wasteGeneration rate – per person
According to survey carried out in 1005:
Waste generation rate: 300 grams/person/dayAt another place the rate is given as: 0.5 kg / capita / dayIt is also given that garbage generation ranges from 0.2 to 18 kg / capita / day in variousTown Municipalities (TMAs). This variation in generation rates data poses an anomaloussituation.Also given is:300 grams in documentAnother approach is to have garbage generation rate per capita as:Generation rate, g/person/day for: (1) Average and (2) low-mid-high income groups
8/9/2019 CDGK Solid Waste Management
http://slidepdf.com/reader/full/cdgk-solid-waste-management 6/17
Then population has to be found for: (1) low-mid-high income groups and (2) totalpopulation
Population DataThe population data of Karachi is as given in Table 2 below. Also population figures fromvarious sources are given.
8/9/2019 CDGK Solid Waste Management
http://slidepdf.com/reader/full/cdgk-solid-waste-management 7/17
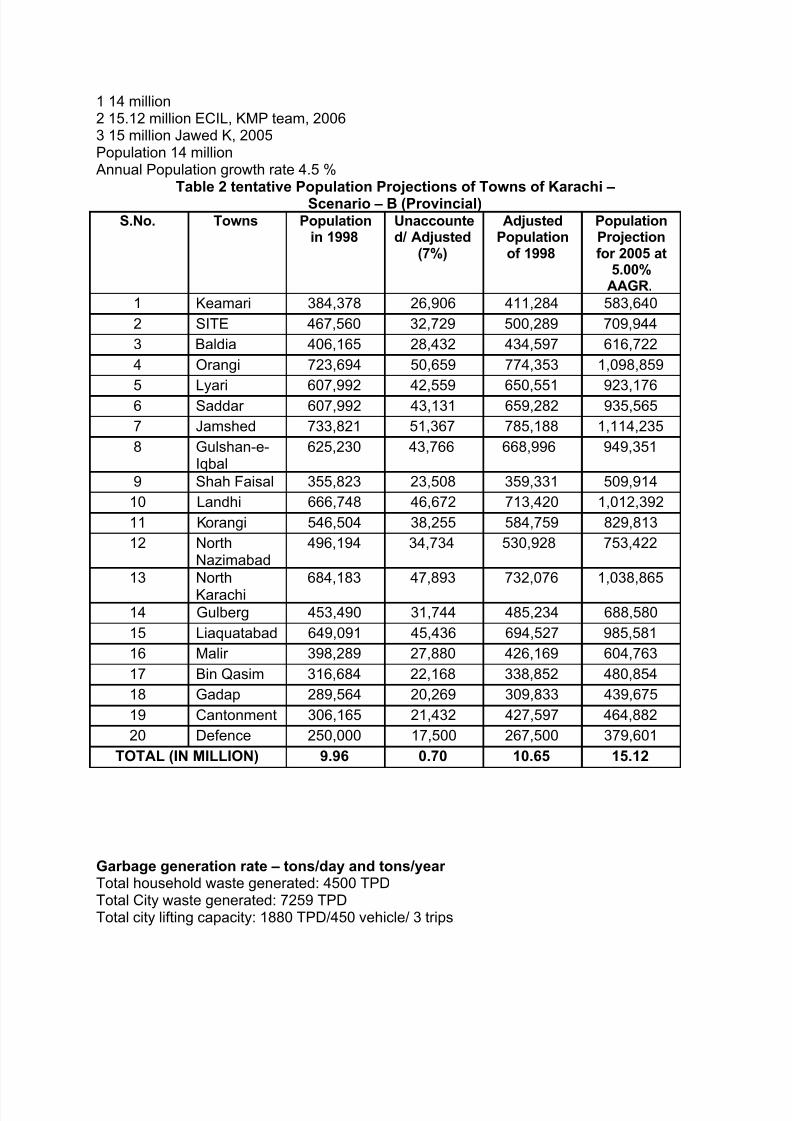
1 14 million2 15.12 million ECIL, KMP team, 20063 15 million Jawed K, 2005Population 14 millionAnnual Population growth rate 4.5 %
Table 2 tentative Population Projections of Towns of Karachi –Scenario – B (Provincial)
S.No. Towns Populationin 1998
Unaccounted/ Adjusted
(7%)
AdjustedPopulation
of 1998
PopulationProjectionfor 2005 at
5.00%AAGR.
1 Keamari 384,378 26,906 411,284 583,640
2 SITE 467,560 32,729 500,289 709,944
3 Baldia 406,165 28,432 434,597 616,722
4 Orangi 723,694 50,659 774,353 1,098,859
5 Lyari 607,992 42,559 650,551 923,1766 Saddar 607,992 43,131 659,282 935,565
7 Jamshed 733,821 51,367 785,188 1,114,235
8 Gulshan-e-Iqbal
625,230 43,766 668,996 949,351
9 Shah Faisal 355,823 23,508 359,331 509,914
10 Landhi 666,748 46,672 713,420 1,012,392
11 Korangi 546,504 38,255 584,759 829,813
12 NorthNazimabad
496,194 34,734 530,928 753,422
13 North
Karachi
684,183 47,893 732,076 1,038,865
14 Gulberg 453,490 31,744 485,234 688,580
15 Liaquatabad 649,091 45,436 694,527 985,581
16 Malir 398,289 27,880 426,169 604,763
17 Bin Qasim 316,684 22,168 338,852 480,854
18 Gadap 289,564 20,269 309,833 439,675
19 Cantonment 306,165 21,432 427,597 464,882
20 Defence 250,000 17,500 267,500 379,601
TOTAL (IN MILLION) 9.96 0.70 10.65 15.12
Garbage generation rate – tons/day and tons/year Total household waste generated: 4500 TPDTotal City waste generated: 7259 TPDTotal city lifting capacity: 1880 TPD/450 vehicle/ 3 trips
8/9/2019 CDGK Solid Waste Management
http://slidepdf.com/reader/full/cdgk-solid-waste-management 8/17
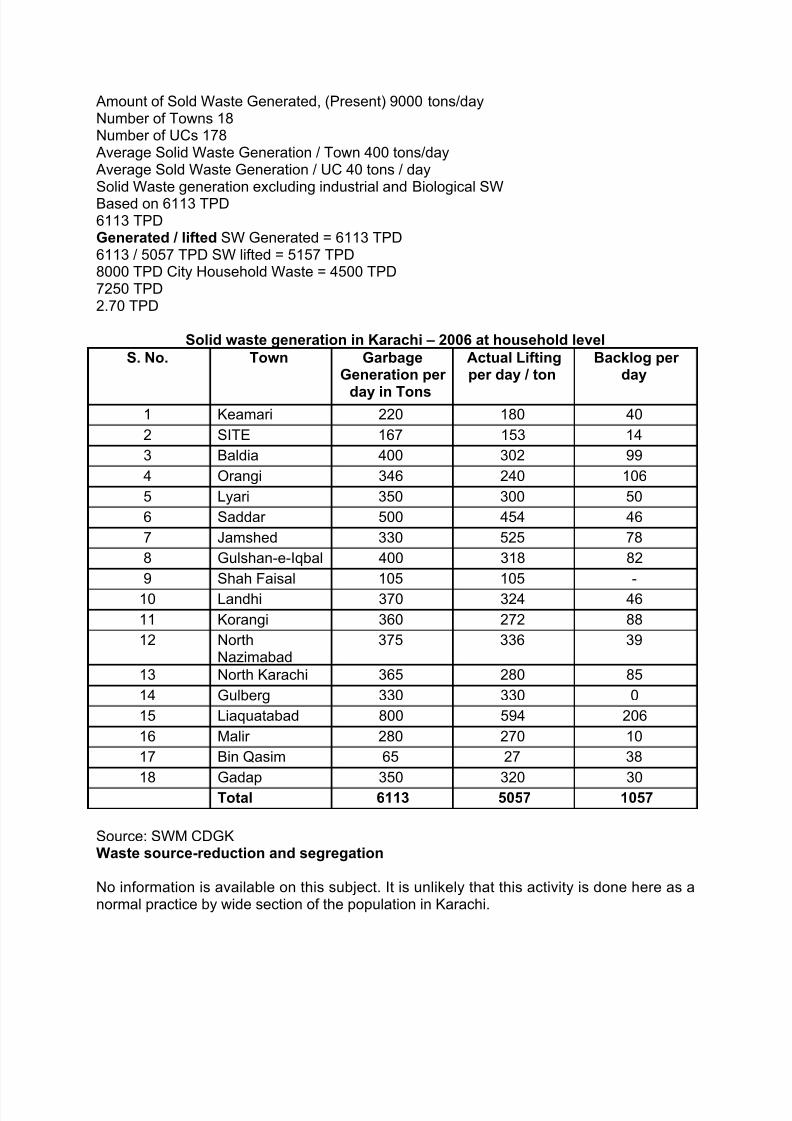
Amount of Sold Waste Generated, (Present) 9000 tons/dayNumber of Towns 18Number of UCs 178Average Solid Waste Generation / Town 400 tons/dayAverage Sold Waste Generation / UC 40 tons / daySolid Waste generation excluding industrial and Biological SWBased on 6113 TPD6113 TPDGenerated / lifted SW Generated = 6113 TPD6113 / 5057 TPD SW lifted = 5157 TPD8000 TPD City Household Waste = 4500 TPD7250 TPD2.70 TPD
Solid waste generation in Karachi – 2006 at household level
S. No. Town GarbageGeneration per
day in Tons
Actual Liftingper day / ton
Backlog per day
1 Keamari 220 180 40
2 SITE 167 153 14
3 Baldia 400 302 99
4 Orangi 346 240 106
5 Lyari 350 300 50
6 Saddar 500 454 46
7 Jamshed 330 525 78
8 Gulshan-e-Iqbal 400 318 82
9 Shah Faisal 105 105 -
10 Landhi 370 324 46
11 Korangi 360 272 88
12 NorthNazimabad
375 336 39
13 North Karachi 365 280 85
14 Gulberg 330 330 0
15 Liaquatabad 800 594 206
16 Malir 280 270 10
17 Bin Qasim 65 27 38
18 Gadap 350 320 30
Total 6113 5057 1057
Source: SWM CDGKWaste source-reduction and segregation
No information is available on this subject. It is unlikely that this activity is done here as anormal practice by wide section of the population in Karachi.
8/9/2019 CDGK Solid Waste Management
http://slidepdf.com/reader/full/cdgk-solid-waste-management 9/17
There are three types of wastes: domestic, industrial and Hospital commercial Gardenwastes.Waste primarily falls into two categories: hazardous waste and non-hazardous waste (for municipal solid waste – MSW). Waste that does not fall into these two categories is calledspecial or other waste.
The Waste Hierarchy
Waste hierarchy means classification, according to the facet of ‘desirability’, of wastemanagement strategies. The strategies could be to reduce waste or to reuse recoverywaste or inaheration to recycle waste, the ‘3 Rs’ of waste management. Another recentstrategy is to ‘Re-think’ or review the present system for an improved system. Whatever theclassification, the main and sole object of waste management is to treat and dispose wastecompletely or minimize if from the environment, to safeguard the health of the community.Concurrently, the supplementary object is to extract maximum benefits from the waste byturning it in to a useful product.
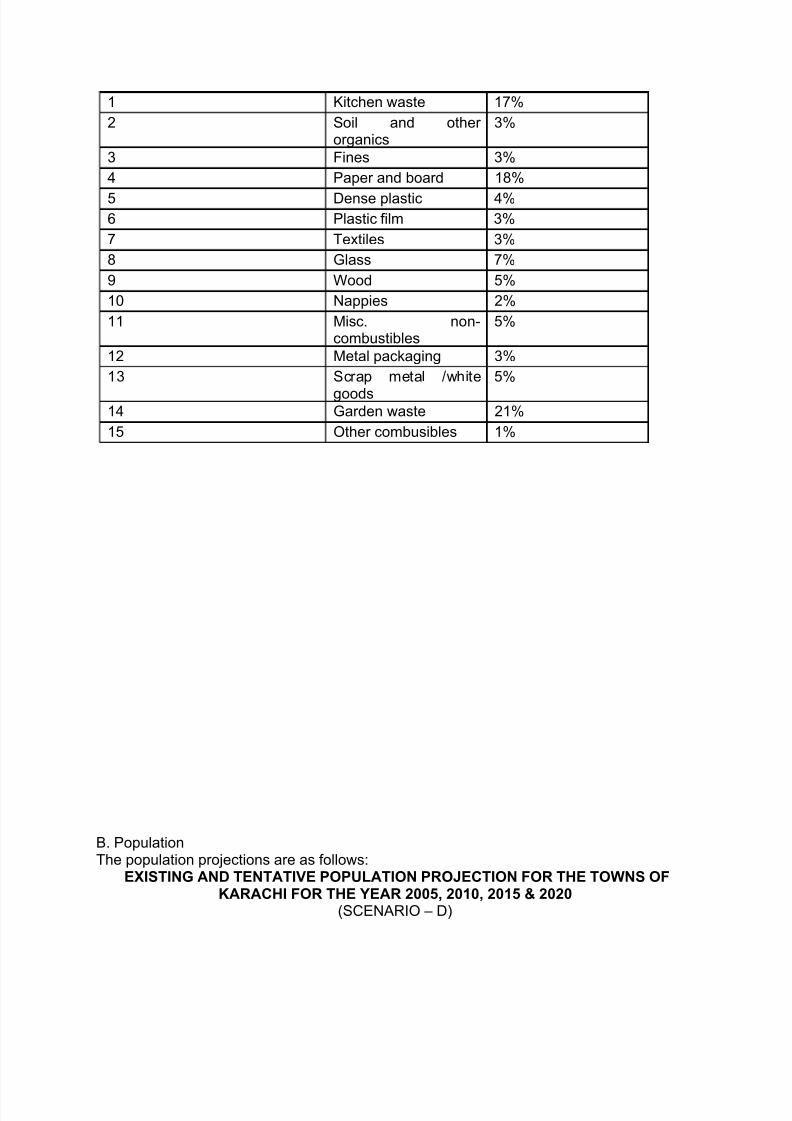
COMPOSITION OF WASTEIn future, there will be increasing quantities of plastic, non-disposal waste and toxic waste inour households, which will require new and much more expensive ways of disposal. Wastegeneration industries, i.e. industries that make non-degradable products are a problem of SWM.Waste type-quality: Use of urban waste could decline due to the contamination in it,particularly of plastics. Research to be conducted on the quality of waste as soilamendment, generation and on recovery and treatment of solid waste.The composition of house waste (8% of total) is given in the figure below, which shows:Kitchen waste 17%, garden waste 21%, paper waste 18%, i.e., 56% of total.
Types of wastesThe various types of wastes, which are generated, are: ‘Municipal waste’ includes:household waste, street litter, municipal parks and gardens waste, offices waste and somecommercial and industrial wastes. The originators, to separate ‘ recyclable or compositing’wastes, sometimes sort out municipal waste. The remaining waste, called ‘residual waste’,is collected in special containers, provided by the local authority.
Household waste
S.No. Type of waste Percent
8/9/2019 CDGK Solid Waste Management
http://slidepdf.com/reader/full/cdgk-solid-waste-management 10/17
1 Kitchen waste 17%
2 Soil and other organics
3%
3 Fines 3%
4 Paper and board 18%
5 Dense plastic 4%6 Plastic film 3%
7 Textiles 3%
8 Glass 7%
9 Wood 5%
10 Nappies 2%
11 Misc. non-combustibles
5%
12 Metal packaging 3%
13 Scrap metal /white
goods
5%
14 Garden waste 21%
15 Other combusibles 1%
B. PopulationThe population projections are as follows:
EXISTING AND TENTATIVE POPULATION PROJECTION FOR THE TOWNS OFKARACHI FOR THE YEAR 2005, 2010, 2015 & 2020
(SCENARIO – D)
8/9/2019 CDGK Solid Waste Management
http://slidepdf.com/reader/full/cdgk-solid-waste-management 11/17
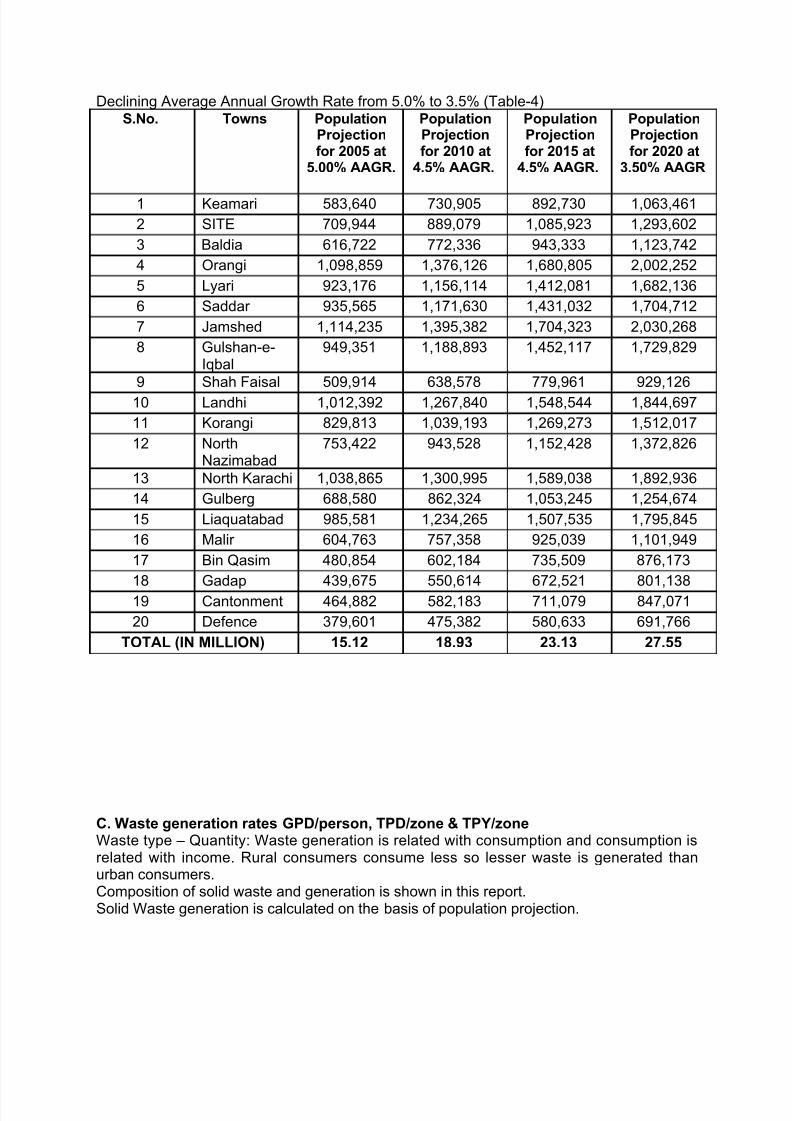
Declining Average Annual Growth Rate from 5.0% to 3.5% (Table-4)S.No. Towns Population
Projectionfor 2005 at
5.00% AAGR.
PopulationProjectionfor 2010 at
4.5% AAGR.
PopulationProjectionfor 2015 at
4.5% AAGR.
PopulationProjectionfor 2020 at
3.50% AAGR
1 Keamari 583,640 730,905 892,730 1,063,461
2 SITE 709,944 889,079 1,085,923 1,293,602
3 Baldia 616,722 772,336 943,333 1,123,742
4 Orangi 1,098,859 1,376,126 1,680,805 2,002,252
5 Lyari 923,176 1,156,114 1,412,081 1,682,136
6 Saddar 935,565 1,171,630 1,431,032 1,704,712
7 Jamshed 1,114,235 1,395,382 1,704,323 2,030,268
8 Gulshan-e-Iqbal
949,351 1,188,893 1,452,117 1,729,829
9 Shah Faisal 509,914 638,578 779,961 929,126
10 Landhi 1,012,392 1,267,840 1,548,544 1,844,697
11 Korangi 829,813 1,039,193 1,269,273 1,512,017
12 NorthNazimabad
753,422 943,528 1,152,428 1,372,826
13 North Karachi 1,038,865 1,300,995 1,589,038 1,892,936
14 Gulberg 688,580 862,324 1,053,245 1,254,674
15 Liaquatabad 985,581 1,234,265 1,507,535 1,795,845
16 Malir 604,763 757,358 925,039 1,101,949
17 Bin Qasim 480,854 602,184 735,509 876,173
18 Gadap 439,675 550,614 672,521 801,138
19 Cantonment 464,882 582,183 711,079 847,071
20 Defence 379,601 475,382 580,633 691,766
TOTAL (IN MILLION) 15.12 18.93 23.13 27.55
C. Waste generation rates GPD/person, TPD/zone & TPY/zoneWaste type – Quantity: Waste generation is related with consumption and consumption isrelated with income. Rural consumers consume less so lesser waste is generated thanurban consumers.Composition of solid waste and generation is shown in this report.Solid Waste generation is calculated on the basis of population projection.
8/9/2019 CDGK Solid Waste Management
http://slidepdf.com/reader/full/cdgk-solid-waste-management 12/17
1. Declining Average Annual growth rate scenario – D2. Estimate gross population capacity3. combination of annual growth rate and gross population capacity for the new towns.
Amount of wasteSolid Waste Management and Disposal has been design on the basis of populationprojection option – II AS shown in this report however the calculation are shown of all thethree options for comparison purpose.In advance countries the amount of waste generated is enormous. We cannot emulate thembecause of our backwardness. But, it is useful to know a bit about how their waste is dealtwith. We could try to establish basic systems, as in advance countries, for our futuregenerations to come.Take the case of UK. ‘It is estimated that nearly 36 million tones / yr of municipal waste wasgenerated in the UK in 2002/03. A total of 30 million tones/yr of this waste was collectedfrom households. That’s about 500 kg/yr or half a tonne of household waste per person!(2003)’. It is important to note that in Karachi 200 kg per year of solid waste can not be
dealt.
Garbage collectionPART I
EXISTING SITUATIONThe population of Karachi is 15.15 million in 2005 and it has an area of 425,529 acres. Thenumber of agencies involved with solid waste management (SWM) are a total of 210, thebreak up being as follows:Town Municipal Administration (TMA): 18Union Councils (UCs): 178City District Government Karachi (CDGK): 1Cantonment Boards: 11Karachi Port Trust: 1Pakistan Steel Mills: 1Port Qasim: 1Sindh Industrial Trading Estate: 1Export Processing Zone: 1
A. Garbage collection servicesIn Karachi, in 18 towns, 2006:(refer Table 2)estimated garbage collected: 5057 TPD (tons per day)estimated garbage not collected: 1057 TPD
8/9/2019 CDGK Solid Waste Management
http://slidepdf.com/reader/full/cdgk-solid-waste-management 13/17
Annual Expenditure Rs 800 million
Lifting Capacity 50%
In each Town and UC,
B. Garbage collection – primary collectionOne stage collectionPrimary stage collection of garbage is from house hold to dust bin sites, (‘kachra kundi’).This is done in the following ways:
Garbage is collected in stages, which ultimately lead to its collection at one point for a fixedzone. From this point, garbage is disposed to landfill sites. But this may not be case for allcities. For instance, in Karachi, the garbage collection system is as follows:Stage 1: From house → resident travels to dispose garbage → to dust bins
Stage 2: From dust bins → municipality vehicles dispose of garbage → to landfill sites OR →
to unofficial dumping ground (Primary transportation, 2-3 trips a day, long trips)This is the most uneconomical way of SWM because the distance to landfill site is long andseveral vehicles have to make this long trips several times a day. Considering the largeamount of waste and the cost of fuel and O&M, not all waste is disposed of.
Table 2: Details of garbage collectionThe following problems arise in Karachi in primary collection:Poor attendance of sanitary workers.Gradual decrease in number of dust bins, as a large number of garbage containers (KatchraKundi) are in the workshop for repairs.Haphazard accumulation of garbage on streets, in open spaces and in drains.
Primary stage collection, from house hold to dust bin sites, involves the following problems:It may be mentioned that the uncollected waste usually finds it way in sewers, is eaten bythe cattle, or left to rot in the open, or burnt on roadsides. These are harmful practices.Two stage collectionGarbage collection-recordGarbage collection equipmentVehicles 550Garbage collection manpower Staff 15188Poor attendance of sanitary workers.Privatized transport system
Benefits of privatization:Regarding a successful contract in Shah Faisal Town, the contractor has performed welland lifted 100% garbage. He used less than 50% of TMA’s garbage vehicles, which wererented to him. He ensured a minimum of three trips daily by each vehicle to the landfill.
8/9/2019 CDGK Solid Waste Management
http://slidepdf.com/reader/full/cdgk-solid-waste-management 14/17
There was no intervention of labor unions. Prompt redresses of public complaints wereundertaken. Short Comings:The tonnage rate of Rs 269 /ton is on the higher side as compared to some of the other TMAs. The contractor dumped garbage at undesignated and un-monitored landfill sites.TMA, Gulshan-e-Iqbal awarded a contract in 2006 for transportation of garbage from atemporary garbage transfer station to landfill site. This contract is still in force.
HOSPITAL WASTE MANAGEMENTFor hospitals:Generation rate is : 3 to 4 kg/bed/day in document.900 beds at one place it is given 900. At another place, total beds = 4367 in 143 hospitalsand 1094 HCUs = 1237. Which is correct? Needs investigation.Hospital waste:The handling of hospital waste, or ‘Bio-Medical Waste;, has assumed importance becauseof spreading such dangerous disease as AIDS. On way to manage this important issue is to
make the hospital personnel aware of the dangers and the need for seriously taking themanagement of this waste for safe handling and disposal. Internet could be used veryeffectively for this purpose. A web site could be established to disseminate information for the doctors and hospital staff to read it at any time at their convenience.2. HOSPITAL WASTERef. CDGK SWM Expert, “Presentation on Karachi’s solid waste system”, 2006.Total no. of hospitals in Karachi 200Total no. of beds 900Waste generation rate of hospital 3-4 kg/bed/dayApproximately generation of hospital waste 2700 kg/dayHazardous waste component 540 kg/dayNon hazardous waste component 2160 kg/dayHealth care units (HCU) identified by TMAs 1379The table-1 below gives the details of HCUs.Only 140 HCU dispose off their waste through incineration plants run by City Government(CG). The remaining HCU dispose off their waste along with the municipal waste. Thisposes a health hazard.The reasons of health hazards are –a- Non-registration of HCUs either with HealthDepartment Government of Sindh or with City Govt. and –b- Non-presence of EnvironmentProtection Agency of Sindh at grassroot level.IncineratorsThe CD installed two incineration plants at Mewa Shah in 1996. Each has a capacity of 1000 kg/hour. Incineration take place at 800 °C in 10 minutes. At present 140
hospitals/clinics are incinerating their waste through these incinerators.
A contractor, M/s Abaseen International, operates both the plants for 2 years. Their responsibilities include collection of waste from hospital and clinics, transport and incineratethe waste, operate and maintain the plants. They are running only at 12-15% capacity dueto non-registration of all HCUs.
8/9/2019 CDGK Solid Waste Management
http://slidepdf.com/reader/full/cdgk-solid-waste-management 15/17
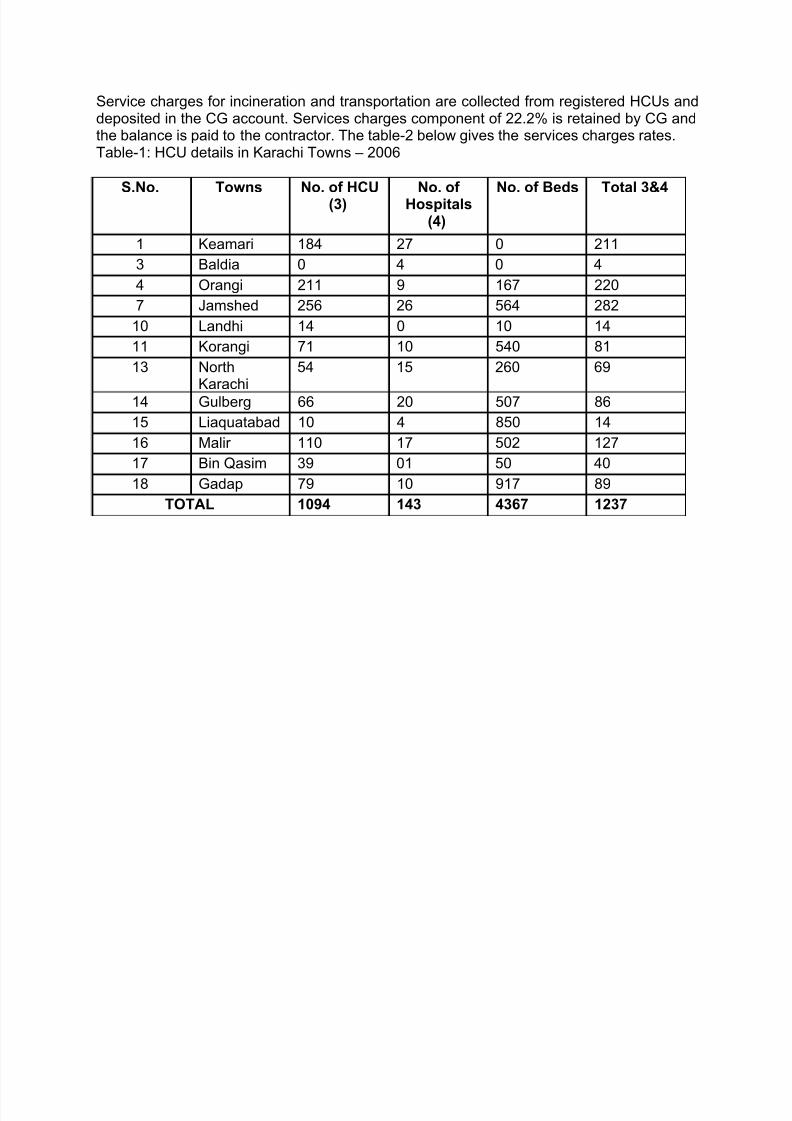
Service charges for incineration and transportation are collected from registered HCUs anddeposited in the CG account. Services charges component of 22.2% is retained by CG andthe balance is paid to the contractor. The table-2 below gives the services charges rates.Table-1: HCU details in Karachi Towns – 2006
S.No. Towns No. of HCU(3)
No. of Hospitals
(4)
No. of Beds Total 3&4
1 Keamari 184 27 0 211
3 Baldia 0 4 0 4
4 Orangi 211 9 167 220
7 Jamshed 256 26 564 282
10 Landhi 14 0 10 14
11 Korangi 71 10 540 81
13 NorthKarachi
54 15 260 69
14 Gulberg 66 20 507 86
15 Liaquatabad 10 4 850 14
16 Malir 110 17 502 127
17 Bin Qasim 39 01 50 40
18 Gadap 79 10 917 89
TOTAL 1094 143 4367 1237
8/9/2019 CDGK Solid Waste Management
http://slidepdf.com/reader/full/cdgk-solid-waste-management 16/17
8/9/2019 CDGK Solid Waste Management
http://slidepdf.com/reader/full/cdgk-solid-waste-management 17/17
The CDGK has also signed an agreement with a Malaysian Company Abaseen International for
20 years on a Built Operate and Transfer (BOT) basis, which would invest 130 million dollars in
the city to install a power plant to generate 25 megawatt power through the solid waste daily.According to sources from the power plant the city government has to allot 25 acres of land to
the partner company. The Chinese company will supply 1000 ton waste daily to the Malaysian
company for the purpose. In future the same company will generate 560MW power daily fromthe city waste. In return the CDGK will receive 15 per cent royalty from the total revenue
earnings by the sale of electricity.
Awan revealed that it would not only affect the workers but all the citizens would also be
victimised by more taxes for “public utility charges”. The citizens will have to pay this tax
ranging from Rs100 to Rs1000 per month, according to the residential area. The similar tax for
commercial and industrial plots will be ranging from Rs200 to Rs5,000 per month, he added.