Embed Size (px)
Citation preview
2 0 2 0 V o l u m e 4 4https://doi.org/10.33321/cdi.2020.44.63
COVID-19, Australia: Epidemiology Report 20Fortnightly reporting period ending 5 July 2020
COVID-19 National Incident Room Surveillance Team
Communicable Diseases Intelligence ISSN: 2209-6051 Online
This journal is indexed by Index Medicus and Medline.
Creative Commons Licence - Attribution-NonCommercial-NoDerivatives CC BY-NC-ND
© 2020 Commonwealth of Australia as represented by the Department of Health
This publication is licensed under a Creative Commons Attribution- Non-Commercial NoDerivatives 4.0 International Licence from https://creativecommons.org/licenses/by-nc-nd/4.0/legalcode (Licence). You must read and understand the Licence before using any material from this publication.
Restrictions The Licence does not cover, and there is no permission given for, use of any of the following material found in this publication (if any):
• the Commonwealth Coat of Arms (by way of information, the terms under which the Coat of Arms may be used can be found at www.itsanhonour.gov.au);
• any logos (including the Department of Health’s logo) and trademarks;
• any photographs and images;
• any signatures; and
• any material belonging to third parties.
Disclaimer Opinions expressed in Communicable Diseases Intelligence are those of the authors and not necessarily those of the Australian Government Department of Health or the Communicable Diseases Network Australia. Data may be subject to revision.
Enquiries Enquiries regarding any other use of this publication should be addressed to the Communication Branch, Department of Health, GPO Box 9848, Canberra ACT 2601, or via e-mail to: [email protected]
Communicable Diseases Network Australia Communicable Diseases Intelligence contributes to the work of the Communicable Diseases Network Australia. http://www.health.gov.au/cdna
Communicable Diseases Intelligence (CDI) is a peer-reviewed scientific journal published by the Office of Health Protection, Department of Health. The journal aims to disseminate information on the epidemiology, surveillance, prevention and control of communicable diseases of relevance to Australia.
Editor Tanja Farmer
Deputy Editor Simon Petrie
Design and Production Kasra Yousefi
Editorial Advisory Board David Durrheim, Mark Ferson, John Kaldor, Martyn Kirk and Linda Selvey
Website http://www.health.gov.au/cdi
Contacts Communicable Diseases Intelligence is produced by: Health Protection Policy Branch Office of Health Protection Australian Government Department of Health GPO Box 9848, (MDP 6) CANBERRA ACT 2601
Email: [email protected]
Submit an Article You are invited to submit your next communicable disease related article to the Communicable Diseases Intelligence (CDI) for consideration. More information regarding CDI can be found at: http://health.gov.au/cdi.
Further enquiries should be directed to: [email protected].
1 of 31 health.gov.au/cdi Commun Dis Intell (2018) 2020;44(https://doi.org/10.33321/cdi.2020.44.63) Epub 14/7/2020
Erratum: An error occurred in the caption for Figure 7 (Number of COVID-19 cases (logarithmic scale) by selected country and days since passing 100 cases, up to 5 July 2020) as originally published, which inadvertently listed the wrong date. This has now been amended.
Fortnightly epidemiological report
COVID-19, Australia: Epidemiology Report 20i
Fortnightly reporting period ending 5 July 2020COVID-19 National Incident Room Surveillance Team
Notified cases of COVID-19 and associated deaths reported to the National Notifiable Diseases Surveillance System (NNDSS) to 5 July 2020
Confirmed cases in Australia notified up to 5 July 2020 22 June to 5 July
Notificationsa 8,566 897
Deaths 106 4
a On 3 July, 189 historic cases reported in crew members on board a ship were classified as Australian cases and included in Australian totals.
Summary
Over the past fortnightly reporting period (22 June to 5 July):• The national incidence of COVID-19 remained low, with very few cases reported by most juris-
dictions in this reporting period.
• The majority of the current cases reported over this fortnight are from Victoria, with an increas-ing number and proportion of cases reported as being locally acquired.
• Total case numbers have increased with an average of 54 cases reported on any one day, more thantwice the average number reported in the previous reporting period.
• The number and proportion of deaths associated with COVID-19 remains low and it appears thatvulnerable populations have not been disproportionately affected by COVID-19 overall.
• Testing rates continue to be high across all jurisdictions, with the nationwide positivity rate re-maining very low at less than 0.3%.
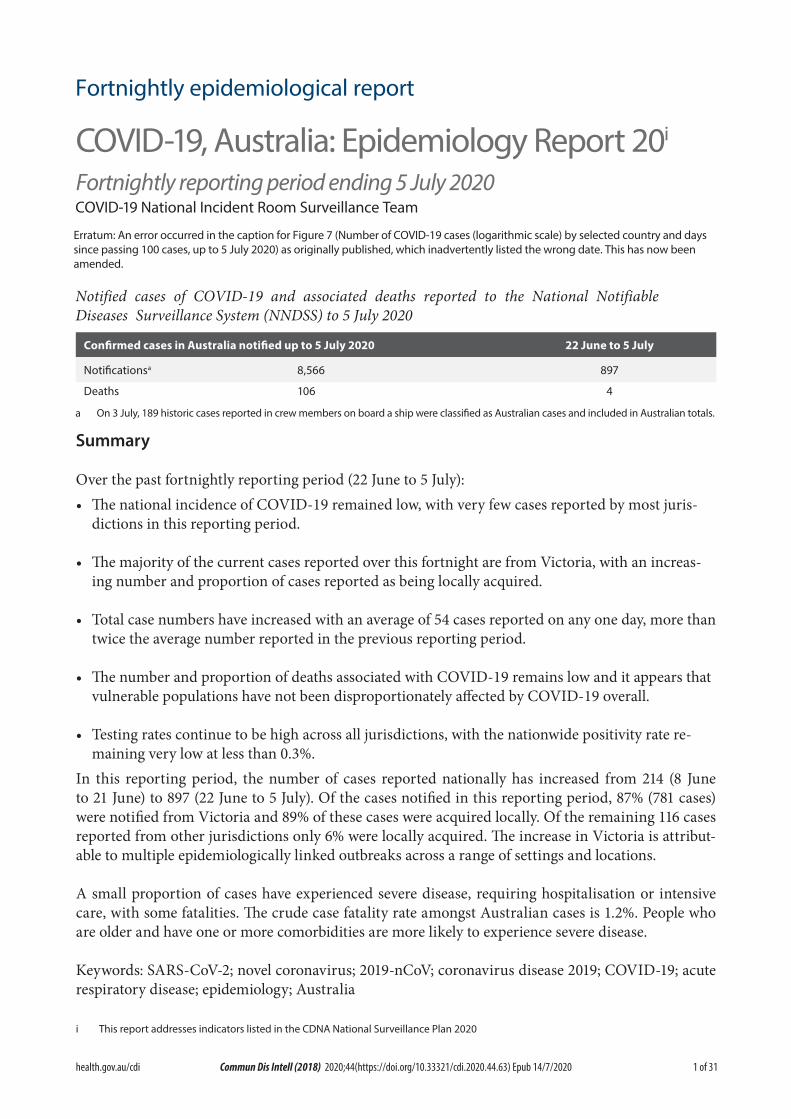
In this reporting period, the number of cases reported nationally has increased from 214 (8 June to 21 June) to 897 (22 June to 5 July). Of the cases notified in this reporting period, 87% (781 cases) were notified from Victoria and 89% of these cases were acquired locally. Of the remaining 116 cases reported from other jurisdictions only 6% were locally acquired. The increase in Victoria is attribut-able to multiple epidemiologically linked outbreaks across a range of settings and locations.
A small proportion of cases have experienced severe disease, requiring hospitalisation or intensive care, with some fatalities. The crude case fatality rate amongst Australian cases is 1.2%. People who are older and have one or more comorbidities are more likely to experience severe disease.
Keywords: SARS-CoV-2; novel coronavirus; 2019-nCoV; coronavirus disease 2019; COVID-19; acute respiratory disease; epidemiology; Australia
i This report addresses indicators listed in the CDNA National Surveillance Plan 2020
2 of 31 health.gov.au/cdiCommun Dis Intell (2018) 2020;44(https://doi.org/10.33321/cdi.2020.44.63) Epub 14/7/2020
New and cumulative COVID-19 notifications by date of illness onset, Australiaa
0
1000
2000
3000
4000
5000
6000
7000
8000
9000
0
100
200
300
400
500
600
12-J
an-2
0
19-J
an-2
0
26-J
an-2
0
2-Fe
b-20
9-Fe
b-20
16-F
eb-2
0
23-F
eb-2
0
1-M
ar-2
0
8-M
ar-2
0
15-M
ar-2
0
22-M
ar-2
0
29-M
ar-2
0
5-Ap
r-20
12-A
pr-2
0
19-A
pr-2
0
26-A
pr-2
0
3-M
ay-2
0
10-M
ay-2
0
17-M
ay-2
0
24-M
ay-2
0
31-M
ay-2
0
7-Ju
n-20
14-J
un-2
0
21-J
un-2
0
28-J
un-2
0
5-Ju
l-20
NNuumm
bbeerr oo
ff ccaass
eess ((cc
uummuull
aattiivv
ee))
NNuumm
bbeerr oo
ff nneeww
ccaass
eess
DDaattee ooff iillllnneessss oonnsseetta Source: NNDSS
In focus: Victoria
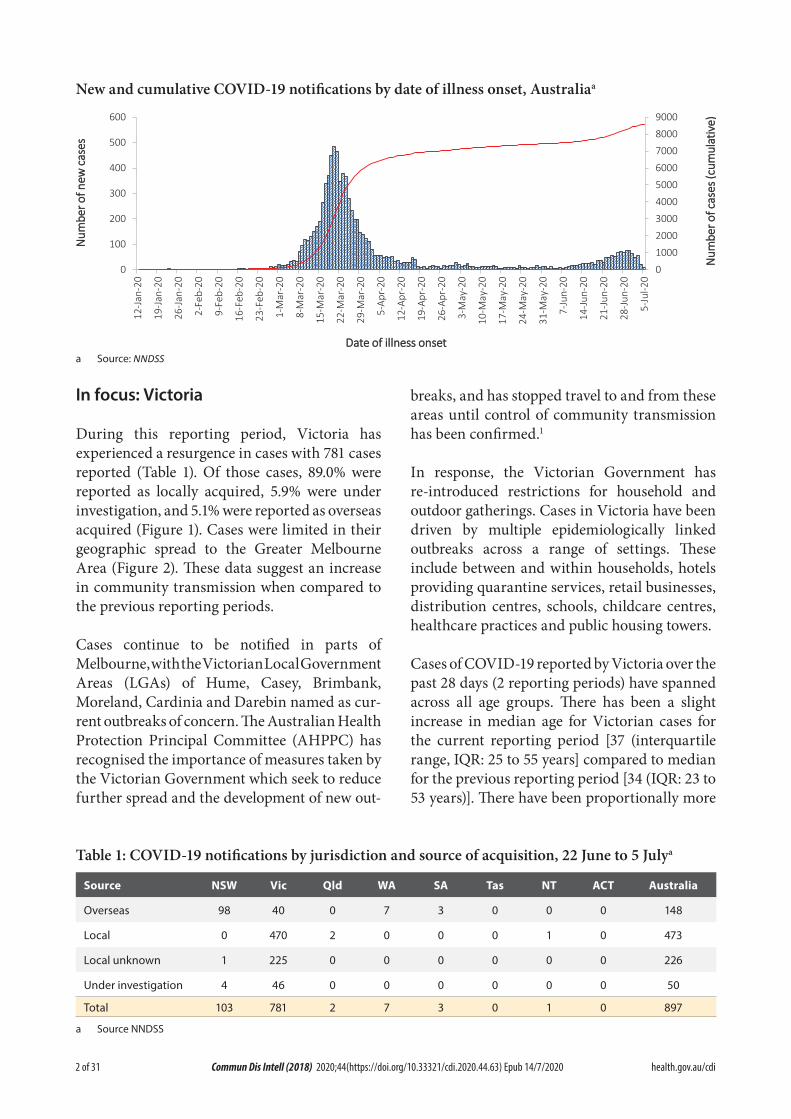
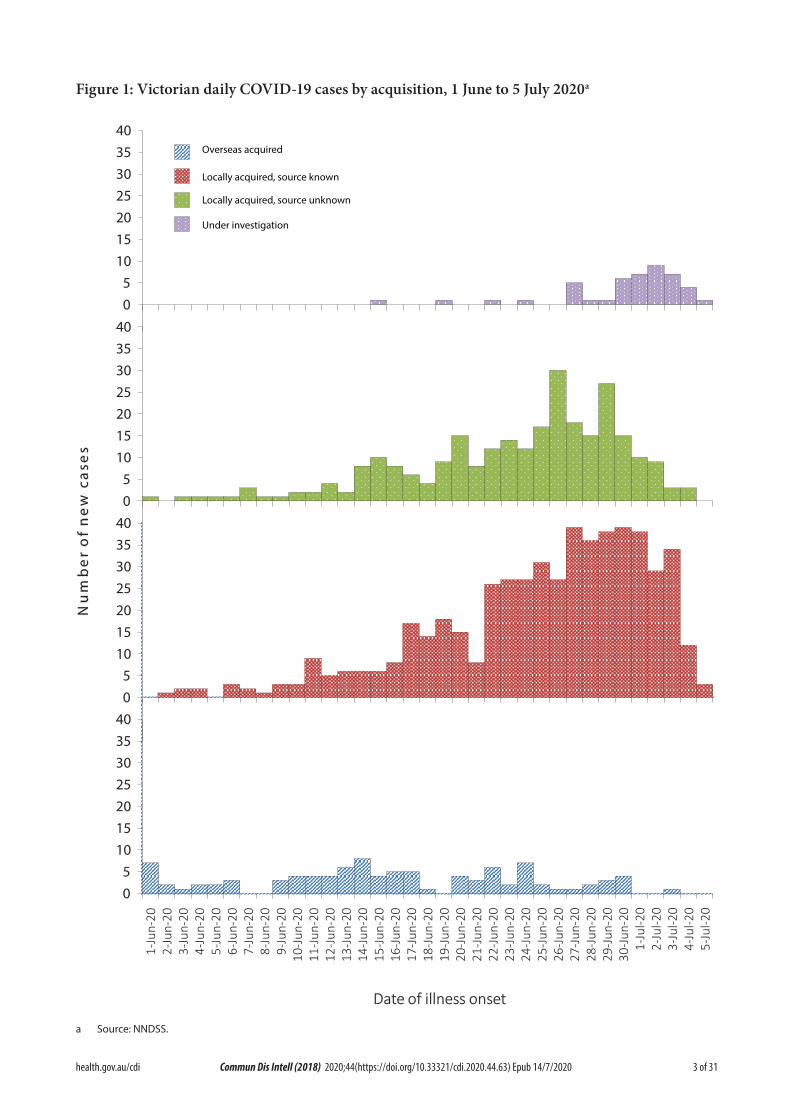
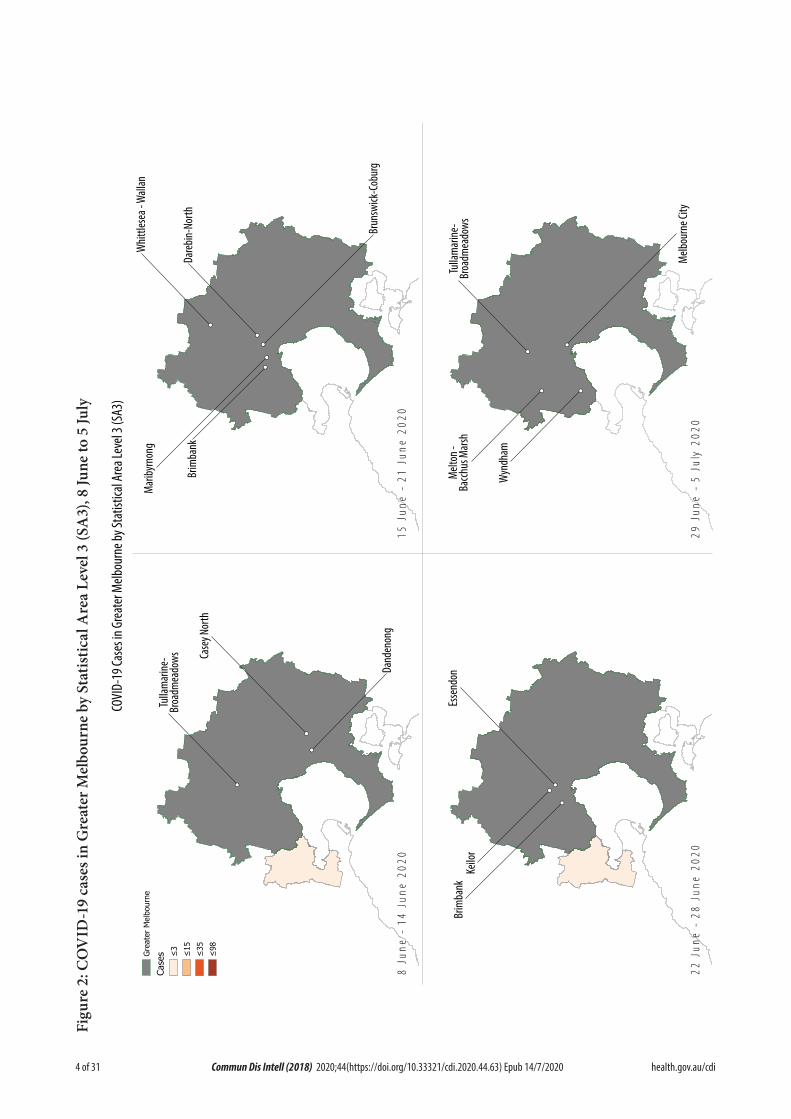
During this reporting period, Victoria has experienced a resurgence in cases with 781 cases reported (Table 1). Of those cases, 89.0% were reported as locally acquired, 5.9% were under investigation, and 5.1% were reported as overseas acquired (Figure 1). Cases were limited in their geographic spread to the Greater Melbourne Area (Figure 2). These data suggest an increase in community transmission when compared to the previous reporting periods.
Cases continue to be notified in parts of Melbourne, with the Victorian Local Government Areas (LGAs) of Hume, Casey, Brimbank, Moreland, Cardinia and Darebin named as cur-rent outbreaks of concern. The Australian Health Protection Principal Committee (AHPPC) has recognised the importance of measures taken by the Victorian Government which seek to reduce further spread and the development of new out-
breaks, and has stopped travel to and from these areas until control of community transmission has been confirmed.1
In response, the Victorian Government has re-introduced restrictions for household and outdoor gatherings. Cases in Victoria have been driven by multiple epidemiologically linked outbreaks across a range of settings. These include between and within households, hotels providing quarantine services, retail businesses, distribution centres, schools, childcare centres, healthcare practices and public housing towers.
Cases of COVID-19 reported by Victoria over the past 28 days (2 reporting periods) have spanned across all age groups. There has been a slight increase in median age for Victorian cases for the current reporting period [37 (interquartile range, IQR: 25 to 55 years] compared to median for the previous reporting period [34 (IQR: 23 to 53 years)]. There have been proportionally more
Table 1: COVID-19 notifications by jurisdiction and source of acquisition, 22 June to 5 Julya
Source NSW Vic Qld WA SA Tas NT ACT Australia
Overseas 98 40 0 7 3 0 0 0 148
Local 0 470 2 0 0 0 1 0 473
Local unknown 1 225 0 0 0 0 0 0 226
Under investigation 4 46 0 0 0 0 0 0 50
Total 103 781 2 7 3 0 1 0 897
a Source NNDSS
3 of 31 health.gov.au/cdi Commun Dis Intell (2018) 2020;44(https://doi.org/10.33321/cdi.2020.44.63) Epub 14/7/2020
Figure 1: Victorian daily COVID-19 cases by acquisition, 1 June to 5 July 2020a
05
10152025303540
Nu
mb
er
of
ne
w c
ase
s
Date of illness onset
05
10152025303540
05
10152025303540
05
10152025303540
1-Ju
n-20
2-Ju
n-20
3-Ju
n-20
4-Ju
n-20
5-Ju
n-20
6-Ju
n-20
7-Ju
n-20
8-Ju
n-20
9-Ju
n-20
10-J
un-2
011
-Jun
-20
12-J
un-2
013
-Jun
-20
14-J
un-2
015
-Jun
-20
16-J
un-2
017
-Jun
-20
18-J
un-2
019
-Jun
-20
20-J
un-2
021
-Jun
-20
22-J
un-2
023
-Jun
-20
24-J
un-2
025
-Jun
-20
26-J
un-2
027
-Jun
-20
28-J
un-2
029
-Jun
-20
30-J
un-2
01-
Jul-2
02-
Jul-2
03-
Jul-2
04-
Jul-2
05-
Jul-2
0
Overseas acquired
Locally acquired, source known
Locally acquired, source unknown
Under investigation
a Source: NNDSS.
4 of 31 health.gov.au/cdiCommun Dis Intell (2018) 2020;44(https://doi.org/10.33321/cdi.2020.44.63) Epub 14/7/2020
Figu
re 2
: CO
VID
-19
case
s in
Gre
ater
Mel
bour
ne b
y St
atis
tical
Are
a Le
vel 3
(SA
3), 8
June
to 5
July
5 of 31 health.gov.au/cdi Commun Dis Intell (2018) 2020;44(https://doi.org/10.33321/cdi.2020.44.63) Epub 14/7/2020
Figu
re 3
: CO
VID
-19
case
not
ifica
tions
12
Janu
ary
– 5
July
202
0,a fo
r New
Sou
th W
ales
, Vic
tori
a an
d Q
ueen
sland
050100
150
200 050100
150
200
100
150
200 050
12-Jan-20
19-Jan-20
26-Jan-20
2-Feb-20
9-Feb-20
16-Feb-20
23-Feb-20
1-Mar-20
8-Mar-20
15-Mar-20
22-Mar-20
29-Mar-20
5-Apr-20
12-Apr-20
19-Apr-20
26-Apr-20
3-May-20
10-May-20
17-May-20
24-May-20
31-May-20
7-Jun-20
14-Jun-20
21-Jun-20
28-Jun-20
5-Jul-20
Number of new cases
Ove
rsea
s ac
quire
d
Loca
lly a
cqui
red,
sou
rce
know
n
Loca
lly a
cqui
red,
sou
rce
unkn
own
Und
er in
vest
igat
ion
Vict
oria
New
Sou
th W
ales
Que
ensl
and
a So
urce
: NN
DSS
.
6 of 31 health.gov.au/cdiCommun Dis Intell (2018) 2020;44(https://doi.org/10.33321/cdi.2020.44.63) Epub 14/7/2020
Tabl
e 2:
Dia
gnos
tic te
sts p
erfo
rmed
as a
t 5 Ju
ly 2
020,
Aus
tral
ia, b
y ju
risd
ictio
na
Juri
sdic
tion
Test
s pe
rfor
med
7
– 21
Jun
eTe
sts
perf
orm
ed
22 J
une
– 5
July
Cum
ulat
ive
test
s pe
rfor
med
to 5
Jul
y
npo
siti
vity
(%)
npo
siti
vity
(%)
npo
siti
vity
(%)
per 1
00,0
00
pop
ulat
iona,
b
NSW
160,
654
0.02
216,
615
0.12
942,
432
0.36
11,6
50
Vic
120,
845
0.12
267,
370
0.26
928,
171
0.27
14,0
72
Qld
55,2
660.
0111
5,88
40.
0039
0,57
20.
277,
667
WA
45,7
580.
0129
,948
0.04
191,
213
0.32
7,29
4
SA22
,541
0.00
23,8
020.
0116
1,09
20.
279,
195
Tas
11,3
010.
008,
909
0.00
52,9
340.
439,
904
NT
2,07
90.
003,
215
0.03
14,7
480.
205,
997
ACT
5,41
80.
006,
368
0.00
32,2
730.
337,
563
Aus
tral
ia42
3,86
20.
0567
2,11
10.
152,
713,
435
0.31
10,6
97
a D
ata
in th
is ta
ble
are
base
d on
repo
rts
of n
otifi
catio
n by
sta
tes
and
terr
itorie
s.b
Popu
latio
n da
ta b
ased
on
Aust
ralia
n Bu
reau
of S
tatis
tics
(ABS
) Est
imat
ed R
esid
ent P
opul
atio
n (E
RP) a
s at
30
June
201
9.
7 of 31 health.gov.au/cdi Commun Dis Intell (2018) 2020;44(https://doi.org/10.33321/cdi.2020.44.63) Epub 14/7/2020
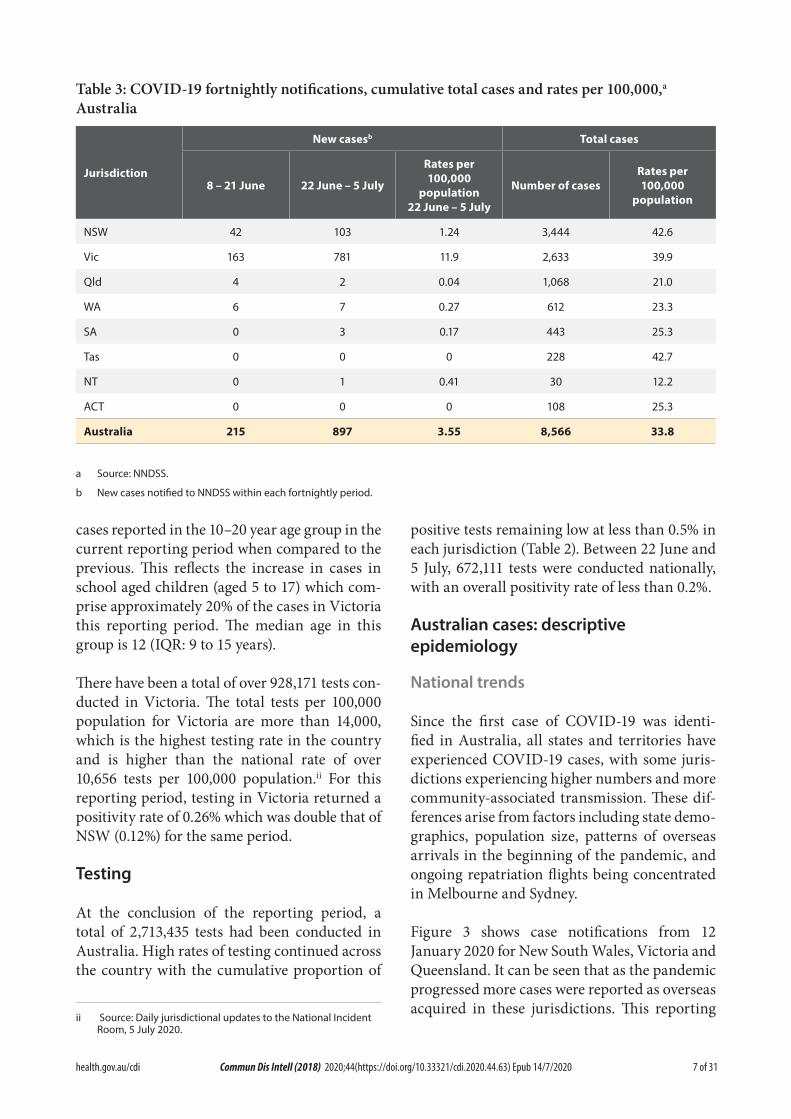
Table 3: COVID-19 fortnightly notifications, cumulative total cases and rates per 100,000,a Australia
Jurisdiction
New casesb Total cases
8 – 21 June 22 June – 5 July
Rates per 100,000
population 22 June – 5 July
Number of casesRates per 100,000
population
NSW 42 103 1.24 3,444 42.6
Vic 163 781 11.9 2,633 39.9
Qld 4 2 0.04 1,068 21.0
WA 6 7 0.27 612 23.3
SA 0 3 0.17 443 25.3
Tas 0 0 0 228 42.7
NT 0 1 0.41 30 12.2
ACT 0 0 0 108 25.3
Australia 215 897 3.55 8,566 33.8
a Source: NNDSS.
b New cases notified to NNDSS within each fortnightly period.
cases reported in the 10–20 year age group in the current reporting period when compared to the previous. This reflects the increase in cases in school aged children (aged 5 to 17) which com-prise approximately 20% of the cases in Victoria this reporting period. The median age in this group is 12 (IQR: 9 to 15 years).
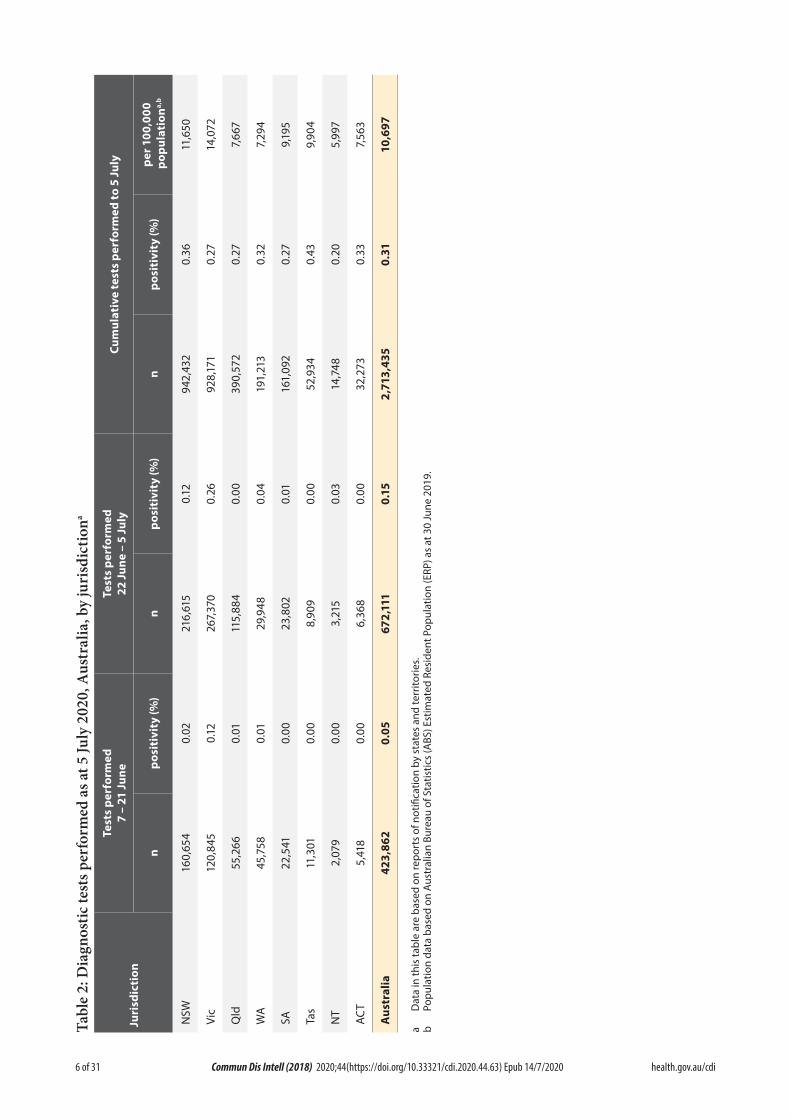
There have been a total of over 928,171 tests con-ducted in Victoria. The total tests per 100,000 population for Victoria are more than 14,000, which is the highest testing rate in the country and is higher than the national rate of over 10,656 tests per 100,000 population.ii For this reporting period, testing in Victoria returned a positivity rate of 0.26% which was double that of NSW (0.12%) for the same period.
Testing
At the conclusion of the reporting period, a total of 2,713,435 tests had been conducted in Australia. High rates of testing continued across the country with the cumulative proportion of
ii Source: Daily jurisdictional updates to the National Incident Room, 5 July 2020.
positive tests remaining low at less than 0.5% in each jurisdiction (Table 2). Between 22 June and 5 July, 672,111 tests were conducted nationally, with an overall positivity rate of less than 0.2%.
Australian cases: descriptive epidemiology
National trends
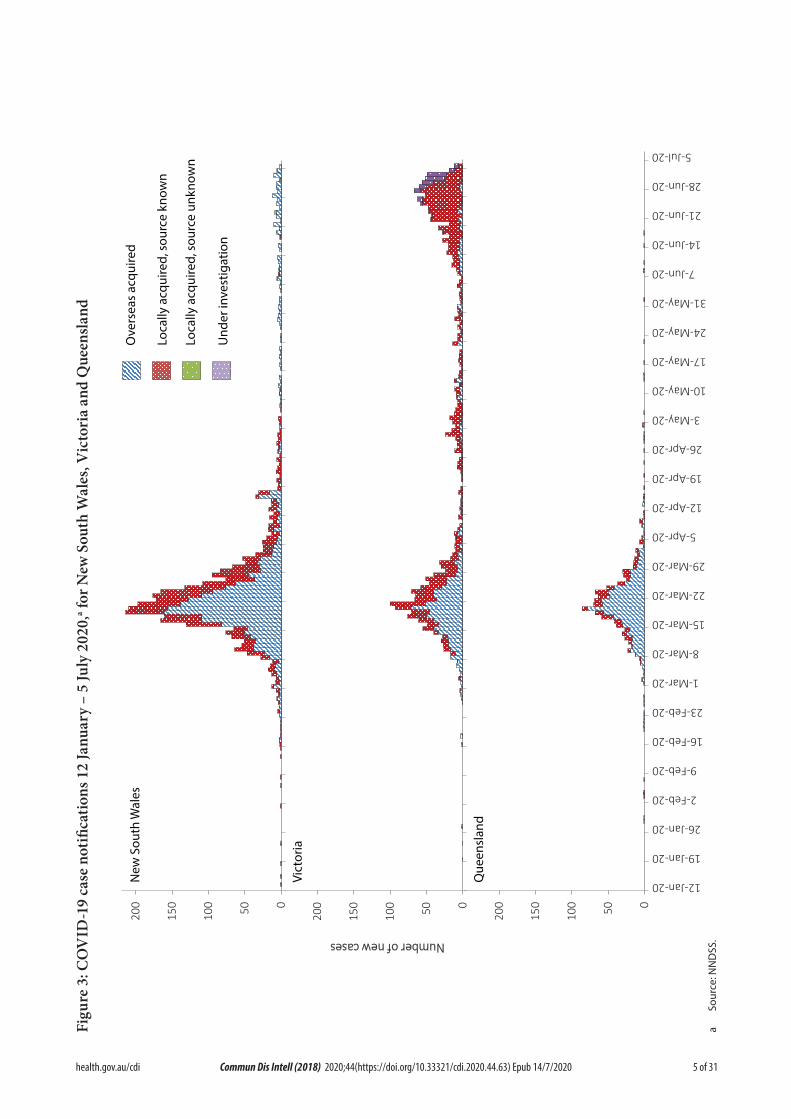
Since the first case of COVID-19 was identi-fied in Australia, all states and territories have experienced COVID-19 cases, with some juris-dictions experiencing higher numbers and more community-associated transmission. These dif-ferences arise from factors including state demo-graphics, population size, patterns of overseas arrivals in the beginning of the pandemic, and ongoing repatriation flights being concentrated in Melbourne and Sydney.
Figure 3 shows case notifications from 12 January 2020 for New South Wales, Victoria and Queensland. It can be seen that as the pandemic progressed more cases were reported as overseas acquired in these jurisdictions. This reporting
8 of 31 health.gov.au/cdiCommun Dis Intell (2018) 2020;44(https://doi.org/10.33321/cdi.2020.44.63) Epub 14/7/2020
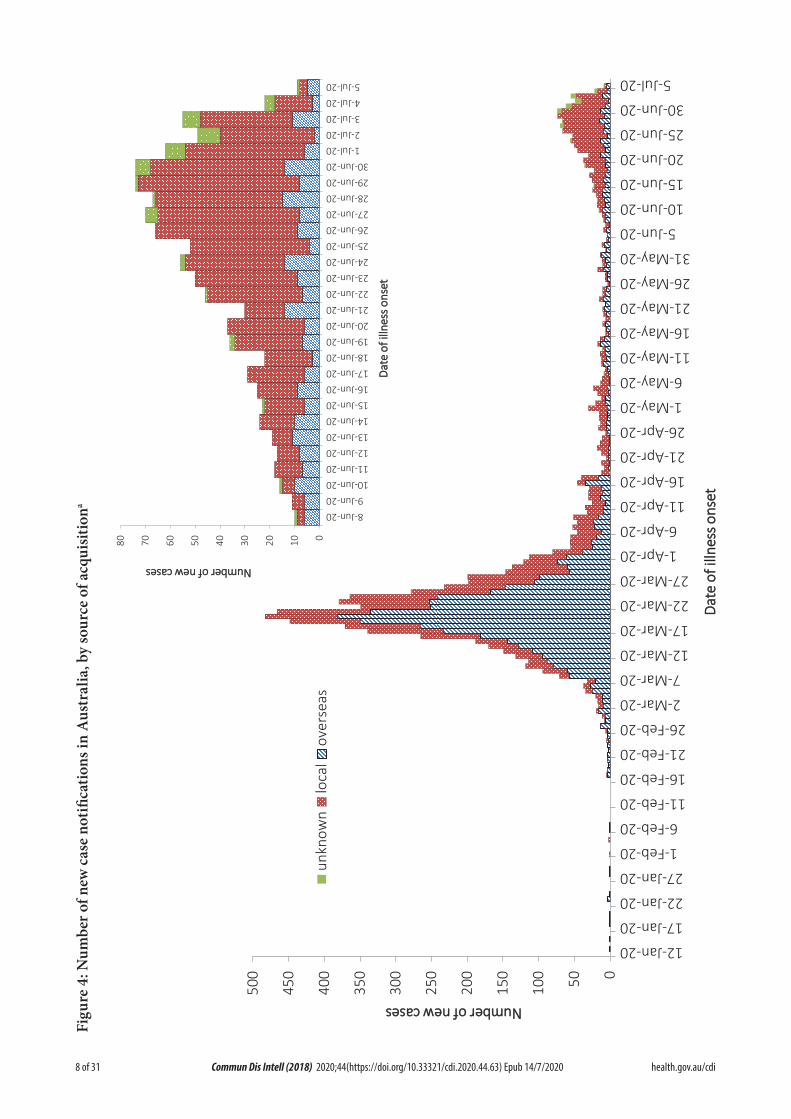
Figu
re 4
: Num
ber o
f new
cas
e no
tifica
tions
in A
ustr
alia
, by
sour
ce o
f acq
uisit
iona
050100
150
200
250
300
350
400
450
500
12-Jan-20
17-Jan-20
22-Jan-20
27-Jan-20
1-Feb-20
6-Feb-20
11-Feb-20
16-Feb-20
21-Feb-20
26-Feb-20
2-Mar-20
7-Mar-20
12-Mar-20
17-Mar-20
22-Mar-20
27-Mar-20
1-Apr-20
6-Apr-20
11-Apr-20
16-Apr-20
21-Apr-20
26-Apr-20
1-May-20
6-May-20
11-May-20
16-May-20
21-May-20
26-May-20
31-May-20
5-Jun-20
10-Jun-20
15-Jun-20
20-Jun-20
25-Jun-20
30-Jun-20
5-Jul-20
NNuummbbeerr ooff nneeww ccaasseess
DDaattee
ooff ii
llllnneess
ss oonnss
eett
unkn
own
loca
lov
erse
as01020304050607080
8-Jun-209-Jun-20
10-Jun-2011-Jun-2012-Jun-2013-Jun-2014-Jun-2015-Jun-2016-Jun-2017-Jun-2018-Jun-2019-Jun-2020-Jun-2021-Jun-2022-Jun-2023-Jun-2024-Jun-2025-Jun-2026-Jun-2027-Jun-2028-Jun-2029-Jun-2030-Jun-20
1-Jul-202-Jul-203-Jul-204-Jul-205-Jul-20
NNuummbbeerr ooff nneeww ccaasseess
DDaattee
ooff ii
llllnneess
ss oonnss
eett
9 of 31 health.gov.au/cdi Commun Dis Intell (2018) 2020;44(https://doi.org/10.33321/cdi.2020.44.63) Epub 14/7/2020
period shows that most cases are currently being reported as locally acquired and Victoria has reported outbreaks due to community transmis-sion.
In this reporting period, the national rate of infection was 3.5 per 100,000 population (Table 3). However, Victoria’s rate of infection for this period was 11.9 per 100,000 population, more than three times the national average. The Victorian rate during this period is similar to the state’s rate during the fortnight 16 to 29 March, which was the initial height of the epidemic (11.3), but much lower than was New South Wales during the same period (22.9). Nationally, the current Victorian rate is the highest rate of COVID-19 per capita since mid-April.
Source of acquisition
As at 5 July 2020, Australia has recorded 8,566 cases of COVID-19. Of these 41% are reported as locally acquired, and 58% are reported as overseas acquired (Figure 4). For this report-ing period, 78% of cases were locally acquired, 16% were overseas acquired, and 6% were under investigation at time of reporting.
During this reporting period the number and proportion of locally-acquired cases continued to increase, largely due to outbreaks in Victoria. Of all locally-acquired cases, the source of acquisition for 68% of cases was found to be a contact of a case or in a known cluster, 32% were unable to be linked to another case and less than 1% were unable to be linked to any case or cluster but had travelled interstate during their exposure period.
The majority of overseas-acquired cases during this reporting period were related to cruise-ship travel, travel in the European region and repa-triation flights. Overseas-acquired cases were predominantly reported from NSW and WA and were detected in travellers in hotel quaran-tine from repatriation flights.
Demographics of cases
Historically, cases of COVID-19 have been reported across all age groups, with a mean age of 44.5 years and a median age of 44 years (IQR: 28 to 61) (see Appendix B, Figure B.1 and Table B.1). In the first two months of the epidemic the population diagnosed was slightly older, with a
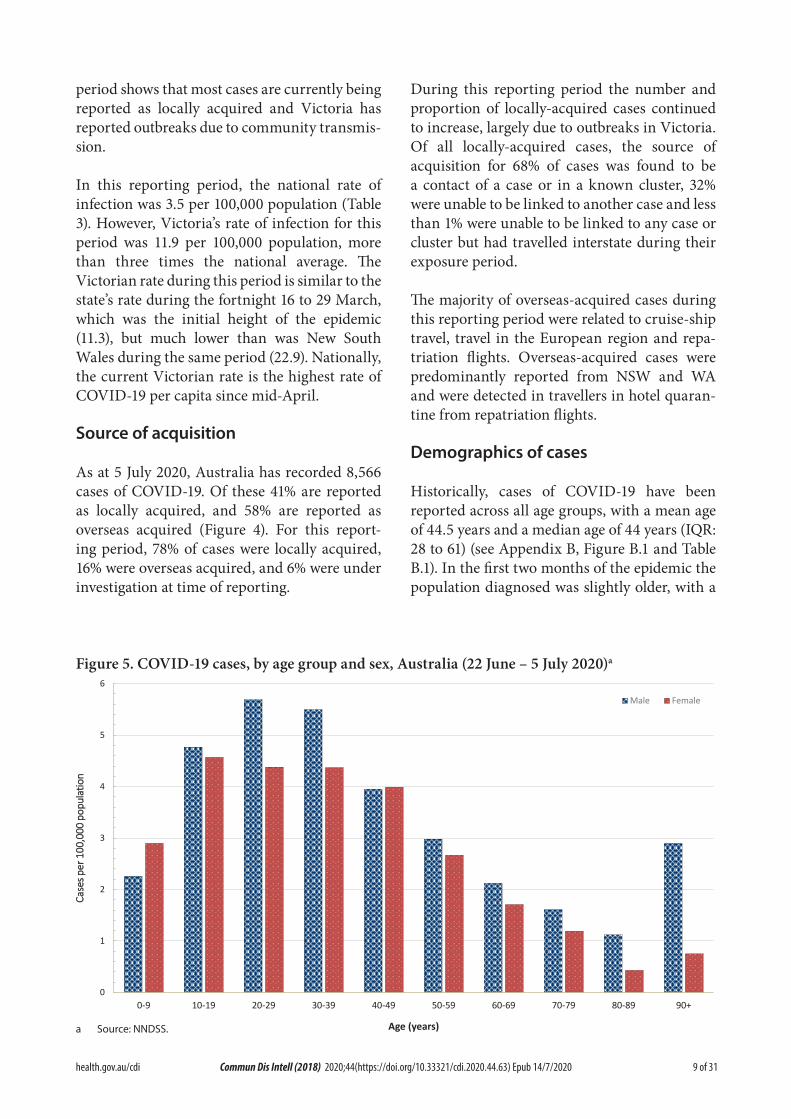
Figure 5. COVID-19 cases, by age group and sex, Australia (22 June – 5 July 2020)a
0
1
2
3
4
5
6
0-9 10-19 20-29 30-39 40-49 50-59 60-69 70-79 80-89 90+
CCaassee
ss ppeerr
110000
,,000000
ppoopp
uullaatt
iioonn
Age (years)
Male Female
a Source: NNDSS.
10 of 31 health.gov.au/cdiCommun Dis Intell (2018) 2020;44(https://doi.org/10.33321/cdi.2020.44.63) Epub 14/7/2020
median age of 45 (IQR: 31 to 57) reflecting the source of acquisition being primarily cruise ships.
In this reporting period, the median age for all cases is 31 (IQR: 19 to 46). This reflects the increasing number of young people affected through community transmission (Figure 5 and Appendix B, Table B.2). The rate of cases in males aged 80 and above was at least twice that of females in the same age group. Additionally, within the past fortnight the rate in the male 20–29 years age group was higher than that of females, which is the opposite of the long term trend (Figure 5).
People aged 20–29 years now have the highest rate of COVID-19 infection (with 49.3 cases per 100,000 population), followed closely by the age groups of 60–69 years (with 47.3 cases per 100,000 population) and then 70–79 years (with 44.2 cases per 100,000 population). People aged 0–9 years have the lowest rate, with 6.9 cases per 100,000 population. In most age groups males show a higher rate of infection than females, with exceptions seen in the 0–9 years and 20–29 years age groups. The largest difference in rates is observed in the older age groups where 50% more males than females are diagnosed with COVID-19.
Children aged less than 18 years currently account for 5.4% of all cases, which has increased from 3.5% observed in the first two months of the outbreak. In this reporting period, approxi-mately 22.3% of cases are under 18 years old. A similar trend is seen within school children in this group. School-aged children between 5 and 17 years comprise 3.9% of all cases. However, in this reporting period there are 161 cases in this age group, 18% of all cases reported. Of these cases, 91% were reported from Victoria as locally acquired.
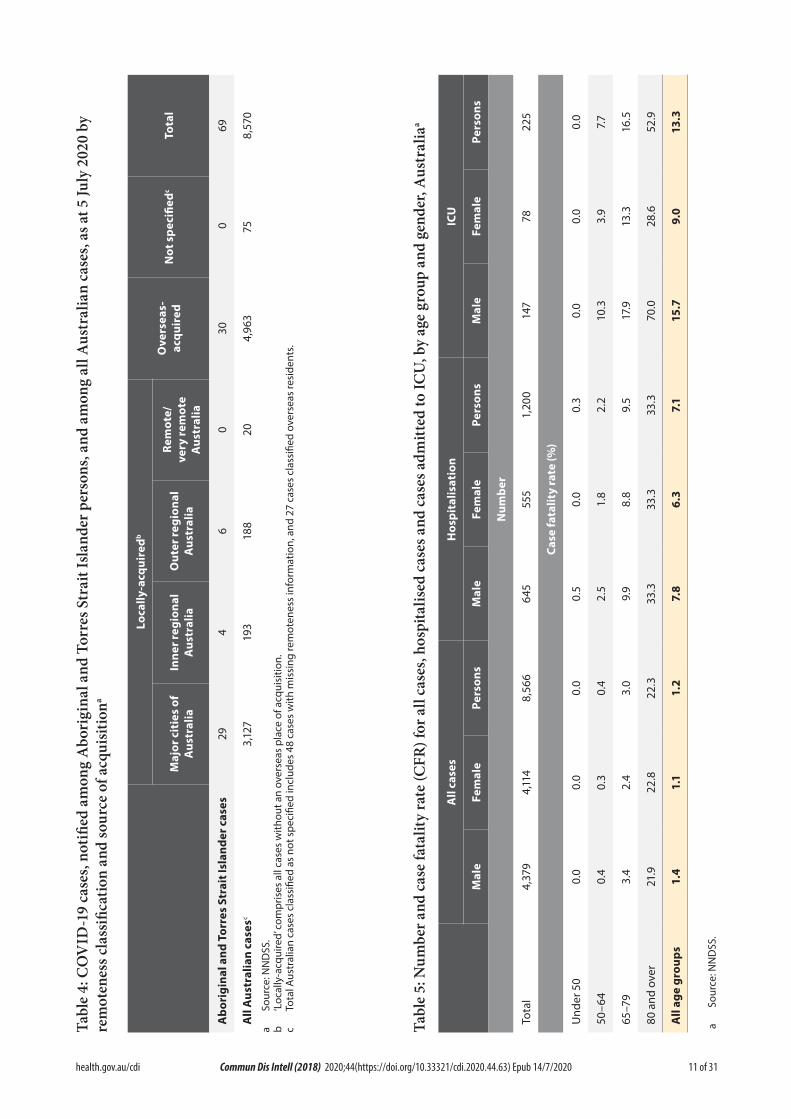
Aboriginal and Torres Strait Islander persons
Sixty-nine cases (0.8%) have been reported in Aboriginal and Torres Strait Islander persons
since the start of the epidemic in Australia. Of these cases, 43% (30/69) acquired their infection overseas. Of locally-acquired cases, the majority (74%) were reported in areas classified ‘Major cities of Australia’ based on the case’s usual place of residence (Table 4). No cases among Aboriginal and Torres Strait Islander persons have been notified from remote or very remote areas of Australia.
The median age of COVID-19 cases among Aboriginal and Torres Strait Islander persons is 33 years (IQR: 23–52 years), which is lower than the median age of non-Indigenous COVID-19 cases which is 44 (IQR: 28–61 years).
Of the cases notified amongst Aboriginal and Torres Strait Islander persons, 12% were admit-ted to hospital, which is similar to the propor-tion of all cases hospitalised (14%). Of cases in Aboriginal and Torres Strait Islander persons, no cases were reported as being admitted to an intensive care unit (ICU) or requiring ventila-tion and no fatalities have been reported.
Across all Australian cases, completeness of the Indigenous status field was approximately 91%.
Severity
Of total cases notified in Australia, approxi-mately 14% (n = 1,200) were admitted to hos-pital. Of hospitalised cases, 19% (n = 225) were admitted to ICU (Table 5) and 85 (7% of hospi-talisations) of those were ventilated. Canada has reported a similar severity profile, with 15% of cases hospitalised, of which 20% were admitted to the ICU and 4% required mechanical ventila-tion.2 Higher rates have been observed across the EU/EEA with 31% of reported cases requir-ing hospitalisation (data from 24 countries) and 14% of reported/hospitalised cases (data from 17 countries) admitted to the ICU and/or requiring respiratory support.3 Proportions vary considerably between countries and are affected by each country’s underlying health and testing strategies, with some European countries only testing hospitalised individuals for COVID-19.
There are also variations in the way different
11 of 31 health.gov.au/cdi Commun Dis Intell (2018) 2020;44(https://doi.org/10.33321/cdi.2020.44.63) Epub 14/7/2020
Tabl
e 4:
CO
VID
-19
case
s, no
tified
am
ong
Abo
rigi
nal a
nd T
orre
s Str
ait I
sland
er p
erso
ns, a
nd a
mon
g al
l Aus
tral
ian
case
s, as
at 5
July
202
0 by
re
mot
enes
s cla
ssifi
catio
n an
d so
urce
of a
cqui
sitio
na
Loca
lly-a
cqui
redb
Ove
rsea
s-ac
quir
edN
ot s
peci
fiedc
Tota
lM
ajor
cit
ies
of
Aus
tral
iaIn
ner r
egio
nal
Aus
tral
iaO
uter
regi
onal
A
ustr
alia
Rem
ote/
very
rem
ote
Aus
tral
ia
Abo
rigi
nal a
nd T
orre
s St
rait
Isla
nder
cas
es29
46
030
069
All
Aus
tral
ian
case
sc3,
127
193
188
204,
963
758,
570
a So
urce
: NN
DSS
.b
‘Loc
ally
-acq
uire
d’ c
ompr
ises
all
case
s w
ithou
t an
over
seas
pla
ce o
f acq
uisi
tion.
c To
tal A
ustr
alia
n ca
ses
clas
sifie
d as
not
spe
cifie
d in
clud
es 4
8 ca
ses
with
mis
sing
rem
oten
ess
info
rmat
ion,
and
27
case
s cl
assi
fied
over
seas
resi
dent
s.
Tabl
e 5:
Num
ber a
nd c
ase
fata
lity
rate
(CFR
) for
all
case
s, ho
spita
lised
cas
es a
nd c
ases
adm
itted
to IC
U, b
y ag
e gr
oup
and
gend
er, A
ustr
alia
a
All
case
sH
ospi
talis
atio
nIC
U
Mal
eFe
mal
ePe
rson
sM
ale
Fem
ale
Pers
ons
Mal
eFe
mal
ePe
rson
s
Num
ber
Tota
l4,
379
4,11
48,
566
645
555
1,20
014
778
225
Case
fata
lity
rate
(%)
Und
er 5
00.
00.
00.
00.
50.
00.
30.
00.
00.
0
50–6
40.
40.
30.
42.
51.
82.
210
.33.
97.
7
65–7
93.
42.
43.
09.
98.
89.
517
.913
.316
.5
80 a
nd o
ver
21.9
22.8
22.3
33.3
33.3
33.3
70.0
28.6
52.9
All
age
grou
ps1.
41.
11.
27.
86.
37.
115
.79.
013
.3
a So
urce
: NN
DSS
.
12 of 31 health.gov.au/cdiCommun Dis Intell (2018) 2020;44(https://doi.org/10.33321/cdi.2020.44.63) Epub 14/7/2020
countries classify and report hospitalisations. The European region also reported a decrease in both the hospitalisation and severe hospitalisa-tion rate with increasing age beyond 80 years, which is not seen in the Australian data. This was hypothesised to reflect clinical decisions about the use of hospital resources for people in this age group and was observed in the data from many countries.3
Among Australian cases, the case fatality rate (CFR) for males aged 65–79 years is higher than for females of the same age (Table 5). However, this is reversed in the population aged 80 years and over. The ratio of males to females is similar among hospitalised cases (1.2:1); however, more males than females have been admitted to the ICU (1.9:1). Overall, fatality rates by age group are similar to those observed in China and Italy as of 17 March 2020,4,5 but lower than those observed for the European region when aggre-gated.3
The CFR for males aged 80 years and over admitted to ICU is high at 70.0% (7 deaths from 10 cases in ICU). These results are similar to the CFR for Canadian males meeting the same crite-ria (65%; 79 deaths from 113 cases in ICU).6 The CFR of Australian hospitalised cases was 7.1%, which dramatically lower than the aggregated value of 24% observed in European cases (data from 22 countries)3 and Canadian cases (33%).6
Australian results are based on small numbers of cases and therefore may not be directly com-parable to results from other countries.
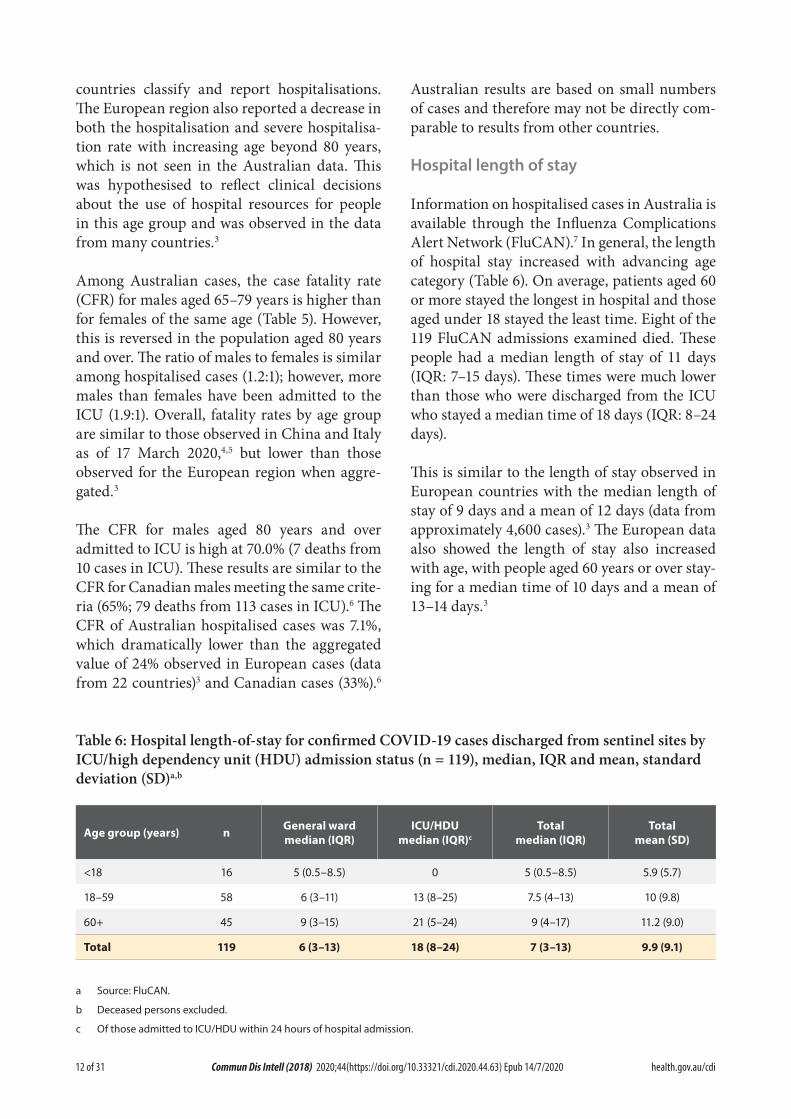
Hospital length of stay
Information on hospitalised cases in Australia is available through the Influenza Complications Alert Network (FluCAN).7 In general, the length of hospital stay increased with advancing age category (Table 6). On average, patients aged 60 or more stayed the longest in hospital and those aged under 18 stayed the least time. Eight of the 119 FluCAN admissions examined died. These people had a median length of stay of 11 days (IQR: 7–15 days). These times were much lower than those who were discharged from the ICU who stayed a median time of 18 days (IQR: 8–24 days).
This is similar to the length of stay observed in European countries with the median length of stay of 9 days and a mean of 12 days (data from approximately 4,600 cases).3 The European data also showed the length of stay also increased with age, with people aged 60 years or over stay-ing for a median time of 10 days and a mean of 13–14 days.3
Table 6: Hospital length-of-stay for confirmed COVID-19 cases discharged from sentinel sites by ICU/high dependency unit (HDU) admission status (n = 119), median, IQR and mean, standard deviation (SD)a,b
Age group (years) n General ward median (IQR)
ICU/HDU median (IQR)c
Total median (IQR)
Total mean (SD)
<18 16 5 (0.5–8.5) 0 5 (0.5–8.5) 5.9 (5.7)
18–59 58 6 (3–11) 13 (8–25) 7.5 (4–13) 10 (9.8)
60+ 45 9 (3–15) 21 (5–24) 9 (4–17) 11.2 (9.0)
Total 119 6 (3–13) 18 (8–24) 7 (3–13) 9.9 (9.1)
a Source: FluCAN.
b Deceased persons excluded.
c Of those admitted to ICU/HDU within 24 hours of hospital admission.
13 of 31 health.gov.au/cdi Commun Dis Intell (2018) 2020;44(https://doi.org/10.33321/cdi.2020.44.63) Epub 14/7/2020
Characteristics of those with severe COVID-19 disease
Higher disease severity, as indicated by hospital-isation, admission to intensive care unit (ICU), and death, has been associated with increased age and comorbidities.8 The median ages of cases who have been hospitalised (61 years; IQR 42.5–72), admitted to ICU (65 years; IQR 54–73) and died (80 years; IQR 74–86) are higher than for cases overall (44 years; IQR 28–61).
Underlying medical conditions and other risk factors
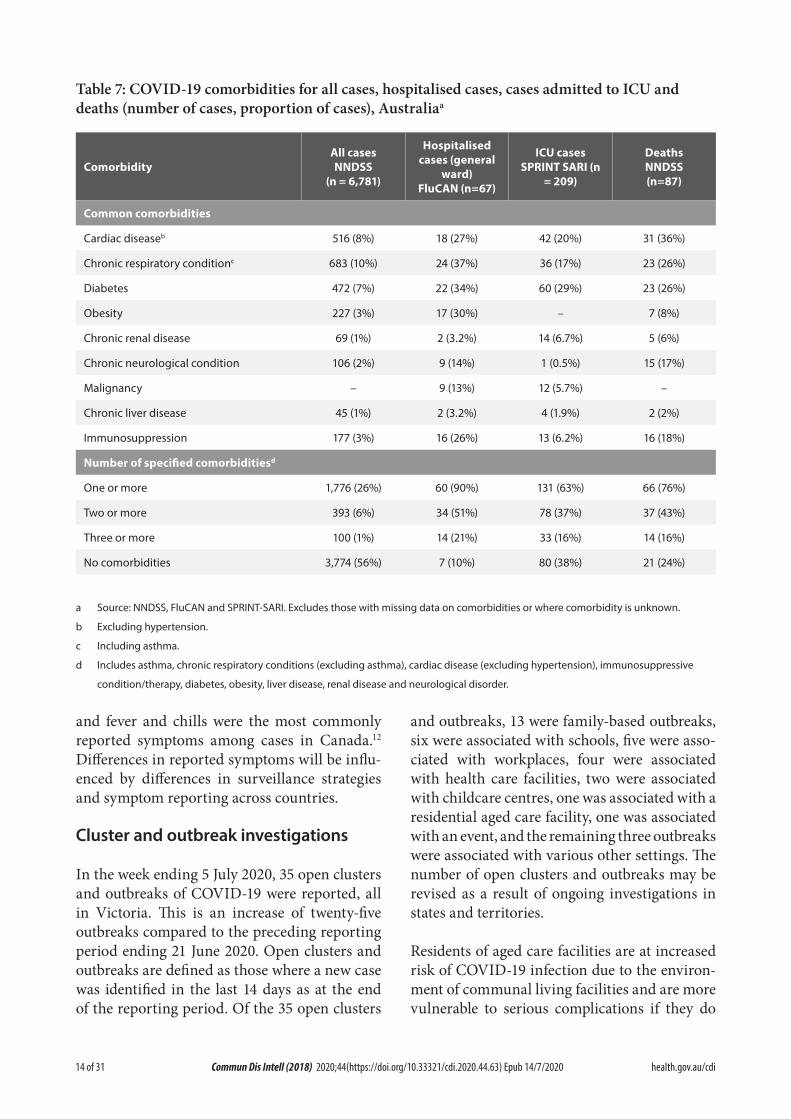
Comorbidity information on cases hospitalised in Australia is available through FluCAN,7 the Australian and New Zealand Intensive Care Society-supported real-time hospital-based surveillance system (SPRINT-SARI),9 and the NNDSS. FluCAN found a greater prevalence of comorbid conditions in a sample of hospitalised COVID-19 patients aged 18 years and over (n = 67) compared to the NNDSS (n = 6,781). This difference may be attributed to more severe disease as a result of comorbidities resulting in hospitalisation, a much smaller sample size from the FluCAN data and/or a more comprehensive review of patient medical records assessed as part of FluCAN.8
Amongst hospitalised cases drawn from FluCAN data where comorbidity data was recorded, the most common comorbidities were chronic res-piratory condition (37%), diabetes (34%), obesity (30%), cardiac disease (27%) and immunosup-pression (26%) (Table 7). Only 10% of patients reported no comorbidities. A history of smoking (current or past smoker) was identified in 36% of FluCAN and 14% of SPRINT-SARI cases.
Australian data on hospitalised comorbidities are different to results reported internationally. The United States CDC publish comorbidity data for a small proportion of cases where a complete chart review is available (COVID-NET).10 In the CDC data, the most common comorbidities found for hospitalised adults with at least one reported comorbidity were hypertension (55%),
obesity (50%), metabolic disease (42%) and cardiovascular disease (32%). Amongst all cases included in the CDC report, only 9% reported no known comorbidity. These are higher levels of comorbidity than the figures reported from FluCAN.
Within the European region, analysis of comor-bidities of hospitalised patients has shown 36% had no reported comorbidity. The most common comorbidities for hospitalised cases with at least one reported comorbidity were cardiac disorder (excluding hypertension) (16%), diabetes (12%) and chronic lung disease (8%).3 These findings are slightly above the level of comorbidity seen for hospitalised cases in Australia based on NNDSS figures.
Symptom profile
The symptoms reported by COVID-19 cases in Australia are consistent with a mild respiratory infection in the majority of cases. The most common symptoms reported (see Appendix B, Figure B.1) were cough (67%), fever (47%), head-ache (42%) and sore throat (40%). Other symp-toms reported include fatigue (31%), chills or rigors (14%) and loss of taste or smell (12%), not-ing that these are currently not standard fields in NNDSS, and are likely to under-represent those presenting with these symptoms. A small number of cases reported more severe symp-toms, with pneumonia and/or acute respiratory disease (ARD) reported in 3% of cases with symptoms.
Adults and children reported similar symptoms, with cough and fever the most commonly-reported symptoms across all age groups. Shortness of breath increased with age, with those aged 80 and over much more likely than the other groups to report it (31%).
The symptom profile of Australian cases is broadly similar to the symptoms reported by COVID-19 cases internationally. Among EU/EEA countries and the UK, fever/chills and dry or productive cough were the most com-monly reported symptoms.11 Cough, headaches
14 of 31 health.gov.au/cdiCommun Dis Intell (2018) 2020;44(https://doi.org/10.33321/cdi.2020.44.63) Epub 14/7/2020
Table 7: COVID-19 comorbidities for all cases, hospitalised cases, cases admitted to ICU and deaths (number of cases, proportion of cases), Australiaa
ComorbidityAll cases NNDSS
(n = 6,781)
Hospitalised cases (general
ward) FluCAN (n=67)
ICU cases SPRINT SARI (n
= 209)
DeathsNNDSS (n=87)
Common comorbidities
Cardiac diseaseb 516 (8%) 18 (27%) 42 (20%) 31 (36%)
Chronic respiratory conditionc 683 (10%) 24 (37%) 36 (17%) 23 (26%)
Diabetes 472 (7%) 22 (34%) 60 (29%) 23 (26%)
Obesity 227 (3%) 17 (30%) – 7 (8%)
Chronic renal disease 69 (1%) 2 (3.2%) 14 (6.7%) 5 (6%)
Chronic neurological condition 106 (2%) 9 (14%) 1 (0.5%) 15 (17%)
Malignancy – 9 (13%) 12 (5.7%) –
Chronic liver disease 45 (1%) 2 (3.2%) 4 (1.9%) 2 (2%)
Immunosuppression 177 (3%) 16 (26%) 13 (6.2%) 16 (18%)
Number of specified comorbiditiesd
One or more 1,776 (26%) 60 (90%) 131 (63%) 66 (76%)
Two or more 393 (6%) 34 (51%) 78 (37%) 37 (43%)
Three or more 100 (1%) 14 (21%) 33 (16%) 14 (16%)
No comorbidities 3,774 (56%) 7 (10%) 80 (38%) 21 (24%)
a Source: NNDSS, FluCAN and SPRINT-SARI. Excludes those with missing data on comorbidities or where comorbidity is unknown.
b Excluding hypertension.
c Including asthma.
d Includes asthma, chronic respiratory conditions (excluding asthma), cardiac disease (excluding hypertension), immunosuppressive
condition/therapy, diabetes, obesity, liver disease, renal disease and neurological disorder.
and fever and chills were the most commonly reported symptoms among cases in Canada.12 Differences in reported symptoms will be influ-enced by differences in surveillance strategies and symptom reporting across countries.
Cluster and outbreak investigations
In the week ending 5 July 2020, 35 open clusters and outbreaks of COVID-19 were reported, all in Victoria. This is an increase of twenty-five outbreaks compared to the preceding reporting period ending 21 June 2020. Open clusters and outbreaks are defined as those where a new case was identified in the last 14 days as at the end of the reporting period. Of the 35 open clusters
and outbreaks, 13 were family-based outbreaks, six were associated with schools, five were asso-ciated with workplaces, four were associated with health care facilities, two were associated with childcare centres, one was associated with a residential aged care facility, one was associated with an event, and the remaining three outbreaks were associated with various other settings. The number of open clusters and outbreaks may be revised as a result of ongoing investigations in states and territories.
Residents of aged care facilities are at increased risk of COVID-19 infection due to the environ-ment of communal living facilities and are more vulnerable to serious complications if they do
15 of 31 health.gov.au/cdi Commun Dis Intell (2018) 2020;44(https://doi.org/10.33321/cdi.2020.44.63) Epub 14/7/2020
Cluster
The term ‘cluster’ in relation to COVID-19 refers to two or more cases (who do not reside in the same household) that are epidemiologically related in time, place or person where a common source (such as an event or within a community) of infection is suspected but not yet established.
Outbreak
The term ‘outbreak’ in relation to COVID-19 refers to two or more cases (who do not reside in the same household) among a specific group of people and/or over a specific period of time where illness is associated with a common source (such as an event or within a community). Some states and territories may report a single case associated with a residential aged care facility as an outbreak.
become infected. As of 5 July 2020, there have been 139 cases of COVID-19 associated with 37 residential aged care facilities, with 107 recov-eries and 31 deaths. Seventy-one of these cases occurred in aged care residents, with the remain-ing 68 cases occurring in care staff. In addition, there have been 44 cases associated with 32 in-home Commonwealth funded aged care services providing support to older Australians who live at home, with 39 recoveries and 3 deaths. Thirty-three of these cases occurred in care recipients, with the remaining 11 cases occurring in care staff. The Commonwealth is actively supporting services with reported incidents and outbreaks of COVID-19 providing access to personal protec-tive equipment and additional staffing resources where required. Advice and guidelines have been provided to aged care services,13 including the release of an outbreak management guide.14
Public health response measures
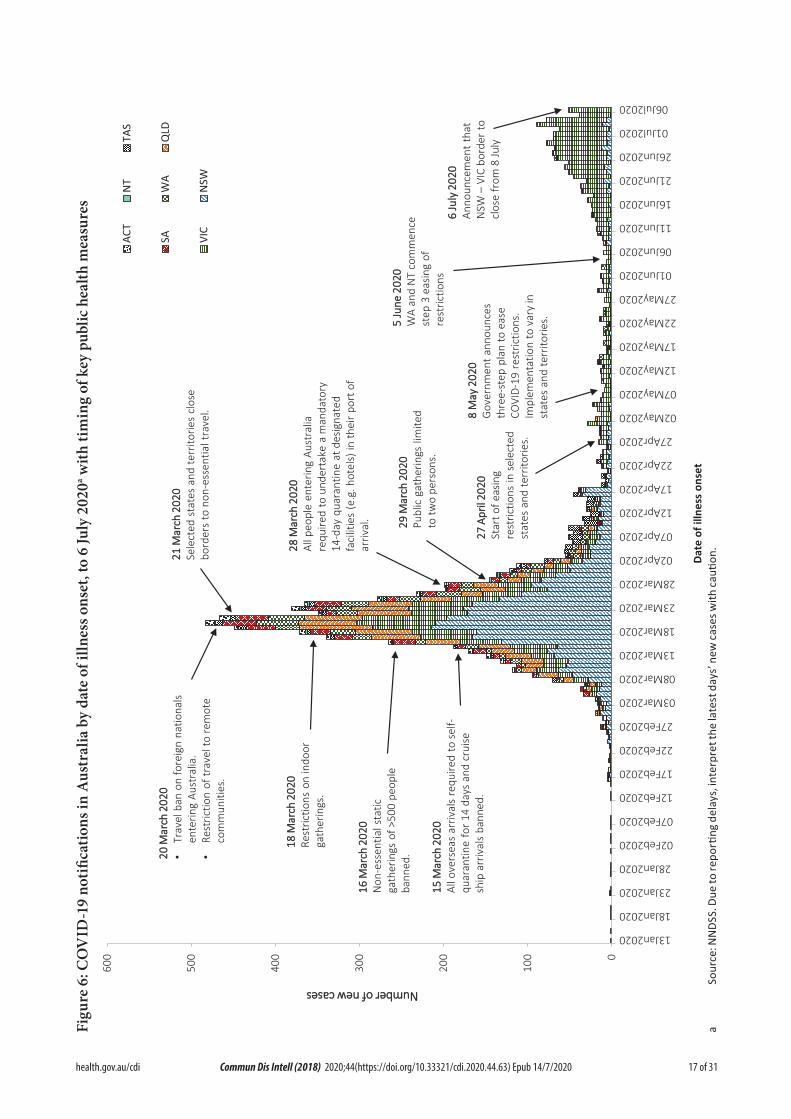
Since COVID-19 first emerged internationally, Australia has implemented public health meas-ures informed by the disease’s epidemiology (Figure 6). Key aspects of Australia’s evolving public health response are summarised in pre-vious reports. On Friday 8 May, the Australian Government announced a three-step framework for easing COVID-19 restrictions, with states and territories easing restrictions at their own pace depending on the current public health
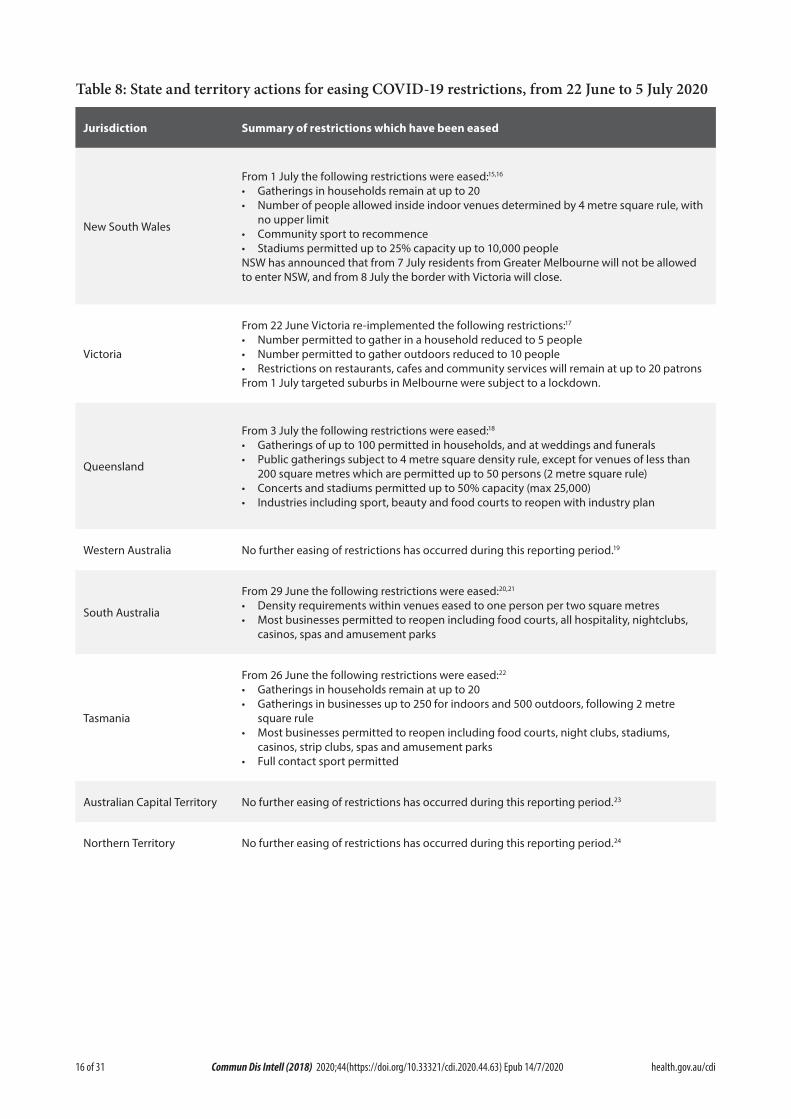
situation and local epidemiology. A summary of the restrictions that have been eased is listed at Table 8.
During this reporting period, there has been a significant increase in the number of reported cases in Victoria. As a result, from 1 July Victoria implemented targeted lockdowns in suburbs with high case numbers. Residents in selected postcodes in Melbourne are now only permitted to leave their homes for essential reasons (school, work, exercise, shopping for food and supplies, or care and caregiving). In addition, on 6 July it was announced that from 7 July residents from the Greater Melbourne area will not be permitted to enter New South Wales, and from 8 July the border between Victoria and New South Wales will close. While other states and territories have continued to ease restrictions, most states and territories have announced that people travelling from Victoria will be subject to a 14-day quarantine after domestic border restrictions are eased.
16 of 31 health.gov.au/cdiCommun Dis Intell (2018) 2020;44(https://doi.org/10.33321/cdi.2020.44.63) Epub 14/7/2020
Table 8: State and territory actions for easing COVID-19 restrictions, from 22 June to 5 July 2020
Jurisdiction Summary of restrictions which have been eased
New South Wales
From 1 July the following restrictions were eased:15,16
• Gatherings in households remain at up to 20• Number of people allowed inside indoor venues determined by 4 metre square rule, with
no upper limit• Community sport to recommence• Stadiums permitted up to 25% capacity up to 10,000 peopleNSW has announced that from 7 July residents from Greater Melbourne will not be allowed to enter NSW, and from 8 July the border with Victoria will close.
Victoria
From 22 June Victoria re-implemented the following restrictions:17
• Number permitted to gather in a household reduced to 5 people• Number permitted to gather outdoors reduced to 10 people• Restrictions on restaurants, cafes and community services will remain at up to 20 patronsFrom 1 July targeted suburbs in Melbourne were subject to a lockdown.
Queensland
From 3 July the following restrictions were eased:18
• Gatherings of up to 100 permitted in households, and at weddings and funerals• Public gatherings subject to 4 metre square density rule, except for venues of less than
200 square metres which are permitted up to 50 persons (2 metre square rule)• Concerts and stadiums permitted up to 50% capacity (max 25,000)• Industries including sport, beauty and food courts to reopen with industry plan
Western Australia No further easing of restrictions has occurred during this reporting period.19
South Australia
From 29 June the following restrictions were eased:20,21
• Density requirements within venues eased to one person per two square metres• Most businesses permitted to reopen including food courts, all hospitality, nightclubs,
casinos, spas and amusement parks
Tasmania
From 26 June the following restrictions were eased:22
• Gatherings in households remain at up to 20• Gatherings in businesses up to 250 for indoors and 500 outdoors, following 2 metre
square rule• Most businesses permitted to reopen including food courts, night clubs, stadiums,
casinos, strip clubs, spas and amusement parks• Full contact sport permitted
Australian Capital Territory No further easing of restrictions has occurred during this reporting period.23
Northern Territory No further easing of restrictions has occurred during this reporting period.24
17 of 31 health.gov.au/cdi Commun Dis Intell (2018) 2020;44(https://doi.org/10.33321/cdi.2020.44.63) Epub 14/7/2020
Figu
re 6
: CO
VID
-19
notifi
catio
ns in
Aus
tral
ia b
y da
te o
f illn
ess o
nset
, to
6 Ju
ly 2
020a w
ith ti
min
g of
key
pub
lic h
ealth
mea
sure
s
0
100
200
300
400
500
600
13Jan2020
18Jan2020
23Jan2020
28Jan2020
02Feb2020
07Feb2020
12Feb2020
17Feb2020
22Feb2020
27Feb2020
03Mar2020
08Mar2020
13Mar2020
18Mar2020
23Mar2020
28Mar2020
02Apr2020
07Apr2020
12Apr2020
17Apr2020
22Apr2020
27Apr2020
02May2020
07May2020
12May2020
17May2020
22May2020
27May2020
01Jun2020
06Jun2020
11Jun2020
16Jun2020
21Jun2020
26Jun2020
01Jul2020
06Jul2020
NNuummbbeerr ooff nneeww ccaasseess
Date
of i
llnes
s on
set
ACT
NT
TAS
SAW
AQ
LD
VIC
NSW
1155 MM
aarrcchh
220022
00Al
l ove
rsea
s ar
rival
s re
quire
d to
sel
f-qu
aran
tine
for 1
4 da
ys a
nd c
ruise
sh
ip a
rriv
als
bann
ed.
1166 MM
aarrcchh
220022
00N
on-e
ssen
tial s
tatic
ga
ther
ings
of >
500
peop
le
bann
ed.
1188 MM
aarrcchh
220022
00Re
stric
tions
on
indo
or
gath
erin
gs.
2200 MM
aarrcchh
220022
00•
Trav
el b
an o
n fo
reig
n na
tiona
ls
ente
ring
Aust
ralia
.•
Rest
rictio
n of
trav
el to
rem
ote
com
mun
ities
.
2211 MM
aarrcchh
220022
00Se
lect
ed s
tate
s an
d te
rrito
ries
clos
e bo
rder
s to
non
-ess
entia
l tra
vel.
2288 MM
aarrcchh
220022
00Al
l peo
ple
ente
ring
Aust
ralia
re
quire
d to
und
erta
ke a
man
dato
ry
14-d
ay q
uara
ntin
e at
des
igna
ted
faci
litie
s (e
.g. h
otel
s) in
thei
r por
t of
arriv
al. 2299
MMaarr
cchh 22
002200
Publ
ic g
athe
rings
lim
ited
to tw
o pe
rson
s.
2277 AA
pprriill
22002200
Star
t of e
asin
g re
stric
tions
in s
elec
ted
stat
es a
nd te
rrito
ries.
88 MM
aayy 22
002200
Gov
ernm
ent a
nnou
nces
th
ree-
step
pla
n to
eas
e CO
VID-
19 r
estr
ictio
ns.
Impl
emen
tatio
n to
var
y in
st
ates
and
terr
itorie
s.55 JJuu
nnee 22
002200
WA
and
NT
com
men
ce
step
3 e
asin
g of
re
stric
tions
66 JJuu
llyy 22
002200
Anno
unce
men
t th
at
NSW
–VI
C bo
rder
to
clos
e fr
om 8
July
a
Sour
ce: N
NDS
S. D
ue to
repo
rting
del
ays,
inte
rpre
t the
late
st d
ays’
new
case
s with
cauti
on.
18 of 31 health.gov.au/cdiCommun Dis Intell (2018) 2020;44(https://doi.org/10.33321/cdi.2020.44.63) Epub 14/7/2020
International situation
On 5 July 2020, more than 216 countries, regions and areas had reported 11,125,245 COVID-19 cases and 528,204 deaths to the World Health Organization (WHO).25,26 All data is drawn from WHO unless otherwise specified. The Americas and Europe continue to be the epicentres of the pandemic with the former representing approximately 51% of cumulative cases and 50% of cumulative deaths, and the latter representing 25% of cases and 38% of deaths. The global case fatality rate (CFR) is approximately 4.7%. The global cumulative rates are 144.8 cases and 6.9 deaths per 100,000 population.
• By country, the largest numbers of cases are from: the United States of America (2,776,000); Brazil (1,539,000); and the Rus-sian Federation (681,000).
• By country, the largest numbers of deaths are from: the United States of America (129,200); Brazil (63,200); and the United Kingdom (44,200).
In the previous fortnight, the largest numbers of cases have been reported by the Americas (59%) and the South East Asian (14%) regions, led predominantly by the United States of America, Brazil and India. The Russian Federation, South Africa and Mexico are also seeing strong growth in new cases, with each accounting for over 3% of the total cases reported globally in the previ-ous fortnight.
Western Pacific Region
To date, the Western Pacific Region is the least affected in the globe, reporting the lowest number of COVID-19 cases and deaths. The cumulative number of cases in the region stands at approximately 224,000, with approximately 19,000 new cases reported in the previous fort-night (9.3% increase). This represents 0.8% of the global total number of new cases reported in the period. Cumulatively, the Western Pacific region accounts for 2.0% of all cases globally and 1.4% of all deaths. This region has so far reported a
cumulative rate of 11.8 cases per 100,000 people and a mortality rate of 0.4 deaths per 100,000 population, which is low when compared to the global rates.
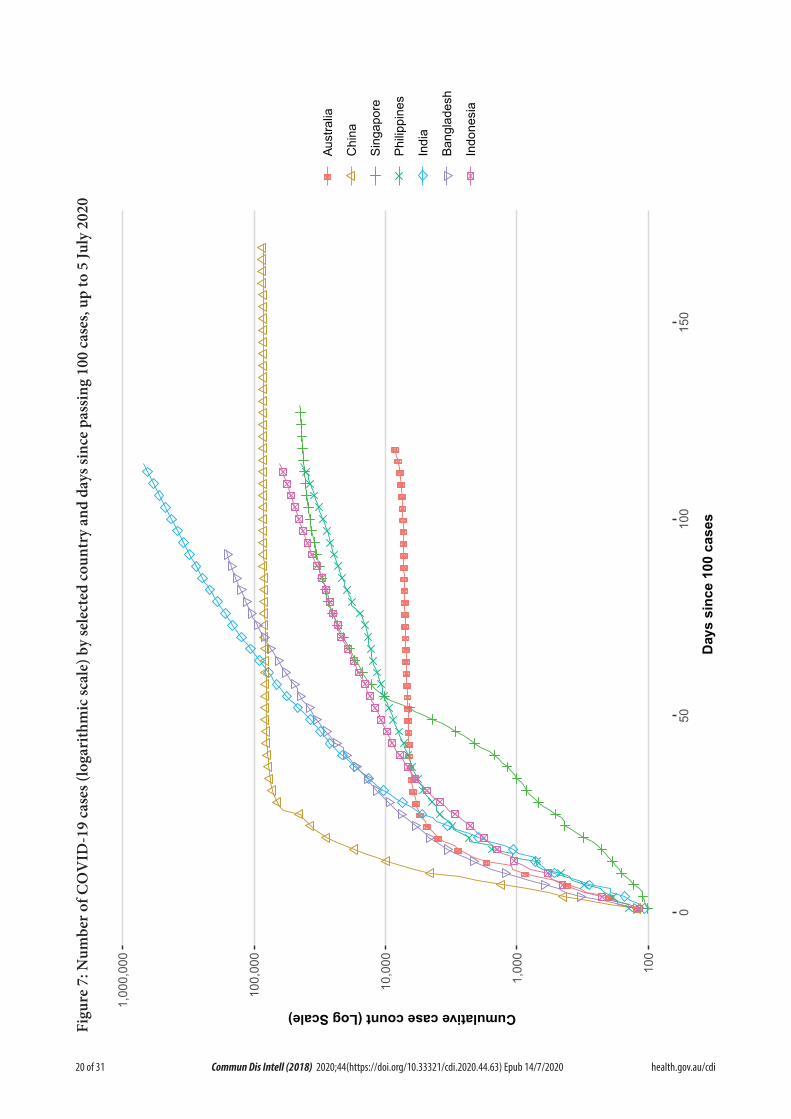
The majority of the cases in the region are observed in China, Singapore and the Philippines so far. However, in the past fortnight the greatest numbers of new cases have been observed in the Philippines (65%), Singapore (15%) and Japan (9%). Their epidemic trajectories are shown in Figure 7. There were four countries/territories that did not report any new cases in the previous fortnight (Brunei Darussalam, Fiji, Lao People’s Democratic Republic and New Caledonia).
In the past month, several countries in the region who have passed their initial peak are now attributing a large proportion of their new cases to clusters. According to Chinese media reports,27 an outbreak in a Beijing food market had resulted in 334 cases (since the initial case was reported on 11 June 2020), which is approxi-mately half of the cases reported to WHO dur-ing the same period. In Singapore, following an outbreak in migrant workers living in dormito-ries, there continues to be a high proportion of new cases in this population group.28 In Japan,29 the Republic of Korea30 and Australia, there has been a recent increase in the daily number of new cases which have involved a number of clusters.
South East Asia Region
In this fortnight the South East Asia region has seen a large growth in new case numbers. Cumulatively the region reports 919,000 cases and 24,400 deaths, with approximately 338,000 cases reported in the last fortnight (58% increase). Cumulatively, the region accounts for 8.2% of cumulative cases and 4.6% of cumulative deaths. Regionally the burden of disease is rela-tively low, compared to the global rates, at 46.0 cases and 1.2 deaths per 100,000 population.
The majority of the cases in the region are observed in India, Bangladesh and Indonesia, which also comprise the greatest proportion of
19 of 31 health.gov.au/cdi Commun Dis Intell (2018) 2020;44(https://doi.org/10.33321/cdi.2020.44.63) Epub 14/7/2020
new cases in the previous fortnight, at 78%, 15% and 5% respectively. Their epidemic trajecto-ries are shown in Figure 7. Nepal reported the greatest rise in case count, increasing by 80% over the reporting period. The Maldives is the most affected country in the region per capita, reporting 450 cases per 100,000 people. Only Timor-Leste did not report a case in the previ-ous fortnight.
Testing rates in the three highest-caseload countries in the region have improved over time. India has completed nearly 10 million tests, and has increased its testing to approxi-mately 223,000 samples per day over the past week.31 Cumulatively the positivity rate in India is approximately 7%, however in the last week, on average, the positivity was approximately 10% suggesting that the epidemic has not yet been controlled. Cumulatively Bangladesh has conducted approximately 750,000 tests, with 118,000 tests in the last week; the current posi-tivity rate is 22%.32
Data considerations
Data were extracted from the NNDSS on 7 July 2020 for notifications received up to 5 July 2020. Due to the dynamic nature of the NNDSS, numbers presented in this report are subject to revision and may vary from numbers previously reported and from case notifications released by states and territories.
Definitions
‘Date of illness onset’ is derived from data col-lected by the NNDSS and represents the diagno-sis date, or reported true onset of disease date. If unknown, the earliest of specimen collection date, notification date or notification receive date is used.
‘Notification received date’ is reported in the NNDSS and represents the date the case is first notified on the NNDSS. As notification can only occur after testing is completed and information processed, counts for a defined period will vary according to the date type used.
Acknowledgements
This report represents surveillance data reported through CDNA as part of the nationally-coordi-nated response to COVID-19. We thank public health staff from incident emergency operations centres in state and territory health departments, and the Australian Government Department of Health, along with state and territory public health laboratories.
Author details
Corresponding author
COVID-19 National Incident Room Surveillance Team, Australian Government Department of Health, GPO Box 9484, MDP 14, Canberra, ACT 2601. Email: [email protected]
20 of 31 health.gov.au/cdiCommun Dis Intell (2018) 2020;44(https://doi.org/10.33321/cdi.2020.44.63) Epub 14/7/2020
Figu
re 7
: Num
ber o
f CO
VID
-19
case
s (lo
gari
thm
ic sc
ale)
by
sele
cted
coun
try
and
days
sinc
e pa
ssin
g 10
0 ca
ses,
up to
5 Ju
ly 2
020
100
1,00
0
10,0
00
100,
000
1,00
0,00
0
050
100
150
Day
s si
nce
100
case
s
Cumulative case count (Log Scale)
Aust
ralia
Chi
na
Sing
apor
e
Philip
pine
s
Indi
a
Bang
lade
sh
Indo
nesi
a
21 of 31 health.gov.au/cdi Commun Dis Intell (2018) 2020;44(https://doi.org/10.33321/cdi.2020.44.63) Epub 14/7/2020
References
1. Australian Government Department of Health. Australian Health Protection Prin-cipal Committee (AHPPC) statement on recent outbreaks of COVID-19 in Victoria. [Internet.] Canberra: Australian Govern-ment Department of Health; 21 June 2020. [Accessed on 24 June 2020.] Available from: https://www.health.gov.au/news/australian-health-protection-principal-committee-ahp-pc-statement-on-recent-outbreaks-of-covid-19-in-victoria.
2. Public Health Agency of Canada (PHAC). Coronavirus disease 2019 (COVID-19). Epidemiology update. Updated: July 8, 2020, 7 pm EDT. [Internet.] Ottawa: Government of Canada, PHAC; 2020. [Accessed on 9 July 2020.] Available from: https://health-in-fobase.canada.ca/covid-19/epidemiological-summary-covid-19-cases.html.
3. European Centre for Disease Prevention and Control (ECDC). COVID-19 surveil-lance report: Week 26, 2020. [Internet.] Solna: ECDC; 4 July 2020. [Accessed on 9 July 2020.] Available from: https://covid19-surveillance-report.ecdc.europa.eu/.
4. Zheng Z, Peng F, Xu B, Zhao J, Liu H, Peng J et al. Risk factors of critical & mortal COV-ID-19 cases: a systematic literature review and meta-analysis. J Infect. 2020. doi: https://doi.org/10.1016/j.jinf.2020.04.021.
5. Onder G, Rezza G, Brusaferro S. Case-fatality rate and characteristics of patients dying in relation to COVID-19 in Italy. JAMA. 2020;323(18):1775-1776. doi: https://doi.org/10.1001/jama.2020.4683.
6. Statistics Canada. Table 13-10-0775-01. Detailed preliminary information on cases of COVID-19: 6 Dimensions (Aggregated data), Public Health Agency of Canada. [Internet.] Ottawa: Statistics Canada; 2020. [Accessed on 10 July 2020.] Available from: https://www150.statcan.gc.ca/t1/tbl1/en/tv.action?pid=1310077401.
7. Monash Health. FluCAN (Influenza surveil-lance): FluCAN (The Influenza Complica-tions Alert Network) [Internet.] Melbourne: Monash Health; 2020. Available from: https://monashhealth.org/services/monash-infectious-diseases/research/influenza-re-search/flucan-influenza-surveillance-2/.
8. COVID-19 National Incident Room Sur-veillance Team. COVID-19, Australia: Epidemiology Report 16: Reporting week ending 23:59 AEST 17 May 2020. Commun Dis Intell (2018). 2020;44. doi: https://doi.org/10.33321/cdi.2020.44.45.
9. Australian and New Zealand Intensive Care Society (ANZICS). SPRINT-SARI: Short period incidence study of severe acute res-piratory infection. [Internet.] Camberwell: ANZICS; 19 March 2020. [Accessed on 9 July 2020.] Available from: https://www.anzics.com.au/current-active-endorsed-research/sprint-sari/.
10. Centers for Disease Control and Prevention (CDC). COVID-Net: a weekly summary of U.S. COVID-19 hospitalization data. COV-ID-19 laboratory-confirmed hospitalizations: preliminary data as of May 23, 2020. [In-ternet.] Atlanta: United States Government Department of Health and Human Services, CDC; 2020. [Accessed on 3 June 2020.] Available from: https://gis.cdc.gov/grasp/COVIDNet/COVID19_5.html.
11. ECDC. COVID-19 surveillance report: Week 2020-19. 6: Other epidemiological characteristics. [Internet.] Solna: ECDC; 14 May 2020. [Accessed on 19 May 2020.] Available from: https://covid19-surveillance-report.ecdc.europa.eu/#6_other_epidemio-logical_characteristics.
12. Government of Canada. Epidemiological summary of COVID-19 cases in Canada: last data update May 19, 2020, 11:00 ET. [Inter-net.] Ottawa: Government of Canada; 2020. [Accessed on 19 May 2020.] Available from: https://health-infobase.canada.ca/covid-19/
22 of 31 health.gov.au/cdiCommun Dis Intell (2018) 2020;44(https://doi.org/10.33321/cdi.2020.44.63) Epub 14/7/2020
epidemiological-summary-covid-19-cases.html.
13. Australian Government Department of Health. Coronavirus (COVID-19) advice for the health and aged care sector. [Internet.] Canberra: Australian Government Depart-ment of Health; 2020. [Accessed 3 June 2020.] Available from: https://www.health.gov.au/news/health-alerts/novel-coronavi-rus-2019-ncov-health-alert/coronavirus-covid-19-advice-for-the-health-and-aged-care-sector.
14. Communicable Diseases Network Australia (CDNA). Coronavirus disease 2019 (COV-ID-19) outbreaks in residential care facilities: CDNA national guidelines for the preven-tion, control and public health management of COVID-19 outbreaks in residential care facilities in Australia. Canberra: Australian Government Department of Health, CDNA; 13 March 2020. [Accessed on 3 June 2020.] Available from: https://www.health.gov.au/sites/default/files/documents/2020/03/coro-navirus-covid-19-guidelines-for-outbreaks-in-residential-care-facilities.pdf.
15. Government of New South Wales. What you can and can’t do under the rules: visiting family and friends at home. [Internet.] Syd-ney: Government of New South Wales; 2020. [Accessed on 7 July 2020.] Available from: https://www.nsw.gov.au/covid-19/what-you-can-and-cant-do-under-rules#visiting-fami-ly-and-friends-at-home.
16. Government of New South Wales: NSW Health. Stay COVID-19 safe as restrictions eased. [Internet.] Sydney: Government of New South Wales, Minister for Health; 1 July 2020. [Accessed on 7 July 2020.] Avail-able from: https://www.nsw.gov.au/covid-19/latest-news-and-updates.
17. Department of Health and Human Services (DHHS). Victoria’s restriction levels. [Inter-net.] Melbourne: Victoria State Government, DHHS; 2020. [Accessed on 7 July 2020.]
Available from: https://www.dhhs.vic.gov.au/victorias-restriction-levels-covid-19.
18. Queensland Government. Roadmap to easing restrictions. [Internet.] Brisbane: Queensland Government; 2020. [Accessed on 7 July 2020.] Available from: https://www.covid19.qld.gov.au/government-actions/roadmap-to-easing-queenslands-restrictions.
19. Government of Western Australia. COV-ID-19 coronavirus: WA Roadmap. Phase 4. [Internet.] Perth: Government of Western Australia; 2020. [Accessed on 23 June 2020.] Available from: https://www.wa.gov.au/organisation/department-of-the-premier-and-cabinet/covid-19-coronavirus-wa-roadmap#phase4.
20. Government of South Australia. Recovery from COVID-19. [Internet.] Adelaide: Gov-ernment of South Australia; 2020. [Accessed on 22 June 2020.] Available from: https://www.covid-19.sa.gov.au/recovery.
21. Government of South Australia. South Australian roadmap for easing COV-ID-19 restrictions. Adelaide: Govern-ment of South Australia; 2020. [Accessed on 22 June 2020.] Available from: https://www.covid-19.sa.gov.au/__data/assets/pdf_file/0012/195879/200059.4-COVID-19-RoadMap-19June-V7.pdf.
22. Tasmanian Government. Roadmap to recov-ery. [Internet.] Hobart: Tasmanian Govern-ment; 2020. [Accessed on 7 July 2020.] Avail-able from: https://coronavirus.tas.gov.au/families-community/roadmap-to-recovery.
23. Australian Capital Territory Government. Canberra’s recovery plan: COVID-19 easing of restrictions roadmap as at 12 June 2020. Canberra: Australian Capital Territory Gov-ernment; 2020. [Accessed on 7 July 2020.] https://www.covid19.act.gov.au/__data/as-sets/pdf_file/0009/1558701/COVID-19-Eas-ing-of-Restrictions-Roadmap-Release-2.0-12-June-2020.pdf.
23 of 31 health.gov.au/cdi Commun Dis Intell (2018) 2020;44(https://doi.org/10.33321/cdi.2020.44.63) Epub 14/7/2020
24. Northern Territory Government. Roadmap to the new normal. Stage 3 – Friday 5 June (current). [Internet.] Darwin: Northern Territory Government; 2020. [Accessed on 22 June 2020.] Available from: https://coro-navirus.nt.gov.au/roadmap-new-normal#/stage_3_friday_5_june_current.
25. World Health Organization (WHO). Coronavirus disease 2019 (COVID-19) situation report – 167. [Internet.] Geneva: WHO; 2020. [Accessed on 6 July 2020.] Available from: https://www.who.int/docs/default-source/coronaviruse/situation-reports/20200705-covid-19-sitrep-167.pdf.
26. WHO. WHO Coronavirus Disease (COV-ID-19) dashboard. [Internet.] Geneva: WHO; 5 July 2020. [Accessed on 6 July 2020.] Avail-able from: https://covid19.who.int/.
27. Liu C, Zhao Y. Beijing reports single-digit cases for 8 consecutive days, eyes zero this week. [Internet.] Beijing: Global Times; 6 July 2020. [Accessed on 6 July 2020.] Avail-able from: https://www.globaltimes.cn/con-tent/1193614.shtml.
28. Singapore Government Ministry of Health. 5 July 2020 Daily Report on COVID-19. Singapore Government Ministry of Health; 2020. [Accessed on 6 July 2020.] Available from: https://www.moh.gov.sg/docs/librar-iesprovider5/local-situation-report/situation-report---5-jul-2020.pdf.
29. Kim CR. Office cluster pushes Tokyo coro-navirus cases to one-and-half-month high, governor says. [Internet.] London: Reuters; 24 June 2020. [Accessed on 6 July 2020.] Available from: https://www.reuters.com/article/us-health-coronavirus-japan/office-cluster-pushes-tokyo-coronavirus-cases-to-one-and-half-month-high-governor-says-idUSKBN23V0I9.
30. Ministry of Health and Welfare. Situation report 4 July 2020. Sejong: Republic of Korea, Ministry of Health and Welfare; 2020. [Ac-
cessed on 6 July 2020.] Available from: http://ncov.mohw.go.kr/upload/viewer/skin/doc.html?fn=1593762642540_20200703165042.pdf&rs=/upload/viewer/result/202007/.
31. Roser M, Ritchie H, Ortiz-Ospina E, Hasell J. Statistics and research: Coronavirus pan-demic (COVID-19). [Website.] Oxford: Our World in Data; 2020. [Accessed on 7 July 2020.] https://ourworldindata.org/coronavi-rus.
32. WHO. COVID-19: 29 June 2020. Morbidity and Mortality Weekly Update (MMWU) #18. Bangladesh: WHO; 2020. [Accessed on 7 July 2020.] Available from: https://www.who.int/docs/default-source/searo/bangladesh/covid-19-who-bangladesh-situation-reports/who-covid-19-update-18-20200629.pdf.
33. WHO. Report of the WHO-China joint mission on coronavirus disease 2019 (COV-ID-19). [Internet.] Geneva: WHO; 2020. [Ac-cessed 1 Mar 2020.] Available from: https://www.who.int/docs/default-source/corona-viruse/who-china-joint-mission-on-covid-19-final-report.pdf.
34. Wölfel R, Corman VM, Guggemos W, Seil-maier M, Zange S, Müller MA et al. Virologi-cal assessment of hospitalized patients with COVID-2019. Nature. 2020. doi: https://doi.org/10.1038/s41586-020-2196-x.
35. Cheng HY, Jian SW, Liu DP, Ng TC, Huang WT, Lin HH. Contact tracing assessment of COVID-19 transmission dynamics in Taiwan and risk at different exposure periods before and after symptom onset. JAMA Intern Med. 2020. doi: https://doi.org/10.1001/jamain-ternmed.2020.2020.
36. Korea Centers for Disease Control and Prevention (KCDC). Division of risk as-sessment and international cooperation. Findings from investigation and analysis of re-positive cases. [Internet.] Cheongju: Government of South Korea, KCDC; 2020. [Accessed on 24 May 2020.] Available from:
24 of 31 health.gov.au/cdiCommun Dis Intell (2018) 2020;44(https://doi.org/10.33321/cdi.2020.44.63) Epub 14/7/2020
https://www.cdc.go.kr/board/board.es?mid=a30402000000&bid=0030&act=view&list_no=367267&nPage=1.
37. Zhu Y, Bloxham CJ, Hulme KD, Sinclair JE, Tong ZW, Steele LE et al. Children are unlikely to have been the primary source of household SARS-CoV-2 infections. medRxiv. 2020. doi: https://doi.org/10.1101/2020.03.26.20044826.
38. Gudbjartsson DF, Helgason A, Jonsson H, Magnusson OT, Melsted P, Norddahl GL et al. Spread of SARS-CoV-2 in the Icelandic population. N Engl J Med. 2020. doi: https://doi.org/10.1056/NEJMoa2006100.
39. ECDC. Rapid risk assessment: Paediatric inflammatory multisystem syndrome and SARS-CoV-2 infection in children – 15 May 2020. Solna: ECDC; 2020. [Accessed on 19 May 2020.] Available from: https://www.ecdc.europa.eu/sites/default/files/docu-ments/covid-19-risk-assessment-paediatric-inflammatory-multisystem-syndrome-15-May-2020.pdf.
40. WHO. Coronavirus disease 2019 (COV-ID-19) situation report – 29. [Internet.] Geneva: WHO; 2020. [Accessed 22 Feb 2020.] Available from: https://www.who.int/docs/default-source/coronaviruse/situation-reports/20200218-sitrep-29-covid-19.pdf.
41. 41 Pung R, Chiew CJ, Young BE, Chin S, Chen M, Clapham HE. Investigation of three clusters of COVID-19 in Singapore: implica-tions for surveillance and response measures. Lancet. 2020;395(10229):1039–46.
42. Rockett RJ, Arnott A, Lam C, Sadsad R, Timms V, Gray KA et al. Reveal-ing COVID-19 transmission by SARS-CoV-2 genome sequencing and agent based modelling. bioRxiv. doi: https://doi.org/10.1101/2020.04.19.048751.
43. Nextstrain team. Genomic epidemiology of novel coronavirus – Oceania-focused
subsampling. [Internet.] [Accessed on 5 May 2020.] Available online: https://next-strain.org/ncov/oceania?c=division&f_country=Australia&l=radial.
44. Seemann T, Lane C, Sherry N, Duchene S, Goncalves da Silva A, Caly L et al. Tracking the COVID-19 pandemic in Australia using genomics. medRxiv. 2020 doi: https://doi.org/10.1101/2020.05.12.20099929.
45. Sun P, Qiu S, Liu Z, Ren J, Xi JJ. Clinical characteristics of 50466 patients with 2019-nCoV infection. medRxiv. 2020. doi: https://doi.org/10.1101/2020.02.18.20024539.
46. Li B, Bai W, Hashikawa T. The neuroinvasive potential of SARS-CoV-2 may be at least par-tially responsible for the respiratory failure of COVID-19 patients. J Med Virol. 2020. doi: https://doi.org/10.1002/jmv.25728.
47. Mao L, Jin H, Wang M, Hu Y, Chen S, He Q et al. Neurological manifestations of hos-pitalized patients with coronavirus disease 2019 in Wuhan, China. JAMA Neurol. 2020;e201127. doi: https://doi.org/10.1001/jamaneurol.2020.1127.
48. Drew DA, Nguyen LH, Steves CJ, Wolf J, Spector TC, Chan AT. Rapid implementation of mobile technology for real-time epide-miology of COVID-19. medRxiv. 2020. doi: https://doi.org/10.1101/2020.04.02.20051334.
49. Venkatakrishnan AJ, Puranik A, Anand A, Zemmour D, Yao X, Wu X et al. Knowledge synthesis from 100 million biomedical documents augments the deep expression profiling of coronavirus re-ceptors. bioRxiv. 2020. doi: https://doi.org/10.1101/2020.03.24.005702.
50. Brann DH, Tsukahara T, Weinreb C, Lo-gan DW, Datta SR. Non-neural expres-sion of SARS-CoV-2 entry genes in the olfactory epithelium suggests mecha-nisms underlying anosmia in COVID-19 patients. bioRxiv. 2020. doi: https://doi.
25 of 31 health.gov.au/cdi Commun Dis Intell (2018) 2020;44(https://doi.org/10.33321/cdi.2020.44.63) Epub 14/7/2020
org/10.1101/2020.03.25.009084.
51. Inciardi RM, Lupi L, Zaccone G, Italia L, Raffo M, Tomasoni D et al. Cardiac in-volvement in a patient with coronavirus disease 2019 (COVID-19). JAMA Cardiol. 2020. doi: https://doi.org/10.1001/jamacar-dio.2020.1096.
52. Guo T, Fan Y, Chen M, Wu X, Zhang L, He T et al. Cardiovascular implications of fatal outcomes of patients with coronavirus disease 2019 (COVID-19). JAMA Cardiol. 2020. doi: https://doi.org/10.1001/jamacar-dio.2020.1017.
53. Madjid M, Safavi-Naeini P, Solomon SD, Vardeny O. Potential effects of coronaviruses on the cardiovascular system: a review. JAMA Cardiol. 2020. doi: https://doi.org/10.1001/jamacardio.2020.1286.
54. Riphagen S, Gomez X, Gonzalez-Martinez C, Wilkinson N, Theocharis P. Hyperinflam-matory shock in children during COVID-19 pandemic. Lancet. 2020. doi: https://doi.org/10.1016/S0140-6736(20)31094-1.
55. Morand A, Urbina D, Fabre A. COV-ID-19 and Kawasaki like disease: the known-known, the unknown-known and the unknown-unknown. Preprints. 2020;2020050160. doi: https://doi.org/10.20944/preprints202005.0160.v1.
56. WHO. Clinical management of severe acute respiratory infection when novel coronavirus (nCoV) infection is suspected. [Internet.] Geneva: WHO; 2020. [Accessed 23 Feb 2020.] Available from: https://www.who.int/publications-detail/clinical-management-of-severe-acute-respiratory-infection-when-novel-coronavirus-(ncov)-infection-is-sus-pected.
57. Harrison C. Coronavirus puts drug re-purposing on the fast track. Nat Biotechnol. 2020. doi: https://doi.org/10.1038/d41587-020-00003-1.
58. Wang M, Cao R, Zhang L, Yang X, Liu J, Xu M et al. Remdesivir and chloroquine ef-fectively inhibit the recently emerged novel coronavirus (2019-nCoV) in vitro. Cell Re-search. 2020;30;269–71.
59. Tang W, Cao Z, Han M, Wang Z, Chen W, Sun W et al. Hydroxychloroquine in patients with mainly mild to moderate coronavi-rus disease 2019: open label, randomised controlled trial. BMJ. 2020. doi: https://doi.org/10.1136/bmj.m1849.
60. Cao B, Wang Y, Wen D, Liu W, Wang J, Fan G et al. A trial of lopinavir–ritonavir in adults hospitalized with severe Covid-19. N Engl J Med. 2020;382:1787–99.
61. National Institute of Allergy and Infectious Diseases (NIAID). NIH Clinical Trial Shows Remdesivir Accelerates Recovery from Advanced COVID-19. [Internet.] Bethesda: Government of the United States of America, National Institutes of Heath, NIAID; 2020. [Accessed on 19 May 2020.] Available from: https://www.niaid.nih.gov/news-events/nih-clinical-trial-shows-remdesivir-accelerates-recovery-advanced-covid-19.
62. Wang Y, Zhang D, Du G, Du R, Zhao J, Jin Y et al. Remdesivir in adults with severe COVID-19: a randomised, double-blind, placebo-controlled, multicentre trial. Lancet. 2020;395(10236);1569–78.
63. University of Oxford. Low-cost dexametha-sone reduces death by up to one third in hospitalised patients with severe respiratory complications of COVID-19. [News release.] Oxford: University of Oxford; 16 June 2020. [Accessed on 24 June 2020.] Available from: https://www.recoverytrial.net/files/recovery_dexamethasone_statement_160620_final.pdf.
26 of 31 health.gov.au/cdiCommun Dis Intell (2018) 2020;44(https://doi.org/10.33321/cdi.2020.44.63) Epub 14/7/2020
Appendix A: Frequently asked questions
Q: Can I request access to the COVID-19 data behind your CDI fortnightly reports?
A: National notification data on COVID-19 con-firmed cases is collated in the National Notifiable Disease Surveillance System (NNDSS) based on notifications made to state and territory health authorities under the provisions of their relevant public health legislation.
Normally, requests for the release of data from the NNDSS requires agreement from states and territories via the Communicable Diseases Network Australia, and, depending on the sen-sitivity of the data sought and proposed, ethics approval may also be required.
Due to the COVID-19 response, unfortunately, specific requests for NNDSS data have been put on hold. We are currently looking into options to be able to respond to data requests in the near future.
We will continue to publish regular summaries and analyses of the NNDSS dataset and recom-mend the following resources be referred to in the meantime:
• NNDSS summary tables: http://www9.health.gov.au/cda/source/cda-index.cfm
• Daily case summary of cases: https://www.health.gov.au/news/health-alerts/novel-coronavirus-2019-ncov-health-alert/corona-virus-covid-19-current-situation-and-case-numbers
• Communicable Diseases Intelligence COV-ID-19 epidemiology report: https://www1.health.gov.au/internet/main/publishing.nsf/Content/novel_coronavirus_2019_ncov_weekly_epidemiology_reports_austral-ia_2020.htm
• State and territory public health websites.
Q: Why have the reports changed from weekly to fortnightly?
A: With the number of new cases in Australia slowing, this report has moved from a weekly to a fortnightly reporting schedule. The change to fortnightly reporting is to allow more time for an in-depth analysis of the NNDSS data, there-fore enhancing the contents of the report.
Q: Can I request access to data at post-code level of confirmed cases?
A: Data at this level cannot be released without ethics approval and permission would need to be sought from all states and territories via the Communicable Diseases Network Australia. As noted above, specific requests for NNDSS data are currently on hold.
Where current or recent reported case num-bers are high enough to justify it, a GIS/map-ping analysis of cases will be included in the Communicable Diseases Intelligence COVID-19 epidemiology report. In order to protect privacy of confirmed cases, data in this map will be pre-sented at SA3 level.
Q: Where can I find more detailed data on COVID-19 cases?
A: We are currently looking into ways to pro-vide more in-depth epidemiological analyses of COVID-19 cases, with regard to transmis-sion and severity, including hospitalisation. These analyses will continue to be built upon in future iterations of the Communicable Diseases Intelligence report.
27 of 31 health.gov.au/cdi Commun Dis Intell (2018) 2020;44(https://doi.org/10.33321/cdi.2020.44.63) Epub 14/7/2020
Appendix B: Supplementary figures and tables
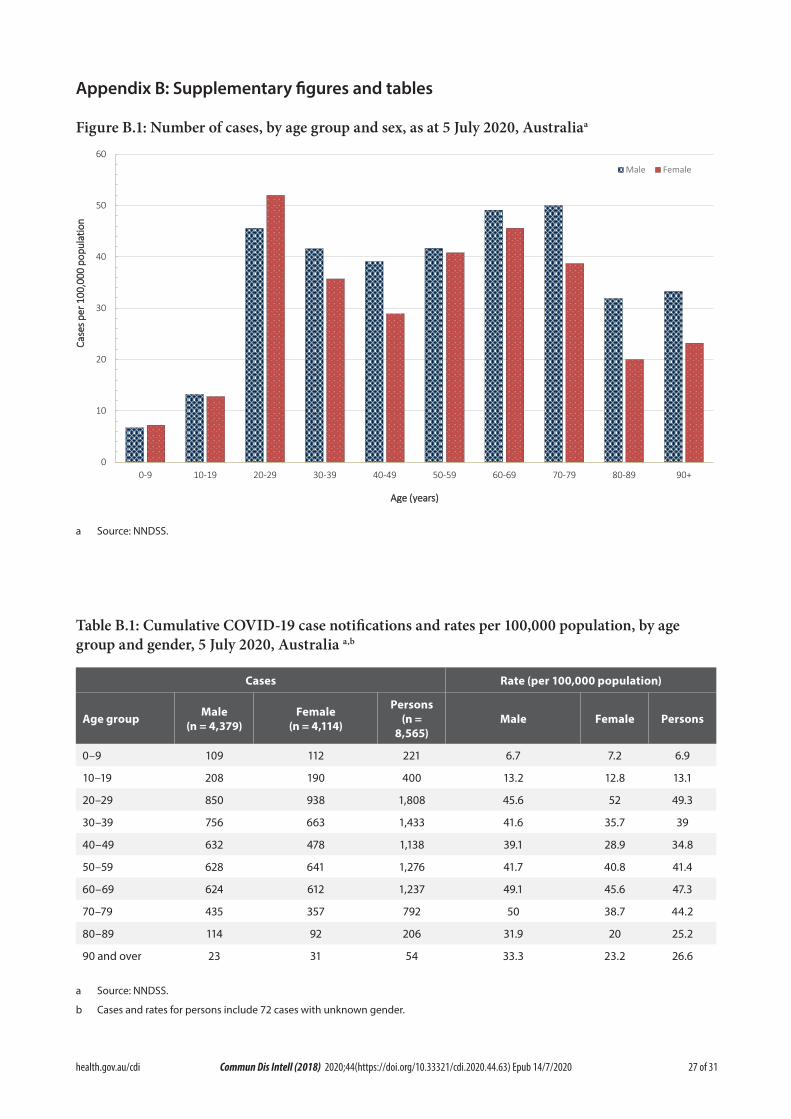
Figure B.1: Number of cases, by age group and sex, as at 5 July 2020, Australiaa
0
10
20
30
40
50
60
0-9 10-19 20-29 30-39 40-49 50-59 60-69 70-79 80-89 90+
CCaassee
ss ppeerr
110000
,,000000
ppoopp
uullaatt
iioonn
AAggee ((yyeeaarrss))
Male Female
a Source: NNDSS.
Table B.1: Cumulative COVID-19 case notifications and rates per 100,000 population, by age group and gender, 5 July 2020, Australia a,b
Cases Rate (per 100,000 population)
Age group Male(n = 4,379)
Female(n = 4,114)
Persons(n =
8,565)Male Female Persons
0–9 109 112 221 6.7 7.2 6.9
10–19 208 190 400 13.2 12.8 13.1
20–29 850 938 1,808 45.6 52 49.3
30–39 756 663 1,433 41.6 35.7 39
40–49 632 478 1,138 39.1 28.9 34.8
50–59 628 641 1,276 41.7 40.8 41.4
60–69 624 612 1,237 49.1 45.6 47.3
70–79 435 357 792 50 38.7 44.2
80–89 114 92 206 31.9 20 25.2
90 and over 23 31 54 33.3 23.2 26.6
a Source: NNDSS.
b Cases and rates for persons include 72 cases with unknown gender.
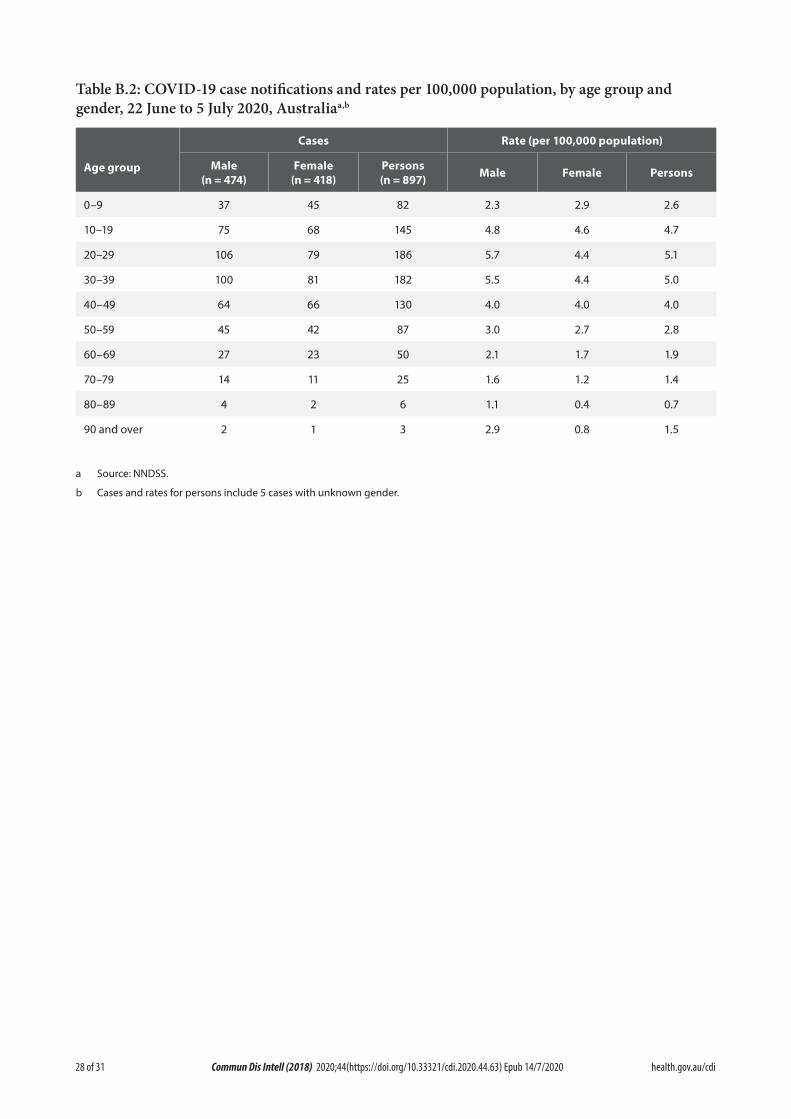
28 of 31 health.gov.au/cdiCommun Dis Intell (2018) 2020;44(https://doi.org/10.33321/cdi.2020.44.63) Epub 14/7/2020
Table B.2: COVID-19 case notifications and rates per 100,000 population, by age group and gender, 22 June to 5 July 2020, Australiaa,b
Age group
Cases Rate (per 100,000 population)
Male(n = 474)
Female(n = 418)
Persons(n = 897) Male Female Persons
0–9 37 45 82 2.3 2.9 2.6
10–19 75 68 145 4.8 4.6 4.7
20–29 106 79 186 5.7 4.4 5.1
30–39 100 81 182 5.5 4.4 5.0
40–49 64 66 130 4.0 4.0 4.0
50–59 45 42 87 3.0 2.7 2.8
60–69 27 23 50 2.1 1.7 1.9
70–79 14 11 25 1.6 1.2 1.4
80–89 4 2 6 1.1 0.4 0.7
90 and over 2 1 3 2.9 0.8 1.5
a Source: NNDSS.
b Cases and rates for persons include 5 cases with unknown gender.
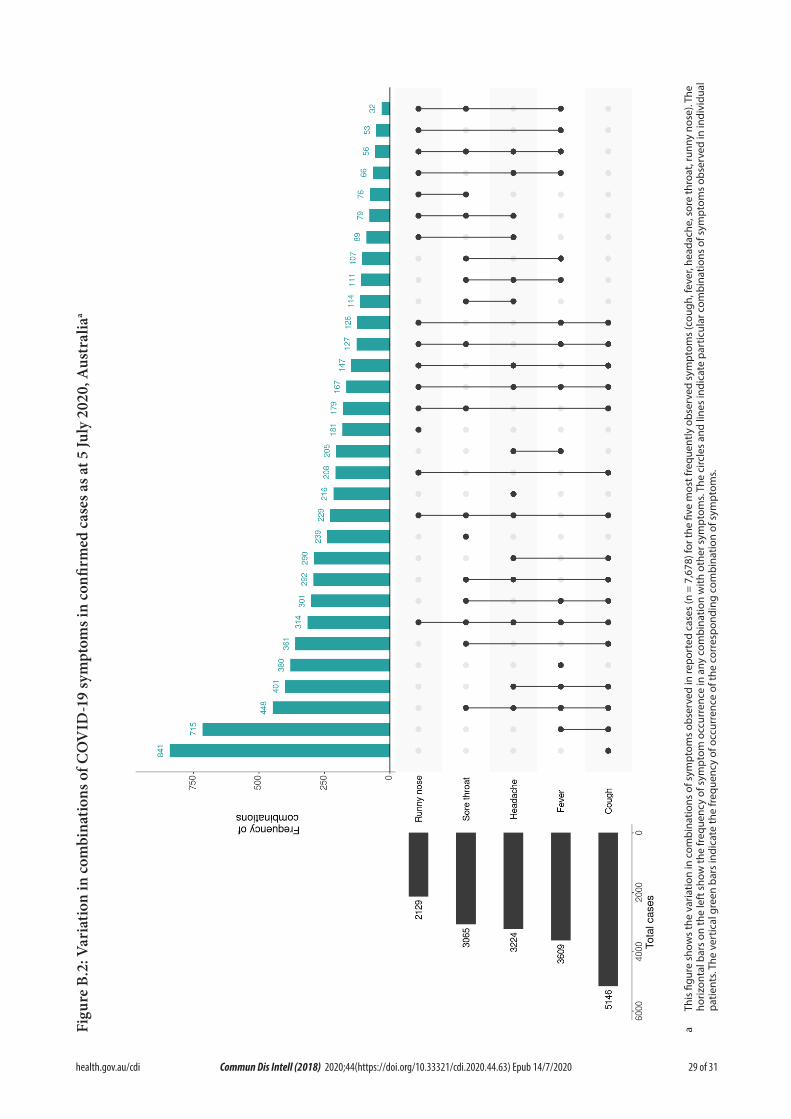
29 of 31 health.gov.au/cdi Commun Dis Intell (2018) 2020;44(https://doi.org/10.33321/cdi.2020.44.63) Epub 14/7/2020
Figu
re B
.2: V
aria
tion
in co
mbi
natio
ns o
f CO
VID
-19
sym
ptom
s in
confi
rmed
cas
es a
s at 5
July
202
0, A
ustr
alia
a
a Th
is fi
gure
sho
ws
the
varia
tion
in c
ombi
natio
ns o
f sym
ptom
s ob
serv
ed in
repo
rted
cas
es (n
= 7
,678
) for
the
five
mos
t fre
quen
tly o
bser
ved
sym
ptom
s (c
ough
, fev
er, h
eada
che,
sor
e th
roat
, run
ny n
ose)
. The
ho
rizon
tal b
ars
on th
e le
ft s
how
the
freq
uenc
y of
sym
ptom
occ
urre
nce
in a
ny c
ombi
natio
n w
ith o
ther
sym
ptom
s. Th
e ci
rcle
s an
d lin
es in
dica
te p
artic
ular
com
bina
tions
of s
ympt
oms
obse
rved
in in
divi
dual
pa
tient
s. Th
e ve
rtic
al g
reen
bar
s in
dica
te th
e fr
eque
ncy
of o
ccur
renc
e of
the
corr
espo
ndin
g co
mbi
natio
n of
sym
ptom
s.
30 of 31 health.gov.au/cdiCommun Dis Intell (2018) 2020;44(https://doi.org/10.33321/cdi.2020.44.63) Epub 14/7/2020
Appendix C: Background
The current estimates on epidemiological parameters including severity, transmissibility and incubation period are uncertain. Estimates are likely to change as more information becomes available.
Transmission
Human-to-human transmission of SARS-CoV-2 is via droplets and fomites from an infected person to a close contact.33 Several studies have detected that viral RNA levels peak in the first week of illness, suggesting transmission is most likely to occur early in the illness with infectivity gradually decreasing over time.34 In a Taiwanese study examining over 2,500 close contacts of 100 patients with COVID-19, all 22 secondary cases had their first exposure to the index case within six days of symptom onset. No infections were documented in the 850 contacts whose exposure was after six days.35
Viral RNA has been identified in respiratory track specimens 1–2 days prior to symptom onset, and has been observed after symptom cessation.34 In 50% of the patients, seroconver-sion occurred after seven days with a range of up to 14 days; this seroconversion was not followed by a rapid decline in viral load.34 However, the detection of viral RNA does not always correlate with transmission risk. A study of nine patients with mild COVID-19 infection found infectious virus was not able to be isolated from naso/oro-pharyngeal and sputum samples after the first 8 days of illness, despite continued high viral RNA levels.34 Recent analysis from the Korea Centres for Disease Control and Prevention of cases who tested positive after previously being cleared from isolation found live virus was unable to be cultured from any cases selected for testing (n = 108).36
Several studies suggests that children do not play a key role in transmission and are unlikely to be the primary source of infections.37 Studies out of the EU have suggested that child to adult transmission is uncommon.38,39
Current evidence does not support airborne or faecal-oral spread as major factors in transmis-sion.33
Incubation period
Estimates of median incubation period, based on seven published studies, are 5 to 6 days (ranging from 1 to 14 days). Patients with long incubation periods do occasionally occur; however, they are likely to be ‘outliers’ who should be studied fur-ther but who are unlikely to represent a change in epidemiology of the virus.40,41
Molecular epidemiology
Since December 2019, the virus has diversified into multiple lineages as it has spread globally, with some degree of geographical clustering. The whole genome sequences currently available from Australian cases are dispersed across these lineages, reflecting multiple concurrent intro-ductions into Australia.42–44 Multiple genomic clusters, closely related sequences reflecting local transmission chains, have also been identified in Australia.42,43 Genomic epidemiology has suc-cessfully been used to link many cases that were epidemiologically classified as ‘locally-acquired – contact not identified’ to known genomic clus-ters, highlighting the utility of virus sequencing to informing the public health response.42,43
Clinical features
COVID-19 presents as mild illness in the major-ity of cases, with cough and fever being the most commonly reported symptoms. Severe or fatal outcomes are more likely to occur in the elderly or those with comorbid conditions.33,45
Some COVID-19 patients show neurological signs such as headache, nausea and vomiting. There is evidence that SARS-CoV-2 viruses are not always confined to the respiratory tract and may invade the central nervous system inducing neurological symptoms. As such, it is possible that invasion of the central nervous system is partially responsible for the acute respiratory failure of COVID-19 patients.46
31 of 31 health.gov.au/cdi Commun Dis Intell (2018) 2020;44(https://doi.org/10.33321/cdi.2020.44.63) Epub 14/7/2020
There is some evidence to suggest that impair-ment or loss of the sense of smell (hyposmia/anosmia) or taste (hypoguesia/aguesia) is asso-ciated with COVID-19.47,48 This is supported by research finding a biological mechanism for the SARS-CoV-2 virus to cause olfactory dysfunc-tion.49,50
Several studies have identified cardiovascular implications resulting from COVID-19.51–53 Vascular inflammation has been observed in a number of cases and may be a potential mecha-nism for myocardial injury which can result in cardiac dysfunction and arrhythmias.
COVID-19 disease in children is more likely to be mild and self-limiting, compared to adults. Internationally, children make up a small pro-portion of confirmed COVID-19 cases, with those shown to be infected either presenting with milder symptoms than adults or remain-ing asymptomatic, a similar pattern has been observed with SARS and MERS. However, the greater likelihood of mild clinical presentation in children may result in lower testing and case detection in this cohort. Studies have also shown that hospital admission is inversely related to age. From European reporting, death associated with COVID-19 has been rare among those aged less than 15 years, with 4 deaths reported from 44,695 cases, as at 13 May 2020.39
There have been reports of a rare clinical presen-tation of paediatric inflammatory multisystem syndrome resembling Kawasaki disease tempo-rally associated with SARS-CoV-2 infection in children. However, evidence of the association between COVID-19 and the development of a Kawasaki like disease is currently inconclu-sive and further investigation is needed due to variability in clinical presentations in reported paediatric cases.54,55
Treatment
Current clinical management of COVID-19 cases focuses on early recognition, isolation, appropri-ate infection control measures and provision of supportive care.56 Whilst there is no specific
antiviral treatment currently recommended for patients with suspected or confirmed SARS-CoV-2 infection, multiple clinical trials are underway to evaluate a number of therapeutic agents, including remdesivir, lopinavir/ritona-vir, and chloroquine or hydroxychloroquine.57,58
An open-label randomised controlled trial did not find a significant impact of hydroxychlo-roquine treatment on disease progression for hospitalised patients with mild to moderate COVID-19, with those receiving treatment also reporting a higher number of adverse events.59
Similarly, an open-label randomised controlled trial of lopinavir/ritonavir among hospitalised patients found no benefit for time to clinical improvement.60
Results for remdesivir treatment have been mixed, with one randomised double-blind placebo-controlled trial finding patients recov-ered 31% faster and there was a lower mortality rate (8.0% compared with 11.6% among placebo patients),61 while another found no effect.62 Taiwan Food and Drug Administration (TFDA) has recently approved remdesivir for the treat-ment of patients with severe SARS-CoV-2 infec-tion based on preliminary evidence on its safety and effectiveness. Further trials are required to assess the effectiveness of these treatments on COVID-19. Multiple COVID-19 vaccines have commenced clinical trials.
Research from the UK has found dexamethasone could significantly reduce death in critically ill patients.63 Yet to be published, the preliminary findings announcing by Oxford University reported a 30% reduction in deaths for patients with severe respiratory symptoms. Reduced mortality was observed in ventilated cases and cases requiring oxygen support. No benefit was observed for mild to moderate cases.