Embed Size (px)
Citation preview

Luminesc
highly se
Departmen
jyunwu@n
cent Zn(II)
nsitive de
nt of Applie
ncnu.edu.tw
) coordina
etection o
Meng‐
ed Chemistr
w
Fig. S1 1H
Supporti
ation poly
f explosiv
‐Jung Tsai, C
y, National
H NMR spec
ing Inform
ymers as e
ve nitroaro
Chih‐Yu Li, a
Chi Nan Un
ctrum of NI‐
mation for
efficiently
omatics
and Jing‐Yu
niversity, Na
‐bpy‐34 in D
fluoresce
un Wu*
antou 545, T
DMSO‐d6.
ent sensor
Taiwan. E‐m
rs for
mail:
Electronic Supplementary Material (ESI) for CrystEngComm.This journal is © The Royal Society of Chemistry 2018

1
2
3
Fig. S2 XR
1
RPD patternns of 1‒3.

Fig.
Fig.
. S3 Coordin
. S4 Coordin
nation envir
nation envir
2
ronment aro
ronment aro
ound the Zn
ound the Zn
n(II) center i
n(II) center i
in 1.
in 2.

Fig. S5 Cry
a‐axis; (bot
ystal structu
ttom) highl
ure of 2: (to
ight of the l
p) view of t
layer‐to‐lay
3
the 3D H‐bo
yer H‐bondin
onded netw
ng interacti
work slight o
ons (black d
off the cryst
dash lines).
tallographic
c

Table S1. Im
D–H∙∙∙A
O6–H101
O5–H5A∙∙O9–H101
O8–H101O8–H101O9–H102O9–H103
a Symmet1+x, y, 1+
Fig.
mportant h
∙∙∙O8#1
∙∙O8#1 ∙∙∙O2#2
∙∙∙O11#1 ∙∙∙O15#1 ∙∙∙O3#2 ∙∙∙O6#2
try codes: F+z; #2, –x, 1–
. S6 Coordin
ydrogen bo
d(D–H)
0.82
0.84 0.81
0.83 0.83 0.90 0.83
For 1: #1, –x–y, –z.
nation envir
ond data for
[Å] d
2
2
x, 1–y, 1–z;
4
ronment aro
r 1–3a
d(H∙∙∙A) [Å]
1 1.86
2 1.90 2.29
3 1.66 2.57 1.92 1.93
For 2: #1, 1
ound the Zn
d(D∙
2.66
2.582.98
2.483.362.752.68
1–x, 1–y, 1–
n(II) center i
∙∙A) [Å]
60(2)
87(15) 84(12)
83(16) 6(2) 54(6) 82(6)
–z; #2, 1–x,
in 3.
∠(D–H∙
165
138 143
168 160 153 150
y, 1/2–z; F
∙∙A) [°]
or 3: #1, –

Fig. S7 T
5
TG diagram
s of 1–3.

6

Fig. S8 (Leconcentratpresence ofor Stern–V
eft) Fluoresctions of diof toluene sVolmer ana
cence respofferent nitsuspension lysis of 1 as
onses of 1 ro analyte.of 1 in the rs a function
7
in toluene . (Right) Strange from of concent
suspensiontern–Volme0 to 1.00 m
tration of ni
n (3.0 mg/3 er plot for mM. Inset shtro analyte
3 mL) towarnitro anal
hows the lin.
rd differentlyte in thenear region
t e n

8

Fig. S9 (Leconcentratpresence ofor Stern–V
eft) Fluoresctions of diof toluene sVolmer ana
cence respofferent nitsuspension lysis of 2 as
onses of 2 ro analyte.of 2 in the rs a function
9
in toluene . (Right) Strange from of concent
suspensiontern–Volme0 to 1.00 m
tration of ni
n (3.0 mg/3 er plot for mM. Inset shtro analyte
3 mL) towarnitro anal
hows the lin.
rd differentlyte in thenear region
t e n

10

Fig. S10 (Lconcentratpresence ofor Stern–V
Left) Fluorestions of diof toluene sVolmer ana
scence respfferent nitsuspension lysis of 3 as
ponses of 3ro analyte.of 3 in the rs a function
11
in toluene . (Right) Strange from of concent
suspensiontern–Volme0 to 1.00 m
tration of ni
n (3.0 mg/3er plot for mM. Inset shtro analyte
3 mL) towarnitro anal
hows the lin.
rd differentlyte in thenear region
t e n

Fig. S11 (a–
concentrat
–c) Fluoresc
tions (0–1.0
cence quen
00 mM) for t
(a)
(c)
(b)
ching perce
the toluene
12
entage of va
e suspensio
arious nitro
ns of CPs 1–
analytes at
–3.
t different

Fig. S12 N
fluorescen
Normalized
ce emission
UV‐Vis sp
n spectra of
pectra of t
f toluene su
13
toluene so
uspensions o
olutions of
of CPs 1–3.
nitro anal
lytes and normalizedd
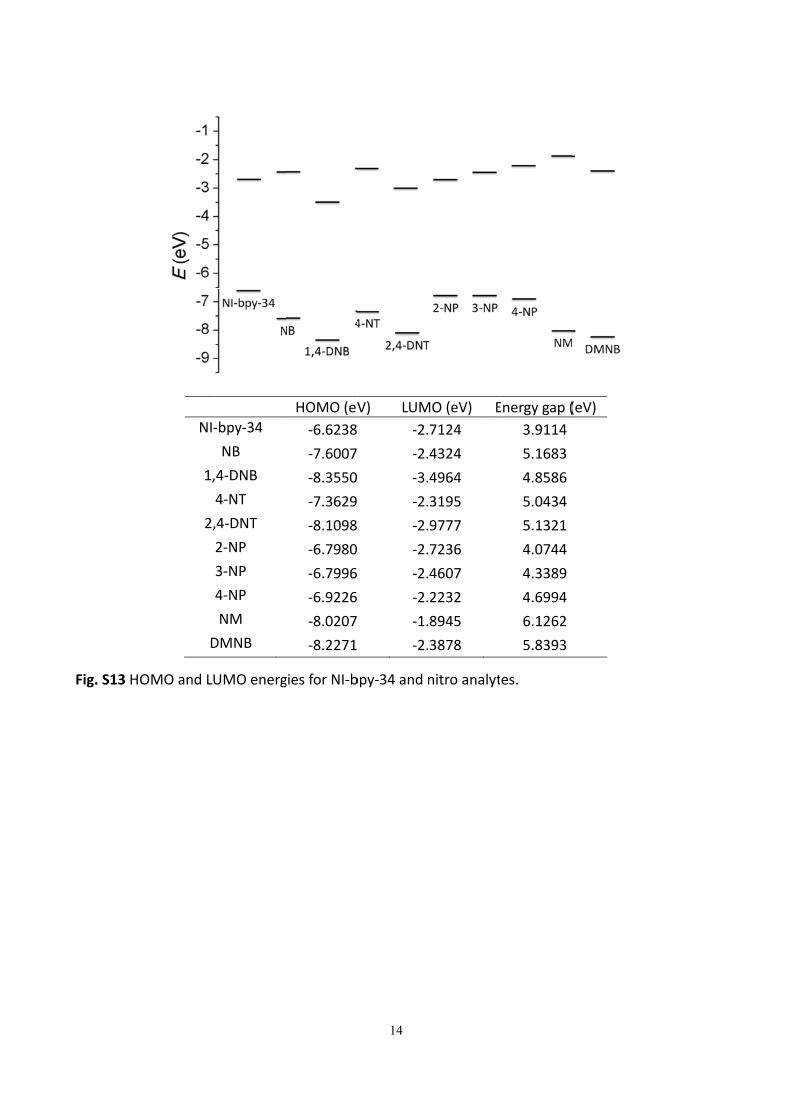
Fig. S13 HO
NI‐
1,
2,
D
OMO and LU
‐bpy‐34
NB
,4‐DNB
4‐NT
,4‐DNT
2‐NP
3‐NP
4‐NP
NM
DMNB
UMO energ
HOMO (eV
‐6.6238
‐7.6007
‐8.3550
‐7.3629
‐8.1098
‐6.7980
‐6.7996
‐6.9226
‐8.0207
‐8.2271
gies for NI‐b
14
V) LUM
‐2.
‐2.
‐3.
‐2.
‐2.
‐2.
‐2.
‐2.
‐1.
‐2.
bpy‐34 and n
MO (eV) E
7124
4324
4964
3195
9777
7236
4607
2232
8945
3878
nitro analyt
Energy gap (
3.9114
5.1683
4.8586
5.0434
5.1321
4.0744
4.3389
4.6994
6.1262
5.8393
es.
(eV)

Measurem
LOD meas
responses
analytes (1
3σ/m, whe
CPs 1–3 an
Blank
readings
#1
#2
#3
#4
#5
#6
#7
#8
#9
#10
Standard
deviation (σ
Slope (m)
R2
LOD (3σ/mμM (ppm)
Fig. S14 Lin
addition of
parameter
414 nm, λe
ments of lim
surements
of CPs 1–3
10−100 μM
ere σ = stan
nd m = slope
NB
111.8
112.0
112.1
111.5
111.8
111.6
111.1
111.4
112.0
111.3
σ)
0.3340
) 0.3036
0.999
m), )
3.30 (0.41)
near region
f nitro analy
rs of LOD of
ex = 280 nm
mit of detect
were perf
(3 mg disp
) in toluene
ndard deviat
e of the line
1,4‐DNB
112.0
111.2
112.1
111.9
112.2
111.7
112.3
112.3
111.9
112.6
0.3853
0.1368
0.980
8.45 (1.42)
n of fluoresc
ytes in the r
f the toluen
.
tion (LOD).
formed at
ersed in 3 m
e were reco
tion from te
ear curve pl
4‐NT 2
111.4
111.4
110.6
111.6
111.7
111.3
111.4
111.5
110.9
110.4
0.4367
0.1131 0
0.996
11.58 (1.59)
cence inten
range from
ne suspensio
15
low conce
mL of tolue
orded. LOD
en blank m
otted at low
Nitro
2,4‐DNT 2
110.9 1
110.9 1
110.1 1
110.7 1
111.1 1
110.5 1
110.5 1
110.7 1
111.4 1
110.3 1
0.3843 0.
0.09700 0.
0.991 0
11.89 (2.16)
1(1
nsity for the
10 μM to 1
on of 1 tow
entrations
ne) toward
was determ
easuremen
wer concen
o analyte
2‐NP 3‐N
112.7 112
112.5 113
113.7 112
112.8 112
112.6 113
112.4 112
113.3 112
113.1 112
113.1 113
113.3 112
.4170 0.38
.1089 0.10
0.983 0.9
11.49 1.60)
10.(1.4
e toluene su
100 μM. The
ward various
of nitro an
different c
mined using
ts for the to
tration for L
NP 4‐NP
2.7 112.5
3.2 113.2
2.7 112.7
2.2 112.0
3.4 113.0
2.3 112.4
2.6 111.8
2.6 113.1
3.1 112.9
2.8 113.1
806 0.485
086 0.109
992 0.983
52 46)
13.25(1.84
uspension o
e following
s nitro analy
nalytes. Flu
concentratio
g the equat
oluene susp
LOD measu
P NM
5 115.4
2 115.0
7 114.9
0 115.1
0 113.8
4 114.5
8 114.5
1 114.4
9 114.7
1 114.5
55 0.4467
99 0.01614
3 0.973
5 4)
83.03 (5.07)
of 1 upon i
table lists t
ytes. Condit
uorescence
ons of nitro
tion: LOD =
pensions of
urements.
DMNB
113.6
114.0
113.8
113.9
113.6
113.4
113.6
113.3
114.8
113.4
0.4351
4 0.02329
0.981
56.05 (9.87)
ncremental
he relevant
tions: λem =
e
o
=
f
l
t
=

Blank
readings
#1
#2
#3
#4
#5
#6
#7
#8
#9
#10
Standard
deviation (σ
Slope (m)
R2
LOD (3σ/m
μM (ppm)
Fig. S15 Lin
addition of
parameter
466 nm, λe
NB
366.6
365.5
364.4
363.7
364.4
365.4
366.9
364.3
364.2
362.4
σ)
1.350
) 1.0526
0.994
m),
) 3.85 (0.47)
near region
f nitro analy
rs of LOD of
ex = 280 nm
1,4‐DNB
363.0
362.3
360.9
358.4
363.8
363.6
364.3
361.5
360.5
361.6
1.795
0.7036
0.988
7.65 (1.29)
n of fluoresc
ytes in the r
f the toluen
.
4‐NT 2
369.6
367.6
370.2
370.8
369.7
367.2
368.0
368.0
367.7
369.7
1.277
1.1466
0.971
3.34 (0.46)
cence inten
range from
ne suspensio
16
Nitro
2,4‐DNT 2
364.2 3
364.2 3
360.5 3
360.0 3
358.9 3
363.5 3
359.8 3
361.5 3
361.6 3
364.8 3
2.129 1
1.1083 1.
0.981 0
5.76 (1.05)
3(0
nsity for the
10 μM to 1
on of 2 tow
o analyte
2‐NP 3‐N
363.3 385
362.1 387
362.4 387
364.6 386
361.1 384
364.2 382
360.2 383
362.7 383
363.6 387
362.1 386
1.358 1.9
.0819 2.40
0.996 0.9
3.77 0.52)
2.4(0.3
e toluene su
100 μM. The
ward various
NP 4‐NP
5.7 375.4
7.9 377.3
7.3 378.0
6.4 374.7
4.2 375.6
2.1 375.1
3.6 374.5
3.6 376.5
7.5 376.1
6.5 375.1
981 1.142
082 1.177
972 0.998
47 34)
2.91(0.40
uspension o
e following
s nitro analy
P NM
4 371.9
3 369.9
0 369.6
7 370.6
6 370.5
1 367.2
5 374.0
5 374.4
1 369.7
1 369.6
2 2.170
73 0.1160
8 0.975
1 0)
56.12 (3.43)
of 2 upon i
table lists t
ytes. Condit
DMNB
368.4
371.5
373.6
370.5
373.8
372.9
372.1
375.7
371.2
373.7
2.059
0.1313
0.964
47.06 (8.29)
ncremental
he relevant
tions: λem =
l
t
=

Blank
readings
#1
#2
#3
#4
#5
#6
#7
#8
#9
#10
Standard
deviation (σ
Slope (m)
R2
LOD (3σ/m
μM (ppm)
Fig. S16 Lin
addition of
parameter
434 nm, λe
NB
210.7
207.7
208.5
209.4
210.1
208.2
208.1
207.8
209.5
208.8
σ)
1.013
) 0.5908
0.999
m),
) 5.14 (0.63)
near region
f nitro analy
rs of LOD of
ex = 280 nm
1,4‐DNB
208.5
207.0
202.9
209.1
208.7
206.2
206.4
207.9
206.1
204.7
1.933
0.5872
0.999
9.88 (1.66)
n of fluoresc
ytes in the r
f the toluen
.
4‐NT 2
207.6
205.3
205.5
206.7
207.6
207.7
207.8
207.1
205.7
205.8
1.011
0.09400
0.979
32.27 (4.42)
cence inten
range from
ne suspensio
17
Nitro
2,4‐DNT 2
206.2 2
206.5 2
208.6 2
205.2 2
204.3 2
205.5 2
204.1 2
207.0 2
202.9 2
204.1 2
1.684 2
0.1946 0.
0.986 0
25.97 (4.73)
1(2
nsity for the
10 μM to 1
on of 3 tow
o analyte
2‐NP 3‐N
208.3 200
210.9 200
211.7 202
206.3 207
205.6 202
207.3 206
209.7 199
203.7 203
206.7 208
203.3 202
2.834 3.0
.5036 0.32
0.999 0.9
16.88 2.35)
28.(3.9
e toluene su
100 μM. The
ward various
NP 4‐NP
0.4 201.9
0.4 205.8
2.1 205.3
7.1 205.5
2.3 201.8
6.4 200.9
9.8 202.9
3.1 203.2
8.4 203.6
2.3 202.1
029 1.724
225 0.188
997 0.990
18 92)
27.43(3.82
uspension o
e following
s nitro analy
P NM
9 207.3
8 206.7
3 207.9
5 206.7
8 208.6
9 210.5
9 210.7
2 205.3
6 210.5
1 209.0
4 1.865
86 0.04436
0 0.952
3 2)
126.13 (7.70)
of 3 upon i
table lists t
ytes. Condit
DMNB
209.1
206.6
207.1
208.2
206.7
206.7
205.5
206.3
208.6
207.8
1.129
6 0.08791
0.989
38.53 (6.79)
ncremental
he relevant
tions: λem =
l
t
=

18
Table S2. Comparison of sensing performances toward NB among various CP/MOF sensors
CP/MOF‐based sensors Ksv, M–1 LOD, μM (ppm) Media Reference
[Zn2(1,4‐bdc)(1,4‐Hbdc)2(NI‐bpy‐34)2] (1) 3.63 × 10³ 3.30 (0.41) toluene This work
[Zn2(2,6‐ndc)(2,6‐Hndc)2(NI‐bpy‐34)2]∙H2O (2) 6.40 × 10³ 3.85 (0.47) toluene This work
[Zn(Hbtc)(NI‐bpy‐34)(H2O)]∙H2O (3) 3.91 × 10³ 5.14 (0.63) toluene This work
{[Zn(IPA)(L1)]}n 1.87 x 10³ N.A. H2O S1
{[Cd(IPA)(L1)]}n 1.36 x 10³ N.A. H2O S1
[Zn2(L2)(bpy)(H2O)2]∙(H2O)3(DMF)2 N.A. 40.6 (5) CH3CN S2
[Zn3(L3)2(L
4)] N.A. 406 (50) DMF S3
[NH2(CH3)2]2[Cd17(L5)12(μ3‐H2O)4(DMF)2(H2O)2]∙solvent N.A. 1.10 (0.135) DMF S4
[Eu(HL6)3(CH3OH)2]n 2.38 × 10⁴ 49 (6.03) CHCl3 S5
[Tb(HL6)3(CH3OH)(H2O)]n∙H2O 1.728 × 10⁴ 53 (6.52) CHCl3 S5
Abbreviations: NI‐bpy‐34 = N‐(pyridin‐3‐yl)‐4‐(pyridin‐4‐yl)‐1,8‐naphthalimide; 1,4‐H2bdc = benzene‐1,4‐dicarboxylic
acid; 2,6‐H2ndc = naphthalene‐2,6‐dicarboxylic acid; H3btc = benzene‐1,3,5‐tricarboxylic acid; H2IPA = isophthalic
acid; L1 = (E)‐N'‐(pyridin‐3‐ylmethylene)nicotinohydrazide; H4L2 = bis‐(3,5‐dicarboxyphenyl)terephthalamide; bpy =
4,4′‐bipyridine; H3L3 = 4‐[3‐(4‐carboxyphenoxy)‐2‐[(4‐carboxyphenoxy)methyl]‐2‐methyl‐propoxy]benzoic acid; L4 =
1,4‐bis(1‐imidazolyl)benzene; H3L5 = 2,4,6‐tris[1‐(3‐carboxylphenoxy)ylmethyl]mesitylene; H2L
6 =
3‐(picolinamido)benzoic acid.
References
(S1) B. Parmar, Y. Rachuri, K. K. Bisht, R. Laiya and E. Suresh, Inorg. Chem., 2017, 56, 2627–2638.
(S2) G.‐Y. Wang, L.‐L. Yang, Y. Li, H. Song, W.‐J. Ruan, Z. Chang and X.‐H. Bu, Dalton Trans., 2013, 42,
12865–12868.
(S3) M. Guo and Z.‐M. Sun, J. Mater. Chem., 2012, 22, 15939–15946.
(S4) D. Tian, Y. Li, R.‐Y. Chen, Z. Chang, G.‐Y. Wang and X.‐H. Bu, J. Mater. Chem. A, 2014, 2, 1465–
1470.
(S5) S. Srivastava, B. K. Gupta and R. Gupta, Cryst. Growth Des., 2017, 17, 3907−3916.

Fig. S17 ED
exchange p
Fig. S18 T
minutes, sh
DX spectrum
process for
Time‐depen
howing grad
m of the Cu2
approximat
dent optica
dual change
2+‐exchange
te 7 days.
al images o
e in crystal c
19
ed greenish
of 3 during
color and m
crystals of 3
g the Cu2+
maintenance
3 obtained f
ion exchan
e in crystal m
from a met
nge process
morphology
tal‐ion
s within 30
y.
0


![Supporting information 20170215 - rsc.org fileInjector temperature [°C] 100 100 100 100 Column](https://img.pdfslide.net/doc/110x75/5b946bf209d3f2df3f8cef83/supporting-information-20170215-rsc-temperature-c-100-100-100-100-column.jpg)