Embed Size (px)
Citation preview

PSuD P
CE
Ap
erforupplyData B
art II
EPT Univ
pril 2011
mancy and Book (
: City
versity
1
ce Ben Sanit(2008
Profi
nchmtation809)
iles (C
arkinn in Ma
Class C
ng of Uahara
C Citie
Urbanashtra
es)
n Watea:
er

Performance Benchmarking of Urban Water Supply
and Sanitation in Maharashtra: Data Book (2008‐09)
PART II: City Profiles (Class C Cities)
CEPT University
April 2011

PART II: City Profiles (Class C)
Page No.
Abbreviations i
Measurement Units & Symbols ii
Introduction: City Profiles iii
List of Class C Cities
Ahmadpur 1
Akkalkot 3
Alandi 5
Alibag 7
Ambad 9
Ashta 11
Ausa 13
Balapur 15
Bhagur 17
Bhokar 19
Bhokardan 21
Bhoom 23
Bhor 25
Biloli 27
Brahmapuri 29
Chandur Bazar 31
Chandur Rly 33
Chikhaldara 35
Darwha 37
Daryapur 39
Desaiganj 41
Deulgaon Raja 43
Devlali Pravara 45
Dhamangaon Railway 47
Dharangaon 49
Dharmabad 51
Digras 53
Dudhani 55
Erandol 57
Faizpur 59
Gadhinglaj 61
Gangapur 63
Georai 65
Ghatanji 67
Hadgaon 69
Igatpuri 71
Indapur 73

List of Class C Cities Page No.
Jalgaon (Jamod) 75
Jamner 77
Jawhar 79
Jejuri 81
Jintur 83
Junnar 85
Kagal 87
Kalamb 89
Kalamnuri 91
Kalmeshwar 93
Kandhar 95
Kannad 97
Karjat 99
Karmala 101
Katol 103
Khapa 105
Khed 107
Khuldabad 109
Kille Dharur 111
Kinwat 113
Kundalwadi 115
Kurduvadi 117
Kurundvad 119
Loha 121
Lonar 123
Mahabaleshwar 125
Mahad 127
Maindargi 129
Malkapur 131
Malwan 133
Mangalvedhe 135
Mangrulpir 137
Manwath 139
Matheran 141
Mehkar 143
Mhaswad 145
Mohpa 147
Mool 149
Morshi 151
Mowad 153
Mudkhed 155
Mukhed 157
Murgud 159
Murtijapur 161
Murud 163
Murum 165
Naldurg 167

List of Class C Cities Page No.
Nandgaon 169
Nandura 171
Narkhed 173
Nawapur 175
Nilanga 177
Paithan 179
Panchgani 181
Pandharkaoda 183
Panhala 185
Paranda 187
Parola 189
Partur 191
Pathardi 193
Pathri 195
Patur 197
Pauni 199
Pen 201
Pulgaon 203
Purna 205
Rahimatpur 207
Rahta Pimplas 209
Rahuri 211
Rajapur 213
Rajura 215
Ramtek 217
Raver 219
Risod 221
Roha 223
Sailu 225
Sangola 227
Sasvad 229
Satana 231
Savda 233
Sawantwadi 235
Sawner 237
Shahade 239
Shendurjana 241
Shirur 243
Shrigonda 245
Shrivardhan 247
Sindi 249
Sindkhed Raja 251
Sinnar 253
Sonpeth 255
Talode 257
Tasgaon 259
Telhara 261

List of Class C Cities Page No.
Tirora 263
Trimbak 265
Tuljapur 267
Umari 269
Umarkhed 271
Umerga 273
Uran 275
Vadgaon Kasba 277
Vaijapur 279
Vengurla 281
Wai 283
Warud 285
Yawal 287
Yevla 289

i
Abbreviations
Colln. Effi. Collection efficiency
Comm. Community
HH Household
Indiv. Individual
MSW Municipal solid waste
NRW Non‐revenue Water
Nos. Numbers
SW Solid waste
WS Water supply
WW Waste water

ii
Measurement Units & Symbols
km kilometer
km2 square kilometer
l/c/d or lpcd liters per capita per day
M meter
m3 cubic meter
m3/d cubic meter per day
m3/d/c cubic meter per day per capita
mm millimeter
n.a. not available or not applicable
% percent
ʹʹ inch
& and
Sq mi square mile
Sq km square kilometer
Rs/Kl Rupees per kilolitre

iii
Introduction: City Profiles
The urban local bodies (ULBs) in India have a huge databank about various day to day activities and
responsibilities that they carry out. Though, it is not always available in a way, which could effectively
communicate to city managers about service levels and its quality. Hence, quantification of services is not
done and fund allocations are made in an ad hoc manner.
As part of the initial activities under Performance Measurement, PAS Project has collected detailed
information from ULBs in two Gujarat and Maharashtra. All key indicators for assessment of urban water
supply and sanitation services in these two states have been compiled. Also compiled are the local action
indicators.
The following ‘City Reports’ have been designed to provide a snapshot of all the key performance indicators
on the four sectors of water supply, wastewater, solid waste management and storm water drainage. It also
captures certain context information to provide a better understanding and to set a background.

Ahmadpur Municipal Council Background
GENERAL INFORMATIONClass Class C No. of slum settlements 6
District Latur Slum population 0
Area (sq. km.) 26 Slum households 0
Total city population 45,000 Total annual city capital receipts (`) 0
Total households 7,251 Total annual city capital expenditure (`) 0
Density (persons per sq. km.) 1,738 Total annual city revenue receipts (`) 46,941,000
Total municipal staff 90 Total annual city revenue expenditure (`) 46,633,000
WATER SUPPLYTotal water produced (MLD) 2.8
Ground water (MLD) 0.0
Surface water (MLD) 2.8
Average daily volume treated (MLD) 2.8
Installed storage capacity (MLD) 1.5
Total water connections (nos.) 3,711.0
Water connections in slums (nos.) 0.0
Area covered by network (sq. km.) 17.0
No. of days of supply in a month 6.0
Annual revenue receipts from water (`) 46,941,000.0
Annual revenue expenditure on water (`) 18,546,550.0
Annual capital expenditure on water (`) 0.0
WASTE WATERArea covered by waste water network (sq. km.) 0.0
Underground sewerage network (sq. km) 0.0
Closed drains (sq. km) 0.0
Open drains (sq. km) 0.0
Total sewerage connections (nos.) 0.0
Sewerage coverage: slums (%) 0.0
Installed STP treatment capacity (MLD) 0.0
Annual revenue receipts from WW (`) 0.0
Annual revenue expenditure on WW (`) 0.0
Annual capital expenditure on WW (`) 0.0
SOLID WASTE MANAGEMENTWaste generated (TPD) 10.0
Waste collected (TPD) 10.0
Quantity of waste treated (TPD) 0.0
Waste received at scientific landfill (TPD) 0.0
Door to door colln.(no. of households andestablishments)
1,509.0
Waste segregation at source (Y/N) N
Annual revenue receipts from SW (`) 0.0
Annual revenue expenditure on SW (`) 0.0
Annual capital expenditure on SW (`) 0.0
1
Ahmadpur Municipal Council
Service Level Benchmark Indicators
WATER SUPPLY
WASTE WATER
SOLID WASTE MANAGEMENT STORM WATER
Blank values represent 'zero', 'not applicable' or 'no data' in the charts above.
2

Akkalkot Municipal Council Background
GENERAL INFORMATIONClass Class C No. of slum settlements 8
District Solapur Slum population 6,942
Area (sq. km.) 4 Slum households 1,106
Total city population 44,336 Total annual city capital receipts (`) 53,251,190
Total households 7,684 Total annual city capital expenditure (`) 26,213,268
Density (persons per sq. km.) 10,076 Total annual city revenue receipts (`) 39,231,803
Total municipal staff 129 Total annual city revenue expenditure (`) 35,138,786
WATER SUPPLYTotal water produced (MLD) 4.6
Ground water (MLD) 0.1
Surface water (MLD) 4.5
Average daily volume treated (MLD) 4.2
Installed storage capacity (MLD) 2.6
Total water connections (nos.) 3,710.0
Water connections in slums (nos.) 628.0
Area covered by network (sq. km.) 4.4
No. of days of supply in a month 15.0
Annual revenue receipts from water (`) 4,787,063.0
Annual revenue expenditure on water (`) 8,911,193.0
Annual capital expenditure on water (`) 6,114,582.0
WASTE WATERArea covered by waste water network (sq. km.) 4.4
Underground sewerage network (sq. km) 0.0
Closed drains (sq. km) 0.0
Open drains (sq. km) 4.4
Total sewerage connections (nos.) 0.0
Sewerage coverage: slums (%) 0.0
Installed STP treatment capacity (MLD) 0.0
Annual revenue receipts from WW (`) 0.0
Annual revenue expenditure on WW (`) 505,903.0
Annual capital expenditure on WW (`) 0.0
SOLID WASTE MANAGEMENTWaste generated (TPD) 15.0
Waste collected (TPD) 11.0
Quantity of waste treated (TPD) 0.0
Waste received at scientific landfill (TPD) 0.0
Door to door colln.(no. of households andestablishments)
2,020.0
Waste segregation at source (Y/N) N
Annual revenue receipts from SW (`) 30,220.0
Annual revenue expenditure on SW (`) 142,887.0
Annual capital expenditure on SW (`) 0.0
3

Akkalkot Municipal Council
Service Level Benchmark Indicators
WATER SUPPLY
WASTE WATER
SOLID WASTE MANAGEMENT STORM WATER
Blank values represent 'zero', 'not applicable' or 'no data' in the charts above.
4

Alandi Municipal Council Background
GENERAL INFORMATIONClass Class C No. of slum settlements 5
District Pune Slum population 979
Area (sq. km.) 3 Slum households 246
Total city population 23,713 Total annual city capital receipts (`) 25,490,000
Total households 5,392 Total annual city capital expenditure (`) 957,980
Density (persons per sq. km.) 8,783 Total annual city revenue receipts (`) 35,079,288
Total municipal staff 27 Total annual city revenue expenditure (`) 11,160,462
WATER SUPPLYTotal water produced (MLD) 5.0
Ground water (MLD) 1.0
Surface water (MLD) 4.0
Average daily volume treated (MLD) 2.5
Installed storage capacity (MLD) 2.2
Total water connections (nos.) 2,968.0
Water connections in slums (nos.) 3.0
Area covered by network (sq. km.) 3.0
No. of days of supply in a month 30.0
Annual revenue receipts from water (`) 4,067,000.0
Annual revenue expenditure on water (`) 4,170,346.0
Annual capital expenditure on water (`) 324,005.0
WASTE WATERArea covered by waste water network (sq. km.) 1.6
Underground sewerage network (sq. km) 0.0
Closed drains (sq. km) 1.1
Open drains (sq. km) 0.5
Total sewerage connections (nos.) 0.0
Sewerage coverage: slums (%) 0.0
Installed STP treatment capacity (MLD) 0.0
Annual revenue receipts from WW (`) 396,398.0
Annual revenue expenditure on WW (`) 1,015,437.0
Annual capital expenditure on WW (`) 603,262.0
SOLID WASTE MANAGEMENTWaste generated (TPD) 7.5
Waste collected (TPD) 5.3
Quantity of waste treated (TPD) 0.0
Waste received at scientific landfill (TPD) 0.0
Door to door colln.(no. of households andestablishments)
3,435.0
Waste segregation at source (Y/N) N
Annual revenue receipts from SW (`) 0.0
Annual revenue expenditure on SW (`) 1,225,770.0
Annual capital expenditure on SW (`) 30,713.0
5

Alandi Municipal Council
Service Level Benchmark Indicators
WATER SUPPLY
WASTE WATER
SOLID WASTE MANAGEMENT STORM WATER
Blank values represent 'zero', 'not applicable' or 'no data' in the charts above.
6

Alibag Municipal Council Background
GENERAL INFORMATIONClass Class C No. of slum settlements 2
District Raigad Slum population 1,100
Area (sq. km.) 2 Slum households 253
Total city population 22,567 Total annual city capital receipts (`) 48,940,095
Total households 5,037 Total annual city capital expenditure (`) 28,318,958
Density (persons per sq. km.) 12,537 Total annual city revenue receipts (`) 62,808,071
Total municipal staff 95 Total annual city revenue expenditure (`) 22,258,562
WATER SUPPLYTotal water produced (MLD) 5.5
Ground water (MLD) 0.0
Surface water (MLD) 5.5
Average daily volume treated (MLD) 0.0
Installed storage capacity (MLD) 8.8
Total water connections (nos.) 2,889.0
Water connections in slums (nos.) 0.0
Area covered by network (sq. km.) 1.8
No. of days of supply in a month 30.0
Annual revenue receipts from water (`) 7,185,802.0
Annual revenue expenditure on water (`) 14,245,216.0
Annual capital expenditure on water (`) 14,045,216.0
WASTE WATERArea covered by waste water network (sq. km.) 2.4
Underground sewerage network (sq. km) 0.0
Closed drains (sq. km) 1.0
Open drains (sq. km) 1.4
Total sewerage connections (nos.) 0.0
Sewerage coverage: slums (%) 0.0
Installed STP treatment capacity (MLD) 0.0
Annual revenue receipts from WW (`) 348,900.0
Annual revenue expenditure on WW (`) 2,013,874.0
Annual capital expenditure on WW (`) 613,076.0
SOLID WASTE MANAGEMENTWaste generated (TPD) 9.0
Waste collected (TPD) 8.0
Quantity of waste treated (TPD) 0.0
Waste received at scientific landfill (TPD) 0.0
Door to door colln.(no. of households andestablishments)
5,337.0
Waste segregation at source (Y/N) N
Annual revenue receipts from SW (`) 1,750.0
Annual revenue expenditure on SW (`) 5,376,665.0
Annual capital expenditure on SW (`) 5,376,665.0
7

Alibag Municipal Council
Service Level Benchmark Indicators
WATER SUPPLY
WASTE WATER
SOLID WASTE MANAGEMENT STORM WATER
Blank values represent 'zero', 'not applicable' or 'no data' in the charts above.
8

Ambad Municipal Council Background
GENERAL INFORMATIONClass Class C No. of slum settlements 6
District Jalna Slum population 7,969
Area (sq. km.) 12 Slum households 1,264
Total city population 30,000 Total annual city capital receipts (`) 49,569,500
Total households 5,671 Total annual city capital expenditure (`) 68,822,001
Density (persons per sq. km.) 2,500 Total annual city revenue receipts (`) 10,209,037
Total municipal staff 71 Total annual city revenue expenditure (`) 0
WATER SUPPLYTotal water produced (MLD) 1.5
Ground water (MLD) 0.0
Surface water (MLD) 1.5
Average daily volume treated (MLD) 0.0
Installed storage capacity (MLD) 13.5
Total water connections (nos.) 2,476.0
Water connections in slums (nos.) 285.0
Area covered by network (sq. km.) 10.0
No. of days of supply in a month 0.0
Annual revenue receipts from water (`) 2,090,439.0
Annual revenue expenditure on water (`) 2,620,454.0
Annual capital expenditure on water (`) 1,866,773.0
WASTE WATERArea covered by waste water network (sq. km.) 8.0
Underground sewerage network (sq. km) 0.0
Closed drains (sq. km) 0.0
Open drains (sq. km) 8.0
Total sewerage connections (nos.) 0.0
Sewerage coverage: slums (%) 0.0
Installed STP treatment capacity (MLD) 0.0
Annual revenue receipts from WW (`) 0.0
Annual revenue expenditure on WW (`) 0.0
Annual capital expenditure on WW (`) 0.0
SOLID WASTE MANAGEMENTWaste generated (TPD) 7.0
Waste collected (TPD) 7.0
Quantity of waste treated (TPD) 7.0
Waste received at scientific landfill (TPD) 0.0
Door to door colln.(no. of households andestablishments)
4,250.0
Waste segregation at source (Y/N) N
Annual revenue receipts from SW (`) 0.0
Annual revenue expenditure on SW (`) 35,840.0
Annual capital expenditure on SW (`) 5,338,106.0
9

Ambad Municipal Council
Service Level Benchmark Indicators
WATER SUPPLY
WASTE WATER
SOLID WASTE MANAGEMENT STORM WATER
Blank values represent 'zero', 'not applicable' or 'no data' in the charts above.
10
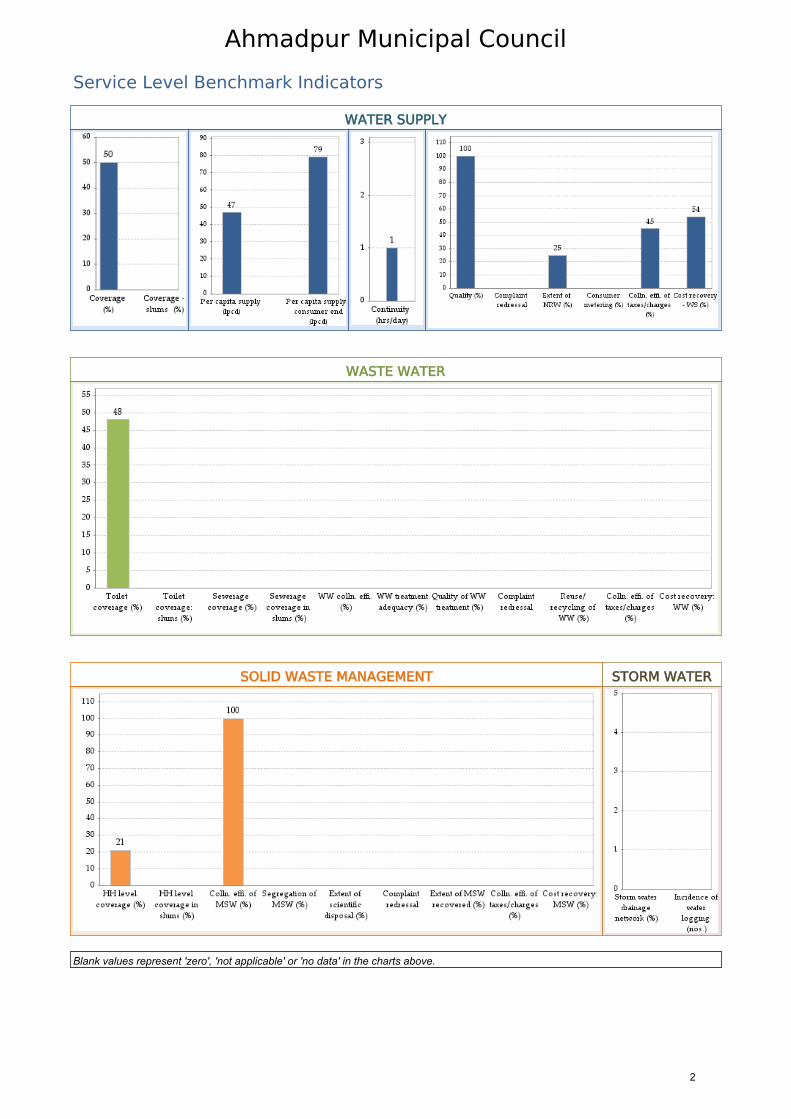
Ashta Municipal Council Background
GENERAL INFORMATIONClass Class C No. of slum settlements 12
District Sangli Slum population 10,761
Area (sq. km.) 57 Slum households 2,206
Total city population 40,164 Total annual city capital receipts (`) 31,000,000
Total households 7,494 Total annual city capital expenditure (`) 99,071,000
Density (persons per sq. km.) 705 Total annual city revenue receipts (`) 28,616,000
Total municipal staff 50 Total annual city revenue expenditure (`) 9,495,000
WATER SUPPLYTotal water produced (MLD) 1.4
Ground water (MLD) 0.0
Surface water (MLD) 1.4
Average daily volume treated (MLD) 1.4
Installed storage capacity (MLD) 6.8
Total water connections (nos.) 1,919.0
Water connections in slums (nos.) 50.0
Area covered by network (sq. km.) 8.5
No. of days of supply in a month 30.0
Annual revenue receipts from water (`) 1,539,000.0
Annual revenue expenditure on water (`) 3,750,000.0
Annual capital expenditure on water (`) 25,626,000.0
WASTE WATERArea covered by waste water network (sq. km.) 0.6
Underground sewerage network (sq. km) 0.0
Closed drains (sq. km) 0.0
Open drains (sq. km) 0.6
Total sewerage connections (nos.) 0.0
Sewerage coverage: slums (%) 0.0
Installed STP treatment capacity (MLD) 0.0
Annual revenue receipts from WW (`) 0.0
Annual revenue expenditure on WW (`) 0.0
Annual capital expenditure on WW (`) 0.0
SOLID WASTE MANAGEMENTWaste generated (TPD) 6.0
Waste collected (TPD) 6.0
Quantity of waste treated (TPD) 0.5
Waste received at scientific landfill (TPD) 0.0
Door to door colln.(no. of households andestablishments)
2,526.0
Waste segregation at source (Y/N) N
Annual revenue receipts from SW (`) 16,000.0
Annual revenue expenditure on SW (`) 286,000.0
Annual capital expenditure on SW (`) 2,412,000.0
11

Ashta Municipal Council
Service Level Benchmark Indicators
WATER SUPPLY
WASTE WATER
SOLID WASTE MANAGEMENT STORM WATER
Blank values represent 'zero', 'not applicable' or 'no data' in the charts above.
12

Ausa Municipal Council Background
GENERAL INFORMATIONClass Class C No. of slum settlements 2
District Latur Slum population 7,035
Area (sq. km.) 5 Slum households 851
Total city population 37,984 Total annual city capital receipts (`) 33,587,635
Total households 6,377 Total annual city capital expenditure (`) 32,970,913
Density (persons per sq. km.) 7,034 Total annual city revenue receipts (`) 45,808,388
Total municipal staff 63 Total annual city revenue expenditure (`) 47,402,970
WATER SUPPLYTotal water produced (MLD) 2.2
Ground water (MLD) 0.0
Surface water (MLD) 2.2
Average daily volume treated (MLD) 1.8
Installed storage capacity (MLD) 1.7
Total water connections (nos.) 2,612.0
Water connections in slums (nos.) 355.0
Area covered by network (sq. km.) 4.3
No. of days of supply in a month 15.0
Annual revenue receipts from water (`) 1,184,944.0
Annual revenue expenditure on water (`) 4,596,608.0
Annual capital expenditure on water (`) 3,055,878.0
WASTE WATERArea covered by waste water network (sq. km.) 3.2
Underground sewerage network (sq. km) 0.0
Closed drains (sq. km) 0.0
Open drains (sq. km) 3.2
Total sewerage connections (nos.) 0.0
Sewerage coverage: slums (%) 0.0
Installed STP treatment capacity (MLD) 0.0
Annual revenue receipts from WW (`) 0.0
Annual revenue expenditure on WW (`) 0.0
Annual capital expenditure on WW (`) 0.0
SOLID WASTE MANAGEMENTWaste generated (TPD) 12.0
Waste collected (TPD) 13.0
Quantity of waste treated (TPD) 0.0
Waste received at scientific landfill (TPD) 0.0
Door to door colln.(no. of households andestablishments)
2,500.0
Waste segregation at source (Y/N) N
Annual revenue receipts from SW (`) 0.0
Annual revenue expenditure on SW (`) 0.0
Annual capital expenditure on SW (`) 0.0
13

Ausa Municipal Council
Service Level Benchmark Indicators
WATER SUPPLY
WASTE WATER
SOLID WASTE MANAGEMENT STORM WATER
Blank values represent 'zero', 'not applicable' or 'no data' in the charts above.
14

Balapur Municipal Council Background
GENERAL INFORMATIONClass Class C No. of slum settlements 0
District Akola Slum population 0
Area (sq. km.) 17 Slum households 0
Total city population 43,156 Total annual city capital receipts (`) 0
Total households 6,375 Total annual city capital expenditure (`) 0
Density (persons per sq. km.) 2,569 Total annual city revenue receipts (`) 659
Total municipal staff 69 Total annual city revenue expenditure (`) 577
WATER SUPPLYTotal water produced (MLD) 4.6
Ground water (MLD) 0.6
Surface water (MLD) 4.0
Average daily volume treated (MLD) 5.0
Installed storage capacity (MLD) 1.5
Total water connections (nos.) 3,098.0
Water connections in slums (nos.) 0.0
Area covered by network (sq. km.) 0.0
No. of days of supply in a month 15.0
Annual revenue receipts from water (`) 30.6
Annual revenue expenditure on water (`) 42.8
Annual capital expenditure on water (`) 43.2
WASTE WATERArea covered by waste water network (sq. km.) 0.0
Underground sewerage network (sq. km) 0.0
Closed drains (sq. km) 0.0
Open drains (sq. km) 0.0
Total sewerage connections (nos.) 0.0
Sewerage coverage: slums (%) 0.0
Installed STP treatment capacity (MLD) 0.0
Annual revenue receipts from WW (`) 2.7
Annual revenue expenditure on WW (`) 0.0
Annual capital expenditure on WW (`) 2.9
SOLID WASTE MANAGEMENTWaste generated (TPD) 8.8
Waste collected (TPD) 0.0
Quantity of waste treated (TPD) 0.0
Waste received at scientific landfill (TPD) 0.0
Door to door colln.(no. of households andestablishments)
6,375.0
Waste segregation at source (Y/N) N
Annual revenue receipts from SW (`) 12.3
Annual revenue expenditure on SW (`) 22.1
Annual capital expenditure on SW (`) 22.1
15

Balapur Municipal Council
Service Level Benchmark Indicators
WATER SUPPLY
WASTE WATER
SOLID WASTE MANAGEMENT STORM WATER
Blank values represent 'zero', 'not applicable' or 'no data' in the charts above.
16

Bhagur Municipal Council Background
GENERAL INFORMATIONClass Class C No. of slum settlements 2
District Nashik Slum population 925
Area (sq. km.) 1 Slum households 185
Total city population 14,325 Total annual city capital receipts (`) 20,741,251
Total households 2,754 Total annual city capital expenditure (`) 7,432,210
Density (persons per sq. km.) 20,464 Total annual city revenue receipts (`) 13,902,728
Total municipal staff 52 Total annual city revenue expenditure (`) 12,237,177
WATER SUPPLYTotal water produced (MLD) 1.3
Ground water (MLD) 0.0
Surface water (MLD) 1.3
Average daily volume treated (MLD) 1.1
Installed storage capacity (MLD) 12.6
Total water connections (nos.) 1,600.0
Water connections in slums (nos.) 50.0
Area covered by network (sq. km.) 0.7
No. of days of supply in a month 30.0
Annual revenue receipts from water (`) 1,647,411.0
Annual revenue expenditure on water (`) 1,830,429.0
Annual capital expenditure on water (`) 0.0
WASTE WATERArea covered by waste water network (sq. km.) 0.6
Underground sewerage network (sq. km) 0.0
Closed drains (sq. km) 0.5
Open drains (sq. km) 0.1
Total sewerage connections (nos.) 0.0
Sewerage coverage: slums (%) 0.0
Installed STP treatment capacity (MLD) 0.0
Annual revenue receipts from WW (`) 178,310.0
Annual revenue expenditure on WW (`) 2,082,143.0
Annual capital expenditure on WW (`) 1,682,893.0
SOLID WASTE MANAGEMENTWaste generated (TPD) 4.0
Waste collected (TPD) 4.0
Quantity of waste treated (TPD) 0.0
Waste received at scientific landfill (TPD) 0.0
Door to door colln.(no. of households andestablishments)
2,086.0
Waste segregation at source (Y/N) N
Annual revenue receipts from SW (`) 0.0
Annual revenue expenditure on SW (`) 469,575.0
Annual capital expenditure on SW (`) 669,773.0
17

Bhagur Municipal Council
Service Level Benchmark Indicators
WATER SUPPLY
WASTE WATER
SOLID WASTE MANAGEMENT STORM WATER
Blank values represent 'zero', 'not applicable' or 'no data' in the charts above.
18

Bhokar Municipal Council Background
GENERAL INFORMATIONClass Class C No. of slum settlements 4
District Nanded Slum population 0
Area (sq. km.) 19 Slum households 0
Total city population 32,651 Total annual city capital receipts (`) 0
Total households 6,530 Total annual city capital expenditure (`) 0
Density (persons per sq. km.) 1,728 Total annual city revenue receipts (`) 0
Total municipal staff 1 Total annual city revenue expenditure (`) 0
WATER SUPPLYTotal water produced (MLD) 1.2
Ground water (MLD) 1.2
Surface water (MLD) 0.0
Average daily volume treated (MLD) 0.0
Installed storage capacity (MLD) 0.9
Total water connections (nos.) 0.0
Water connections in slums (nos.) 0.0
Area covered by network (sq. km.) 0.0
No. of days of supply in a month 0.0
Annual revenue receipts from water (`) 0.0
Annual revenue expenditure on water (`) 0.0
Annual capital expenditure on water (`) 0.0
WASTE WATERArea covered by waste water network (sq. km.) 0.0
Underground sewerage network (sq. km) 0.0
Closed drains (sq. km) 0.0
Open drains (sq. km) 0.0
Total sewerage connections (nos.) 0.0
Sewerage coverage: slums (%) 0.0
Installed STP treatment capacity (MLD) 0.0
Annual revenue receipts from WW (`) 0.0
Annual revenue expenditure on WW (`) 0.0
Annual capital expenditure on WW (`) 0.0
SOLID WASTE MANAGEMENTWaste generated (TPD) 4.0
Waste collected (TPD) 0.0
Quantity of waste treated (TPD) 0.0
Waste received at scientific landfill (TPD) 0.0
Door to door colln.(no. of households andestablishments)
0.0
Waste segregation at source (Y/N) N
Annual revenue receipts from SW (`) 0.0
Annual revenue expenditure on SW (`) 0.0
Annual capital expenditure on SW (`) 0.0
19

Bhokar Municipal Council
Service Level Benchmark Indicators
WATER SUPPLY
WASTE WATER
SOLID WASTE MANAGEMENT STORM WATER
Blank values represent 'zero', 'not applicable' or 'no data' in the charts above.
20

Bhokardan Municipal Council Background
GENERAL INFORMATIONClass Class C No. of slum settlements 3
District Jalna Slum population 2,996
Area (sq. km.) 3 Slum households 526
Total city population 25,000 Total annual city capital receipts (`) 29,611,985
Total households 3,300 Total annual city capital expenditure (`) 19,749,517
Density (persons per sq. km.) 9,615 Total annual city revenue receipts (`) 36,932,844
Total municipal staff 12 Total annual city revenue expenditure (`) 0
WATER SUPPLYTotal water produced (MLD) 1.1
Ground water (MLD) 0.2
Surface water (MLD) 0.9
Average daily volume treated (MLD) 1.0
Installed storage capacity (MLD) 0.9
Total water connections (nos.) 2,394.0
Water connections in slums (nos.) 472.0
Area covered by network (sq. km.) 2.6
No. of days of supply in a month 15.0
Annual revenue receipts from water (`) 2,411,081.0
Annual revenue expenditure on water (`) 3,431,980.0
Annual capital expenditure on water (`) 3,475,896.0
WASTE WATERArea covered by waste water network (sq. km.) 1.5
Underground sewerage network (sq. km) 0.0
Closed drains (sq. km) 0.0
Open drains (sq. km) 1.5
Total sewerage connections (nos.) 0.0
Sewerage coverage: slums (%) 0.0
Installed STP treatment capacity (MLD) 0.0
Annual revenue receipts from WW (`) 0.0
Annual revenue expenditure on WW (`) 0.0
Annual capital expenditure on WW (`) 0.0
SOLID WASTE MANAGEMENTWaste generated (TPD) 2.5
Waste collected (TPD) 2.5
Quantity of waste treated (TPD) 0.0
Waste received at scientific landfill (TPD) 0.0
Door to door colln.(no. of households andestablishments)
3,097.0
Waste segregation at source (Y/N) N
Annual revenue receipts from SW (`) 0.0
Annual revenue expenditure on SW (`) 4,238,770.0
Annual capital expenditure on SW (`) 5,792,114.0
21

Bhokardan Municipal Council
Service Level Benchmark Indicators
WATER SUPPLY
WASTE WATER
SOLID WASTE MANAGEMENT STORM WATER
Blank values represent 'zero', 'not applicable' or 'no data' in the charts above.
22

Bhoom Municipal Council Background
GENERAL INFORMATIONClass Class C No. of slum settlements 0
District Osmanabad Slum population 0
Area (sq. km.) 5 Slum households 0
Total city population 21,000 Total annual city capital receipts (`) 22,191,000
Total households 3,750 Total annual city capital expenditure (`) 22,282,000
Density (persons per sq. km.) 4,565 Total annual city revenue receipts (`) 12,770,000
Total municipal staff 80 Total annual city revenue expenditure (`) 22,133,000
WATER SUPPLYTotal water produced (MLD) 2.1
Ground water (MLD) 0.4
Surface water (MLD) 1.7
Average daily volume treated (MLD) 1.7
Installed storage capacity (MLD) 4.3
Total water connections (nos.) 2,874.0
Water connections in slums (nos.) 0.0
Area covered by network (sq. km.) 2.5
No. of days of supply in a month 30.0
Annual revenue receipts from water (`) 2,502,000.0
Annual revenue expenditure on water (`) 2,268,000.0
Annual capital expenditure on water (`) 0.0
WASTE WATERArea covered by waste water network (sq. km.) 1.8
Underground sewerage network (sq. km) 0.0
Closed drains (sq. km) 0.0
Open drains (sq. km) 1.8
Total sewerage connections (nos.) 0.0
Sewerage coverage: slums (%) 0.0
Installed STP treatment capacity (MLD) 0.0
Annual revenue receipts from WW (`) 0.0
Annual revenue expenditure on WW (`) 1,217,000.0
Annual capital expenditure on WW (`) 0.0
SOLID WASTE MANAGEMENTWaste generated (TPD) 2.0
Waste collected (TPD) 2.0
Quantity of waste treated (TPD) 0.0
Waste received at scientific landfill (TPD) 0.0
Door to door colln.(no. of households andestablishments)
3,673.0
Waste segregation at source (Y/N) nd
Annual revenue receipts from SW (`) 0.0
Annual revenue expenditure on SW (`) 2,978,000.0
Annual capital expenditure on SW (`) 0.0
23

Bhoom Municipal Council
Service Level Benchmark Indicators
WATER SUPPLY
WASTE WATER
SOLID WASTE MANAGEMENT STORM WATER
Blank values represent 'zero', 'not applicable' or 'no data' in the charts above.
24

Bhor Municipal Council Background
GENERAL INFORMATIONClass Class C No. of slum settlements 0
District Pune Slum population 0
Area (sq. km.) 8 Slum households 0
Total city population 22,500 Total annual city capital receipts (`) 9,537,528
Total households 4,500 Total annual city capital expenditure (`) 28,336,271
Density (persons per sq. km.) 2,679 Total annual city revenue receipts (`) 24,337,196
Total municipal staff 55 Total annual city revenue expenditure (`) 20,903,958
WATER SUPPLYTotal water produced (MLD) 1.5
Ground water (MLD) 0.2
Surface water (MLD) 1.3
Average daily volume treated (MLD) 1.3
Installed storage capacity (MLD) 1.3
Total water connections (nos.) 2,882.0
Water connections in slums (nos.) 0.0
Area covered by network (sq. km.) 4.2
No. of days of supply in a month 30.0
Annual revenue receipts from water (`) 3,382,307.0
Annual revenue expenditure on water (`) 3,706,492.0
Annual capital expenditure on water (`) 4,472,516.0
WASTE WATERArea covered by waste water network (sq. km.) 3.4
Underground sewerage network (sq. km) 0.0
Closed drains (sq. km) 1.7
Open drains (sq. km) 1.7
Total sewerage connections (nos.) 0.0
Sewerage coverage: slums (%) 0.0
Installed STP treatment capacity (MLD) 0.0
Annual revenue receipts from WW (`) 0.0
Annual revenue expenditure on WW (`) 0.0
Annual capital expenditure on WW (`) 0.0
SOLID WASTE MANAGEMENTWaste generated (TPD) 5.6
Waste collected (TPD) 5.0
Quantity of waste treated (TPD) 0.0
Waste received at scientific landfill (TPD) 0.0
Door to door colln.(no. of households andestablishments)
5,079.0
Waste segregation at source (Y/N) N
Annual revenue receipts from SW (`) 0.0
Annual revenue expenditure on SW (`) 0.0
Annual capital expenditure on SW (`) 10,000.0
25

Bhor Municipal Council
Service Level Benchmark Indicators
WATER SUPPLY
WASTE WATER
SOLID WASTE MANAGEMENT STORM WATER
Blank values represent 'zero', 'not applicable' or 'no data' in the charts above.
26

Biloli Municipal Council Background
GENERAL INFORMATIONClass Class C No. of slum settlements 0
District Nanded Slum population 0
Area (sq. km.) 0 Slum households 0
Total city population 0 Total annual city capital receipts (`) 21,734,933
Total households 0 Total annual city capital expenditure (`) 11,987,447
Density (persons per sq. km.) 0 Total annual city revenue receipts (`) 0
Total municipal staff 46 Total annual city revenue expenditure (`) 12,293,795
WATER SUPPLYTotal water produced (MLD) 0.0
Ground water (MLD) 0.0
Surface water (MLD) 0.0
Average daily volume treated (MLD) 0.0
Installed storage capacity (MLD) 0.3
Total water connections (nos.) 1,170.0
Water connections in slums (nos.) 0.0
Area covered by network (sq. km.) 0.0
No. of days of supply in a month 26.0
Annual revenue receipts from water (`) 1,926,650.0
Annual revenue expenditure on water (`) 496,286.0
Annual capital expenditure on water (`) 0.0
WASTE WATERArea covered by waste water network (sq. km.) 0.0
Underground sewerage network (sq. km) 0.0
Closed drains (sq. km) 0.0
Open drains (sq. km) 0.0
Total sewerage connections (nos.) 0.0
Sewerage coverage: slums (%) 0.0
Installed STP treatment capacity (MLD) 0.0
Annual revenue receipts from WW (`) 0.0
Annual revenue expenditure on WW (`) 1,329,354.0
Annual capital expenditure on WW (`) 0.0
SOLID WASTE MANAGEMENTWaste generated (TPD) 0.0
Waste collected (TPD) 0.0
Quantity of waste treated (TPD) 0.0
Waste received at scientific landfill (TPD) 0.0
Door to door colln.(no. of households andestablishments)
0.0
Waste segregation at source (Y/N) nd
Annual revenue receipts from SW (`) 1,053,922.0
Annual revenue expenditure on SW (`) 1,417,980.0
Annual capital expenditure on SW (`) 0.0
27

Biloli Municipal Council
Service Level Benchmark Indicators
WATER SUPPLY
WASTE WATER
SOLID WASTE MANAGEMENT STORM WATER
Blank values represent 'zero', 'not applicable' or 'no data' in the charts above.
28

Brahmapuri Municipal Council Background
GENERAL INFORMATIONClass Class C No. of slum settlements 13
District Chandrapur Slum population 0
Area (sq. km.) 22 Slum households 1,382
Total city population 38,000 Total annual city capital receipts (`) 220,000
Total households 7,350 Total annual city capital expenditure (`) 103,000
Density (persons per sq. km.) 1,735 Total annual city revenue receipts (`) 52,600,000
Total municipal staff 81 Total annual city revenue expenditure (`) 38,205,000
WATER SUPPLYTotal water produced (MLD) 3.0
Ground water (MLD) 0.0
Surface water (MLD) 3.0
Average daily volume treated (MLD) 3.0
Installed storage capacity (MLD) 1.5
Total water connections (nos.) 3,365.0
Water connections in slums (nos.) 0.0
Area covered by network (sq. km.) 20.0
No. of days of supply in a month 30.0
Annual revenue receipts from water (`) 2,800,000.0
Annual revenue expenditure on water (`) 3,500,000.0
Annual capital expenditure on water (`) 244,000.0
WASTE WATERArea covered by waste water network (sq. km.) 16.2
Underground sewerage network (sq. km) 0.0
Closed drains (sq. km) 3.0
Open drains (sq. km) 13.2
Total sewerage connections (nos.) 0.0
Sewerage coverage: slums (%) 0.0
Installed STP treatment capacity (MLD) 0.0
Annual revenue receipts from WW (`) 0.0
Annual revenue expenditure on WW (`) 0.0
Annual capital expenditure on WW (`) 0.0
SOLID WASTE MANAGEMENTWaste generated (TPD) 8.0
Waste collected (TPD) 6.2
Quantity of waste treated (TPD) 0.0
Waste received at scientific landfill (TPD) 0.0
Door to door colln.(no. of households andestablishments)
8,474.0
Waste segregation at source (Y/N) N
Annual revenue receipts from SW (`) 0.0
Annual revenue expenditure on SW (`) 0.0
Annual capital expenditure on SW (`) 2,293,000.0
29

Brahmapuri Municipal Council
Service Level Benchmark Indicators
WATER SUPPLY
WASTE WATER
SOLID WASTE MANAGEMENT STORM WATER
Blank values represent 'zero', 'not applicable' or 'no data' in the charts above.
30

Chandur-Bazar Municipal Council Background
GENERAL INFORMATIONClass Class C No. of slum settlements 10
District Amravati Slum population 9,826
Area (sq. km.) 2 Slum households 1,859
Total city population 19,960 Total annual city capital receipts (`) 0
Total households 3,606 Total annual city capital expenditure (`) 0
Density (persons per sq. km.) 9,980 Total annual city revenue receipts (`) 0
Total municipal staff 87 Total annual city revenue expenditure (`) 0
WATER SUPPLYTotal water produced (MLD) 2.4
Ground water (MLD) 0.0
Surface water (MLD) 2.4
Average daily volume treated (MLD) 0.0
Installed storage capacity (MLD) 0.8
Total water connections (nos.) 0.0
Water connections in slums (nos.) 550.0
Area covered by network (sq. km.) 2.0
No. of days of supply in a month 30.0
Annual revenue receipts from water (`) 0.0
Annual revenue expenditure on water (`) 0.0
Annual capital expenditure on water (`) 0.0
WASTE WATERArea covered by waste water network (sq. km.) 2.0
Underground sewerage network (sq. km) 0.0
Closed drains (sq. km) 0.0
Open drains (sq. km) 2.0
Total sewerage connections (nos.) 0.0
Sewerage coverage: slums (%) 0.0
Installed STP treatment capacity (MLD) 0.0
Annual revenue receipts from WW (`) 0.0
Annual revenue expenditure on WW (`) 0.0
Annual capital expenditure on WW (`) 0.0
SOLID WASTE MANAGEMENTWaste generated (TPD) 5.0
Waste collected (TPD) 5.0
Quantity of waste treated (TPD) 0.0
Waste received at scientific landfill (TPD) 0.0
Door to door colln.(no. of households andestablishments)
3,994.0
Waste segregation at source (Y/N) N
Annual revenue receipts from SW (`) 0.0
Annual revenue expenditure on SW (`) 0.0
Annual capital expenditure on SW (`) 0.0
31

Chandur-Bazar Municipal Council
Service Level Benchmark Indicators
WATER SUPPLY
WASTE WATER
SOLID WASTE MANAGEMENT STORM WATER
Blank values represent 'zero', 'not applicable' or 'no data' in the charts above.
32

Chandur-Rly Municipal Council Background
GENERAL INFORMATIONClass Class C No. of slum settlements 3
District Amravati Slum population 2,252
Area (sq. km.) 6 Slum households 540
Total city population 20,965 Total annual city capital receipts (`) 25,785,806
Total households 5,004 Total annual city capital expenditure (`) 29,502,646
Density (persons per sq. km.) 3,494 Total annual city revenue receipts (`) 15,181,449
Total municipal staff 41 Total annual city revenue expenditure (`) 9,948,364
WATER SUPPLYTotal water produced (MLD) 2.0
Ground water (MLD) 0.0
Surface water (MLD) 2.0
Average daily volume treated (MLD) 2.0
Installed storage capacity (MLD) 0.9
Total water connections (nos.) 2,267.0
Water connections in slums (nos.) 260.0
Area covered by network (sq. km.) 5.5
No. of days of supply in a month 15.0
Annual revenue receipts from water (`) 2,317,874.0
Annual revenue expenditure on water (`) 2,843,794.0
Annual capital expenditure on water (`) 0.0
WASTE WATERArea covered by waste water network (sq. km.) 5.0
Underground sewerage network (sq. km) 0.0
Closed drains (sq. km) 0.0
Open drains (sq. km) 5.0
Total sewerage connections (nos.) 0.0
Sewerage coverage: slums (%) 0.0
Installed STP treatment capacity (MLD) 0.0
Annual revenue receipts from WW (`) 0.0
Annual revenue expenditure on WW (`) 757,163.0
Annual capital expenditure on WW (`) 757,000.0
SOLID WASTE MANAGEMENTWaste generated (TPD) 4.5
Waste collected (TPD) 4.5
Quantity of waste treated (TPD) 0.0
Waste received at scientific landfill (TPD) 0.0
Door to door colln.(no. of households andestablishments)
4,378.0
Waste segregation at source (Y/N) N
Annual revenue receipts from SW (`) 0.0
Annual revenue expenditure on SW (`) 2,042,979.0
Annual capital expenditure on SW (`) 687,000.0
33

Chandur-Rly Municipal Council
Service Level Benchmark Indicators
WATER SUPPLY
WASTE WATER
SOLID WASTE MANAGEMENT STORM WATER
Blank values represent 'zero', 'not applicable' or 'no data' in the charts above.
34

Chikhaldara Municipal Council Background
GENERAL INFORMATIONClass Class C No. of slum settlements 1
District Amravati Slum population 376
Area (sq. km.) 4 Slum households 80
Total city population 5,500 Total annual city capital receipts (`) 31,146,593
Total households 1,015 Total annual city capital expenditure (`) 32,038,907
Density (persons per sq. km.) 1,410 Total annual city revenue receipts (`) 31,146,000
Total municipal staff 26 Total annual city revenue expenditure (`) 32,039,000
WATER SUPPLYTotal water produced (MLD) 0.5
Ground water (MLD) 0.5
Surface water (MLD) 0.0
Average daily volume treated (MLD) 0.0
Installed storage capacity (MLD) 0.3
Total water connections (nos.) 601.0
Water connections in slums (nos.) 30.0
Area covered by network (sq. km.) 3.9
No. of days of supply in a month 0.0
Annual revenue receipts from water (`) 0.0
Annual revenue expenditure on water (`) 0.0
Annual capital expenditure on water (`) 0.0
WASTE WATERArea covered by waste water network (sq. km.) 3.9
Underground sewerage network (sq. km) 0.0
Closed drains (sq. km) 0.0
Open drains (sq. km) 3.9
Total sewerage connections (nos.) 0.0
Sewerage coverage: slums (%) 0.0
Installed STP treatment capacity (MLD) 0.0
Annual revenue receipts from WW (`) 0.0
Annual revenue expenditure on WW (`) 131,117.0
Annual capital expenditure on WW (`) 0.0
SOLID WASTE MANAGEMENTWaste generated (TPD) 0.2
Waste collected (TPD) 0.2
Quantity of waste treated (TPD) 0.0
Waste received at scientific landfill (TPD) 0.0
Door to door colln.(no. of households andestablishments)
703.0
Waste segregation at source (Y/N) N
Annual revenue receipts from SW (`) 0.0
Annual revenue expenditure on SW (`) 636,384.0
Annual capital expenditure on SW (`) 0.0
35

Chikhaldara Municipal Council
Service Level Benchmark Indicators
WATER SUPPLY
WASTE WATER
SOLID WASTE MANAGEMENT STORM WATER
Blank values represent 'zero', 'not applicable' or 'no data' in the charts above.
36

Darwha Municipal Council Background
GENERAL INFORMATIONClass Class C No. of slum settlements 2
District Yavatmal Slum population 1,800
Area (sq. km.) 2 Slum households 360
Total city population 29,000 Total annual city capital receipts (`) 19,662,547
Total households 5,800 Total annual city capital expenditure (`) 24,435,064
Density (persons per sq. km.) 13,182 Total annual city revenue receipts (`) 27,079,004
Total municipal staff 45 Total annual city revenue expenditure (`) 27,174,296
WATER SUPPLYTotal water produced (MLD) 1.7
Ground water (MLD) 0.2
Surface water (MLD) 1.5
Average daily volume treated (MLD) 1.7
Installed storage capacity (MLD) 1.1
Total water connections (nos.) 1,910.0
Water connections in slums (nos.) 0.0
Area covered by network (sq. km.) 1.5
No. of days of supply in a month 10.0
Annual revenue receipts from water (`) 0.0
Annual revenue expenditure on water (`) 1,413,942.0
Annual capital expenditure on water (`) 1,415,731.0
WASTE WATERArea covered by waste water network (sq. km.) 2.2
Underground sewerage network (sq. km) 0.0
Closed drains (sq. km) 0.0
Open drains (sq. km) 2.2
Total sewerage connections (nos.) 0.0
Sewerage coverage: slums (%) 0.0
Installed STP treatment capacity (MLD) 0.0
Annual revenue receipts from WW (`) 0.0
Annual revenue expenditure on WW (`) 2,520,945.0
Annual capital expenditure on WW (`) 2,521,315.0
SOLID WASTE MANAGEMENTWaste generated (TPD) 5.0
Waste collected (TPD) 5.0
Quantity of waste treated (TPD) 0.0
Waste received at scientific landfill (TPD) 0.0
Door to door colln.(no. of households andestablishments)
5,820.0
Waste segregation at source (Y/N) nd
Annual revenue receipts from SW (`) 0.0
Annual revenue expenditure on SW (`) 129,020.0
Annual capital expenditure on SW (`) 0.0
37

Darwha Municipal Council
Service Level Benchmark Indicators
WATER SUPPLY
WASTE WATER
SOLID WASTE MANAGEMENT STORM WATER
Blank values represent 'zero', 'not applicable' or 'no data' in the charts above.
38

Daryapur Municipal Council Background
GENERAL INFORMATIONClass Class C No. of slum settlements 12
District Amravati Slum population 5,002
Area (sq. km.) 4 Slum households 1,042
Total city population 42,996 Total annual city capital receipts (`) 18,190,208
Total households 8,111 Total annual city capital expenditure (`) 16,353,131
Density (persons per sq. km.) 10,487 Total annual city revenue receipts (`) 72,313,873
Total municipal staff 131 Total annual city revenue expenditure (`) 52,763,962
WATER SUPPLYTotal water produced (MLD) 2.8
Ground water (MLD) 0.0
Surface water (MLD) 2.8
Average daily volume treated (MLD) 2.8
Installed storage capacity (MLD) 2.0
Total water connections (nos.) 4,638.0
Water connections in slums (nos.) 1,042.0
Area covered by network (sq. km.) 4.1
No. of days of supply in a month 30.0
Annual revenue receipts from water (`) 0.0
Annual revenue expenditure on water (`) 0.0
Annual capital expenditure on water (`) 0.0
WASTE WATERArea covered by waste water network (sq. km.) 3.0
Underground sewerage network (sq. km) 0.0
Closed drains (sq. km) 0.0
Open drains (sq. km) 3.0
Total sewerage connections (nos.) 0.0
Sewerage coverage: slums (%) 0.0
Installed STP treatment capacity (MLD) 0.0
Annual revenue receipts from WW (`) 0.0
Annual revenue expenditure on WW (`) 3,264,396.0
Annual capital expenditure on WW (`) 0.0
SOLID WASTE MANAGEMENTWaste generated (TPD) 6.0
Waste collected (TPD) 6.0
Quantity of waste treated (TPD) 0.0
Waste received at scientific landfill (TPD) 0.0
Door to door colln.(no. of households andestablishments)
2,606.0
Waste segregation at source (Y/N) N
Annual revenue receipts from SW (`) 1,106,000.0
Annual revenue expenditure on SW (`) 0.0
Annual capital expenditure on SW (`) 3,451,000.0
39

Daryapur Municipal Council
Service Level Benchmark Indicators
WATER SUPPLY
WASTE WATER
SOLID WASTE MANAGEMENT STORM WATER
Blank values represent 'zero', 'not applicable' or 'no data' in the charts above.
40

Desaiganj Municipal Council Background
GENERAL INFORMATIONClass Class C No. of slum settlements 3
District Gadchiroli Slum population 2,500
Area (sq. km.) 26 Slum households 500
Total city population 34,700 Total annual city capital receipts (`) 4,370,000
Total households 7,638 Total annual city capital expenditure (`) 4,339,380
Density (persons per sq. km.) 1,314 Total annual city revenue receipts (`) 66,055,459
Total municipal staff 51 Total annual city revenue expenditure (`) 58,163,952
WATER SUPPLYTotal water produced (MLD) 2.4
Ground water (MLD) 0.2
Surface water (MLD) 2.2
Average daily volume treated (MLD) 2.0
Installed storage capacity (MLD) 1.3
Total water connections (nos.) 3,035.0
Water connections in slums (nos.) 0.0
Area covered by network (sq. km.) 13.0
No. of days of supply in a month 30.0
Annual revenue receipts from water (`) 4,450,639.0
Annual revenue expenditure on water (`) 4,509,107.0
Annual capital expenditure on water (`) 0.0
WASTE WATERArea covered by waste water network (sq. km.) 15.0
Underground sewerage network (sq. km) 0.0
Closed drains (sq. km) 2.0
Open drains (sq. km) 13.0
Total sewerage connections (nos.) 0.0
Sewerage coverage: slums (%) 0.0
Installed STP treatment capacity (MLD) 0.0
Annual revenue receipts from WW (`) 0.0
Annual revenue expenditure on WW (`) 0.0
Annual capital expenditure on WW (`) 0.0
SOLID WASTE MANAGEMENTWaste generated (TPD) 7.0
Waste collected (TPD) 7.0
Quantity of waste treated (TPD) 0.0
Waste received at scientific landfill (TPD) 0.0
Door to door colln.(no. of households andestablishments)
3,600.0
Waste segregation at source (Y/N) Y
Annual revenue receipts from SW (`) 1,318,013.0
Annual revenue expenditure on SW (`) 0.0
Annual capital expenditure on SW (`) 0.0
41

Desaiganj Municipal Council
Service Level Benchmark Indicators
WATER SUPPLY
WASTE WATER
SOLID WASTE MANAGEMENT STORM WATER
Blank values represent 'zero', 'not applicable' or 'no data' in the charts above.
42

Deulgaon Raja Municipal Council Background
GENERAL INFORMATIONClass Class C No. of slum settlements 3
District Buldhana Slum population 3,905
Area (sq. km.) 8 Slum households 793
Total city population 30,466 Total annual city capital receipts (`) 47,907,000
Total households 6,931 Total annual city capital expenditure (`) 54,486,000
Density (persons per sq. km.) 3,856 Total annual city revenue receipts (`) 47,907,000
Total municipal staff 108 Total annual city revenue expenditure (`) 54,485,000
WATER SUPPLYTotal water produced (MLD) 2.7
Ground water (MLD) 0.3
Surface water (MLD) 2.4
Average daily volume treated (MLD) 1.8
Installed storage capacity (MLD) 1.3
Total water connections (nos.) 2,527.0
Water connections in slums (nos.) 247.0
Area covered by network (sq. km.) 7.9
No. of days of supply in a month 4.0
Annual revenue receipts from water (`) 2,339,000.0
Annual revenue expenditure on water (`) 3,806,000.0
Annual capital expenditure on water (`) 665,000.0
WASTE WATERArea covered by waste water network (sq. km.) 7.9
Underground sewerage network (sq. km) 0.0
Closed drains (sq. km) 0.0
Open drains (sq. km) 7.9
Total sewerage connections (nos.) 0.0
Sewerage coverage: slums (%) 0.0
Installed STP treatment capacity (MLD) 0.0
Annual revenue receipts from WW (`) 0.0
Annual revenue expenditure on WW (`) 1,362,000.0
Annual capital expenditure on WW (`) 797,000.0
SOLID WASTE MANAGEMENTWaste generated (TPD) 4.0
Waste collected (TPD) 4.0
Quantity of waste treated (TPD) 0.0
Waste received at scientific landfill (TPD) 0.0
Door to door colln.(no. of households andestablishments)
13,862.0
Waste segregation at source (Y/N) N
Annual revenue receipts from SW (`) 0.0
Annual revenue expenditure on SW (`) 3,428,000.0
Annual capital expenditure on SW (`) 3,428,000.0
43

Deulgaon Raja Municipal Council
Service Level Benchmark Indicators
WATER SUPPLY
WASTE WATER
SOLID WASTE MANAGEMENT STORM WATER
Blank values represent 'zero', 'not applicable' or 'no data' in the charts above.
44

Devlali Pravara Municipal Council Background
GENERAL INFORMATIONClass Class C No. of slum settlements 9
District Ahmednagar Slum population 4,875
Area (sq. km.) 43 Slum households 975
Total city population 34,345 Total annual city capital receipts (`) 85,072,000
Total households 6,916 Total annual city capital expenditure (`) 84,770,000
Density (persons per sq. km.) 791 Total annual city revenue receipts (`) 85,072,000
Total municipal staff 129 Total annual city revenue expenditure (`) 74,021,000
WATER SUPPLYTotal water produced (MLD) 3.0
Ground water (MLD) 0.0
Surface water (MLD) 3.0
Average daily volume treated (MLD) 3.0
Installed storage capacity (MLD) 29.5
Total water connections (nos.) 2,490.0
Water connections in slums (nos.) 295.0
Area covered by network (sq. km.) 43.4
No. of days of supply in a month 0.0
Annual revenue receipts from water (`) 2,195,000.0
Annual revenue expenditure on water (`) 4,740,000.0
Annual capital expenditure on water (`) 24,438,000.0
WASTE WATERArea covered by waste water network (sq. km.) 3.0
Underground sewerage network (sq. km) 0.0
Closed drains (sq. km) 0.0
Open drains (sq. km) 3.0
Total sewerage connections (nos.) 0.0
Sewerage coverage: slums (%) 0.0
Installed STP treatment capacity (MLD) 0.0
Annual revenue receipts from WW (`) 0.0
Annual revenue expenditure on WW (`) 0.0
Annual capital expenditure on WW (`) 5,805,000.0
SOLID WASTE MANAGEMENTWaste generated (TPD) 5.0
Waste collected (TPD) 5.0
Quantity of waste treated (TPD) 3.0
Waste received at scientific landfill (TPD) 0.0
Door to door colln.(no. of households andestablishments)
1,525.0
Waste segregation at source (Y/N) Y
Annual revenue receipts from SW (`) 2,925,000.0
Annual revenue expenditure on SW (`) 42,000.0
Annual capital expenditure on SW (`) 42,000.0
45

Devlali Pravara Municipal Council
Service Level Benchmark Indicators
WATER SUPPLY
WASTE WATER
SOLID WASTE MANAGEMENT STORM WATER
Blank values represent 'zero', 'not applicable' or 'no data' in the charts above.
46

Dhamangaon Railway Municipal Council Background
GENERAL INFORMATIONClass Class C No. of slum settlements 8
District Amravati Slum population 6,500
Area (sq. km.) 3 Slum households 1,080
Total city population 23,000 Total annual city capital receipts (`) 34,884,212
Total households 4,298 Total annual city capital expenditure (`) 24,767,000
Density (persons per sq. km.) 7,188 Total annual city revenue receipts (`) 57,919,000
Total municipal staff 39 Total annual city revenue expenditure (`) 22,810,000
WATER SUPPLYTotal water produced (MLD) 2.0
Ground water (MLD) 0.1
Surface water (MLD) 1.9
Average daily volume treated (MLD) 1.9
Installed storage capacity (MLD) 11.0
Total water connections (nos.) 2,555.0
Water connections in slums (nos.) 612.0
Area covered by network (sq. km.) 3.2
No. of days of supply in a month 30.0
Annual revenue receipts from water (`) 51,906,000.0
Annual revenue expenditure on water (`) 22,742,000.0
Annual capital expenditure on water (`) 6,817,000.0
WASTE WATERArea covered by waste water network (sq. km.) 3.2
Underground sewerage network (sq. km) 0.0
Closed drains (sq. km) 0.2
Open drains (sq. km) 3.0
Total sewerage connections (nos.) 0.0
Sewerage coverage: slums (%) 0.0
Installed STP treatment capacity (MLD) 0.0
Annual revenue receipts from WW (`) 0.0
Annual revenue expenditure on WW (`) 6,998,000.0
Annual capital expenditure on WW (`) 1,213,000.0
SOLID WASTE MANAGEMENTWaste generated (TPD) 7.0
Waste collected (TPD) 7.0
Quantity of waste treated (TPD) 0.0
Waste received at scientific landfill (TPD) 0.0
Door to door colln.(no. of households andestablishments)
4,059.0
Waste segregation at source (Y/N) N
Annual revenue receipts from SW (`) 0.0
Annual revenue expenditure on SW (`) 2,500,000.0
Annual capital expenditure on SW (`) 2,500,000.0
47

Dhamangaon Railway Municipal Council
Service Level Benchmark Indicators
WATER SUPPLY
WASTE WATER
SOLID WASTE MANAGEMENT STORM WATER
Blank values represent 'zero', 'not applicable' or 'no data' in the charts above.
48

Dharangaon Municipal Council Background
GENERAL INFORMATIONClass Class C No. of slum settlements 8
District Jalgaon Slum population 4,500
Area (sq. km.) 5 Slum households 880
Total city population 40,000 Total annual city capital receipts (`) 6,340,428
Total households 6,369 Total annual city capital expenditure (`) 4,500,781
Density (persons per sq. km.) 8,333 Total annual city revenue receipts (`) 31,953,401
Total municipal staff 159 Total annual city revenue expenditure (`) 18,695,891
WATER SUPPLYTotal water produced (MLD) 1.8
Ground water (MLD) 1.8
Surface water (MLD) 0.0
Average daily volume treated (MLD) 0.0
Installed storage capacity (MLD) 1.5
Total water connections (nos.) 3,443.0
Water connections in slums (nos.) 200.0
Area covered by network (sq. km.) 1.9
No. of days of supply in a month 20.0
Annual revenue receipts from water (`) 3,932,943.0
Annual revenue expenditure on water (`) 5,346,834.0
Annual capital expenditure on water (`) 0.0
WASTE WATERArea covered by waste water network (sq. km.) 0.0
Underground sewerage network (sq. km) 0.0
Closed drains (sq. km) 0.0
Open drains (sq. km) 0.0
Total sewerage connections (nos.) 0.0
Sewerage coverage: slums (%) 0.0
Installed STP treatment capacity (MLD) 0.0
Annual revenue receipts from WW (`) 0.0
Annual revenue expenditure on WW (`) 0.0
Annual capital expenditure on WW (`) 0.0
SOLID WASTE MANAGEMENTWaste generated (TPD) 8.0
Waste collected (TPD) 8.0
Quantity of waste treated (TPD) 0.0
Waste received at scientific landfill (TPD) 0.0
Door to door colln.(no. of households andestablishments)
7,573.0
Waste segregation at source (Y/N) N
Annual revenue receipts from SW (`) 0.0
Annual revenue expenditure on SW (`) 7,614,876.0
Annual capital expenditure on SW (`) 0.0
49

Dharangaon Municipal Council
Service Level Benchmark Indicators
WATER SUPPLY
WASTE WATER
SOLID WASTE MANAGEMENT STORM WATER
Blank values represent 'zero', 'not applicable' or 'no data' in the charts above.
50

Dharmabad Municipal Council Background
GENERAL INFORMATIONClass Class C No. of slum settlements 6
District Nanded Slum population 8,000
Area (sq. km.) 12 Slum households 1,500
Total city population 35,841 Total annual city capital receipts (`) 18,238,406
Total households 10,000 Total annual city capital expenditure (`) 10,752,248
Density (persons per sq. km.) 2,867 Total annual city revenue receipts (`) 40,240,511
Total municipal staff 76 Total annual city revenue expenditure (`) 16,673,570
WATER SUPPLYTotal water produced (MLD) 12.1
Ground water (MLD) 0.2
Surface water (MLD) 11.9
Average daily volume treated (MLD) 0.0
Installed storage capacity (MLD) 1.1
Total water connections (nos.) 2,202.0
Water connections in slums (nos.) 80.0
Area covered by network (sq. km.) 10.6
No. of days of supply in a month 30.0
Annual revenue receipts from water (`) 1,857,817.0
Annual revenue expenditure on water (`) 1,947,929.0
Annual capital expenditure on water (`) 279,777.0
WASTE WATERArea covered by waste water network (sq. km.) 5.5
Underground sewerage network (sq. km) 0.0
Closed drains (sq. km) 0.0
Open drains (sq. km) 5.5
Total sewerage connections (nos.) 0.0
Sewerage coverage: slums (%) 0.0
Installed STP treatment capacity (MLD) 0.0
Annual revenue receipts from WW (`) 0.0
Annual revenue expenditure on WW (`) 4,185,175.0
Annual capital expenditure on WW (`) 0.0
SOLID WASTE MANAGEMENTWaste generated (TPD) 8.0
Waste collected (TPD) 8.0
Quantity of waste treated (TPD) 0.0
Waste received at scientific landfill (TPD) 0.0
Door to door colln.(no. of households andestablishments)
6,180.0
Waste segregation at source (Y/N) N
Annual revenue receipts from SW (`) 0.0
Annual revenue expenditure on SW (`) 0.0
Annual capital expenditure on SW (`) 1,366,700.0
51

Dharmabad Municipal Council
Service Level Benchmark Indicators
WATER SUPPLY
WASTE WATER
SOLID WASTE MANAGEMENT STORM WATER
Blank values represent 'zero', 'not applicable' or 'no data' in the charts above.
52

Digras Municipal Council Background
GENERAL INFORMATIONClass Class C No. of slum settlements 9
District Yavatmal Slum population 10,030
Area (sq. km.) 11 Slum households 2,006
Total city population 44,986 Total annual city capital receipts (`) 32,283,989
Total households 7,579 Total annual city capital expenditure (`) 17,066,947
Density (persons per sq. km.) 3,946 Total annual city revenue receipts (`) 62,087,388
Total municipal staff 192 Total annual city revenue expenditure (`) 57,483,644
WATER SUPPLYTotal water produced (MLD) 5.2
Ground water (MLD) 0.7
Surface water (MLD) 4.5
Average daily volume treated (MLD) 5.0
Installed storage capacity (MLD) 2.5
Total water connections (nos.) 3,865.0
Water connections in slums (nos.) 393.0
Area covered by network (sq. km.) 8.0
No. of days of supply in a month 30.0
Annual revenue receipts from water (`) 3,186,671.0
Annual revenue expenditure on water (`) 7,520,869.0
Annual capital expenditure on water (`) 0.0
WASTE WATERArea covered by waste water network (sq. km.) 4.0
Underground sewerage network (sq. km) 0.0
Closed drains (sq. km) 0.0
Open drains (sq. km) 4.0
Total sewerage connections (nos.) 0.0
Sewerage coverage: slums (%) 0.0
Installed STP treatment capacity (MLD) 0.0
Annual revenue receipts from WW (`) 20,200.0
Annual revenue expenditure on WW (`) 7,987,301.0
Annual capital expenditure on WW (`) 0.0
SOLID WASTE MANAGEMENTWaste generated (TPD) 10.0
Waste collected (TPD) 10.0
Quantity of waste treated (TPD) 0.0
Waste received at scientific landfill (TPD) 0.0
Door to door colln.(no. of households andestablishments)
8,366.0
Waste segregation at source (Y/N) N
Annual revenue receipts from SW (`) 0.0
Annual revenue expenditure on SW (`) 620,332.0
Annual capital expenditure on SW (`) 1,690,663.0
53

Digras Municipal Council
Service Level Benchmark Indicators
WATER SUPPLY
WASTE WATER
SOLID WASTE MANAGEMENT STORM WATER
Blank values represent 'zero', 'not applicable' or 'no data' in the charts above.
54

Dudhani Municipal Council Background
GENERAL INFORMATIONClass Class C No. of slum settlements 4
District Solapur Slum population 1,500
Area (sq. km.) 2 Slum households 400
Total city population 14,105 Total annual city capital receipts (`) 4,475,578
Total households 2,275 Total annual city capital expenditure (`) 5,476,653
Density (persons per sq. km.) 8,816 Total annual city revenue receipts (`) 22,845,659
Total municipal staff 37 Total annual city revenue expenditure (`) 6,744,587
WATER SUPPLYTotal water produced (MLD) 0.6
Ground water (MLD) 0.3
Surface water (MLD) 0.3
Average daily volume treated (MLD) 0.3
Installed storage capacity (MLD) 0.8
Total water connections (nos.) 545.0
Water connections in slums (nos.) 0.0
Area covered by network (sq. km.) 1.6
No. of days of supply in a month 15.0
Annual revenue receipts from water (`) 617,800.0
Annual revenue expenditure on water (`) 914,888.0
Annual capital expenditure on water (`) 0.0
WASTE WATERArea covered by waste water network (sq. km.) 1.6
Underground sewerage network (sq. km) 0.0
Closed drains (sq. km) 0.0
Open drains (sq. km) 1.6
Total sewerage connections (nos.) 0.0
Sewerage coverage: slums (%) 0.0
Installed STP treatment capacity (MLD) 0.0
Annual revenue receipts from WW (`) 0.0
Annual revenue expenditure on WW (`) 0.0
Annual capital expenditure on WW (`) 0.0
SOLID WASTE MANAGEMENTWaste generated (TPD) 3.5
Waste collected (TPD) 3.5
Quantity of waste treated (TPD) 1.5
Waste received at scientific landfill (TPD) 0.0
Door to door colln.(no. of households andestablishments)
2,275.0
Waste segregation at source (Y/N) N
Annual revenue receipts from SW (`) 0.0
Annual revenue expenditure on SW (`) 0.0
Annual capital expenditure on SW (`) 0.0
55

Dudhani Municipal Council
Service Level Benchmark Indicators
WATER SUPPLY
WASTE WATER
SOLID WASTE MANAGEMENT STORM WATER
Blank values represent 'zero', 'not applicable' or 'no data' in the charts above.
56

Erandol Municipal Council Background
GENERAL INFORMATIONClass Class C No. of slum settlements 14
District Jalgaon Slum population 4,500
Area (sq. km.) 3 Slum households 862
Total city population 33,459 Total annual city capital receipts (`) 21,600,000
Total households 8,032 Total annual city capital expenditure (`) 33,000,000
Density (persons per sq. km.) 10,139 Total annual city revenue receipts (`) 41,300,000
Total municipal staff 103 Total annual city revenue expenditure (`) 8,000,024
WATER SUPPLYTotal water produced (MLD) 2.5
Ground water (MLD) 0.0
Surface water (MLD) 2.5
Average daily volume treated (MLD) 2.5
Installed storage capacity (MLD) 2.1
Total water connections (nos.) 4,093.0
Water connections in slums (nos.) 0.0
Area covered by network (sq. km.) 3.5
No. of days of supply in a month 15.0
Annual revenue receipts from water (`) 3,100,000.0
Annual revenue expenditure on water (`) 3,500,000.0
Annual capital expenditure on water (`) 0.0
WASTE WATERArea covered by waste water network (sq. km.) 3.5
Underground sewerage network (sq. km) 0.0
Closed drains (sq. km) 0.2
Open drains (sq. km) 3.3
Total sewerage connections (nos.) 0.0
Sewerage coverage: slums (%) 0.0
Installed STP treatment capacity (MLD) 0.0
Annual revenue receipts from WW (`) 0.0
Annual revenue expenditure on WW (`) 0.0
Annual capital expenditure on WW (`) 0.0
SOLID WASTE MANAGEMENTWaste generated (TPD) 6.0
Waste collected (TPD) 6.0
Quantity of waste treated (TPD) 0.0
Waste received at scientific landfill (TPD) 0.0
Door to door colln.(no. of households andestablishments)
4,015.0
Waste segregation at source (Y/N) N
Annual revenue receipts from SW (`) 100,000.0
Annual revenue expenditure on SW (`) 0.0
Annual capital expenditure on SW (`) 0.0
57

Erandol Municipal Council
Service Level Benchmark Indicators
WATER SUPPLY
WASTE WATER
SOLID WASTE MANAGEMENT STORM WATER
Blank values represent 'zero', 'not applicable' or 'no data' in the charts above.
58

Faizpur Municipal Council Background
GENERAL INFORMATIONClass Class C No. of slum settlements 2
District Jalgaon Slum population 2,000
Area (sq. km.) 3 Slum households 456
Total city population 25,803 Total annual city capital receipts (`) 10,689,000
Total households 4,617 Total annual city capital expenditure (`) 20,620,000
Density (persons per sq. km.) 8,601 Total annual city revenue receipts (`) 47,277,000
Total municipal staff 118 Total annual city revenue expenditure (`) 56,742,000
WATER SUPPLYTotal water produced (MLD) 3.0
Ground water (MLD) 0.0
Surface water (MLD) 3.0
Average daily volume treated (MLD) 3.0
Installed storage capacity (MLD) 1.8
Total water connections (nos.) 3,530.0
Water connections in slums (nos.) 40.0
Area covered by network (sq. km.) 4.0
No. of days of supply in a month 30.0
Annual revenue receipts from water (`) 3,239,000.0
Annual revenue expenditure on water (`) 5,115,000.0
Annual capital expenditure on water (`) 798,000.0
WASTE WATERArea covered by waste water network (sq. km.) 3.6
Underground sewerage network (sq. km) 0.0
Closed drains (sq. km) 0.8
Open drains (sq. km) 2.8
Total sewerage connections (nos.) 0.0
Sewerage coverage: slums (%) 0.0
Installed STP treatment capacity (MLD) 0.0
Annual revenue receipts from WW (`) 0.0
Annual revenue expenditure on WW (`) 0.0
Annual capital expenditure on WW (`) 0.0
SOLID WASTE MANAGEMENTWaste generated (TPD) 6.0
Waste collected (TPD) 6.0
Quantity of waste treated (TPD) 0.0
Waste received at scientific landfill (TPD) 0.0
Door to door colln.(no. of households andestablishments)
956.0
Waste segregation at source (Y/N) N
Annual revenue receipts from SW (`) 965,000.0
Annual revenue expenditure on SW (`) 2,457,000.0
Annual capital expenditure on SW (`) 2,457,000.0
59
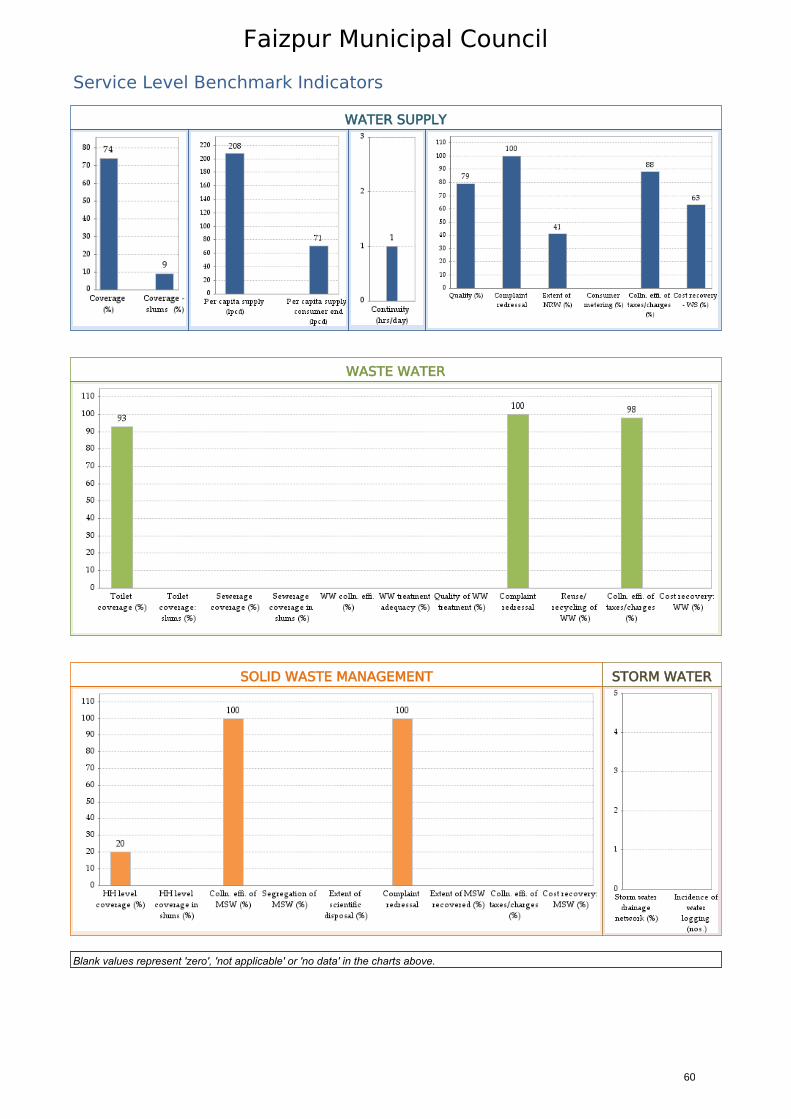
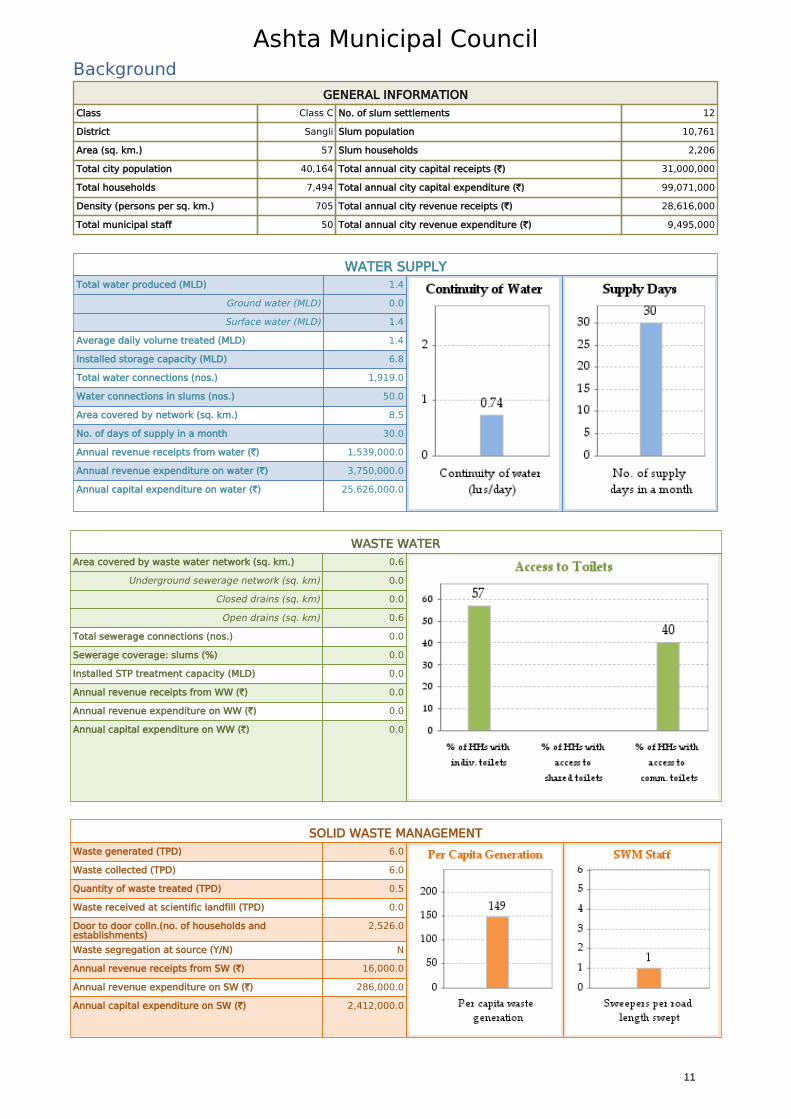
Faizpur Municipal Council
Service Level Benchmark Indicators
WATER SUPPLY
WASTE WATER
SOLID WASTE MANAGEMENT STORM WATER
Blank values represent 'zero', 'not applicable' or 'no data' in the charts above.
60

Gadhinglaj Municipal Council Background
GENERAL INFORMATIONClass Class C No. of slum settlements 6
District Kolhapur Slum population 1,286
Area (sq. km.) 3 Slum households 245
Total city population 29,600 Total annual city capital receipts (`) 25,647,421
Total households 6,895 Total annual city capital expenditure (`) 24,876,310
Density (persons per sq. km.) 8,706 Total annual city revenue receipts (`) 93,601,168
Total municipal staff 199 Total annual city revenue expenditure (`) 87,846,867
WATER SUPPLYTotal water produced (MLD) 3.7
Ground water (MLD) 0.0
Surface water (MLD) 3.7
Average daily volume treated (MLD) 3.6
Installed storage capacity (MLD) 1.7
Total water connections (nos.) 4,478.0
Water connections in slums (nos.) 3.0
Area covered by network (sq. km.) 3.4
No. of days of supply in a month 27.0
Annual revenue receipts from water (`) 5,288,737.0
Annual revenue expenditure on water (`) 8,288,649.0
Annual capital expenditure on water (`) 905,528.0
WASTE WATERArea covered by waste water network (sq. km.) 3.4
Underground sewerage network (sq. km) 0.0
Closed drains (sq. km) 0.6
Open drains (sq. km) 2.8
Total sewerage connections (nos.) 0.0
Sewerage coverage: slums (%) 0.0
Installed STP treatment capacity (MLD) 0.0
Annual revenue receipts from WW (`) 0.0
Annual revenue expenditure on WW (`) 0.0
Annual capital expenditure on WW (`) 0.0
SOLID WASTE MANAGEMENTWaste generated (TPD) 7.5
Waste collected (TPD) 7.5
Quantity of waste treated (TPD) 2.5
Waste received at scientific landfill (TPD) 0.0
Door to door colln.(no. of households andestablishments)
3,338.0
Waste segregation at source (Y/N) Y
Annual revenue receipts from SW (`) 0.0
Annual revenue expenditure on SW (`) 0.0
Annual capital expenditure on SW (`) 0.0
61

Gadhinglaj Municipal Council
Service Level Benchmark Indicators
WATER SUPPLY
WASTE WATER
SOLID WASTE MANAGEMENT STORM WATER
Blank values represent 'zero', 'not applicable' or 'no data' in the charts above.
62

Gangapur Municipal Council Background
GENERAL INFORMATIONClass Class C No. of slum settlements 0
District Aurangabad Slum population 0
Area (sq. km.) 22 Slum households 0
Total city population 27,909 Total annual city capital receipts (`) 27,802,341
Total households 5,077 Total annual city capital expenditure (`) 49,954,000
Density (persons per sq. km.) 1,252 Total annual city revenue receipts (`) 19,621,595
Total municipal staff 53 Total annual city revenue expenditure (`) 50,054,000
WATER SUPPLYTotal water produced (MLD) 2.4
Ground water (MLD) 0.0
Surface water (MLD) 2.4
Average daily volume treated (MLD) 2.2
Installed storage capacity (MLD) 1.1
Total water connections (nos.) 2,644.0
Water connections in slums (nos.) 0.0
Area covered by network (sq. km.) 9.0
No. of days of supply in a month 15.0
Annual revenue receipts from water (`) 1,472,000.0
Annual revenue expenditure on water (`) 4,346,000.0
Annual capital expenditure on water (`) 4,345,000.0
WASTE WATERArea covered by waste water network (sq. km.) 2.0
Underground sewerage network (sq. km) 0.0
Closed drains (sq. km) 0.0
Open drains (sq. km) 2.0
Total sewerage connections (nos.) 0.0
Sewerage coverage: slums (%) 0.0
Installed STP treatment capacity (MLD) 0.0
Annual revenue receipts from WW (`) 0.0
Annual revenue expenditure on WW (`) 9,000.0
Annual capital expenditure on WW (`) 9,000.0
SOLID WASTE MANAGEMENTWaste generated (TPD) 6.2
Waste collected (TPD) 0.0
Quantity of waste treated (TPD) 0.0
Waste received at scientific landfill (TPD) 0.0
Door to door colln.(no. of households andestablishments)
2,563.0
Waste segregation at source (Y/N) N
Annual revenue receipts from SW (`) 0.0
Annual revenue expenditure on SW (`) 238,000.0
Annual capital expenditure on SW (`) 238,000.0
63

Gangapur Municipal Council
Service Level Benchmark Indicators
WATER SUPPLY
WASTE WATER
SOLID WASTE MANAGEMENT STORM WATER
Blank values represent 'zero', 'not applicable' or 'no data' in the charts above.
64

Georai Municipal Council Background
GENERAL INFORMATIONClass Class C No. of slum settlements 0
District Beed Slum population 0
Area (sq. km.) 4 Slum households 0
Total city population 33,051 Total annual city capital receipts (`) 22,435,000
Total households 5,979 Total annual city capital expenditure (`) 20,263,000
Density (persons per sq. km.) 7,686 Total annual city revenue receipts (`) 49,000,000
Total municipal staff 139 Total annual city revenue expenditure (`) 45,139,000
WATER SUPPLYTotal water produced (MLD) 3.5
Ground water (MLD) 0.0
Surface water (MLD) 3.5
Average daily volume treated (MLD) 3.5
Installed storage capacity (MLD) 3.5
Total water connections (nos.) 4,633.0
Water connections in slums (nos.) 0.0
Area covered by network (sq. km.) 4.2
No. of days of supply in a month 30.0
Annual revenue receipts from water (`) 3,469,000.0
Annual revenue expenditure on water (`) 5,560,000.0
Annual capital expenditure on water (`) 0.0
WASTE WATERArea covered by waste water network (sq. km.) 0.0
Underground sewerage network (sq. km) 0.0
Closed drains (sq. km) 0.0
Open drains (sq. km) 0.0
Total sewerage connections (nos.) 0.0
Sewerage coverage: slums (%) 0.0
Installed STP treatment capacity (MLD) 0.0
Annual revenue receipts from WW (`) 0.0
Annual revenue expenditure on WW (`) 0.0
Annual capital expenditure on WW (`) 0.0
SOLID WASTE MANAGEMENTWaste generated (TPD) 7.5
Waste collected (TPD) 7.0
Quantity of waste treated (TPD) 0.0
Waste received at scientific landfill (TPD) 0.0
Door to door colln.(no. of households andestablishments)
3,040.0
Waste segregation at source (Y/N) N
Annual revenue receipts from SW (`) 0.0
Annual revenue expenditure on SW (`) 0.0
Annual capital expenditure on SW (`) 1,034,000.0
65

Georai Municipal Council
Service Level Benchmark Indicators
WATER SUPPLY
WASTE WATER
SOLID WASTE MANAGEMENT STORM WATER
Blank values represent 'zero', 'not applicable' or 'no data' in the charts above.
66

Ghatanji Municipal Council Background
GENERAL INFORMATIONClass Class C No. of slum settlements 10
District Yavatmal Slum population 4,536
Area (sq. km.) 11 Slum households 900
Total city population 23,218 Total annual city capital receipts (`) 28,757,000
Total households 6,221 Total annual city capital expenditure (`) 13,491,000
Density (persons per sq. km.) 2,130 Total annual city revenue receipts (`) 29,996,000
Total municipal staff 53 Total annual city revenue expenditure (`) 18,044,000
WATER SUPPLYTotal water produced (MLD) 2.0
Ground water (MLD) 0.3
Surface water (MLD) 1.7
Average daily volume treated (MLD) 1.7
Installed storage capacity (MLD) 0.8
Total water connections (nos.) 1,715.0
Water connections in slums (nos.) 670.0
Area covered by network (sq. km.) 8.0
No. of days of supply in a month 30.0
Annual revenue receipts from water (`) 2,066,000.0
Annual revenue expenditure on water (`) 2,498,000.0
Annual capital expenditure on water (`) 1,409,000.0
WASTE WATERArea covered by waste water network (sq. km.) 0.0
Underground sewerage network (sq. km) 0.0
Closed drains (sq. km) 0.0
Open drains (sq. km) 0.0
Total sewerage connections (nos.) 0.0
Sewerage coverage: slums (%) 0.0
Installed STP treatment capacity (MLD) 0.0
Annual revenue receipts from WW (`) 0.0
Annual revenue expenditure on WW (`) 0.0
Annual capital expenditure on WW (`) 740,000.0
SOLID WASTE MANAGEMENTWaste generated (TPD) 6.0
Waste collected (TPD) 6.0
Quantity of waste treated (TPD) 0.0
Waste received at scientific landfill (TPD) 0.0
Door to door colln.(no. of households andestablishments)
6,738.0
Waste segregation at source (Y/N) N
Annual revenue receipts from SW (`) 0.0
Annual revenue expenditure on SW (`) 3,206,000.0
Annual capital expenditure on SW (`) 1,775,000.0
67

Ghatanji Municipal Council
Service Level Benchmark Indicators
WATER SUPPLY
WASTE WATER
SOLID WASTE MANAGEMENT STORM WATER
Blank values represent 'zero', 'not applicable' or 'no data' in the charts above.
68

Hadgaon Municipal Council Background
GENERAL INFORMATIONClass Class C No. of slum settlements 3
District Nanded Slum population 1,850
Area (sq. km.) 16 Slum households 400
Total city population 35,000 Total annual city capital receipts (`) 0
Total households 7,000 Total annual city capital expenditure (`) 0
Density (persons per sq. km.) 2,188 Total annual city revenue receipts (`) 29,226,000
Total municipal staff 65 Total annual city revenue expenditure (`) 28,938,000
WATER SUPPLYTotal water produced (MLD) 1.5
Ground water (MLD) 1.5
Surface water (MLD) 0.0
Average daily volume treated (MLD) 0.0
Installed storage capacity (MLD) 1.2
Total water connections (nos.) 2,336.0
Water connections in slums (nos.) 100.0
Area covered by network (sq. km.) 10.0
No. of days of supply in a month 15.0
Annual revenue receipts from water (`) 1,539,000.0
Annual revenue expenditure on water (`) 2,169,000.0
Annual capital expenditure on water (`) 0.0
WASTE WATERArea covered by waste water network (sq. km.) 1.5
Underground sewerage network (sq. km) 0.0
Closed drains (sq. km) 0.0
Open drains (sq. km) 1.5
Total sewerage connections (nos.) 0.0
Sewerage coverage: slums (%) 0.0
Installed STP treatment capacity (MLD) 0.0
Annual revenue receipts from WW (`) 0.0
Annual revenue expenditure on WW (`) 0.0
Annual capital expenditure on WW (`) 0.0
SOLID WASTE MANAGEMENTWaste generated (TPD) 7.0
Waste collected (TPD) 7.0
Quantity of waste treated (TPD) 0.0
Waste received at scientific landfill (TPD) 0.0
Door to door colln.(no. of households andestablishments)
4,439.0
Waste segregation at source (Y/N) N
Annual revenue receipts from SW (`) 0.0
Annual revenue expenditure on SW (`) 1,538,000.0
Annual capital expenditure on SW (`) 0.0
69

Hadgaon Municipal Council
Service Level Benchmark Indicators
WATER SUPPLY
WASTE WATER
SOLID WASTE MANAGEMENT STORM WATER
Blank values represent 'zero', 'not applicable' or 'no data' in the charts above.
70

Igatpuri Municipal Council Background
GENERAL INFORMATIONClass Class C No. of slum settlements 3
District Nashik Slum population 682
Area (sq. km.) 29 Slum households 135
Total city population 39,450 Total annual city capital receipts (`) 29,236,129
Total households 7,890 Total annual city capital expenditure (`) 26,003,453
Density (persons per sq. km.) 1,360 Total annual city revenue receipts (`) 46,553,096
Total municipal staff 91 Total annual city revenue expenditure (`) 32,626,748
WATER SUPPLYTotal water produced (MLD) 2.8
Ground water (MLD) 0.0
Surface water (MLD) 2.8
Average daily volume treated (MLD) 1.6
Installed storage capacity (MLD) 1.2
Total water connections (nos.) 3,667.0
Water connections in slums (nos.) 0.0
Area covered by network (sq. km.) 15.8
No. of days of supply in a month 12.0
Annual revenue receipts from water (`) 3,438,246.0
Annual revenue expenditure on water (`) 7,482,314.0
Annual capital expenditure on water (`) 4,608,330.0
WASTE WATERArea covered by waste water network (sq. km.) 15.8
Underground sewerage network (sq. km) 0.0
Closed drains (sq. km) 0.0
Open drains (sq. km) 15.8
Total sewerage connections (nos.) 0.0
Sewerage coverage: slums (%) 0.0
Installed STP treatment capacity (MLD) 0.0
Annual revenue receipts from WW (`) 0.0
Annual revenue expenditure on WW (`) 0.0
Annual capital expenditure on WW (`) 0.0
SOLID WASTE MANAGEMENTWaste generated (TPD) 6.0
Waste collected (TPD) 6.0
Quantity of waste treated (TPD) 0.0
Waste received at scientific landfill (TPD) 0.0
Door to door colln.(no. of households andestablishments)
4,237.0
Waste segregation at source (Y/N) N
Annual revenue receipts from SW (`) 0.0
Annual revenue expenditure on SW (`) 2,445,737.0
Annual capital expenditure on SW (`) 2,445,737.0
71

Igatpuri Municipal Council
Service Level Benchmark Indicators
WATER SUPPLY
WASTE WATER
SOLID WASTE MANAGEMENT STORM WATER
Blank values represent 'zero', 'not applicable' or 'no data' in the charts above.
72

Indapur Municipal Council Background
GENERAL INFORMATIONClass Class C No. of slum settlements 3
District Pune Slum population 750
Area (sq. km.) 3 Slum households 150
Total city population 22,351 Total annual city capital receipts (`) 0
Total households 5,663 Total annual city capital expenditure (`) 0
Density (persons per sq. km.) 7,450 Total annual city revenue receipts (`) 0
Total municipal staff 162 Total annual city revenue expenditure (`) 0
WATER SUPPLYTotal water produced (MLD) 3.2
Ground water (MLD) 0.2
Surface water (MLD) 3.0
Average daily volume treated (MLD) 2.3
Installed storage capacity (MLD) 4.0
Total water connections (nos.) 2,985.0
Water connections in slums (nos.) 0.0
Area covered by network (sq. km.) 3.0
No. of days of supply in a month 30.0
Annual revenue receipts from water (`) 0.0
Annual revenue expenditure on water (`) 0.0
Annual capital expenditure on water (`) 0.0
WASTE WATERArea covered by waste water network (sq. km.) 1.5
Underground sewerage network (sq. km) 0.0
Closed drains (sq. km) 0.5
Open drains (sq. km) 1.0
Total sewerage connections (nos.) 0.0
Sewerage coverage: slums (%) 0.0
Installed STP treatment capacity (MLD) 0.0
Annual revenue receipts from WW (`) 0.0
Annual revenue expenditure on WW (`) 0.0
Annual capital expenditure on WW (`) 0.0
SOLID WASTE MANAGEMENTWaste generated (TPD) 5.0
Waste collected (TPD) 5.0
Quantity of waste treated (TPD) 0.0
Waste received at scientific landfill (TPD) 0.0
Door to door colln.(no. of households andestablishments)
3,898.0
Waste segregation at source (Y/N) N
Annual revenue receipts from SW (`) 0.0
Annual revenue expenditure on SW (`) 0.0
Annual capital expenditure on SW (`) 0.0
73

Indapur Municipal Council
Service Level Benchmark Indicators
WATER SUPPLY
WASTE WATER
SOLID WASTE MANAGEMENT STORM WATER
Blank values represent 'zero', 'not applicable' or 'no data' in the charts above.
74

Jalgaon (Jamod) Municipal Council Background
GENERAL INFORMATIONClass Class C No. of slum settlements 5
District Buldhana Slum population 4,000
Area (sq. km.) 0 Slum households 800
Total city population 30,053 Total annual city capital receipts (`) 34,298,000
Total households 5,034 Total annual city capital expenditure (`) 28,189,000
Density (persons per sq. km.) 0 Total annual city revenue receipts (`) 34,395,000
Total municipal staff 51 Total annual city revenue expenditure (`) 54,001,000
WATER SUPPLYTotal water produced (MLD) 0.9
Ground water (MLD) 0.9
Surface water (MLD) 0.0
Average daily volume treated (MLD) 0.0
Installed storage capacity (MLD) 9.8
Total water connections (nos.) 1,949.0
Water connections in slums (nos.) 0.0
Area covered by network (sq. km.) 2.0
No. of days of supply in a month 0.0
Annual revenue receipts from water (`) 0.0
Annual revenue expenditure on water (`) 0.0
Annual capital expenditure on water (`) 0.0
WASTE WATERArea covered by waste water network (sq. km.) 1.8
Underground sewerage network (sq. km) 0.0
Closed drains (sq. km) 0.0
Open drains (sq. km) 1.8
Total sewerage connections (nos.) 0.0
Sewerage coverage: slums (%) 0.0
Installed STP treatment capacity (MLD) 0.0
Annual revenue receipts from WW (`) 0.0
Annual revenue expenditure on WW (`) 0.0
Annual capital expenditure on WW (`) 0.0
SOLID WASTE MANAGEMENTWaste generated (TPD) 6.0
Waste collected (TPD) 6.0
Quantity of waste treated (TPD) 0.0
Waste received at scientific landfill (TPD) 0.0
Door to door colln.(no. of households andestablishments)
0.0
Waste segregation at source (Y/N) nd
Annual revenue receipts from SW (`) 0.0
Annual revenue expenditure on SW (`) 0.0
Annual capital expenditure on SW (`) 0.0
75

Jalgaon (Jamod) Municipal Council
Service Level Benchmark Indicators
WATER SUPPLY
WASTE WATER
SOLID WASTE MANAGEMENT STORM WATER
Blank values represent 'zero', 'not applicable' or 'no data' in the charts above.
76

Jamner Municipal Council Background
GENERAL INFORMATIONClass Class C No. of slum settlements 0
District Jalgaon Slum population 0
Area (sq. km.) 41 Slum households 0
Total city population 45,075 Total annual city capital receipts (`) 107,301,641
Total households 9,022 Total annual city capital expenditure (`) 75,532,618
Density (persons per sq. km.) 1,108 Total annual city revenue receipts (`) 498,725,000
Total municipal staff 125 Total annual city revenue expenditure (`) 515,359,000
WATER SUPPLYTotal water produced (MLD) 3.3
Ground water (MLD) 0.3
Surface water (MLD) 3.0
Average daily volume treated (MLD) 0.0
Installed storage capacity (MLD) 2.0
Total water connections (nos.) 4,606.0
Water connections in slums (nos.) 0.0
Area covered by network (sq. km.) 2.5
No. of days of supply in a month 10.0
Annual revenue receipts from water (`) 76,070,000.0
Annual revenue expenditure on water (`) 94,320,000.0
Annual capital expenditure on water (`) 23,866,355.0
WASTE WATERArea covered by waste water network (sq. km.) 2.5
Underground sewerage network (sq. km) 0.0
Closed drains (sq. km) 0.0
Open drains (sq. km) 2.5
Total sewerage connections (nos.) 0.0
Sewerage coverage: slums (%) 0.0
Installed STP treatment capacity (MLD) 0.0
Annual revenue receipts from WW (`) 0.0
Annual revenue expenditure on WW (`) 5,525,000.0
Annual capital expenditure on WW (`) 78,964.0
SOLID WASTE MANAGEMENTWaste generated (TPD) 8.0
Waste collected (TPD) 8.0
Quantity of waste treated (TPD) 8.0
Waste received at scientific landfill (TPD) 0.0
Door to door colln.(no. of households andestablishments)
5,847.0
Waste segregation at source (Y/N) Y
Annual revenue receipts from SW (`) 60,250,000.0
Annual revenue expenditure on SW (`) 60,000,000.0
Annual capital expenditure on SW (`) 4,835,062.0
77

Jamner Municipal Council
Service Level Benchmark Indicators
WATER SUPPLY
WASTE WATER
SOLID WASTE MANAGEMENT STORM WATER
Blank values represent 'zero', 'not applicable' or 'no data' in the charts above.
78

Jawhar Municipal Council Background
GENERAL INFORMATIONClass Class C No. of slum settlements 0
District Thane Slum population 0
Area (sq. km.) 4 Slum households 0
Total city population 20,000 Total annual city capital receipts (`) 47,240,000
Total households 4,000 Total annual city capital expenditure (`) 10,519,000
Density (persons per sq. km.) 5,714 Total annual city revenue receipts (`) 15,319,000
Total municipal staff 66 Total annual city revenue expenditure (`) 16,210,000
WATER SUPPLYTotal water produced (MLD) 2.0
Ground water (MLD) 0.0
Surface water (MLD) 2.0
Average daily volume treated (MLD) 1.5
Installed storage capacity (MLD) 0.6
Total water connections (nos.) 1,757.0
Water connections in slums (nos.) 0.0
Area covered by network (sq. km.) 3.5
No. of days of supply in a month 30.0
Annual revenue receipts from water (`) 2,122,000.0
Annual revenue expenditure on water (`) 3,786,000.0
Annual capital expenditure on water (`) 2,806,000.0
WASTE WATERArea covered by waste water network (sq. km.) 3.5
Underground sewerage network (sq. km) 0.0
Closed drains (sq. km) 0.0
Open drains (sq. km) 3.5
Total sewerage connections (nos.) 0.0
Sewerage coverage: slums (%) 0.0
Installed STP treatment capacity (MLD) 0.0
Annual revenue receipts from WW (`) 0.0
Annual revenue expenditure on WW (`) 0.0
Annual capital expenditure on WW (`) 10,400.0
SOLID WASTE MANAGEMENTWaste generated (TPD) 3.0
Waste collected (TPD) 3.0
Quantity of waste treated (TPD) 0.0
Waste received at scientific landfill (TPD) 0.0
Door to door colln.(no. of households andestablishments)
1,800.0
Waste segregation at source (Y/N) N
Annual revenue receipts from SW (`) 0.0
Annual revenue expenditure on SW (`) 1,799,000.0
Annual capital expenditure on SW (`) 865,000.0
79

Jawhar Municipal Council
Service Level Benchmark Indicators
WATER SUPPLY
WASTE WATER
SOLID WASTE MANAGEMENT STORM WATER
Blank values represent 'zero', 'not applicable' or 'no data' in the charts above.
80

Jejuri Municipal Council Background
GENERAL INFORMATIONClass Class C No. of slum settlements 5
District Pune Slum population 2,200
Area (sq. km.) 7 Slum households 540
Total city population 15,000 Total annual city capital receipts (`) 64,280,000
Total households 3,319 Total annual city capital expenditure (`) 47,937,000
Density (persons per sq. km.) 2,239 Total annual city revenue receipts (`) 64,280,000
Total municipal staff 66 Total annual city revenue expenditure (`) 47,936,000
WATER SUPPLYTotal water produced (MLD) 3.0
Ground water (MLD) 0.0
Surface water (MLD) 3.0
Average daily volume treated (MLD) 3.0
Installed storage capacity (MLD) 3.0
Total water connections (nos.) 2,101.0
Water connections in slums (nos.) 170.0
Area covered by network (sq. km.) 0.0
No. of days of supply in a month 30.0
Annual revenue receipts from water (`) 1,658,000.0
Annual revenue expenditure on water (`) 5,869,000.0
Annual capital expenditure on water (`) 0.0
WASTE WATERArea covered by waste water network (sq. km.) 0.0
Underground sewerage network (sq. km) 0.0
Closed drains (sq. km) 0.0
Open drains (sq. km) 0.0
Total sewerage connections (nos.) 0.0
Sewerage coverage: slums (%) 0.0
Installed STP treatment capacity (MLD) 0.0
Annual revenue receipts from WW (`) 0.0
Annual revenue expenditure on WW (`) 0.0
Annual capital expenditure on WW (`) 0.0
SOLID WASTE MANAGEMENTWaste generated (TPD) 3.0
Waste collected (TPD) 3.0
Quantity of waste treated (TPD) 0.0
Waste received at scientific landfill (TPD) 0.0
Door to door colln.(no. of households andestablishments)
3,424.0
Waste segregation at source (Y/N) N
Annual revenue receipts from SW (`) 0.0
Annual revenue expenditure on SW (`) 0.0
Annual capital expenditure on SW (`) 0.0
81

Jejuri Municipal Council
Service Level Benchmark Indicators
WATER SUPPLY
WASTE WATER
SOLID WASTE MANAGEMENT STORM WATER
Blank values represent 'zero', 'not applicable' or 'no data' in the charts above.
82

Jintur Municipal Council Background
GENERAL INFORMATIONClass Class C No. of slum settlements 2
District Parbhani Slum population 3,972
Area (sq. km.) 26 Slum households 462
Total city population 46,255 Total annual city capital receipts (`) 44,016,989
Total households 7,891 Total annual city capital expenditure (`) 42,133,252
Density (persons per sq. km.) 1,793 Total annual city revenue receipts (`) 44,016,989
Total municipal staff 127 Total annual city revenue expenditure (`) 42,133,252
WATER SUPPLYTotal water produced (MLD) 3.0
Ground water (MLD) 0.0
Surface water (MLD) 3.0
Average daily volume treated (MLD) 2.5
Installed storage capacity (MLD) 1.7
Total water connections (nos.) 4,310.0
Water connections in slums (nos.) 0.0
Area covered by network (sq. km.) 4.5
No. of days of supply in a month 30.0
Annual revenue receipts from water (`) 2,839,377.0
Annual revenue expenditure on water (`) 4,164,202.0
Annual capital expenditure on water (`) 4,399,202.0
WASTE WATERArea covered by waste water network (sq. km.) 4.5
Underground sewerage network (sq. km) 0.0
Closed drains (sq. km) 0.0
Open drains (sq. km) 4.5
Total sewerage connections (nos.) 0.0
Sewerage coverage: slums (%) 0.0
Installed STP treatment capacity (MLD) 0.0
Annual revenue receipts from WW (`) 0.0
Annual revenue expenditure on WW (`) 0.0
Annual capital expenditure on WW (`) 0.0
SOLID WASTE MANAGEMENTWaste generated (TPD) 15.0
Waste collected (TPD) 12.0
Quantity of waste treated (TPD) 0.0
Waste received at scientific landfill (TPD) 0.0
Door to door colln.(no. of households andestablishments)
3,263.0
Waste segregation at source (Y/N) N
Annual revenue receipts from SW (`) 2,988,000.0
Annual revenue expenditure on SW (`) 7,550,276.0
Annual capital expenditure on SW (`) 1,494,205.0
83

Jintur Municipal Council
Service Level Benchmark Indicators
WATER SUPPLY
WASTE WATER
SOLID WASTE MANAGEMENT STORM WATER
Blank values represent 'zero', 'not applicable' or 'no data' in the charts above.
84

Junnar Municipal Council Background
GENERAL INFORMATIONClass Class C No. of slum settlements 2
District Pune Slum population 1,250
Area (sq. km.) 3 Slum households 250
Total city population 28,220 Total annual city capital receipts (`) 18,109,000
Total households 6,000 Total annual city capital expenditure (`) 16,930,000
Density (persons per sq. km.) 10,452 Total annual city revenue receipts (`) 91,204,000
Total municipal staff 86 Total annual city revenue expenditure (`) 55,430,000
WATER SUPPLYTotal water produced (MLD) 2.2
Ground water (MLD) 0.0
Surface water (MLD) 2.2
Average daily volume treated (MLD) 2.0
Installed storage capacity (MLD) 2.0
Total water connections (nos.) 3,288.0
Water connections in slums (nos.) 1.0
Area covered by network (sq. km.) 2.7
No. of days of supply in a month 30.0
Annual revenue receipts from water (`) 3,457,000.2
Annual revenue expenditure on water (`) 4,508,000.4
Annual capital expenditure on water (`) 680,000.0
WASTE WATERArea covered by waste water network (sq. km.) 0.0
Underground sewerage network (sq. km) 0.0
Closed drains (sq. km) 0.0
Open drains (sq. km) 0.0
Total sewerage connections (nos.) 0.0
Sewerage coverage: slums (%) 0.0
Installed STP treatment capacity (MLD) 0.0
Annual revenue receipts from WW (`) 393,000.0
Annual revenue expenditure on WW (`) 1,620,000.0
Annual capital expenditure on WW (`) 905,000.0
SOLID WASTE MANAGEMENTWaste generated (TPD) 7.5
Waste collected (TPD) 7.0
Quantity of waste treated (TPD) 0.0
Waste received at scientific landfill (TPD) 0.0
Door to door colln.(no. of households andestablishments)
6,387.0
Waste segregation at source (Y/N) N
Annual revenue receipts from SW (`) 1,912,000.0
Annual revenue expenditure on SW (`) 113,000.0
Annual capital expenditure on SW (`) 113,000.0
85
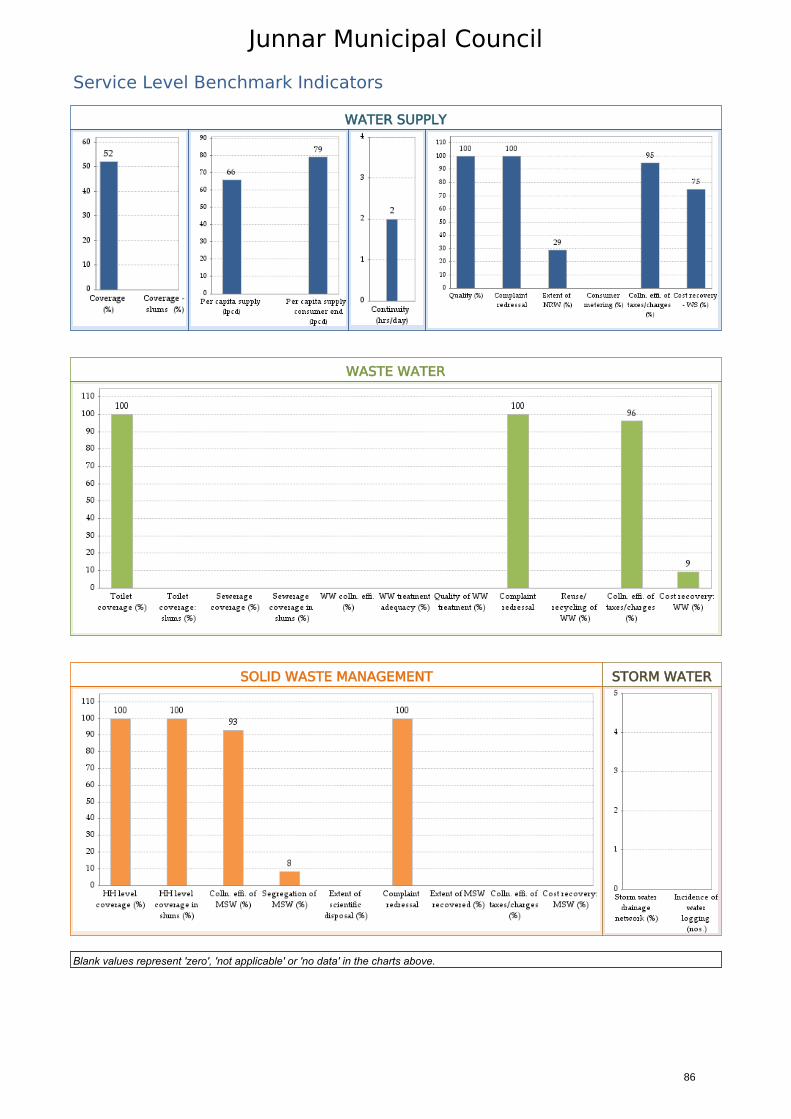
Junnar Municipal Council
Service Level Benchmark Indicators
WATER SUPPLY
WASTE WATER
SOLID WASTE MANAGEMENT STORM WATER
Blank values represent 'zero', 'not applicable' or 'no data' in the charts above.
86
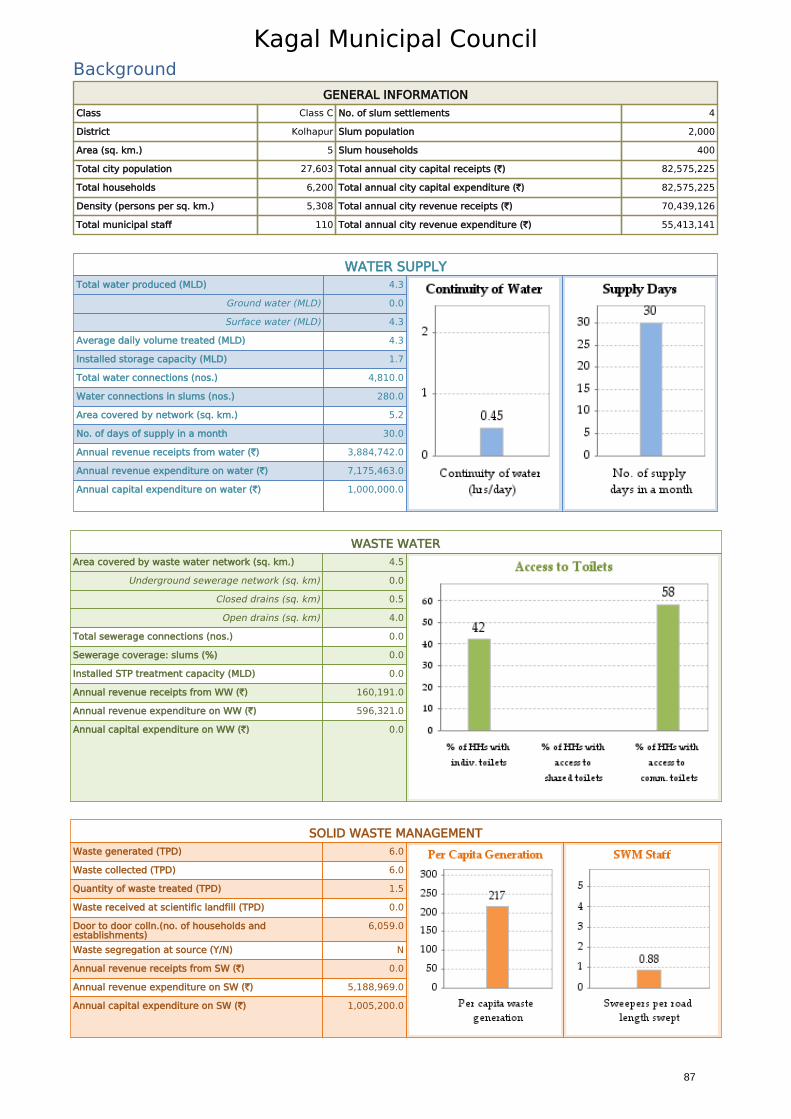
Kagal Municipal Council Background
GENERAL INFORMATIONClass Class C No. of slum settlements 4
District Kolhapur Slum population 2,000
Area (sq. km.) 5 Slum households 400
Total city population 27,603 Total annual city capital receipts (`) 82,575,225
Total households 6,200 Total annual city capital expenditure (`) 82,575,225
Density (persons per sq. km.) 5,308 Total annual city revenue receipts (`) 70,439,126
Total municipal staff 110 Total annual city revenue expenditure (`) 55,413,141
WATER SUPPLYTotal water produced (MLD) 4.3
Ground water (MLD) 0.0
Surface water (MLD) 4.3
Average daily volume treated (MLD) 4.3
Installed storage capacity (MLD) 1.7
Total water connections (nos.) 4,810.0
Water connections in slums (nos.) 280.0
Area covered by network (sq. km.) 5.2
No. of days of supply in a month 30.0
Annual revenue receipts from water (`) 3,884,742.0
Annual revenue expenditure on water (`) 7,175,463.0
Annual capital expenditure on water (`) 1,000,000.0
WASTE WATERArea covered by waste water network (sq. km.) 4.5
Underground sewerage network (sq. km) 0.0
Closed drains (sq. km) 0.5
Open drains (sq. km) 4.0
Total sewerage connections (nos.) 0.0
Sewerage coverage: slums (%) 0.0
Installed STP treatment capacity (MLD) 0.0
Annual revenue receipts from WW (`) 160,191.0
Annual revenue expenditure on WW (`) 596,321.0
Annual capital expenditure on WW (`) 0.0
SOLID WASTE MANAGEMENTWaste generated (TPD) 6.0
Waste collected (TPD) 6.0
Quantity of waste treated (TPD) 1.5
Waste received at scientific landfill (TPD) 0.0
Door to door colln.(no. of households andestablishments)
6,059.0
Waste segregation at source (Y/N) N
Annual revenue receipts from SW (`) 0.0
Annual revenue expenditure on SW (`) 5,188,969.0
Annual capital expenditure on SW (`) 1,005,200.0
87
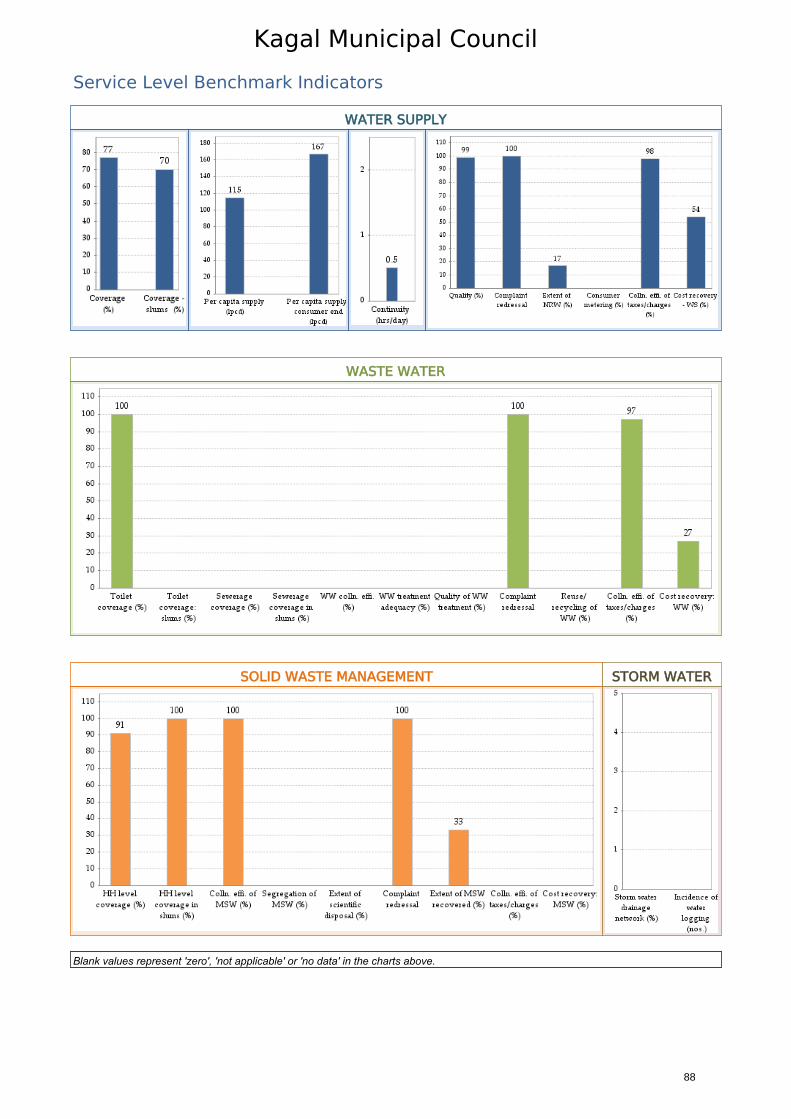
Kagal Municipal Council
Service Level Benchmark Indicators
WATER SUPPLY
WASTE WATER
SOLID WASTE MANAGEMENT STORM WATER
Blank values represent 'zero', 'not applicable' or 'no data' in the charts above.
88

Kalamb Municipal Council Background
GENERAL INFORMATIONClass Class C No. of slum settlements 4
District Osmanabad Slum population 3,800
Area (sq. km.) 3 Slum households 700
Total city population 34,702 Total annual city capital receipts (`) 41,001,000
Total households 4,963 Total annual city capital expenditure (`) 57,307,000
Density (persons per sq. km.) 10,844 Total annual city revenue receipts (`) 20,818,000
Total municipal staff 100 Total annual city revenue expenditure (`) 61,884,000
WATER SUPPLYTotal water produced (MLD) 2.3
Ground water (MLD) 0.0
Surface water (MLD) 2.3
Average daily volume treated (MLD) 23.0
Installed storage capacity (MLD) 1.6
Total water connections (nos.) 2,850.0
Water connections in slums (nos.) 200.0
Area covered by network (sq. km.) 5.2
No. of days of supply in a month 15.0
Annual revenue receipts from water (`) 1,823,000.0
Annual revenue expenditure on water (`) 4,846,000.0
Annual capital expenditure on water (`) 1,140,000.0
WASTE WATERArea covered by waste water network (sq. km.) 2.0
Underground sewerage network (sq. km) 0.0
Closed drains (sq. km) 0.0
Open drains (sq. km) 2.0
Total sewerage connections (nos.) 0.0
Sewerage coverage: slums (%) 0.0
Installed STP treatment capacity (MLD) 0.0
Annual revenue receipts from WW (`) 0.0
Annual revenue expenditure on WW (`) 385,000.0
Annual capital expenditure on WW (`) 168,000.0
SOLID WASTE MANAGEMENTWaste generated (TPD) 3.0
Waste collected (TPD) 3.0
Quantity of waste treated (TPD) 0.0
Waste received at scientific landfill (TPD) 0.0
Door to door colln.(no. of households andestablishments)
4,971.0
Waste segregation at source (Y/N) N
Annual revenue receipts from SW (`) 0.0
Annual revenue expenditure on SW (`) 2,995,000.0
Annual capital expenditure on SW (`) 2,896,000.0
89

Kalamb Municipal Council
Service Level Benchmark Indicators
WATER SUPPLY
WASTE WATER
SOLID WASTE MANAGEMENT STORM WATER
Blank values represent 'zero', 'not applicable' or 'no data' in the charts above.
90

Kalamnuri Municipal Council Background
GENERAL INFORMATIONClass Class C No. of slum settlements 0
District Hingoli Slum population 0
Area (sq. km.) 12 Slum households 0
Total city population 28,000 Total annual city capital receipts (`) 0
Total households 4,066 Total annual city capital expenditure (`) 0
Density (persons per sq. km.) 2,333 Total annual city revenue receipts (`) 0
Total municipal staff 49 Total annual city revenue expenditure (`) 0
WATER SUPPLYTotal water produced (MLD) 14.0
Ground water (MLD) 0.0
Surface water (MLD) 14.0
Average daily volume treated (MLD) 0.0
Installed storage capacity (MLD) 12.0
Total water connections (nos.) 0.0
Water connections in slums (nos.) 0.0
Area covered by network (sq. km.) 7.0
No. of days of supply in a month 0.0
Annual revenue receipts from water (`) 0.0
Annual revenue expenditure on water (`) 0.0
Annual capital expenditure on water (`) 0.0
WASTE WATERArea covered by waste water network (sq. km.) 0.0
Underground sewerage network (sq. km) 0.0
Closed drains (sq. km) 0.0
Open drains (sq. km) 0.0
Total sewerage connections (nos.) 0.0
Sewerage coverage: slums (%) 0.0
Installed STP treatment capacity (MLD) 0.0
Annual revenue receipts from WW (`) 0.0
Annual revenue expenditure on WW (`) 0.0
Annual capital expenditure on WW (`) 0.0
SOLID WASTE MANAGEMENTWaste generated (TPD) 0.0
Waste collected (TPD) 0.0
Quantity of waste treated (TPD) 0.0
Waste received at scientific landfill (TPD) 0.0
Door to door colln.(no. of households andestablishments)
0.0
Waste segregation at source (Y/N) N
Annual revenue receipts from SW (`) 0.0
Annual revenue expenditure on SW (`) 0.0
Annual capital expenditure on SW (`) 0.0
91

Kalamnuri Municipal Council
Service Level Benchmark Indicators
WATER SUPPLY
WASTE WATER
SOLID WASTE MANAGEMENT STORM WATER
Blank values represent 'zero', 'not applicable' or 'no data' in the charts above.
92

Kalmeshwar Municipal Council Background
GENERAL INFORMATIONClass Class C No. of slum settlements 0
District Nagpur Slum population 0
Area (sq. km.) 15 Slum households 0
Total city population 22,765 Total annual city capital receipts (`) 25,464,126
Total households 6,919 Total annual city capital expenditure (`) 31,777,484
Density (persons per sq. km.) 1,549 Total annual city revenue receipts (`) 45,484,691
Total municipal staff 75 Total annual city revenue expenditure (`) 35,253,215
WATER SUPPLYTotal water produced (MLD) 5.0
Ground water (MLD) 2.0
Surface water (MLD) 3.0
Average daily volume treated (MLD) 3.0
Installed storage capacity (MLD) 9.8
Total water connections (nos.) 2,818.0
Water connections in slums (nos.) 0.0
Area covered by network (sq. km.) 3.9
No. of days of supply in a month 15.0
Annual revenue receipts from water (`) 4,967,110.0
Annual revenue expenditure on water (`) 5,167,675.0
Annual capital expenditure on water (`) 0.0
WASTE WATERArea covered by waste water network (sq. km.) 0.0
Underground sewerage network (sq. km) 0.0
Closed drains (sq. km) 0.0
Open drains (sq. km) 0.0
Total sewerage connections (nos.) 0.0
Sewerage coverage: slums (%) 0.0
Installed STP treatment capacity (MLD) 0.0
Annual revenue receipts from WW (`) 0.0
Annual revenue expenditure on WW (`) 318,270.0
Annual capital expenditure on WW (`) 0.0
SOLID WASTE MANAGEMENTWaste generated (TPD) 5.1
Waste collected (TPD) 1.5
Quantity of waste treated (TPD) 1.5
Waste received at scientific landfill (TPD) 0.0
Door to door colln.(no. of households andestablishments)
2,868.0
Waste segregation at source (Y/N) N
Annual revenue receipts from SW (`) 0.0
Annual revenue expenditure on SW (`) 161,112.0
Annual capital expenditure on SW (`) 1,492,212.0
93

Kalmeshwar Municipal Council
Service Level Benchmark Indicators
WATER SUPPLY
WASTE WATER
SOLID WASTE MANAGEMENT STORM WATER
Blank values represent 'zero', 'not applicable' or 'no data' in the charts above.
94

Kandhar Municipal Council Background
GENERAL INFORMATIONClass Class C No. of slum settlements 0
District Nanded Slum population 0
Area (sq. km.) 7 Slum households 0
Total city population 25,532 Total annual city capital receipts (`) 15,319,160
Total households 5,565 Total annual city capital expenditure (`) 18,439,822
Density (persons per sq. km.) 3,868 Total annual city revenue receipts (`) 43,209,750
Total municipal staff 106 Total annual city revenue expenditure (`) 47,113,093
WATER SUPPLYTotal water produced (MLD) 0.6
Ground water (MLD) 0.0
Surface water (MLD) 0.6
Average daily volume treated (MLD) 0.6
Installed storage capacity (MLD) 1.2
Total water connections (nos.) 2,964.0
Water connections in slums (nos.) 0.0
Area covered by network (sq. km.) 4.0
No. of days of supply in a month 10.0
Annual revenue receipts from water (`) 2,171,601.0
Annual revenue expenditure on water (`) 5,451,989.0
Annual capital expenditure on water (`) 4,625,949.0
WASTE WATERArea covered by waste water network (sq. km.) 1.5
Underground sewerage network (sq. km) 0.0
Closed drains (sq. km) 0.0
Open drains (sq. km) 1.5
Total sewerage connections (nos.) 0.0
Sewerage coverage: slums (%) 0.0
Installed STP treatment capacity (MLD) 0.0
Annual revenue receipts from WW (`) 0.0
Annual revenue expenditure on WW (`) 281,994.0
Annual capital expenditure on WW (`) 281,994.0
SOLID WASTE MANAGEMENTWaste generated (TPD) 6.0
Waste collected (TPD) 6.0
Quantity of waste treated (TPD) 0.0
Waste received at scientific landfill (TPD) 0.0
Door to door colln.(no. of households andestablishments)
1,708.0
Waste segregation at source (Y/N) N
Annual revenue receipts from SW (`) 0.0
Annual revenue expenditure on SW (`) 1,674,919.0
Annual capital expenditure on SW (`) 1,674,919.0
95

Kandhar Municipal Council
Service Level Benchmark Indicators
WATER SUPPLY
WASTE WATER
SOLID WASTE MANAGEMENT STORM WATER
Blank values represent 'zero', 'not applicable' or 'no data' in the charts above.
96

Kannad Municipal Council Background
GENERAL INFORMATIONClass Class C No. of slum settlements 4
District Aurangabad Slum population 1,320
Area (sq. km.) 7 Slum households 350
Total city population 40,000 Total annual city capital receipts (`) 63,815,000
Total households 9,091 Total annual city capital expenditure (`) 24,883,000
Density (persons per sq. km.) 5,714 Total annual city revenue receipts (`) 63,815,000
Total municipal staff 126 Total annual city revenue expenditure (`) 49,481,000
WATER SUPPLYTotal water produced (MLD) 3.9
Ground water (MLD) 0.0
Surface water (MLD) 3.9
Average daily volume treated (MLD) 3.9
Installed storage capacity (MLD) 1.8
Total water connections (nos.) 3,988.0
Water connections in slums (nos.) 32.0
Area covered by network (sq. km.) 7.0
No. of days of supply in a month 15.0
Annual revenue receipts from water (`) 2,462,000.0
Annual revenue expenditure on water (`) 4,240,000.0
Annual capital expenditure on water (`) 0.0
WASTE WATERArea covered by waste water network (sq. km.) 7.0
Underground sewerage network (sq. km) 0.0
Closed drains (sq. km) 0.0
Open drains (sq. km) 7.0
Total sewerage connections (nos.) 0.0
Sewerage coverage: slums (%) 0.0
Installed STP treatment capacity (MLD) 0.0
Annual revenue receipts from WW (`) 0.0
Annual revenue expenditure on WW (`) 285,000.0
Annual capital expenditure on WW (`) 0.0
SOLID WASTE MANAGEMENTWaste generated (TPD) 10.0
Waste collected (TPD) 10.0
Quantity of waste treated (TPD) 0.0
Waste received at scientific landfill (TPD) 0.0
Door to door colln.(no. of households andestablishments)
7,932.0
Waste segregation at source (Y/N) N
Annual revenue receipts from SW (`) 0.0
Annual revenue expenditure on SW (`) 4,040,000.0
Annual capital expenditure on SW (`) 914,000.0
97
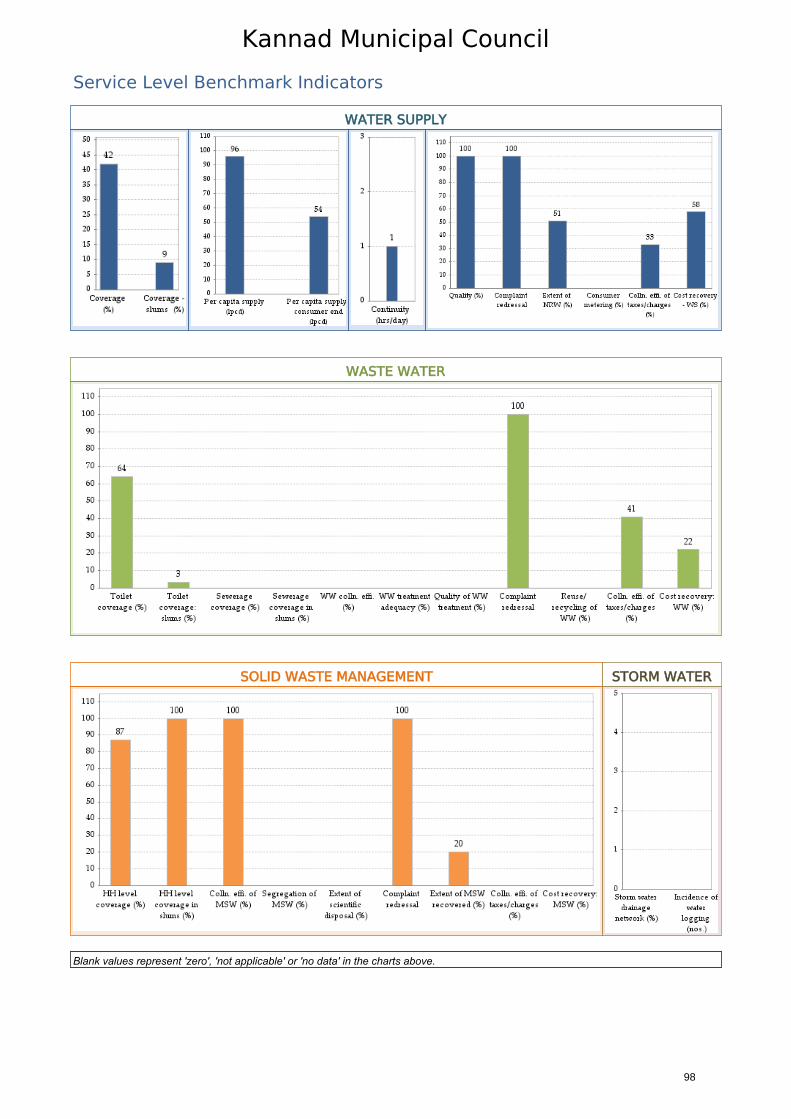
Kannad Municipal Council
Service Level Benchmark Indicators
WATER SUPPLY
WASTE WATER
SOLID WASTE MANAGEMENT STORM WATER
Blank values represent 'zero', 'not applicable' or 'no data' in the charts above.
98

Karjat Municipal Council Background
GENERAL INFORMATIONClass Class C No. of slum settlements 4
District Raigad Slum population 1,425
Area (sq. km.) 8 Slum households 265
Total city population 35,051 Total annual city capital receipts (`) 13,030,784
Total households 7,909 Total annual city capital expenditure (`) 15,592,625
Density (persons per sq. km.) 4,674 Total annual city revenue receipts (`) 56,371,007
Total municipal staff 66 Total annual city revenue expenditure (`) 42,309,672
WATER SUPPLYTotal water produced (MLD) 4.0
Ground water (MLD) 0.0
Surface water (MLD) 4.0
Average daily volume treated (MLD) 4.0
Installed storage capacity (MLD) 4.4
Total water connections (nos.) 3,570.0
Water connections in slums (nos.) 60.0
Area covered by network (sq. km.) 7.5
No. of days of supply in a month 30.0
Annual revenue receipts from water (`) 1,988,125.0
Annual revenue expenditure on water (`) 6,990,067.0
Annual capital expenditure on water (`) 0.0
WASTE WATERArea covered by waste water network (sq. km.) 7.5
Underground sewerage network (sq. km) 0.0
Closed drains (sq. km) 0.0
Open drains (sq. km) 7.5
Total sewerage connections (nos.) 0.0
Sewerage coverage: slums (%) 0.0
Installed STP treatment capacity (MLD) 0.0
Annual revenue receipts from WW (`) 0.0
Annual revenue expenditure on WW (`) 0.0
Annual capital expenditure on WW (`) 0.0
SOLID WASTE MANAGEMENTWaste generated (TPD) 12.2
Waste collected (TPD) 12.0
Quantity of waste treated (TPD) 5.0
Waste received at scientific landfill (TPD) 7.0
Door to door colln.(no. of households andestablishments)
8,500.0
Waste segregation at source (Y/N) N
Annual revenue receipts from SW (`) 0.0
Annual revenue expenditure on SW (`) 2,525,506.0
Annual capital expenditure on SW (`) 2,525,506.0
99

Karjat Municipal Council
Service Level Benchmark Indicators
WATER SUPPLY
WASTE WATER
SOLID WASTE MANAGEMENT STORM WATER
Blank values represent 'zero', 'not applicable' or 'no data' in the charts above.
100

Karmala Municipal Council Background
GENERAL INFORMATIONClass Class C No. of slum settlements 6
District Solapur Slum population 4,500
Area (sq. km.) 5 Slum households 900
Total city population 24,000 Total annual city capital receipts (`) 13,142,513
Total households 5,400 Total annual city capital expenditure (`) 18,649,591
Density (persons per sq. km.) 5,000 Total annual city revenue receipts (`) 69,080,409
Total municipal staff 52 Total annual city revenue expenditure (`) 51,616,762
WATER SUPPLYTotal water produced (MLD) 3.5
Ground water (MLD) 0.3
Surface water (MLD) 3.2
Average daily volume treated (MLD) 2.9
Installed storage capacity (MLD) 2.0
Total water connections (nos.) 2,765.0
Water connections in slums (nos.) 50.0
Area covered by network (sq. km.) 4.8
No. of days of supply in a month 30.0
Annual revenue receipts from water (`) 5,072,676.0
Annual revenue expenditure on water (`) 5,938,260.0
Annual capital expenditure on water (`) 1,495,826.0
WASTE WATERArea covered by waste water network (sq. km.) 4.8
Underground sewerage network (sq. km) 0.0
Closed drains (sq. km) 0.0
Open drains (sq. km) 4.8
Total sewerage connections (nos.) 0.0
Sewerage coverage: slums (%) 0.0
Installed STP treatment capacity (MLD) 0.0
Annual revenue receipts from WW (`) 0.0
Annual revenue expenditure on WW (`) 0.0
Annual capital expenditure on WW (`) 379,609.0
SOLID WASTE MANAGEMENTWaste generated (TPD) 6.0
Waste collected (TPD) 6.0
Quantity of waste treated (TPD) 0.0
Waste received at scientific landfill (TPD) 0.0
Door to door colln.(no. of households andestablishments)
2,800.0
Waste segregation at source (Y/N) N
Annual revenue receipts from SW (`) 0.0
Annual revenue expenditure on SW (`) 0.0
Annual capital expenditure on SW (`) 0.0
101
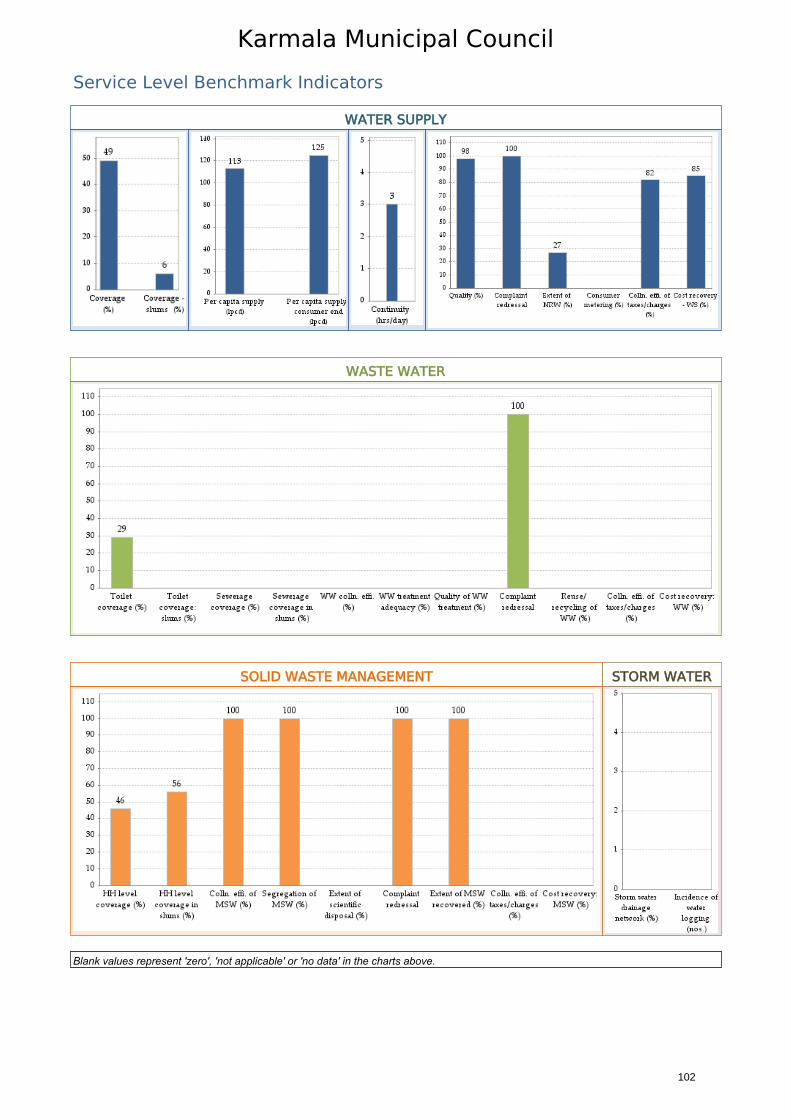
Karmala Municipal Council
Service Level Benchmark Indicators
WATER SUPPLY
WASTE WATER
SOLID WASTE MANAGEMENT STORM WATER
Blank values represent 'zero', 'not applicable' or 'no data' in the charts above.
102

Katol Municipal Council Background
GENERAL INFORMATIONClass Class C No. of slum settlements 18
District Nagpur Slum population 6,241
Area (sq. km.) 20 Slum households 1,376
Total city population 46,338 Total annual city capital receipts (`) 584
Total households 7,531 Total annual city capital expenditure (`) 711
Density (persons per sq. km.) 2,352 Total annual city revenue receipts (`) 1,107
Total municipal staff 333 Total annual city revenue expenditure (`) 1,210
WATER SUPPLYTotal water produced (MLD) 4.4
Ground water (MLD) 1.1
Surface water (MLD) 3.3
Average daily volume treated (MLD) 3.3
Installed storage capacity (MLD) 4.4
Total water connections (nos.) 5,691.0
Water connections in slums (nos.) 616.0
Area covered by network (sq. km.) 6.0
No. of days of supply in a month 30.0
Annual revenue receipts from water (`) 68.0
Annual revenue expenditure on water (`) 95.5
Annual capital expenditure on water (`) 6.3
WASTE WATERArea covered by waste water network (sq. km.) 3.8
Underground sewerage network (sq. km) 0.0
Closed drains (sq. km) 0.3
Open drains (sq. km) 3.5
Total sewerage connections (nos.) 0.0
Sewerage coverage: slums (%) 0.0
Installed STP treatment capacity (MLD) 0.0
Annual revenue receipts from WW (`) 5.8
Annual revenue expenditure on WW (`) 6.3
Annual capital expenditure on WW (`) 5.7
SOLID WASTE MANAGEMENTWaste generated (TPD) 10.0
Waste collected (TPD) 6.0
Quantity of waste treated (TPD) 6.0
Waste received at scientific landfill (TPD) 0.0
Door to door colln.(no. of households andestablishments)
7,605.0
Waste segregation at source (Y/N) N
Annual revenue receipts from SW (`) 4.1
Annual revenue expenditure on SW (`) 0.8
Annual capital expenditure on SW (`) 21.9
103

Katol Municipal Council
Service Level Benchmark Indicators
WATER SUPPLY
WASTE WATER
SOLID WASTE MANAGEMENT STORM WATER
Blank values represent 'zero', 'not applicable' or 'no data' in the charts above.
104

Khapa Municipal Council Background
GENERAL INFORMATIONClass Class C No. of slum settlements 5
District Nagpur Slum population 2,255
Area (sq. km.) 3 Slum households 439
Total city population 15,554 Total annual city capital receipts (`) 16,669,000
Total households 2,954 Total annual city capital expenditure (`) 23,020,000
Density (persons per sq. km.) 5,017 Total annual city revenue receipts (`) 6,902,000
Total municipal staff 52 Total annual city revenue expenditure (`) 2,872,000
WATER SUPPLYTotal water produced (MLD) 0.7
Ground water (MLD) 0.0
Surface water (MLD) 0.7
Average daily volume treated (MLD) 0.0
Installed storage capacity (MLD) 0.7
Total water connections (nos.) 1,422.0
Water connections in slums (nos.) 0.0
Area covered by network (sq. km.) 3.1
No. of days of supply in a month 30.0
Annual revenue receipts from water (`) 5,219,000.0
Annual revenue expenditure on water (`) 617,000.0
Annual capital expenditure on water (`) 0.0
WASTE WATERArea covered by waste water network (sq. km.) 0.0
Underground sewerage network (sq. km) 0.0
Closed drains (sq. km) 0.0
Open drains (sq. km) 0.0
Total sewerage connections (nos.) 0.0
Sewerage coverage: slums (%) 0.0
Installed STP treatment capacity (MLD) 0.0
Annual revenue receipts from WW (`) 0.0
Annual revenue expenditure on WW (`) 390,000.0
Annual capital expenditure on WW (`) 0.0
SOLID WASTE MANAGEMENTWaste generated (TPD) 3.3
Waste collected (TPD) 3.3
Quantity of waste treated (TPD) 2.0
Waste received at scientific landfill (TPD) 0.0
Door to door colln.(no. of households andestablishments)
2,512.0
Waste segregation at source (Y/N) N
Annual revenue receipts from SW (`) 6,000.0
Annual revenue expenditure on SW (`) 0.0
Annual capital expenditure on SW (`) 300,000.0
105

Khapa Municipal Council
Service Level Benchmark Indicators
WATER SUPPLY
WASTE WATER
SOLID WASTE MANAGEMENT STORM WATER
Blank values represent 'zero', 'not applicable' or 'no data' in the charts above.
106

Khed Municipal Council Background
GENERAL INFORMATIONClass Class C No. of slum settlements 0
District Ratnagiri Slum population 0
Area (sq. km.) 2 Slum households 0
Total city population 20,723 Total annual city capital receipts (`) 396
Total households 4,106 Total annual city capital expenditure (`) 215
Density (persons per sq. km.) 10,362 Total annual city revenue receipts (`) 39,564,000
Total municipal staff 84 Total annual city revenue expenditure (`) 47,310,000
WATER SUPPLYTotal water produced (MLD) 2.0
Ground water (MLD) 0.0
Surface water (MLD) 2.0
Average daily volume treated (MLD) 2.0
Installed storage capacity (MLD) 1.5
Total water connections (nos.) 3,166.0
Water connections in slums (nos.) 0.0
Area covered by network (sq. km.) 2.0
No. of days of supply in a month 30.0
Annual revenue receipts from water (`) 2,829,000.0
Annual revenue expenditure on water (`) 8,290,000.0
Annual capital expenditure on water (`) 40.7
WASTE WATERArea covered by waste water network (sq. km.) 1.8
Underground sewerage network (sq. km) 0.0
Closed drains (sq. km) 0.0
Open drains (sq. km) 1.8
Total sewerage connections (nos.) 0.0
Sewerage coverage: slums (%) 0.0
Installed STP treatment capacity (MLD) 0.0
Annual revenue receipts from WW (`) 0.0
Annual revenue expenditure on WW (`) 0.0
Annual capital expenditure on WW (`) 12.5
SOLID WASTE MANAGEMENTWaste generated (TPD) 5.0
Waste collected (TPD) 5.0
Quantity of waste treated (TPD) 0.0
Waste received at scientific landfill (TPD) 0.0
Door to door colln.(no. of households andestablishments)
2,576.0
Waste segregation at source (Y/N) N
Annual revenue receipts from SW (`) 0.0
Annual revenue expenditure on SW (`) 0.0
Annual capital expenditure on SW (`) 4.5
107

Khed Municipal Council
Service Level Benchmark Indicators
WATER SUPPLY
WASTE WATER
SOLID WASTE MANAGEMENT STORM WATER
Blank values represent 'zero', 'not applicable' or 'no data' in the charts above.
108

Khuldabad Municipal Council Background
GENERAL INFORMATIONClass Class C No. of slum settlements 0
District Aurangabad Slum population 0
Area (sq. km.) 5 Slum households 0
Total city population 15,530 Total annual city capital receipts (`) 21,188,738
Total households 2,700 Total annual city capital expenditure (`) 17,732,000
Density (persons per sq. km.) 3,045 Total annual city revenue receipts (`) 12,991,125
Total municipal staff 61 Total annual city revenue expenditure (`) 10,867,000
WATER SUPPLYTotal water produced (MLD) 1.0
Ground water (MLD) 0.0
Surface water (MLD) 1.0
Average daily volume treated (MLD) 1.0
Installed storage capacity (MLD) 0.7
Total water connections (nos.) 1,636.0
Water connections in slums (nos.) 0.0
Area covered by network (sq. km.) 0.0
No. of days of supply in a month 15.0
Annual revenue receipts from water (`) 1,598,000.0
Annual revenue expenditure on water (`) 3,358,000.0
Annual capital expenditure on water (`) 3,434,000.0
WASTE WATERArea covered by waste water network (sq. km.) 5.1
Underground sewerage network (sq. km) 0.0
Closed drains (sq. km) 0.0
Open drains (sq. km) 5.1
Total sewerage connections (nos.) 0.0
Sewerage coverage: slums (%) 0.0
Installed STP treatment capacity (MLD) 0.0
Annual revenue receipts from WW (`) 0.0
Annual revenue expenditure on WW (`) 2,268,000.0
Annual capital expenditure on WW (`) 2,140,000.0
SOLID WASTE MANAGEMENTWaste generated (TPD) 1.5
Waste collected (TPD) 1.5
Quantity of waste treated (TPD) 0.0
Waste received at scientific landfill (TPD) 0.0
Door to door colln.(no. of households andestablishments)
2,025.0
Waste segregation at source (Y/N) N
Annual revenue receipts from SW (`) 0.0
Annual revenue expenditure on SW (`) 28,000.0
Annual capital expenditure on SW (`) 28,000.0
109

Khuldabad Municipal Council
Service Level Benchmark Indicators
WATER SUPPLY
WASTE WATER
SOLID WASTE MANAGEMENT STORM WATER
Blank values represent 'zero', 'not applicable' or 'no data' in the charts above.
110

Kille Dharur Municipal Council Background
GENERAL INFORMATIONClass Class C No. of slum settlements 0
District Beed Slum population 0
Area (sq. km.) 5 Slum households 0
Total city population 25,000 Total annual city capital receipts (`) 31,238,305
Total households 3,442 Total annual city capital expenditure (`) 2,026,000
Density (persons per sq. km.) 5,000 Total annual city revenue receipts (`) 15,426,747
Total municipal staff 59 Total annual city revenue expenditure (`) 9,448,533
WATER SUPPLYTotal water produced (MLD) 1.0
Ground water (MLD) 0.0
Surface water (MLD) 1.0
Average daily volume treated (MLD) 0.0
Installed storage capacity (MLD) 1.0
Total water connections (nos.) 2,705.0
Water connections in slums (nos.) 0.0
Area covered by network (sq. km.) 6.0
No. of days of supply in a month 10.0
Annual revenue receipts from water (`) 1,177,396.0
Annual revenue expenditure on water (`) 2,028,508.0
Annual capital expenditure on water (`) 0.0
WASTE WATERArea covered by waste water network (sq. km.) 3.9
Underground sewerage network (sq. km) 0.0
Closed drains (sq. km) 0.0
Open drains (sq. km) 3.9
Total sewerage connections (nos.) 0.0
Sewerage coverage: slums (%) 0.0
Installed STP treatment capacity (MLD) 0.0
Annual revenue receipts from WW (`) 0.0
Annual revenue expenditure on WW (`) 0.0
Annual capital expenditure on WW (`) 0.0
SOLID WASTE MANAGEMENTWaste generated (TPD) 2.0
Waste collected (TPD) 2.0
Quantity of waste treated (TPD) 0.0
Waste received at scientific landfill (TPD) 0.0
Door to door colln.(no. of households andestablishments)
3,444.0
Waste segregation at source (Y/N) N
Annual revenue receipts from SW (`) 0.0
Annual revenue expenditure on SW (`) 703,744.0
Annual capital expenditure on SW (`) 627,244.0
111

Kille Dharur Municipal Council
Service Level Benchmark Indicators
WATER SUPPLY
WASTE WATER
SOLID WASTE MANAGEMENT STORM WATER
Blank values represent 'zero', 'not applicable' or 'no data' in the charts above.
112

Kinwat Municipal Council Background
GENERAL INFORMATIONClass Class C No. of slum settlements 9
District Nanded Slum population 5,400
Area (sq. km.) 14 Slum households 720
Total city population 28,659 Total annual city capital receipts (`) 27,602,000
Total households 5,361 Total annual city capital expenditure (`) 30,203,000
Density (persons per sq. km.) 2,077 Total annual city revenue receipts (`) 33,667,000
Total municipal staff 73 Total annual city revenue expenditure (`) 48,364,000
WATER SUPPLYTotal water produced (MLD) 1.3
Ground water (MLD) 0.1
Surface water (MLD) 1.2
Average daily volume treated (MLD) 0.0
Installed storage capacity (MLD) 1.6
Total water connections (nos.) 1,398.0
Water connections in slums (nos.) 0.0
Area covered by network (sq. km.) 0.0
No. of days of supply in a month 30.0
Annual revenue receipts from water (`) 942,000.0
Annual revenue expenditure on water (`) 2,625,000.0
Annual capital expenditure on water (`) 0.0
WASTE WATERArea covered by waste water network (sq. km.) 0.0
Underground sewerage network (sq. km) 0.0
Closed drains (sq. km) 0.0
Open drains (sq. km) 0.0
Total sewerage connections (nos.) 0.0
Sewerage coverage: slums (%) 0.0
Installed STP treatment capacity (MLD) 0.0
Annual revenue receipts from WW (`) 0.0
Annual revenue expenditure on WW (`) 0.0
Annual capital expenditure on WW (`) 0.0
SOLID WASTE MANAGEMENTWaste generated (TPD) 0.6
Waste collected (TPD) 0.6
Quantity of waste treated (TPD) 0.0
Waste received at scientific landfill (TPD) 0.0
Door to door colln.(no. of households andestablishments)
4,800.0
Waste segregation at source (Y/N) Y
Annual revenue receipts from SW (`) 1,990,000.0
Annual revenue expenditure on SW (`) 1,352,000.0
Annual capital expenditure on SW (`) 0.0
113

Kinwat Municipal Council
Service Level Benchmark Indicators
WATER SUPPLY
WASTE WATER
SOLID WASTE MANAGEMENT STORM WATER
Blank values represent 'zero', 'not applicable' or 'no data' in the charts above.
114

Kundalwadi Municipal Council Background
GENERAL INFORMATIONClass Class C No. of slum settlements 2
District Nanded Slum population 670
Area (sq. km.) 2 Slum households 85
Total city population 17,200 Total annual city capital receipts (`) 0
Total households 3,500 Total annual city capital expenditure (`) 0
Density (persons per sq. km.) 7,478 Total annual city revenue receipts (`) 0
Total municipal staff 31 Total annual city revenue expenditure (`) 0
WATER SUPPLYTotal water produced (MLD) 0.6
Ground water (MLD) 0.6
Surface water (MLD) 0.0
Average daily volume treated (MLD) 0.0
Installed storage capacity (MLD) 0.0
Total water connections (nos.) 0.0
Water connections in slums (nos.) 0.0
Area covered by network (sq. km.) 2.0
No. of days of supply in a month 0.0
Annual revenue receipts from water (`) 0.0
Annual revenue expenditure on water (`) 0.0
Annual capital expenditure on water (`) 0.0
WASTE WATERArea covered by waste water network (sq. km.) 2.3
Underground sewerage network (sq. km) 0.0
Closed drains (sq. km) 0.0
Open drains (sq. km) 2.3
Total sewerage connections (nos.) 0.0
Sewerage coverage: slums (%) 0.0
Installed STP treatment capacity (MLD) 0.0
Annual revenue receipts from WW (`) 0.0
Annual revenue expenditure on WW (`) 0.0
Annual capital expenditure on WW (`) 0.0
SOLID WASTE MANAGEMENTWaste generated (TPD) 1.0
Waste collected (TPD) 1.0
Quantity of waste treated (TPD) 0.0
Waste received at scientific landfill (TPD) 0.0
Door to door colln.(no. of households andestablishments)
1,607.0
Waste segregation at source (Y/N) N
Annual revenue receipts from SW (`) 0.0
Annual revenue expenditure on SW (`) 0.0
Annual capital expenditure on SW (`) 0.0
115

Kundalwadi Municipal Council
Service Level Benchmark Indicators
WATER SUPPLY
WASTE WATER
SOLID WASTE MANAGEMENT STORM WATER
Blank values represent 'zero', 'not applicable' or 'no data' in the charts above.
116

Kurduvadi Municipal Council Background
GENERAL INFORMATIONClass Class C No. of slum settlements 0
District Solapur Slum population 0
Area (sq. km.) 6 Slum households 0
Total city population 23,145 Total annual city capital receipts (`) 39,157,613
Total households 3,780 Total annual city capital expenditure (`) 15,403,711
Density (persons per sq. km.) 3,561 Total annual city revenue receipts (`) 53,277,300
Total municipal staff 95 Total annual city revenue expenditure (`) 63,003,663
WATER SUPPLYTotal water produced (MLD) 4.5
Ground water (MLD) 0.0
Surface water (MLD) 4.5
Average daily volume treated (MLD) 3.8
Installed storage capacity (MLD) 5.0
Total water connections (nos.) 4,272.0
Water connections in slums (nos.) 0.0
Area covered by network (sq. km.) 6.5
No. of days of supply in a month 15.0
Annual revenue receipts from water (`) 5,926,647.0
Annual revenue expenditure on water (`) 13,358,836.0
Annual capital expenditure on water (`) 909,538.0
WASTE WATERArea covered by waste water network (sq. km.) 3.8
Underground sewerage network (sq. km) 0.0
Closed drains (sq. km) 0.0
Open drains (sq. km) 3.8
Total sewerage connections (nos.) 0.0
Sewerage coverage: slums (%) 0.0
Installed STP treatment capacity (MLD) 0.0
Annual revenue receipts from WW (`) 0.0
Annual revenue expenditure on WW (`) 214,850.0
Annual capital expenditure on WW (`) 1,673,822.0
SOLID WASTE MANAGEMENTWaste generated (TPD) 7.5
Waste collected (TPD) 7.5
Quantity of waste treated (TPD) 0.0
Waste received at scientific landfill (TPD) 0.0
Door to door colln.(no. of households andestablishments)
4,453.0
Waste segregation at source (Y/N) N
Annual revenue receipts from SW (`) 788,540.0
Annual revenue expenditure on SW (`) 4,030,115.0
Annual capital expenditure on SW (`) 5,399,087.0
117

Kurduvadi Municipal Council
Service Level Benchmark Indicators
WATER SUPPLY
WASTE WATER
SOLID WASTE MANAGEMENT STORM WATER
Blank values represent 'zero', 'not applicable' or 'no data' in the charts above.
118
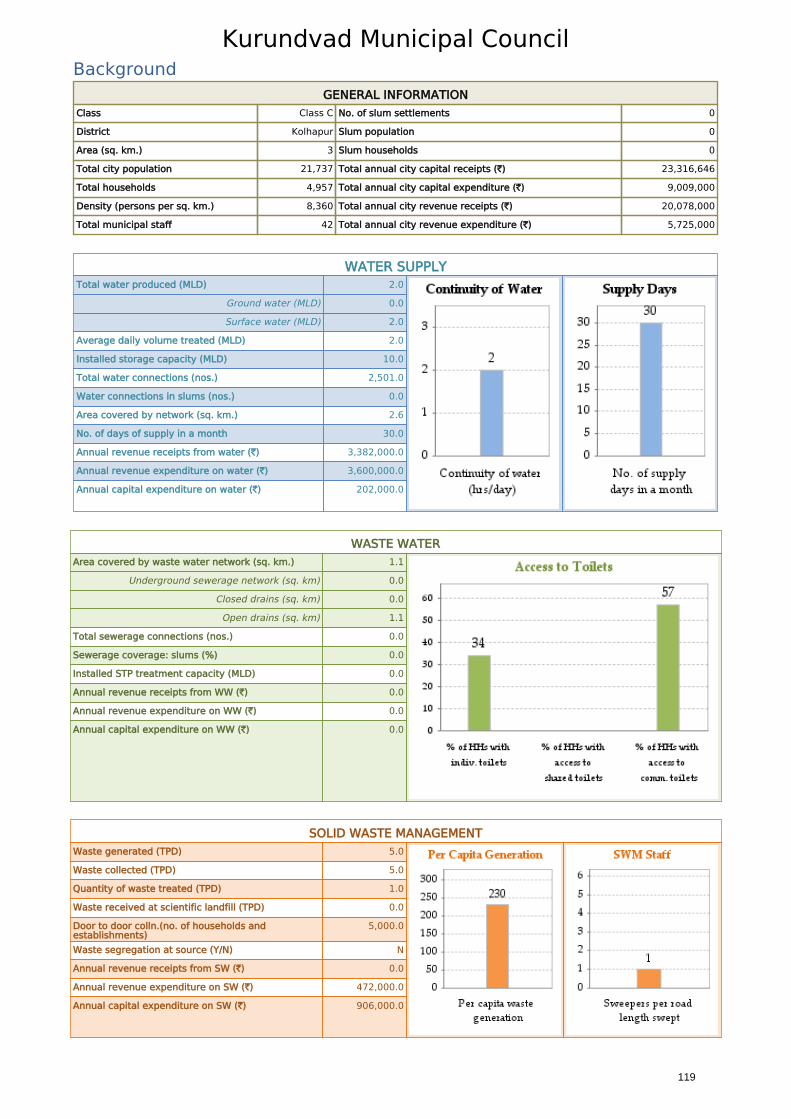
Kurundvad Municipal Council Background
GENERAL INFORMATIONClass Class C No. of slum settlements 0
District Kolhapur Slum population 0
Area (sq. km.) 3 Slum households 0
Total city population 21,737 Total annual city capital receipts (`) 23,316,646
Total households 4,957 Total annual city capital expenditure (`) 9,009,000
Density (persons per sq. km.) 8,360 Total annual city revenue receipts (`) 20,078,000
Total municipal staff 42 Total annual city revenue expenditure (`) 5,725,000
WATER SUPPLYTotal water produced (MLD) 2.0
Ground water (MLD) 0.0
Surface water (MLD) 2.0
Average daily volume treated (MLD) 2.0
Installed storage capacity (MLD) 10.0
Total water connections (nos.) 2,501.0
Water connections in slums (nos.) 0.0
Area covered by network (sq. km.) 2.6
No. of days of supply in a month 30.0
Annual revenue receipts from water (`) 3,382,000.0
Annual revenue expenditure on water (`) 3,600,000.0
Annual capital expenditure on water (`) 202,000.0
WASTE WATERArea covered by waste water network (sq. km.) 1.1
Underground sewerage network (sq. km) 0.0
Closed drains (sq. km) 0.0
Open drains (sq. km) 1.1
Total sewerage connections (nos.) 0.0
Sewerage coverage: slums (%) 0.0
Installed STP treatment capacity (MLD) 0.0
Annual revenue receipts from WW (`) 0.0
Annual revenue expenditure on WW (`) 0.0
Annual capital expenditure on WW (`) 0.0
SOLID WASTE MANAGEMENTWaste generated (TPD) 5.0
Waste collected (TPD) 5.0
Quantity of waste treated (TPD) 1.0
Waste received at scientific landfill (TPD) 0.0
Door to door colln.(no. of households andestablishments)
5,000.0
Waste segregation at source (Y/N) N
Annual revenue receipts from SW (`) 0.0
Annual revenue expenditure on SW (`) 472,000.0
Annual capital expenditure on SW (`) 906,000.0
119

Kurundvad Municipal Council
Service Level Benchmark Indicators
WATER SUPPLY
WASTE WATER
SOLID WASTE MANAGEMENT STORM WATER
Blank values represent 'zero', 'not applicable' or 'no data' in the charts above.
120

Loha Municipal Council Background
GENERAL INFORMATIONClass Class C No. of slum settlements 4
District Nanded Slum population 525
Area (sq. km.) 27 Slum households 105
Total city population 23,673 Total annual city capital receipts (`) 0
Total households 3,979 Total annual city capital expenditure (`) 0
Density (persons per sq. km.) 877 Total annual city revenue receipts (`) 0
Total municipal staff 99 Total annual city revenue expenditure (`) 0
WATER SUPPLYTotal water produced (MLD) 0.8
Ground water (MLD) 0.8
Surface water (MLD) 0.0
Average daily volume treated (MLD) 0.0
Installed storage capacity (MLD) 1.1
Total water connections (nos.) 774.0
Water connections in slums (nos.) 54.0
Area covered by network (sq. km.) 26.0
No. of days of supply in a month 15.0
Annual revenue receipts from water (`) 0.0
Annual revenue expenditure on water (`) 0.0
Annual capital expenditure on water (`) 0.0
WASTE WATERArea covered by waste water network (sq. km.) 27.0
Underground sewerage network (sq. km) 0.0
Closed drains (sq. km) 0.0
Open drains (sq. km) 27.0
Total sewerage connections (nos.) 0.0
Sewerage coverage: slums (%) 0.0
Installed STP treatment capacity (MLD) 0.0
Annual revenue receipts from WW (`) 0.0
Annual revenue expenditure on WW (`) 0.0
Annual capital expenditure on WW (`) 0.0
SOLID WASTE MANAGEMENTWaste generated (TPD) 5.0
Waste collected (TPD) 5.0
Quantity of waste treated (TPD) 0.0
Waste received at scientific landfill (TPD) 0.0
Door to door colln.(no. of households andestablishments)
2,350.0
Waste segregation at source (Y/N) N
Annual revenue receipts from SW (`) 0.0
Annual revenue expenditure on SW (`) 0.0
Annual capital expenditure on SW (`) 0.0
121

Loha Municipal Council
Service Level Benchmark Indicators
WATER SUPPLY
WASTE WATER
SOLID WASTE MANAGEMENT STORM WATER
Blank values represent 'zero', 'not applicable' or 'no data' in the charts above.
122

Lonar Municipal Council Background
GENERAL INFORMATIONClass Class C No. of slum settlements 13
District Buldhana Slum population 3,336
Area (sq. km.) 36 Slum households 631
Total city population 23,346 Total annual city capital receipts (`) 4,331,460
Total households 4,764 Total annual city capital expenditure (`) 815,000
Density (persons per sq. km.) 658 Total annual city revenue receipts (`) 19,281,000
Total municipal staff 91 Total annual city revenue expenditure (`) 22,526,000
WATER SUPPLYTotal water produced (MLD) 1.0
Ground water (MLD) 1.0
Surface water (MLD) 0.0
Average daily volume treated (MLD) 0.0
Installed storage capacity (MLD) 0.3
Total water connections (nos.) 2,129.0
Water connections in slums (nos.) 210.0
Area covered by network (sq. km.) 2.5
No. of days of supply in a month 5.0
Annual revenue receipts from water (`) 924,000.0
Annual revenue expenditure on water (`) 2,871,000.0
Annual capital expenditure on water (`) 2,871,000.0
WASTE WATERArea covered by waste water network (sq. km.) 1.2
Underground sewerage network (sq. km) 0.0
Closed drains (sq. km) 0.0
Open drains (sq. km) 1.2
Total sewerage connections (nos.) 0.0
Sewerage coverage: slums (%) 0.0
Installed STP treatment capacity (MLD) 0.0
Annual revenue receipts from WW (`) 0.0
Annual revenue expenditure on WW (`) 0.0
Annual capital expenditure on WW (`) 3,334,000.0
SOLID WASTE MANAGEMENTWaste generated (TPD) 4.5
Waste collected (TPD) 4.5
Quantity of waste treated (TPD) 0.0
Waste received at scientific landfill (TPD) 0.0
Door to door colln.(no. of households andestablishments)
3,841.0
Waste segregation at source (Y/N) N
Annual revenue receipts from SW (`) 0.0
Annual revenue expenditure on SW (`) 165,000.0
Annual capital expenditure on SW (`) 666,000.0
123

Lonar Municipal Council
Service Level Benchmark Indicators
WATER SUPPLY
WASTE WATER
SOLID WASTE MANAGEMENT STORM WATER
Blank values represent 'zero', 'not applicable' or 'no data' in the charts above.
124

Mahabaleshwar Municipal Council Background
GENERAL INFORMATIONClass Class C No. of slum settlements 0
District Satara Slum population 0
Area (sq. km.) 20 Slum households 0
Total city population 14,629 Total annual city capital receipts (`) 200,476,958
Total households 1,569 Total annual city capital expenditure (`) 71,088,719
Density (persons per sq. km.) 746 Total annual city revenue receipts (`) 67,123,780
Total municipal staff 180 Total annual city revenue expenditure (`) 85,201,701
WATER SUPPLYTotal water produced (MLD) 2.0
Ground water (MLD) 0.0
Surface water (MLD) 2.0
Average daily volume treated (MLD) 0.0
Installed storage capacity (MLD) 0.4
Total water connections (nos.) 1,316.0
Water connections in slums (nos.) 0.0
Area covered by network (sq. km.) 15.0
No. of days of supply in a month 30.0
Annual revenue receipts from water (`) 8,687,182.0
Annual revenue expenditure on water (`) 5,729,494.0
Annual capital expenditure on water (`) 5,729,494.0
WASTE WATERArea covered by waste water network (sq. km.) 24.0
Underground sewerage network (sq. km) 15.5
Closed drains (sq. km) 3.5
Open drains (sq. km) 5.0
Total sewerage connections (nos.) 0.0
Sewerage coverage: slums (%) 0.0
Installed STP treatment capacity (MLD) 0.0
Annual revenue receipts from WW (`) 0.0
Annual revenue expenditure on WW (`) 0.0
Annual capital expenditure on WW (`) 5,603,890.0
SOLID WASTE MANAGEMENTWaste generated (TPD) 4.0
Waste collected (TPD) 4.0
Quantity of waste treated (TPD) 0.0
Waste received at scientific landfill (TPD) 0.0
Door to door colln.(no. of households andestablishments)
1,418.0
Waste segregation at source (Y/N) N
Annual revenue receipts from SW (`) 43,152.0
Annual revenue expenditure on SW (`) 13,499,604.0
Annual capital expenditure on SW (`) 974,110.0
125

Mahabaleshwar Municipal Council
Service Level Benchmark Indicators
WATER SUPPLY
WASTE WATER
SOLID WASTE MANAGEMENT STORM WATER
Blank values represent 'zero', 'not applicable' or 'no data' in the charts above.
126

Mahad Municipal Council Background
GENERAL INFORMATIONClass Class C No. of slum settlements 0
District Raigad Slum population 0
Area (sq. km.) 4 Slum households 0
Total city population 31,000 Total annual city capital receipts (`) 1,997,000
Total households 8,568 Total annual city capital expenditure (`) 3,000,000
Density (persons per sq. km.) 7,561 Total annual city revenue receipts (`) 73,075,000
Total municipal staff 139 Total annual city revenue expenditure (`) 85,726,000
WATER SUPPLYTotal water produced (MLD) 3.6
Ground water (MLD) 0.0
Surface water (MLD) 3.6
Average daily volume treated (MLD) 3.8
Installed storage capacity (MLD) 2.5
Total water connections (nos.) 3,946.0
Water connections in slums (nos.) 0.0
Area covered by network (sq. km.) 4.1
No. of days of supply in a month 30.0
Annual revenue receipts from water (`) 3,575,000.0
Annual revenue expenditure on water (`) 11,747,000.0
Annual capital expenditure on water (`) 10,105,000.0
WASTE WATERArea covered by waste water network (sq. km.) 4.5
Underground sewerage network (sq. km) 0.0
Closed drains (sq. km) 0.4
Open drains (sq. km) 4.1
Total sewerage connections (nos.) 0.0
Sewerage coverage: slums (%) 0.0
Installed STP treatment capacity (MLD) 0.0
Annual revenue receipts from WW (`) 0.0
Annual revenue expenditure on WW (`) 0.0
Annual capital expenditure on WW (`) 0.0
SOLID WASTE MANAGEMENTWaste generated (TPD) 5.0
Waste collected (TPD) 0.0
Quantity of waste treated (TPD) 0.0
Waste received at scientific landfill (TPD) 0.0
Door to door colln.(no. of households andestablishments)
276.0
Waste segregation at source (Y/N) N
Annual revenue receipts from SW (`) 0.0
Annual revenue expenditure on SW (`) 7.0
Annual capital expenditure on SW (`) 11,700,000.0
127

Mahad Municipal Council
Service Level Benchmark Indicators
WATER SUPPLY
WASTE WATER
SOLID WASTE MANAGEMENT STORM WATER
Blank values represent 'zero', 'not applicable' or 'no data' in the charts above.
128

Maindargi Municipal Council Background
GENERAL INFORMATIONClass Class C No. of slum settlements 3
District Solapur Slum population 1,400
Area (sq. km.) 2 Slum households 182
Total city population 12,998 Total annual city capital receipts (`) 15,945,124
Total households 4,279 Total annual city capital expenditure (`) 10,202,221
Density (persons per sq. km.) 6,841 Total annual city revenue receipts (`) 25,218,062
Total municipal staff 30 Total annual city revenue expenditure (`) 18,594,537
WATER SUPPLYTotal water produced (MLD) 0.8
Ground water (MLD) 0.8
Surface water (MLD) 0.0
Average daily volume treated (MLD) 0.0
Installed storage capacity (MLD) 0.8
Total water connections (nos.) 931.0
Water connections in slums (nos.) 0.0
Area covered by network (sq. km.) 1.9
No. of days of supply in a month 20.0
Annual revenue receipts from water (`) 883,692.0
Annual revenue expenditure on water (`) 770,658.0
Annual capital expenditure on water (`) 401,446.0
WASTE WATERArea covered by waste water network (sq. km.) 2.1
Underground sewerage network (sq. km) 0.0
Closed drains (sq. km) 0.1
Open drains (sq. km) 2.0
Total sewerage connections (nos.) 0.0
Sewerage coverage: slums (%) 0.0
Installed STP treatment capacity (MLD) 0.0
Annual revenue receipts from WW (`) 6,000.0
Annual revenue expenditure on WW (`) 0.0
Annual capital expenditure on WW (`) 0.0
SOLID WASTE MANAGEMENTWaste generated (TPD) 1.0
Waste collected (TPD) 1.0
Quantity of waste treated (TPD) 0.0
Waste received at scientific landfill (TPD) 0.0
Door to door colln.(no. of households andestablishments)
0.0
Waste segregation at source (Y/N) N
Annual revenue receipts from SW (`) 767,000.0
Annual revenue expenditure on SW (`) 0.0
Annual capital expenditure on SW (`) 956,363.0
129

Maindargi Municipal Council
Service Level Benchmark Indicators
WATER SUPPLY
WASTE WATER
SOLID WASTE MANAGEMENT STORM WATER
Blank values represent 'zero', 'not applicable' or 'no data' in the charts above.
130

Malkapur Municipal Council Background
GENERAL INFORMATIONClass Class C No. of slum settlements 0
District Kolhapur Slum population 0
Area (sq. km.) 2 Slum households 0
Total city population 7,000 Total annual city capital receipts (`) 6,650,679
Total households 1,158 Total annual city capital expenditure (`) 5,620,572
Density (persons per sq. km.) 3,684 Total annual city revenue receipts (`) 10,790,688
Total municipal staff 92 Total annual city revenue expenditure (`) 1,629,446
WATER SUPPLYTotal water produced (MLD) 0.7
Ground water (MLD) 0.7
Surface water (MLD) 0.0
Average daily volume treated (MLD) 4.0
Installed storage capacity (MLD) 3.4
Total water connections (nos.) 3,347.0
Water connections in slums (nos.) 0.0
Area covered by network (sq. km.) 5.0
No. of days of supply in a month 30.0
Annual revenue receipts from water (`) 1,445,500.0
Annual revenue expenditure on water (`) 2,899,024.0
Annual capital expenditure on water (`) 5,620,572.0
WASTE WATERArea covered by waste water network (sq. km.) 1.9
Underground sewerage network (sq. km) 0.0
Closed drains (sq. km) 0.0
Open drains (sq. km) 1.9
Total sewerage connections (nos.) 0.0
Sewerage coverage: slums (%) 0.0
Installed STP treatment capacity (MLD) 0.0
Annual revenue receipts from WW (`) 0.0
Annual revenue expenditure on WW (`) 0.0
Annual capital expenditure on WW (`) 0.0
SOLID WASTE MANAGEMENTWaste generated (TPD) 1.5
Waste collected (TPD) 1.5
Quantity of waste treated (TPD) 0.0
Waste received at scientific landfill (TPD) 0.0
Door to door colln.(no. of households andestablishments)
1,218.0
Waste segregation at source (Y/N) N
Annual revenue receipts from SW (`) 1,030,107.0
Annual revenue expenditure on SW (`) 0.0
Annual capital expenditure on SW (`) 0.0
131

Malkapur Municipal Council
Service Level Benchmark Indicators
WATER SUPPLY
WASTE WATER
SOLID WASTE MANAGEMENT STORM WATER
Blank values represent 'zero', 'not applicable' or 'no data' in the charts above.
132

Malwan Municipal Council Background
GENERAL INFORMATIONClass Class C No. of slum settlements 0
District Sindhudurg Slum population 0
Area (sq. km.) 6 Slum households 0
Total city population 19,576 Total annual city capital receipts (`) 582,708
Total households 5,383 Total annual city capital expenditure (`) 0
Density (persons per sq. km.) 3,012 Total annual city revenue receipts (`) 36,243,171
Total municipal staff 36 Total annual city revenue expenditure (`) 36,089,457
WATER SUPPLYTotal water produced (MLD) 1.2
Ground water (MLD) 1.2
Surface water (MLD) 0.0
Average daily volume treated (MLD) 0.0
Installed storage capacity (MLD) 1.2
Total water connections (nos.) 876.0
Water connections in slums (nos.) 0.0
Area covered by network (sq. km.) 4.4
No. of days of supply in a month 26.0
Annual revenue receipts from water (`) 1,776,022.0
Annual revenue expenditure on water (`) 2,376,433.0
Annual capital expenditure on water (`) 0.0
WASTE WATERArea covered by waste water network (sq. km.) 0.0
Underground sewerage network (sq. km) 0.0
Closed drains (sq. km) 0.0
Open drains (sq. km) 0.0
Total sewerage connections (nos.) 0.0
Sewerage coverage: slums (%) 0.0
Installed STP treatment capacity (MLD) 0.0
Annual revenue receipts from WW (`) 0.0
Annual revenue expenditure on WW (`) 0.0
Annual capital expenditure on WW (`) 0.0
SOLID WASTE MANAGEMENTWaste generated (TPD) 5.5
Waste collected (TPD) 5.5
Quantity of waste treated (TPD) 0.0
Waste received at scientific landfill (TPD) 0.0
Door to door colln.(no. of households andestablishments)
1,395.0
Waste segregation at source (Y/N) N
Annual revenue receipts from SW (`) 0.0
Annual revenue expenditure on SW (`) 3,655,605.0
Annual capital expenditure on SW (`) 0.0
133

Malwan Municipal Council
Service Level Benchmark Indicators
WATER SUPPLY
WASTE WATER
SOLID WASTE MANAGEMENT STORM WATER
Blank values represent 'zero', 'not applicable' or 'no data' in the charts above.
134

Mangalvedhe Municipal Council Background
GENERAL INFORMATIONClass Class C No. of slum settlements 0
District Solapur Slum population 0
Area (sq. km.) 2 Slum households 0
Total city population 24,156 Total annual city capital receipts (`) 27,751,000
Total households 4,832 Total annual city capital expenditure (`) 60,654,000
Density (persons per sq. km.) 16,104 Total annual city revenue receipts (`) 54,281,000
Total municipal staff 76 Total annual city revenue expenditure (`) 1,768,000
WATER SUPPLYTotal water produced (MLD) 3.5
Ground water (MLD) 2.0
Surface water (MLD) 1.5
Average daily volume treated (MLD) 1.5
Installed storage capacity (MLD) 13.5
Total water connections (nos.) 2,543.0
Water connections in slums (nos.) 0.0
Area covered by network (sq. km.) 1.5
No. of days of supply in a month 15.0
Annual revenue receipts from water (`) 0.0
Annual revenue expenditure on water (`) 4,896,000.0
Annual capital expenditure on water (`) 30,304,000.0
WASTE WATERArea covered by waste water network (sq. km.) 1.5
Underground sewerage network (sq. km) 0.0
Closed drains (sq. km) 0.0
Open drains (sq. km) 1.5
Total sewerage connections (nos.) 0.0
Sewerage coverage: slums (%) 0.0
Installed STP treatment capacity (MLD) 0.0
Annual revenue receipts from WW (`) 0.0
Annual revenue expenditure on WW (`) 0.0
Annual capital expenditure on WW (`) 0.0
SOLID WASTE MANAGEMENTWaste generated (TPD) 5.0
Waste collected (TPD) 5.0
Quantity of waste treated (TPD) 0.0
Waste received at scientific landfill (TPD) 0.0
Door to door colln.(no. of households andestablishments)
4,149.0
Waste segregation at source (Y/N) N
Annual revenue receipts from SW (`) 0.0
Annual revenue expenditure on SW (`) 1,471,000.0
Annual capital expenditure on SW (`) 1,471,000.0
135

Mangalvedhe Municipal Council
Service Level Benchmark Indicators
WATER SUPPLY
WASTE WATER
SOLID WASTE MANAGEMENT STORM WATER
Blank values represent 'zero', 'not applicable' or 'no data' in the charts above.
136

Mangrulpir Municipal Council Background
GENERAL INFORMATIONClass Class C No. of slum settlements 12
District Washim Slum population 6,200
Area (sq. km.) 4 Slum households 1,236
Total city population 31,000 Total annual city capital receipts (`) 33,256,473
Total households 6,000 Total annual city capital expenditure (`) 22,702,206
Density (persons per sq. km.) 7,209 Total annual city revenue receipts (`) 63,006,348
Total municipal staff 130 Total annual city revenue expenditure (`) 59,590,638
WATER SUPPLYTotal water produced (MLD) 1.2
Ground water (MLD) 0.0
Surface water (MLD) 1.2
Average daily volume treated (MLD) 1.1
Installed storage capacity (MLD) 1.1
Total water connections (nos.) 1,771.0
Water connections in slums (nos.) 89.0
Area covered by network (sq. km.) 3.2
No. of days of supply in a month 15.0
Annual revenue receipts from water (`) 1,415,510.0
Annual revenue expenditure on water (`) 3,438,045.0
Annual capital expenditure on water (`) 2,197,660.0
WASTE WATERArea covered by waste water network (sq. km.) 2.0
Underground sewerage network (sq. km) 0.0
Closed drains (sq. km) 0.0
Open drains (sq. km) 2.0
Total sewerage connections (nos.) 0.0
Sewerage coverage: slums (%) 0.0
Installed STP treatment capacity (MLD) 0.0
Annual revenue receipts from WW (`) 0.0
Annual revenue expenditure on WW (`) 1,851,362.0
Annual capital expenditure on WW (`) 268,917.0
SOLID WASTE MANAGEMENTWaste generated (TPD) 7.0
Waste collected (TPD) 7.0
Quantity of waste treated (TPD) 0.0
Waste received at scientific landfill (TPD) 0.0
Door to door colln.(no. of households andestablishments)
5,425.0
Waste segregation at source (Y/N) N
Annual revenue receipts from SW (`) 0.0
Annual revenue expenditure on SW (`) 2,242,703.0
Annual capital expenditure on SW (`) 125,645.0
137

Mangrulpir Municipal Council
Service Level Benchmark Indicators
WATER SUPPLY
WASTE WATER
SOLID WASTE MANAGEMENT STORM WATER
Blank values represent 'zero', 'not applicable' or 'no data' in the charts above.
138

Manwath Municipal Council Background
GENERAL INFORMATIONClass Class C No. of slum settlements 6
District Parbhani Slum population 4,175
Area (sq. km.) 7 Slum households 535
Total city population 36,000 Total annual city capital receipts (`) 46,000,000
Total households 7,500 Total annual city capital expenditure (`) 54,500,000
Density (persons per sq. km.) 4,932 Total annual city revenue receipts (`) 45,931,000
Total municipal staff 133 Total annual city revenue expenditure (`) 54,502,000
WATER SUPPLYTotal water produced (MLD) 2.3
Ground water (MLD) 0.0
Surface water (MLD) 2.3
Average daily volume treated (MLD) 2.3
Installed storage capacity (MLD) 4.1
Total water connections (nos.) 4,449.0
Water connections in slums (nos.) 387.0
Area covered by network (sq. km.) 7.7
No. of days of supply in a month 15.0
Annual revenue receipts from water (`) 2,362,000.0
Annual revenue expenditure on water (`) 2,200,000.0
Annual capital expenditure on water (`) 2,200,000.0
WASTE WATERArea covered by waste water network (sq. km.) 6.2
Underground sewerage network (sq. km) 0.0
Closed drains (sq. km) 0.0
Open drains (sq. km) 6.2
Total sewerage connections (nos.) 0.0
Sewerage coverage: slums (%) 0.0
Installed STP treatment capacity (MLD) 0.0
Annual revenue receipts from WW (`) 0.0
Annual revenue expenditure on WW (`) 0.0
Annual capital expenditure on WW (`) 0.0
SOLID WASTE MANAGEMENTWaste generated (TPD) 5.0
Waste collected (TPD) 5.0
Quantity of waste treated (TPD) 0.0
Waste received at scientific landfill (TPD) 0.0
Door to door colln.(no. of households andestablishments)
6,350.0
Waste segregation at source (Y/N) N
Annual revenue receipts from SW (`) 0.0
Annual revenue expenditure on SW (`) 4,200,000.0
Annual capital expenditure on SW (`) 4,200,000.0
139

Manwath Municipal Council
Service Level Benchmark Indicators
WATER SUPPLY
WASTE WATER
SOLID WASTE MANAGEMENT STORM WATER
Blank values represent 'zero', 'not applicable' or 'no data' in the charts above.
140

Matheran Municipal Council Background
GENERAL INFORMATIONClass Class C No. of slum settlements 8
District Raigad Slum population 2,400
Area (sq. km.) 7 Slum households 480
Total city population 5,515 Total annual city capital receipts (`) 47,140,752
Total households 1,069 Total annual city capital expenditure (`) 42,389,644
Density (persons per sq. km.) 766 Total annual city revenue receipts (`) 23,540,525
Total municipal staff 56 Total annual city revenue expenditure (`) 23,866,687
WATER SUPPLYTotal water produced (MLD) 1.4
Ground water (MLD) 0.0
Surface water (MLD) 1.4
Average daily volume treated (MLD) 1.4
Installed storage capacity (MLD) 1.2
Total water connections (nos.) 1,027.0
Water connections in slums (nos.) 0.0
Area covered by network (sq. km.) 7.0
No. of days of supply in a month 30.0
Annual revenue receipts from water (`) 0.0
Annual revenue expenditure on water (`) 3,155,372.0
Annual capital expenditure on water (`) 0.0
WASTE WATERArea covered by waste water network (sq. km.) 14.0
Underground sewerage network (sq. km) 0.0
Closed drains (sq. km) 7.0
Open drains (sq. km) 7.0
Total sewerage connections (nos.) 0.0
Sewerage coverage: slums (%) 0.0
Installed STP treatment capacity (MLD) 0.0
Annual revenue receipts from WW (`) 0.0
Annual revenue expenditure on WW (`) 0.0
Annual capital expenditure on WW (`) 0.0
SOLID WASTE MANAGEMENTWaste generated (TPD) 6.5
Waste collected (TPD) 6.5
Quantity of waste treated (TPD) 4.5
Waste received at scientific landfill (TPD) 0.0
Door to door colln.(no. of households andestablishments)
1,141.0
Waste segregation at source (Y/N) Y
Annual revenue receipts from SW (`) 0.0
Annual revenue expenditure on SW (`) 0.0
Annual capital expenditure on SW (`) 0.0
141

Matheran Municipal Council
Service Level Benchmark Indicators
WATER SUPPLY
WASTE WATER
SOLID WASTE MANAGEMENT STORM WATER
Blank values represent 'zero', 'not applicable' or 'no data' in the charts above.
142

Mehkar Municipal Council Background
GENERAL INFORMATIONClass Class C No. of slum settlements 1
District Buldhana Slum population 6,480
Area (sq. km.) 6 Slum households 1,296
Total city population 48,139 Total annual city capital receipts (`) 1,526,197
Total households 8,232 Total annual city capital expenditure (`) 27,583,822
Density (persons per sq. km.) 8,752 Total annual city revenue receipts (`) 53,333,261
Total municipal staff 157 Total annual city revenue expenditure (`) 58,700,114
WATER SUPPLYTotal water produced (MLD) 2.2
Ground water (MLD) 0.0
Surface water (MLD) 2.2
Average daily volume treated (MLD) 2.2
Installed storage capacity (MLD) 2.2
Total water connections (nos.) 4,966.0
Water connections in slums (nos.) 720.0
Area covered by network (sq. km.) 5.0
No. of days of supply in a month 10.0
Annual revenue receipts from water (`) 3,153,960.0
Annual revenue expenditure on water (`) 13,138,274.0
Annual capital expenditure on water (`) 0.0
WASTE WATERArea covered by waste water network (sq. km.) 4.5
Underground sewerage network (sq. km) 0.0
Closed drains (sq. km) 0.0
Open drains (sq. km) 4.5
Total sewerage connections (nos.) 0.0
Sewerage coverage: slums (%) 0.0
Installed STP treatment capacity (MLD) 0.0
Annual revenue receipts from WW (`) 0.0
Annual revenue expenditure on WW (`) 0.0
Annual capital expenditure on WW (`) 0.0
SOLID WASTE MANAGEMENTWaste generated (TPD) 8.0
Waste collected (TPD) 5.5
Quantity of waste treated (TPD) 0.0
Waste received at scientific landfill (TPD) 0.0
Door to door colln.(no. of households andestablishments)
0.0
Waste segregation at source (Y/N) N
Annual revenue receipts from SW (`) 0.0
Annual revenue expenditure on SW (`) 0.0
Annual capital expenditure on SW (`) 4,459,588.0
143

Mehkar Municipal Council
Service Level Benchmark Indicators
WATER SUPPLY
WASTE WATER
SOLID WASTE MANAGEMENT STORM WATER
Blank values represent 'zero', 'not applicable' or 'no data' in the charts above.
144

Mhaswad Municipal Council Background
GENERAL INFORMATIONClass Class C No. of slum settlements 0
District Satara Slum population 0
Area (sq. km.) 88 Slum households 0
Total city population 22,550 Total annual city capital receipts (`) 20,744,712
Total households 4,452 Total annual city capital expenditure (`) 13,187,092
Density (persons per sq. km.) 256 Total annual city revenue receipts (`) 16,366,637
Total municipal staff 41 Total annual city revenue expenditure (`) 13,475,001
WATER SUPPLYTotal water produced (MLD) 2.6
Ground water (MLD) 0.0
Surface water (MLD) 2.6
Average daily volume treated (MLD) 2.5
Installed storage capacity (MLD) 0.8
Total water connections (nos.) 2,346.0
Water connections in slums (nos.) 0.0
Area covered by network (sq. km.) 25.1
No. of days of supply in a month 15.0
Annual revenue receipts from water (`) 4,779,731.0
Annual revenue expenditure on water (`) 4,607,264.0
Annual capital expenditure on water (`) 6,570,064.0
WASTE WATERArea covered by waste water network (sq. km.) 17.2
Underground sewerage network (sq. km) 0.0
Closed drains (sq. km) 0.0
Open drains (sq. km) 17.2
Total sewerage connections (nos.) 0.0
Sewerage coverage: slums (%) 0.0
Installed STP treatment capacity (MLD) 0.0
Annual revenue receipts from WW (`) 0.0
Annual revenue expenditure on WW (`) 0.0
Annual capital expenditure on WW (`) 184,891.0
SOLID WASTE MANAGEMENTWaste generated (TPD) 2.0
Waste collected (TPD) 2.0
Quantity of waste treated (TPD) 0.0
Waste received at scientific landfill (TPD) 0.0
Door to door colln.(no. of households andestablishments)
2,354.0
Waste segregation at source (Y/N) N
Annual revenue receipts from SW (`) 0.0
Annual revenue expenditure on SW (`) 0.0
Annual capital expenditure on SW (`) 2,701,011.0
145

Mhaswad Municipal Council
Service Level Benchmark Indicators
WATER SUPPLY
WASTE WATER
SOLID WASTE MANAGEMENT STORM WATER
Blank values represent 'zero', 'not applicable' or 'no data' in the charts above.
146

Mohpa Municipal Council Background
GENERAL INFORMATIONClass Class C No. of slum settlements 0
District Nagpur Slum population 0
Area (sq. km.) 2 Slum households 0
Total city population 8,000 Total annual city capital receipts (`) 17,274,000
Total households 1,696 Total annual city capital expenditure (`) 18,431,000
Density (persons per sq. km.) 5,333 Total annual city revenue receipts (`) 13,210,000
Total municipal staff 19 Total annual city revenue expenditure (`) 12,963,000
WATER SUPPLYTotal water produced (MLD) 0.6
Ground water (MLD) 0.1
Surface water (MLD) 0.5
Average daily volume treated (MLD) 0.6
Installed storage capacity (MLD) 0.3
Total water connections (nos.) 872.0
Water connections in slums (nos.) 0.0
Area covered by network (sq. km.) 1.5
No. of days of supply in a month 25.0
Annual revenue receipts from water (`) 738,000.0
Annual revenue expenditure on water (`) 809,000.0
Annual capital expenditure on water (`) 0.0
WASTE WATERArea covered by waste water network (sq. km.) 1.6
Underground sewerage network (sq. km) 0.0
Closed drains (sq. km) 1.3
Open drains (sq. km) 0.3
Total sewerage connections (nos.) 0.0
Sewerage coverage: slums (%) 0.0
Installed STP treatment capacity (MLD) 0.0
Annual revenue receipts from WW (`) 0.0
Annual revenue expenditure on WW (`) 608,000.0
Annual capital expenditure on WW (`) 0.0
SOLID WASTE MANAGEMENTWaste generated (TPD) 2.0
Waste collected (TPD) 2.0
Quantity of waste treated (TPD) 0.0
Waste received at scientific landfill (TPD) 0.0
Door to door colln.(no. of households andestablishments)
2,221.0
Waste segregation at source (Y/N) N
Annual revenue receipts from SW (`) 0.0
Annual revenue expenditure on SW (`) 0.0
Annual capital expenditure on SW (`) 1,799,000.0
147

Mohpa Municipal Council
Service Level Benchmark Indicators
WATER SUPPLY
WASTE WATER
SOLID WASTE MANAGEMENT STORM WATER
Blank values represent 'zero', 'not applicable' or 'no data' in the charts above.
148

Mool Municipal Council Background
GENERAL INFORMATIONClass Class C No. of slum settlements 4
District Chandrapur Slum population 8,020
Area (sq. km.) 23 Slum households 2,553
Total city population 26,537 Total annual city capital receipts (`) 107,491,445
Total households 6,026 Total annual city capital expenditure (`) 16,140,066
Density (persons per sq. km.) 1,134 Total annual city revenue receipts (`) 18,449,732
Total municipal staff 122 Total annual city revenue expenditure (`) 32,860,915
WATER SUPPLYTotal water produced (MLD) 1.0
Ground water (MLD) 0.0
Surface water (MLD) 1.0
Average daily volume treated (MLD) 1.0
Installed storage capacity (MLD) 1.0
Total water connections (nos.) 1,694.0
Water connections in slums (nos.) 447.0
Area covered by network (sq. km.) 0.0
No. of days of supply in a month 30.0
Annual revenue receipts from water (`) 1,400,054.0
Annual revenue expenditure on water (`) 4,382,823.0
Annual capital expenditure on water (`) 337,334.0
WASTE WATERArea covered by waste water network (sq. km.) 20.0
Underground sewerage network (sq. km) 0.0
Closed drains (sq. km) 0.0
Open drains (sq. km) 20.0
Total sewerage connections (nos.) 0.0
Sewerage coverage: slums (%) 0.0
Installed STP treatment capacity (MLD) 0.0
Annual revenue receipts from WW (`) 0.0
Annual revenue expenditure on WW (`) 3,376,000.0
Annual capital expenditure on WW (`) 838,000.0
SOLID WASTE MANAGEMENTWaste generated (TPD) 10.0
Waste collected (TPD) 5.0
Quantity of waste treated (TPD) 0.0
Waste received at scientific landfill (TPD) 1.0
Door to door colln.(no. of households andestablishments)
4,829.0
Waste segregation at source (Y/N) N
Annual revenue receipts from SW (`) 1,229,995.0
Annual revenue expenditure on SW (`) 2,256,407.0
Annual capital expenditure on SW (`) 2,171,949.0
149

Mool Municipal Council
Service Level Benchmark Indicators
WATER SUPPLY
WASTE WATER
SOLID WASTE MANAGEMENT STORM WATER
Blank values represent 'zero', 'not applicable' or 'no data' in the charts above.
150

Morshi Municipal Council Background
GENERAL INFORMATIONClass Class C No. of slum settlements 8
District Amravati Slum population 3,000
Area (sq. km.) 5 Slum households 700
Total city population 41,000 Total annual city capital receipts (`) 12,300,000
Total households 7,324 Total annual city capital expenditure (`) 14,886,000
Density (persons per sq. km.) 8,367 Total annual city revenue receipts (`) 40,956,000
Total municipal staff 78 Total annual city revenue expenditure (`) 53,483,000
WATER SUPPLYTotal water produced (MLD) 4.5
Ground water (MLD) 0.0
Surface water (MLD) 4.5
Average daily volume treated (MLD) 4.0
Installed storage capacity (MLD) 1.8
Total water connections (nos.) 3,920.0
Water connections in slums (nos.) 0.0
Area covered by network (sq. km.) 5.7
No. of days of supply in a month 30.0
Annual revenue receipts from water (`) 6,800,000.0
Annual revenue expenditure on water (`) 6,200,000.0
Annual capital expenditure on water (`) 0.0
WASTE WATERArea covered by waste water network (sq. km.) 4.9
Underground sewerage network (sq. km) 0.0
Closed drains (sq. km) 0.0
Open drains (sq. km) 4.9
Total sewerage connections (nos.) 0.0
Sewerage coverage: slums (%) 0.0
Installed STP treatment capacity (MLD) 0.0
Annual revenue receipts from WW (`) 0.0
Annual revenue expenditure on WW (`) 4,886,000.0
Annual capital expenditure on WW (`) 1,200,000.0
SOLID WASTE MANAGEMENTWaste generated (TPD) 6.5
Waste collected (TPD) 6.5
Quantity of waste treated (TPD) 0.0
Waste received at scientific landfill (TPD) 0.0
Door to door colln.(no. of households andestablishments)
6,902.0
Waste segregation at source (Y/N) N
Annual revenue receipts from SW (`) 0.0
Annual revenue expenditure on SW (`) 300,000.0
Annual capital expenditure on SW (`) 2,520,000.0
151

Morshi Municipal Council
Service Level Benchmark Indicators
WATER SUPPLY
WASTE WATER
SOLID WASTE MANAGEMENT STORM WATER
Blank values represent 'zero', 'not applicable' or 'no data' in the charts above.
152

Mowad Municipal Council Background
GENERAL INFORMATIONClass Class C No. of slum settlements 2
District Nagpur Slum population 390
Area (sq. km.) 7 Slum households 74
Total city population 9,523 Total annual city capital receipts (`) 27,328,000
Total households 2,039 Total annual city capital expenditure (`) 23,190,784
Density (persons per sq. km.) 1,421 Total annual city revenue receipts (`) 27,327,999
Total municipal staff 30 Total annual city revenue expenditure (`) 23,201,230
WATER SUPPLYTotal water produced (MLD) 0.7
Ground water (MLD) 0.7
Surface water (MLD) 0.0
Average daily volume treated (MLD) 0.0
Installed storage capacity (MLD) 0.8
Total water connections (nos.) 1,060.0
Water connections in slums (nos.) 24.0
Area covered by network (sq. km.) 2.0
No. of days of supply in a month 30.0
Annual revenue receipts from water (`) 1,192,063.0
Annual revenue expenditure on water (`) 723,010.0
Annual capital expenditure on water (`) 903,339.0
WASTE WATERArea covered by waste water network (sq. km.) 9.0
Underground sewerage network (sq. km) 0.0
Closed drains (sq. km) 4.0
Open drains (sq. km) 5.0
Total sewerage connections (nos.) 0.0
Sewerage coverage: slums (%) 0.0
Installed STP treatment capacity (MLD) 0.0
Annual revenue receipts from WW (`) 0.0
Annual revenue expenditure on WW (`) 0.0
Annual capital expenditure on WW (`) 0.0
SOLID WASTE MANAGEMENTWaste generated (TPD) 0.5
Waste collected (TPD) 0.5
Quantity of waste treated (TPD) 0.0
Waste received at scientific landfill (TPD) 0.0
Door to door colln.(no. of households andestablishments)
1,810.0
Waste segregation at source (Y/N) N
Annual revenue receipts from SW (`) 0.0
Annual revenue expenditure on SW (`) 0.0
Annual capital expenditure on SW (`) 0.0
153

Mowad Municipal Council
Service Level Benchmark Indicators
WATER SUPPLY
WASTE WATER
SOLID WASTE MANAGEMENT STORM WATER
Blank values represent 'zero', 'not applicable' or 'no data' in the charts above.
154

Mudkhed Municipal Council Background
GENERAL INFORMATIONClass Class C No. of slum settlements 7
District Nanded Slum population 4,250
Area (sq. km.) 0 Slum households 0
Total city population 27,000 Total annual city capital receipts (`) 1,123,244
Total households 3,509 Total annual city capital expenditure (`) 1,451,350
Density (persons per sq. km.) 0 Total annual city revenue receipts (`) 1,123,244
Total municipal staff 60 Total annual city revenue expenditure (`) 1,451,350
WATER SUPPLYTotal water produced (MLD) 1.2
Ground water (MLD) 1.2
Surface water (MLD) 0.0
Average daily volume treated (MLD) 0.0
Installed storage capacity (MLD) 0.1
Total water connections (nos.) 1,111.0
Water connections in slums (nos.) 125.0
Area covered by network (sq. km.) 6.7
No. of days of supply in a month 30.0
Annual revenue receipts from water (`) 665,568.0
Annual revenue expenditure on water (`) 0.0
Annual capital expenditure on water (`) 0.0
WASTE WATERArea covered by waste water network (sq. km.) 3.6
Underground sewerage network (sq. km) 0.0
Closed drains (sq. km) 0.1
Open drains (sq. km) 3.5
Total sewerage connections (nos.) 2,784.0
Sewerage coverage: slums (%) 0.0
Installed STP treatment capacity (MLD) 0.0
Annual revenue receipts from WW (`) 0.0
Annual revenue expenditure on WW (`) 0.0
Annual capital expenditure on WW (`) 0.0
SOLID WASTE MANAGEMENTWaste generated (TPD) 5.6
Waste collected (TPD) 5.6
Quantity of waste treated (TPD) 0.0
Waste received at scientific landfill (TPD) 0.0
Door to door colln.(no. of households andestablishments)
125.0
Waste segregation at source (Y/N) N
Annual revenue receipts from SW (`) 0.0
Annual revenue expenditure on SW (`) 0.0
Annual capital expenditure on SW (`) 0.0
155

Mudkhed Municipal Council
Service Level Benchmark Indicators
WATER SUPPLY
WASTE WATER
SOLID WASTE MANAGEMENT STORM WATER
Blank values represent 'zero', 'not applicable' or 'no data' in the charts above.
156

Mukhed Municipal Council Background
GENERAL INFORMATIONClass Class C No. of slum settlements 2
District Nanded Slum population 6,000
Area (sq. km.) 33 Slum households 400
Total city population 31,123 Total annual city capital receipts (`) 0
Total households 5,342 Total annual city capital expenditure (`) 0
Density (persons per sq. km.) 940 Total annual city revenue receipts (`) 41,756,000
Total municipal staff 0 Total annual city revenue expenditure (`) 34,379,000
WATER SUPPLYTotal water produced (MLD) 2.0
Ground water (MLD) 0.0
Surface water (MLD) 2.0
Average daily volume treated (MLD) 2.0
Installed storage capacity (MLD) 2.4
Total water connections (nos.) 2,489.0
Water connections in slums (nos.) 0.0
Area covered by network (sq. km.) 30.0
No. of days of supply in a month 15.0
Annual revenue receipts from water (`) 1,189,000.0
Annual revenue expenditure on water (`) 4,508,000.0
Annual capital expenditure on water (`) 4,508,000.0
WASTE WATERArea covered by waste water network (sq. km.) 20.0
Underground sewerage network (sq. km) 0.0
Closed drains (sq. km) 0.0
Open drains (sq. km) 20.0
Total sewerage connections (nos.) 0.0
Sewerage coverage: slums (%) 0.0
Installed STP treatment capacity (MLD) 0.0
Annual revenue receipts from WW (`) 0.0
Annual revenue expenditure on WW (`) 3,488,000.0
Annual capital expenditure on WW (`) 3,488,000.0
SOLID WASTE MANAGEMENTWaste generated (TPD) 6.0
Waste collected (TPD) 6.0
Quantity of waste treated (TPD) 0.0
Waste received at scientific landfill (TPD) 0.0
Door to door colln.(no. of households andestablishments)
56.0
Waste segregation at source (Y/N) N
Annual revenue receipts from SW (`) 0.0
Annual revenue expenditure on SW (`) 0.0
Annual capital expenditure on SW (`) 805,000.0
157

Mukhed Municipal Council
Service Level Benchmark Indicators
WATER SUPPLY
WASTE WATER
SOLID WASTE MANAGEMENT STORM WATER
Blank values represent 'zero', 'not applicable' or 'no data' in the charts above.
158

Murgud Municipal Council Background
GENERAL INFORMATIONClass Class C No. of slum settlements 0
District Kolhapur Slum population 0
Area (sq. km.) 11 Slum households 0
Total city population 10,839 Total annual city capital receipts (`) 8,900,743
Total households 2,300 Total annual city capital expenditure (`) 7,070,380
Density (persons per sq. km.) 985 Total annual city revenue receipts (`) 28,203,263
Total municipal staff 68 Total annual city revenue expenditure (`) 28,166,399
WATER SUPPLYTotal water produced (MLD) 0.8
Ground water (MLD) 0.0
Surface water (MLD) 0.8
Average daily volume treated (MLD) 0.8
Installed storage capacity (MLD) 0.5
Total water connections (nos.) 1,905.0
Water connections in slums (nos.) 0.0
Area covered by network (sq. km.) 2.1
No. of days of supply in a month 30.0
Annual revenue receipts from water (`) 1,670,767.0
Annual revenue expenditure on water (`) 3,008,672.0
Annual capital expenditure on water (`) 341,768.0
WASTE WATERArea covered by waste water network (sq. km.) 2.1
Underground sewerage network (sq. km) 0.0
Closed drains (sq. km) 0.0
Open drains (sq. km) 2.1
Total sewerage connections (nos.) 0.0
Sewerage coverage: slums (%) 0.0
Installed STP treatment capacity (MLD) 0.0
Annual revenue receipts from WW (`) 0.0
Annual revenue expenditure on WW (`) 0.0
Annual capital expenditure on WW (`) 0.0
SOLID WASTE MANAGEMENTWaste generated (TPD) 3.0
Waste collected (TPD) 3.0
Quantity of waste treated (TPD) 0.0
Waste received at scientific landfill (TPD) 0.0
Door to door colln.(no. of households andestablishments)
2,365.0
Waste segregation at source (Y/N) N
Annual revenue receipts from SW (`) 0.0
Annual revenue expenditure on SW (`) 2,744,932.0
Annual capital expenditure on SW (`) 2,951,169.0
159

Murgud Municipal Council
Service Level Benchmark Indicators
WATER SUPPLY
WASTE WATER
SOLID WASTE MANAGEMENT STORM WATER
Blank values represent 'zero', 'not applicable' or 'no data' in the charts above.
160

Murtijapur Municipal Council Background
GENERAL INFORMATIONClass Class C No. of slum settlements 0
District Akola Slum population 0
Area (sq. km.) 6 Slum households 0
Total city population 50,000 Total annual city capital receipts (`) 76,866,000
Total households 9,280 Total annual city capital expenditure (`) 3,536,600
Density (persons per sq. km.) 9,091 Total annual city revenue receipts (`) 30,271,000
Total municipal staff 42 Total annual city revenue expenditure (`) 33,606,000
WATER SUPPLYTotal water produced (MLD) 1.0
Ground water (MLD) 0.0
Surface water (MLD) 1.0
Average daily volume treated (MLD) 1.0
Installed storage capacity (MLD) 1.0
Total water connections (nos.) 3,056.0
Water connections in slums (nos.) 0.0
Area covered by network (sq. km.) 5.0
No. of days of supply in a month 0.0
Annual revenue receipts from water (`) 0.0
Annual revenue expenditure on water (`) 0.0
Annual capital expenditure on water (`) 0.0
WASTE WATERArea covered by waste water network (sq. km.) 4.5
Underground sewerage network (sq. km) 0.0
Closed drains (sq. km) 0.0
Open drains (sq. km) 4.5
Total sewerage connections (nos.) 0.0
Sewerage coverage: slums (%) 0.0
Installed STP treatment capacity (MLD) 0.0
Annual revenue receipts from WW (`) 0.0
Annual revenue expenditure on WW (`) 0.0
Annual capital expenditure on WW (`) 0.0
SOLID WASTE MANAGEMENTWaste generated (TPD) 10.0
Waste collected (TPD) 10.0
Quantity of waste treated (TPD) 0.0
Waste received at scientific landfill (TPD) 0.0
Door to door colln.(no. of households andestablishments)
0.0
Waste segregation at source (Y/N) nd
Annual revenue receipts from SW (`) 0.0
Annual revenue expenditure on SW (`) 0.0
Annual capital expenditure on SW (`) 0.0
161
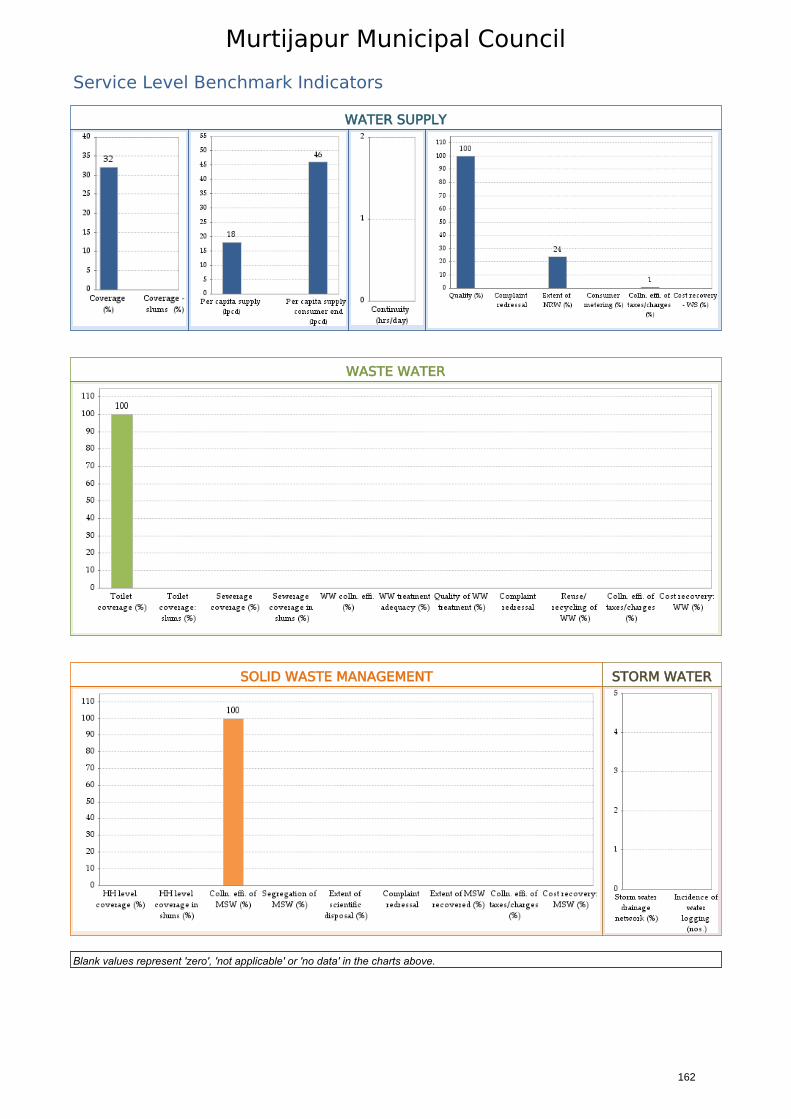
Murtijapur Municipal Council
Service Level Benchmark Indicators
WATER SUPPLY
WASTE WATER
SOLID WASTE MANAGEMENT STORM WATER
Blank values represent 'zero', 'not applicable' or 'no data' in the charts above.
162

Murud Municipal Council Background
GENERAL INFORMATIONClass Class C No. of slum settlements 0
District Raigad Slum population 0
Area (sq. km.) 3 Slum households 0
Total city population 13,000 Total annual city capital receipts (`) 10,687,000
Total households 2,693 Total annual city capital expenditure (`) 11,485,000
Density (persons per sq. km.) 4,062 Total annual city revenue receipts (`) 15,641,000
Total municipal staff 56 Total annual city revenue expenditure (`) 8,147,000
WATER SUPPLYTotal water produced (MLD) 2.2
Ground water (MLD) 2.2
Surface water (MLD) 0.0
Average daily volume treated (MLD) 0.0
Installed storage capacity (MLD) 1,100,000.0
Total water connections (nos.) 2,057.0
Water connections in slums (nos.) 0.0
Area covered by network (sq. km.) 3.2
No. of days of supply in a month 30.0
Annual revenue receipts from water (`) 7,300,000.2
Annual revenue expenditure on water (`) 4,030,000.0
Annual capital expenditure on water (`) 625,000.0
WASTE WATERArea covered by waste water network (sq. km.) 0.0
Underground sewerage network (sq. km) 0.0
Closed drains (sq. km) 0.0
Open drains (sq. km) 0.0
Total sewerage connections (nos.) 0.0
Sewerage coverage: slums (%) 0.0
Installed STP treatment capacity (MLD) 0.0
Annual revenue receipts from WW (`) 0.0
Annual revenue expenditure on WW (`) 0.0
Annual capital expenditure on WW (`) 0.0
SOLID WASTE MANAGEMENTWaste generated (TPD) 5.0
Waste collected (TPD) 3.0
Quantity of waste treated (TPD) 0.0
Waste received at scientific landfill (TPD) 0.0
Door to door colln.(no. of households andestablishments)
387.0
Waste segregation at source (Y/N) N
Annual revenue receipts from SW (`) 15,000.0
Annual revenue expenditure on SW (`) 3,160,000.0
Annual capital expenditure on SW (`) 20,000.0
163

Murud Municipal Council
Service Level Benchmark Indicators
WATER SUPPLY
WASTE WATER
SOLID WASTE MANAGEMENT STORM WATER
Blank values represent 'zero', 'not applicable' or 'no data' in the charts above.
164

Murum Municipal Council Background
GENERAL INFORMATIONClass Class C No. of slum settlements 8
District Osmanabad Slum population 9,500
Area (sq. km.) 4 Slum households 2,100
Total city population 22,000 Total annual city capital receipts (`) 18,867,000
Total households 4,217 Total annual city capital expenditure (`) 17,249,000
Density (persons per sq. km.) 6,111 Total annual city revenue receipts (`) 6,087,000
Total municipal staff 33 Total annual city revenue expenditure (`) 18,056,000
WATER SUPPLYTotal water produced (MLD) 5.5
Ground water (MLD) 0.0
Surface water (MLD) 5.5
Average daily volume treated (MLD) 5.5
Installed storage capacity (MLD) 10.0
Total water connections (nos.) 1,746.0
Water connections in slums (nos.) 445.0
Area covered by network (sq. km.) 3.6
No. of days of supply in a month 15.0
Annual revenue receipts from water (`) 707,000.0
Annual revenue expenditure on water (`) 884,000.0
Annual capital expenditure on water (`) 609,000.0
WASTE WATERArea covered by waste water network (sq. km.) 1.5
Underground sewerage network (sq. km) 0.0
Closed drains (sq. km) 0.0
Open drains (sq. km) 1.5
Total sewerage connections (nos.) 0.0
Sewerage coverage: slums (%) 0.0
Installed STP treatment capacity (MLD) 0.0
Annual revenue receipts from WW (`) 0.0
Annual revenue expenditure on WW (`) 0.0
Annual capital expenditure on WW (`) 0.0
SOLID WASTE MANAGEMENTWaste generated (TPD) 4.0
Waste collected (TPD) 4.0
Quantity of waste treated (TPD) 0.0
Waste received at scientific landfill (TPD) 0.0
Door to door colln.(no. of households andestablishments)
1,202.0
Waste segregation at source (Y/N) N
Annual revenue receipts from SW (`) 0.0
Annual revenue expenditure on SW (`) 2,349,000.0
Annual capital expenditure on SW (`) 0.0
165

Murum Municipal Council
Service Level Benchmark Indicators
WATER SUPPLY
WASTE WATER
SOLID WASTE MANAGEMENT STORM WATER
Blank values represent 'zero', 'not applicable' or 'no data' in the charts above.
166

Naldurg Municipal Council Background
GENERAL INFORMATIONClass Class C No. of slum settlements 4
District Osmanabad Slum population 3,383
Area (sq. km.) 11 Slum households 1,153
Total city population 19,858 Total annual city capital receipts (`) 48,636,000
Total households 7,097 Total annual city capital expenditure (`) 41,095,000
Density (persons per sq. km.) 1,805 Total annual city revenue receipts (`) 16,467,000
Total municipal staff 72 Total annual city revenue expenditure (`) 7,362,000
WATER SUPPLYTotal water produced (MLD) 1.6
Ground water (MLD) 0.1
Surface water (MLD) 1.5
Average daily volume treated (MLD) 1.5
Installed storage capacity (MLD) 1.1
Total water connections (nos.) 1,379.0
Water connections in slums (nos.) 793.0
Area covered by network (sq. km.) 11.0
No. of days of supply in a month 30.0
Annual revenue receipts from water (`) 1,081,000.0
Annual revenue expenditure on water (`) 1,534,000.0
Annual capital expenditure on water (`) 0.0
WASTE WATERArea covered by waste water network (sq. km.) 11.0
Underground sewerage network (sq. km) 0.0
Closed drains (sq. km) 0.0
Open drains (sq. km) 11.0
Total sewerage connections (nos.) 0.0
Sewerage coverage: slums (%) 0.0
Installed STP treatment capacity (MLD) 0.0
Annual revenue receipts from WW (`) 0.0
Annual revenue expenditure on WW (`) 0.0
Annual capital expenditure on WW (`) 500,000.0
SOLID WASTE MANAGEMENTWaste generated (TPD) 4.0
Waste collected (TPD) 4.0
Quantity of waste treated (TPD) 0.0
Waste received at scientific landfill (TPD) 0.0
Door to door colln.(no. of households andestablishments)
0.0
Waste segregation at source (Y/N) N
Annual revenue receipts from SW (`) 0.0
Annual revenue expenditure on SW (`) 2,229,000.0
Annual capital expenditure on SW (`) 1,185,000.0
167

Naldurg Municipal Council
Service Level Benchmark Indicators
WATER SUPPLY
WASTE WATER
SOLID WASTE MANAGEMENT STORM WATER
Blank values represent 'zero', 'not applicable' or 'no data' in the charts above.
168
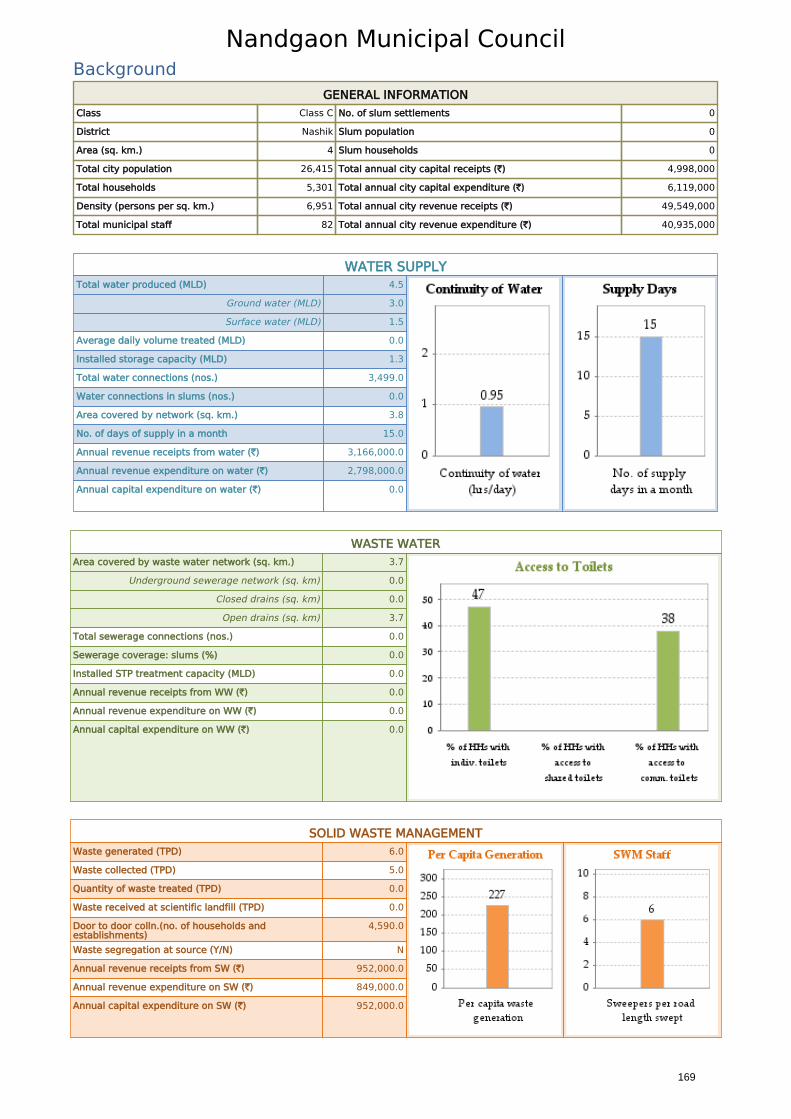
Nandgaon Municipal Council Background
GENERAL INFORMATIONClass Class C No. of slum settlements 0
District Nashik Slum population 0
Area (sq. km.) 4 Slum households 0
Total city population 26,415 Total annual city capital receipts (`) 4,998,000
Total households 5,301 Total annual city capital expenditure (`) 6,119,000
Density (persons per sq. km.) 6,951 Total annual city revenue receipts (`) 49,549,000
Total municipal staff 82 Total annual city revenue expenditure (`) 40,935,000
WATER SUPPLYTotal water produced (MLD) 4.5
Ground water (MLD) 3.0
Surface water (MLD) 1.5
Average daily volume treated (MLD) 0.0
Installed storage capacity (MLD) 1.3
Total water connections (nos.) 3,499.0
Water connections in slums (nos.) 0.0
Area covered by network (sq. km.) 3.8
No. of days of supply in a month 15.0
Annual revenue receipts from water (`) 3,166,000.0
Annual revenue expenditure on water (`) 2,798,000.0
Annual capital expenditure on water (`) 0.0
WASTE WATERArea covered by waste water network (sq. km.) 3.7
Underground sewerage network (sq. km) 0.0
Closed drains (sq. km) 0.0
Open drains (sq. km) 3.7
Total sewerage connections (nos.) 0.0
Sewerage coverage: slums (%) 0.0
Installed STP treatment capacity (MLD) 0.0
Annual revenue receipts from WW (`) 0.0
Annual revenue expenditure on WW (`) 0.0
Annual capital expenditure on WW (`) 0.0
SOLID WASTE MANAGEMENTWaste generated (TPD) 6.0
Waste collected (TPD) 5.0
Quantity of waste treated (TPD) 0.0
Waste received at scientific landfill (TPD) 0.0
Door to door colln.(no. of households andestablishments)
4,590.0
Waste segregation at source (Y/N) N
Annual revenue receipts from SW (`) 952,000.0
Annual revenue expenditure on SW (`) 849,000.0
Annual capital expenditure on SW (`) 952,000.0
169

Nandgaon Municipal Council
Service Level Benchmark Indicators
WATER SUPPLY
WASTE WATER
SOLID WASTE MANAGEMENT STORM WATER
Blank values represent 'zero', 'not applicable' or 'no data' in the charts above.
170

Nandura Municipal Council Background
GENERAL INFORMATIONClass Class C No. of slum settlements 7
District Buldhana Slum population 1,400
Area (sq. km.) 6 Slum households 269
Total city population 45,000 Total annual city capital receipts (`) 56,591,000
Total households 8,648 Total annual city capital expenditure (`) 16,435,000
Density (persons per sq. km.) 8,182 Total annual city revenue receipts (`) 62,297,000
Total municipal staff 200 Total annual city revenue expenditure (`) 65,329,000
WATER SUPPLYTotal water produced (MLD) 3.0
Ground water (MLD) 1.0
Surface water (MLD) 2.0
Average daily volume treated (MLD) 1.8
Installed storage capacity (MLD) 1.2
Total water connections (nos.) 4,007.0
Water connections in slums (nos.) 50.0
Area covered by network (sq. km.) 5.6
No. of days of supply in a month 15.0
Annual revenue receipts from water (`) 2,751,000.0
Annual revenue expenditure on water (`) 5,945,000.0
Annual capital expenditure on water (`) 5,974,000.0
WASTE WATERArea covered by waste water network (sq. km.) 5.5
Underground sewerage network (sq. km) 0.0
Closed drains (sq. km) 0.0
Open drains (sq. km) 5.5
Total sewerage connections (nos.) 0.0
Sewerage coverage: slums (%) 0.0
Installed STP treatment capacity (MLD) 0.0
Annual revenue receipts from WW (`) 0.0
Annual revenue expenditure on WW (`) 9,322,000.0
Annual capital expenditure on WW (`) 9,311,000.0
SOLID WASTE MANAGEMENTWaste generated (TPD) 7.0
Waste collected (TPD) 7.0
Quantity of waste treated (TPD) 0.0
Waste received at scientific landfill (TPD) 0.0
Door to door colln.(no. of households andestablishments)
3,720.0
Waste segregation at source (Y/N) N
Annual revenue receipts from SW (`) 0.0
Annual revenue expenditure on SW (`) 5,285,000.0
Annual capital expenditure on SW (`) 1,150,000.0
171

Nandura Municipal Council
Service Level Benchmark Indicators
WATER SUPPLY
WASTE WATER
SOLID WASTE MANAGEMENT STORM WATER
Blank values represent 'zero', 'not applicable' or 'no data' in the charts above.
172

Narkhed Municipal Council Background
GENERAL INFORMATIONClass Class C No. of slum settlements 2
District Nagpur Slum population 2,556
Area (sq. km.) 4 Slum households 511
Total city population 25,000 Total annual city capital receipts (`) 19,243,000
Total households 5,000 Total annual city capital expenditure (`) 39,234,000
Density (persons per sq. km.) 6,250 Total annual city revenue receipts (`) 65,318,916
Total municipal staff 52 Total annual city revenue expenditure (`) 83,424,730
WATER SUPPLYTotal water produced (MLD) 1.9
Ground water (MLD) 0.4
Surface water (MLD) 1.5
Average daily volume treated (MLD) 1.9
Installed storage capacity (MLD) 1.9
Total water connections (nos.) 2,910.0
Water connections in slums (nos.) 296.0
Area covered by network (sq. km.) 2.4
No. of days of supply in a month 30.0
Annual revenue receipts from water (`) 2,141,656.0
Annual revenue expenditure on water (`) 1,286,985.0
Annual capital expenditure on water (`) 0.0
WASTE WATERArea covered by waste water network (sq. km.) 2.4
Underground sewerage network (sq. km) 0.0
Closed drains (sq. km) 0.0
Open drains (sq. km) 2.4
Total sewerage connections (nos.) 0.0
Sewerage coverage: slums (%) 0.0
Installed STP treatment capacity (MLD) 0.0
Annual revenue receipts from WW (`) 0.0
Annual revenue expenditure on WW (`) 4,750,505.0
Annual capital expenditure on WW (`) 0.0
SOLID WASTE MANAGEMENTWaste generated (TPD) 7.1
Waste collected (TPD) 7.1
Quantity of waste treated (TPD) 0.0
Waste received at scientific landfill (TPD) 0.0
Door to door colln.(no. of households andestablishments)
4,870.0
Waste segregation at source (Y/N) N
Annual revenue receipts from SW (`) 0.0
Annual revenue expenditure on SW (`) 274,965.0
Annual capital expenditure on SW (`) 0.0
173

Narkhed Municipal Council
Service Level Benchmark Indicators
WATER SUPPLY
WASTE WATER
SOLID WASTE MANAGEMENT STORM WATER
Blank values represent 'zero', 'not applicable' or 'no data' in the charts above.
174

Nawapur Municipal Council Background
GENERAL INFORMATIONClass Class C No. of slum settlements 6
District Nandurbar Slum population 4,028
Area (sq. km.) 14 Slum households 773
Total city population 35,000 Total annual city capital receipts (`) 10,258,000
Total households 5,845 Total annual city capital expenditure (`) 10,042,000
Density (persons per sq. km.) 2,414 Total annual city revenue receipts (`) 26,249,000
Total municipal staff 124 Total annual city revenue expenditure (`) 15,684,000
WATER SUPPLYTotal water produced (MLD) 2.5
Ground water (MLD) 2.5
Surface water (MLD) 0.0
Average daily volume treated (MLD) 0.0
Installed storage capacity (MLD) 1.1
Total water connections (nos.) 3,199.0
Water connections in slums (nos.) 40.0
Area covered by network (sq. km.) 13.0
No. of days of supply in a month 30.0
Annual revenue receipts from water (`) 2,609,972.0
Annual revenue expenditure on water (`) 4,282,000.0
Annual capital expenditure on water (`) 0.0
WASTE WATERArea covered by waste water network (sq. km.) 14.5
Underground sewerage network (sq. km) 0.0
Closed drains (sq. km) 11.5
Open drains (sq. km) 3.0
Total sewerage connections (nos.) 0.0
Sewerage coverage: slums (%) 0.0
Installed STP treatment capacity (MLD) 0.0
Annual revenue receipts from WW (`) 0.0
Annual revenue expenditure on WW (`) 0.0
Annual capital expenditure on WW (`) 826,000.0
SOLID WASTE MANAGEMENTWaste generated (TPD) 6.0
Waste collected (TPD) 6.0
Quantity of waste treated (TPD) 6.0
Waste received at scientific landfill (TPD) 0.0
Door to door colln.(no. of households andestablishments)
5,950.0
Waste segregation at source (Y/N) N
Annual revenue receipts from SW (`) 0.0
Annual revenue expenditure on SW (`) 0.0
Annual capital expenditure on SW (`) 1,219,000.0
175

Nawapur Municipal Council
Service Level Benchmark Indicators
WATER SUPPLY
WASTE WATER
SOLID WASTE MANAGEMENT STORM WATER
Blank values represent 'zero', 'not applicable' or 'no data' in the charts above.
176

Nilanga Municipal Council Background
GENERAL INFORMATIONClass Class C No. of slum settlements 0
District Latur Slum population 0
Area (sq. km.) 17 Slum households 0
Total city population 41,000 Total annual city capital receipts (`) 56,289,508
Total households 5,625 Total annual city capital expenditure (`) 52,625,995
Density (persons per sq. km.) 2,426 Total annual city revenue receipts (`) 56,289,508
Total municipal staff 69 Total annual city revenue expenditure (`) 52,625,995
WATER SUPPLYTotal water produced (MLD) 1.8
Ground water (MLD) 0.2
Surface water (MLD) 1.6
Average daily volume treated (MLD) 1.6
Installed storage capacity (MLD) 1.5
Total water connections (nos.) 2,124.0
Water connections in slums (nos.) 0.0
Area covered by network (sq. km.) 4.0
No. of days of supply in a month 30.0
Annual revenue receipts from water (`) 1,995,864.0
Annual revenue expenditure on water (`) 52,625,995.0
Annual capital expenditure on water (`) 5,628,458.0
WASTE WATERArea covered by waste water network (sq. km.) 0.0
Underground sewerage network (sq. km) 0.0
Closed drains (sq. km) 0.0
Open drains (sq. km) 0.0
Total sewerage connections (nos.) 0.0
Sewerage coverage: slums (%) 0.0
Installed STP treatment capacity (MLD) 0.0
Annual revenue receipts from WW (`) 0.0
Annual revenue expenditure on WW (`) 0.0
Annual capital expenditure on WW (`) 0.0
SOLID WASTE MANAGEMENTWaste generated (TPD) 0.0
Waste collected (TPD) 0.0
Quantity of waste treated (TPD) 0.0
Waste received at scientific landfill (TPD) 0.0
Door to door colln.(no. of households andestablishments)
0.0
Waste segregation at source (Y/N) ND
Annual revenue receipts from SW (`) 0.0
Annual revenue expenditure on SW (`) 0.0
Annual capital expenditure on SW (`) 2,296,500.0
177

Nilanga Municipal Council
Service Level Benchmark Indicators
WATER SUPPLY
WASTE WATER
SOLID WASTE MANAGEMENT STORM WATER
Blank values represent 'zero', 'not applicable' or 'no data' in the charts above.
178

Paithan Municipal Council Background
GENERAL INFORMATIONClass Class C No. of slum settlements 0
District Aurangabad Slum population 0
Area (sq. km.) 5 Slum households 0
Total city population 41,518 Total annual city capital receipts (`) 12,421,111
Total households 0 Total annual city capital expenditure (`) 17,563,718
Density (persons per sq. km.) 8,141 Total annual city revenue receipts (`) 74,833,187
Total municipal staff 162 Total annual city revenue expenditure (`) 19,185,000
WATER SUPPLYTotal water produced (MLD) 6.0
Ground water (MLD) 0.0
Surface water (MLD) 6.0
Average daily volume treated (MLD) 6.0
Installed storage capacity (MLD) 2.2
Total water connections (nos.) 4,299.0
Water connections in slums (nos.) 0.0
Area covered by network (sq. km.) 5.1
No. of days of supply in a month 30.0
Annual revenue receipts from water (`) 0.0
Annual revenue expenditure on water (`) 0.0
Annual capital expenditure on water (`) 0.0
WASTE WATERArea covered by waste water network (sq. km.) 5.1
Underground sewerage network (sq. km) 0.0
Closed drains (sq. km) 0.7
Open drains (sq. km) 4.4
Total sewerage connections (nos.) 0.0
Sewerage coverage: slums (%) 0.0
Installed STP treatment capacity (MLD) 0.0
Annual revenue receipts from WW (`) 0.0
Annual revenue expenditure on WW (`) 0.0
Annual capital expenditure on WW (`) 525,454.0
SOLID WASTE MANAGEMENTWaste generated (TPD) 3.0
Waste collected (TPD) 3.0
Quantity of waste treated (TPD) 0.0
Waste received at scientific landfill (TPD) 0.0
Door to door colln.(no. of households andestablishments)
4,800.0
Waste segregation at source (Y/N) N
Annual revenue receipts from SW (`) 0.0
Annual revenue expenditure on SW (`) 0.0
Annual capital expenditure on SW (`) 944,482.0
179

Paithan Municipal Council
Service Level Benchmark Indicators
WATER SUPPLY
WASTE WATER
SOLID WASTE MANAGEMENT STORM WATER
Blank values represent 'zero', 'not applicable' or 'no data' in the charts above.
180

Panchgani Municipal Council Background
GENERAL INFORMATIONClass Class C No. of slum settlements 3
District Satara Slum population 930
Area (sq. km.) 7 Slum households 186
Total city population 15,670 Total annual city capital receipts (`) 30,074,324
Total households 3,134 Total annual city capital expenditure (`) 0
Density (persons per sq. km.) 2,304 Total annual city revenue receipts (`) 90,922,262
Total municipal staff 63 Total annual city revenue expenditure (`) 104,321,253
WATER SUPPLYTotal water produced (MLD) 1.6
Ground water (MLD) 0.0
Surface water (MLD) 1.6
Average daily volume treated (MLD) 1.6
Installed storage capacity (MLD) 1.5
Total water connections (nos.) 1,457.0
Water connections in slums (nos.) 0.0
Area covered by network (sq. km.) 0.0
No. of days of supply in a month 26.0
Annual revenue receipts from water (`) 0.0
Annual revenue expenditure on water (`) 348,576.0
Annual capital expenditure on water (`) 0.0
WASTE WATERArea covered by waste water network (sq. km.) 6.9
Underground sewerage network (sq. km) 1.5
Closed drains (sq. km) 0.0
Open drains (sq. km) 5.4
Total sewerage connections (nos.) 610.0
Sewerage coverage: slums (%) 3.0
Installed STP treatment capacity (MLD) 0.7
Annual revenue receipts from WW (`) 0.0
Annual revenue expenditure on WW (`) 0.0
Annual capital expenditure on WW (`) 0.0
SOLID WASTE MANAGEMENTWaste generated (TPD) 3.9
Waste collected (TPD) 3.9
Quantity of waste treated (TPD) 2.2
Waste received at scientific landfill (TPD) 0.0
Door to door colln.(no. of households andestablishments)
2,639.0
Waste segregation at source (Y/N) N
Annual revenue receipts from SW (`) 0.0
Annual revenue expenditure on SW (`) 0.0
Annual capital expenditure on SW (`) 0.0
181

Panchgani Municipal Council
Service Level Benchmark Indicators
WATER SUPPLY
WASTE WATER
SOLID WASTE MANAGEMENT STORM WATER
Blank values represent 'zero', 'not applicable' or 'no data' in the charts above.
182

Pandharkaoda Municipal Council Background
GENERAL INFORMATIONClass Class C No. of slum settlements 6
District Yavatmal Slum population 3,185
Area (sq. km.) 4 Slum households 637
Total city population 35,872 Total annual city capital receipts (`) 10,800,000
Total households 6,023 Total annual city capital expenditure (`) 13,000,000
Density (persons per sq. km.) 8,968 Total annual city revenue receipts (`) 65,690,000
Total municipal staff 103 Total annual city revenue expenditure (`) 67,915,000
WATER SUPPLYTotal water produced (MLD) 7.0
Ground water (MLD) 0.0
Surface water (MLD) 7.0
Average daily volume treated (MLD) 3.2
Installed storage capacity (MLD) 1.6
Total water connections (nos.) 3,657.0
Water connections in slums (nos.) 0.0
Area covered by network (sq. km.) 4.0
No. of days of supply in a month 30.0
Annual revenue receipts from water (`) 5,140,000.0
Annual revenue expenditure on water (`) 6,127,000.0
Annual capital expenditure on water (`) 10.3
WASTE WATERArea covered by waste water network (sq. km.) 2,400.0
Underground sewerage network (sq. km) 2,400.0
Closed drains (sq. km) 0.0
Open drains (sq. km) 0.0
Total sewerage connections (nos.) 0.0
Sewerage coverage: slums (%) 0.0
Installed STP treatment capacity (MLD) 0.0
Annual revenue receipts from WW (`) 0.0
Annual revenue expenditure on WW (`) 3,625,000.0
Annual capital expenditure on WW (`) 0.0
SOLID WASTE MANAGEMENTWaste generated (TPD) 5.0
Waste collected (TPD) 5.0
Quantity of waste treated (TPD) 0.0
Waste received at scientific landfill (TPD) 5.0
Door to door colln.(no. of households andestablishments)
5,038.0
Waste segregation at source (Y/N) N
Annual revenue receipts from SW (`) 0.0
Annual revenue expenditure on SW (`) 0.0
Annual capital expenditure on SW (`) 5.0
183

Pandharkaoda Municipal Council
Service Level Benchmark Indicators
WATER SUPPLY
WASTE WATER
SOLID WASTE MANAGEMENT STORM WATER
Blank values represent 'zero', 'not applicable' or 'no data' in the charts above.
184

Panhala Municipal Council Background
GENERAL INFORMATIONClass Class C No. of slum settlements 0
District Kolhapur Slum population 0
Area (sq. km.) 2 Slum households 0
Total city population 3,952 Total annual city capital receipts (`) 19,960,000
Total households 700 Total annual city capital expenditure (`) 16,412,000
Density (persons per sq. km.) 2,470 Total annual city revenue receipts (`) 18,202,000
Total municipal staff 24 Total annual city revenue expenditure (`) 5,417,000
WATER SUPPLYTotal water produced (MLD) 0.2
Ground water (MLD) 0.0
Surface water (MLD) 0.2
Average daily volume treated (MLD) 0.2
Installed storage capacity (MLD) 0.3
Total water connections (nos.) 618.0
Water connections in slums (nos.) 0.0
Area covered by network (sq. km.) 1.6
No. of days of supply in a month 0.0
Annual revenue receipts from water (`) 0.0
Annual revenue expenditure on water (`) 0.0
Annual capital expenditure on water (`) 265,000.0
WASTE WATERArea covered by waste water network (sq. km.) 1.3
Underground sewerage network (sq. km) 0.0
Closed drains (sq. km) 0.1
Open drains (sq. km) 1.2
Total sewerage connections (nos.) 0.0
Sewerage coverage: slums (%) 0.0
Installed STP treatment capacity (MLD) 0.0
Annual revenue receipts from WW (`) 0.0
Annual revenue expenditure on WW (`) 82,000.0
Annual capital expenditure on WW (`) 757,000.0
SOLID WASTE MANAGEMENTWaste generated (TPD) 1.0
Waste collected (TPD) 0.8
Quantity of waste treated (TPD) 0.5
Waste received at scientific landfill (TPD) 0.0
Door to door colln.(no. of households andestablishments)
731.0
Waste segregation at source (Y/N) N
Annual revenue receipts from SW (`) 0.0
Annual revenue expenditure on SW (`) 606,000.0
Annual capital expenditure on SW (`) 1,451,000.0
185

Panhala Municipal Council
Service Level Benchmark Indicators
WATER SUPPLY
WASTE WATER
SOLID WASTE MANAGEMENT STORM WATER
Blank values represent 'zero', 'not applicable' or 'no data' in the charts above.
186

Paranda Municipal Council Background
GENERAL INFORMATIONClass Class C No. of slum settlements 2
District Osmanabad Slum population 950
Area (sq. km.) 4 Slum households 225
Total city population 20,000 Total annual city capital receipts (`) 27,638,000
Total households 3,863 Total annual city capital expenditure (`) 21,000,000
Density (persons per sq. km.) 4,444 Total annual city revenue receipts (`) 27,638,000
Total municipal staff 49 Total annual city revenue expenditure (`) 26,464,000
WATER SUPPLYTotal water produced (MLD) 1.2
Ground water (MLD) 0.2
Surface water (MLD) 1.0
Average daily volume treated (MLD) 1.0
Installed storage capacity (MLD) 6.7
Total water connections (nos.) 2,017.0
Water connections in slums (nos.) 100.0
Area covered by network (sq. km.) 4.5
No. of days of supply in a month 15.0
Annual revenue receipts from water (`) 23,869,000.0
Annual revenue expenditure on water (`) 2,911,000.0
Annual capital expenditure on water (`) 2,569,000.0
WASTE WATERArea covered by waste water network (sq. km.) 2.6
Underground sewerage network (sq. km) 0.0
Closed drains (sq. km) 0.3
Open drains (sq. km) 2.3
Total sewerage connections (nos.) 0.0
Sewerage coverage: slums (%) 0.0
Installed STP treatment capacity (MLD) 0.0
Annual revenue receipts from WW (`) 0.0
Annual revenue expenditure on WW (`) 0.0
Annual capital expenditure on WW (`) 0.0
SOLID WASTE MANAGEMENTWaste generated (TPD) 3.0
Waste collected (TPD) 3.0
Quantity of waste treated (TPD) 0.0
Waste received at scientific landfill (TPD) 0.0
Door to door colln.(no. of households andestablishments)
0.0
Waste segregation at source (Y/N) N
Annual revenue receipts from SW (`) 0.0
Annual revenue expenditure on SW (`) 3,209,000.0
Annual capital expenditure on SW (`) 916,000.0
187

Paranda Municipal Council
Service Level Benchmark Indicators
WATER SUPPLY
WASTE WATER
SOLID WASTE MANAGEMENT STORM WATER
Blank values represent 'zero', 'not applicable' or 'no data' in the charts above.
188

Parola Municipal Council Background
GENERAL INFORMATIONClass Class C No. of slum settlements 6
District Jalgaon Slum population 7,500
Area (sq. km.) 4 Slum households 1,500
Total city population 39,285 Total annual city capital receipts (`) 37,599,000
Total households 7,857 Total annual city capital expenditure (`) 19,808,000
Density (persons per sq. km.) 9,354 Total annual city revenue receipts (`) 32,988,000
Total municipal staff 119 Total annual city revenue expenditure (`) 19,644,000
WATER SUPPLYTotal water produced (MLD) 3.0
Ground water (MLD) 0.0
Surface water (MLD) 3.0
Average daily volume treated (MLD) 3.0
Installed storage capacity (MLD) 22.8
Total water connections (nos.) 3,889.0
Water connections in slums (nos.) 125.0
Area covered by network (sq. km.) 38.0
No. of days of supply in a month 8.0
Annual revenue receipts from water (`) 4,531,000.0
Annual revenue expenditure on water (`) 22,645,000.0
Annual capital expenditure on water (`) 6,364,000.0
WASTE WATERArea covered by waste water network (sq. km.) 4.0
Underground sewerage network (sq. km) 0.0
Closed drains (sq. km) 0.0
Open drains (sq. km) 4.0
Total sewerage connections (nos.) 0.0
Sewerage coverage: slums (%) 0.0
Installed STP treatment capacity (MLD) 0.0
Annual revenue receipts from WW (`) 286,000.0
Annual revenue expenditure on WW (`) 660,000.0
Annual capital expenditure on WW (`) 66,000.0
SOLID WASTE MANAGEMENTWaste generated (TPD) 8.0
Waste collected (TPD) 8.0
Quantity of waste treated (TPD) 0.0
Waste received at scientific landfill (TPD) 0.0
Door to door colln.(no. of households andestablishments)
6,356.0
Waste segregation at source (Y/N) N
Annual revenue receipts from SW (`) 1,122,000.0
Annual revenue expenditure on SW (`) 8,558,000.0
Annual capital expenditure on SW (`) 955,000.0
189

Parola Municipal Council
Service Level Benchmark Indicators
WATER SUPPLY
WASTE WATER
SOLID WASTE MANAGEMENT STORM WATER
Blank values represent 'zero', 'not applicable' or 'no data' in the charts above.
190
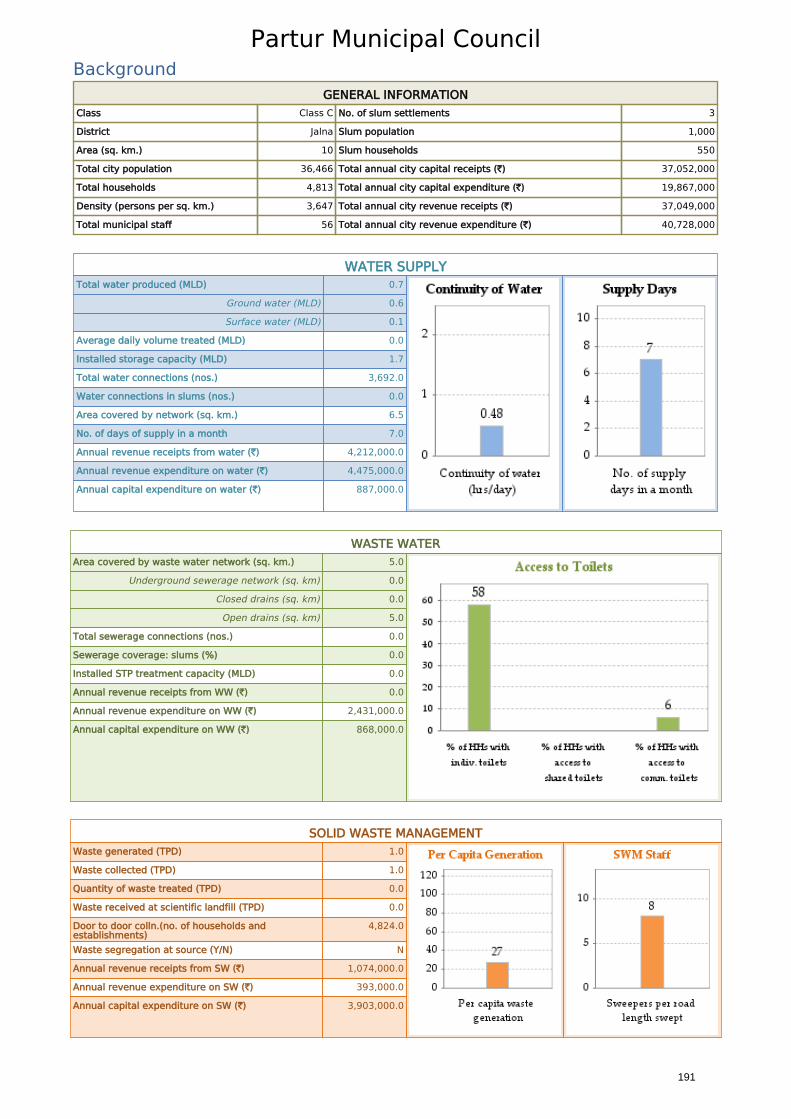
Partur Municipal Council Background
GENERAL INFORMATIONClass Class C No. of slum settlements 3
District Jalna Slum population 1,000
Area (sq. km.) 10 Slum households 550
Total city population 36,466 Total annual city capital receipts (`) 37,052,000
Total households 4,813 Total annual city capital expenditure (`) 19,867,000
Density (persons per sq. km.) 3,647 Total annual city revenue receipts (`) 37,049,000
Total municipal staff 56 Total annual city revenue expenditure (`) 40,728,000
WATER SUPPLYTotal water produced (MLD) 0.7
Ground water (MLD) 0.6
Surface water (MLD) 0.1
Average daily volume treated (MLD) 0.0
Installed storage capacity (MLD) 1.7
Total water connections (nos.) 3,692.0
Water connections in slums (nos.) 0.0
Area covered by network (sq. km.) 6.5
No. of days of supply in a month 7.0
Annual revenue receipts from water (`) 4,212,000.0
Annual revenue expenditure on water (`) 4,475,000.0
Annual capital expenditure on water (`) 887,000.0
WASTE WATERArea covered by waste water network (sq. km.) 5.0
Underground sewerage network (sq. km) 0.0
Closed drains (sq. km) 0.0
Open drains (sq. km) 5.0
Total sewerage connections (nos.) 0.0
Sewerage coverage: slums (%) 0.0
Installed STP treatment capacity (MLD) 0.0
Annual revenue receipts from WW (`) 0.0
Annual revenue expenditure on WW (`) 2,431,000.0
Annual capital expenditure on WW (`) 868,000.0
SOLID WASTE MANAGEMENTWaste generated (TPD) 1.0
Waste collected (TPD) 1.0
Quantity of waste treated (TPD) 0.0
Waste received at scientific landfill (TPD) 0.0
Door to door colln.(no. of households andestablishments)
4,824.0
Waste segregation at source (Y/N) N
Annual revenue receipts from SW (`) 1,074,000.0
Annual revenue expenditure on SW (`) 393,000.0
Annual capital expenditure on SW (`) 3,903,000.0
191

Partur Municipal Council
Service Level Benchmark Indicators
WATER SUPPLY
WASTE WATER
SOLID WASTE MANAGEMENT STORM WATER
Blank values represent 'zero', 'not applicable' or 'no data' in the charts above.
192

Pathardi Municipal Council Background
GENERAL INFORMATIONClass Class C No. of slum settlements 1
District Ahmednagar Slum population 2,107
Area (sq. km.) 28 Slum households 528
Total city population 27,200 Total annual city capital receipts (`) 6,756,000
Total households 5,250 Total annual city capital expenditure (`) 5,391,000
Density (persons per sq. km.) 971 Total annual city revenue receipts (`) 28,290,000
Total municipal staff 126 Total annual city revenue expenditure (`) 151,173
WATER SUPPLYTotal water produced (MLD) 2.3
Ground water (MLD) 0.0
Surface water (MLD) 2.3
Average daily volume treated (MLD) 0.0
Installed storage capacity (MLD) 2.1
Total water connections (nos.) 3,625.0
Water connections in slums (nos.) 145.0
Area covered by network (sq. km.) 28.0
No. of days of supply in a month 30.0
Annual revenue receipts from water (`) 2,746,000.0
Annual revenue expenditure on water (`) 2,563,291.0
Annual capital expenditure on water (`) 0.0
WASTE WATERArea covered by waste water network (sq. km.) 15.0
Underground sewerage network (sq. km) 0.0
Closed drains (sq. km) 0.0
Open drains (sq. km) 15.0
Total sewerage connections (nos.) 0.0
Sewerage coverage: slums (%) 0.0
Installed STP treatment capacity (MLD) 0.0
Annual revenue receipts from WW (`) 0.0
Annual revenue expenditure on WW (`) 0.0
Annual capital expenditure on WW (`) 0.0
SOLID WASTE MANAGEMENTWaste generated (TPD) 12.0
Waste collected (TPD) 12.0
Quantity of waste treated (TPD) 0.0
Waste received at scientific landfill (TPD) 0.0
Door to door colln.(no. of households andestablishments)
5,400.0
Waste segregation at source (Y/N) N
Annual revenue receipts from SW (`) 0.0
Annual revenue expenditure on SW (`) 0.0
Annual capital expenditure on SW (`) 473,000.0
193

Pathardi Municipal Council
Service Level Benchmark Indicators
WATER SUPPLY
WASTE WATER
SOLID WASTE MANAGEMENT STORM WATER
Blank values represent 'zero', 'not applicable' or 'no data' in the charts above.
194

Pathri Municipal Council Background
GENERAL INFORMATIONClass Class C No. of slum settlements 12
District Parbhani Slum population 6,749
Area (sq. km.) 18 Slum households 1,208
Total city population 40,160 Total annual city capital receipts (`) 26,408,840
Total households 6,150 Total annual city capital expenditure (`) 26,045,000
Density (persons per sq. km.) 2,256 Total annual city revenue receipts (`) 41,604,000
Total municipal staff 131 Total annual city revenue expenditure (`) 40,496,000
WATER SUPPLYTotal water produced (MLD) 2.0
Ground water (MLD) 2.0
Surface water (MLD) 0.0
Average daily volume treated (MLD) 0.0
Installed storage capacity (MLD) 0.9
Total water connections (nos.) 2,091.0
Water connections in slums (nos.) 575.0
Area covered by network (sq. km.) 3.8
No. of days of supply in a month 10.0
Annual revenue receipts from water (`) 1,386,000.0
Annual revenue expenditure on water (`) 2,890,000.0
Annual capital expenditure on water (`) 0.0
WASTE WATERArea covered by waste water network (sq. km.) 8.0
Underground sewerage network (sq. km) 0.0
Closed drains (sq. km) 0.0
Open drains (sq. km) 8.0
Total sewerage connections (nos.) 0.0
Sewerage coverage: slums (%) 0.0
Installed STP treatment capacity (MLD) 0.0
Annual revenue receipts from WW (`) 0.0
Annual revenue expenditure on WW (`) 0.0
Annual capital expenditure on WW (`) 0.0
SOLID WASTE MANAGEMENTWaste generated (TPD) 11.0
Waste collected (TPD) 7.0
Quantity of waste treated (TPD) 0.0
Waste received at scientific landfill (TPD) 0.0
Door to door colln.(no. of households andestablishments)
6,205.0
Waste segregation at source (Y/N) N
Annual revenue receipts from SW (`) 175,000.0
Annual revenue expenditure on SW (`) 6,020,000.0
Annual capital expenditure on SW (`) 0.0
195

Pathri Municipal Council
Service Level Benchmark Indicators
WATER SUPPLY
WASTE WATER
SOLID WASTE MANAGEMENT STORM WATER
Blank values represent 'zero', 'not applicable' or 'no data' in the charts above.
196

Patur Municipal Council Background
GENERAL INFORMATIONClass Class C No. of slum settlements 0
District Akola Slum population 0
Area (sq. km.) 0 Slum households 0
Total city population 23,359 Total annual city capital receipts (`) 0
Total households 5,584 Total annual city capital expenditure (`) 0
Density (persons per sq. km.) 0 Total annual city revenue receipts (`) 0
Total municipal staff 50 Total annual city revenue expenditure (`) 0
WATER SUPPLYTotal water produced (MLD) 1.5
Ground water (MLD) 0.0
Surface water (MLD) 1.5
Average daily volume treated (MLD) 0.0
Installed storage capacity (MLD) 3.0
Total water connections (nos.) 0.0
Water connections in slums (nos.) 0.0
Area covered by network (sq. km.) 5.2
No. of days of supply in a month 0.0
Annual revenue receipts from water (`) 0.0
Annual revenue expenditure on water (`) 0.0
Annual capital expenditure on water (`) 0.0
WASTE WATERArea covered by waste water network (sq. km.) 3.0
Underground sewerage network (sq. km) 0.0
Closed drains (sq. km) 0.0
Open drains (sq. km) 3.0
Total sewerage connections (nos.) 0.0
Sewerage coverage: slums (%) 0.0
Installed STP treatment capacity (MLD) 0.0
Annual revenue receipts from WW (`) 0.0
Annual revenue expenditure on WW (`) 0.0
Annual capital expenditure on WW (`) 0.0
SOLID WASTE MANAGEMENTWaste generated (TPD) 4.1
Waste collected (TPD) 1.0
Quantity of waste treated (TPD) 0.0
Waste received at scientific landfill (TPD) 0.0
Door to door colln.(no. of households andestablishments)
4,108.0
Waste segregation at source (Y/N) N
Annual revenue receipts from SW (`) 0.0
Annual revenue expenditure on SW (`) 0.0
Annual capital expenditure on SW (`) 0.0
197

Patur Municipal Council
Service Level Benchmark Indicators
WATER SUPPLY
WASTE WATER
SOLID WASTE MANAGEMENT STORM WATER
Blank values represent 'zero', 'not applicable' or 'no data' in the charts above.
198

Pauni Municipal Council Background
GENERAL INFORMATIONClass Class C No. of slum settlements 15
District Bhandara Slum population 10,800
Area (sq. km.) 3 Slum households 1,896
Total city population 23,807 Total annual city capital receipts (`) 525,000
Total households 4,761 Total annual city capital expenditure (`) 364,000
Density (persons per sq. km.) 8,209 Total annual city revenue receipts (`) 52,500,000
Total municipal staff 72 Total annual city revenue expenditure (`) 33,300,000
WATER SUPPLYTotal water produced (MLD) 2.6
Ground water (MLD) 0.1
Surface water (MLD) 2.5
Average daily volume treated (MLD) 2.5
Installed storage capacity (MLD) 965,000.0
Total water connections (nos.) 2,574.0
Water connections in slums (nos.) 130.0
Area covered by network (sq. km.) 2.9
No. of days of supply in a month 30.0
Annual revenue receipts from water (`) 100,000.0
Annual revenue expenditure on water (`) 2,300,000.0
Annual capital expenditure on water (`) 45,000.0
WASTE WATERArea covered by waste water network (sq. km.) 2.9
Underground sewerage network (sq. km) 0.0
Closed drains (sq. km) 0.5
Open drains (sq. km) 2.4
Total sewerage connections (nos.) 0.0
Sewerage coverage: slums (%) 0.0
Installed STP treatment capacity (MLD) 0.0
Annual revenue receipts from WW (`) 0.0
Annual revenue expenditure on WW (`) 0.0
Annual capital expenditure on WW (`) 0.0
SOLID WASTE MANAGEMENTWaste generated (TPD) 5.0
Waste collected (TPD) 4.5
Quantity of waste treated (TPD) 0.0
Waste received at scientific landfill (TPD) 0.0
Door to door colln.(no. of households andestablishments)
4,806.0
Waste segregation at source (Y/N) N
Annual revenue receipts from SW (`) 2,000,000.0
Annual revenue expenditure on SW (`) 1,100,000.0
Annual capital expenditure on SW (`) 3,000.0
199

Pauni Municipal Council
Service Level Benchmark Indicators
WATER SUPPLY
WASTE WATER
SOLID WASTE MANAGEMENT STORM WATER
Blank values represent 'zero', 'not applicable' or 'no data' in the charts above.
200

Pen Municipal Council Background
GENERAL INFORMATIONClass Class C No. of slum settlements 0
District Raigad Slum population 0
Area (sq. km.) 10 Slum households 0
Total city population 45,000 Total annual city capital receipts (`) 43,698,140
Total households 9,000 Total annual city capital expenditure (`) 78,419,843
Density (persons per sq. km.) 4,592 Total annual city revenue receipts (`) 80,152,672
Total municipal staff 229 Total annual city revenue expenditure (`) 78,419,843
WATER SUPPLYTotal water produced (MLD) 6.0
Ground water (MLD) 0.0
Surface water (MLD) 6.0
Average daily volume treated (MLD) 6.0
Installed storage capacity (MLD) 3.1
Total water connections (nos.) 5,654.0
Water connections in slums (nos.) 0.0
Area covered by network (sq. km.) 7.4
No. of days of supply in a month 30.0
Annual revenue receipts from water (`) 6,993,103.0
Annual revenue expenditure on water (`) 10,625,468.0
Annual capital expenditure on water (`) 3,088,215.0
WASTE WATERArea covered by waste water network (sq. km.) 7.4
Underground sewerage network (sq. km) 0.0
Closed drains (sq. km) 0.0
Open drains (sq. km) 7.4
Total sewerage connections (nos.) 0.0
Sewerage coverage: slums (%) 0.0
Installed STP treatment capacity (MLD) 0.0
Annual revenue receipts from WW (`) 0.0
Annual revenue expenditure on WW (`) 3,853,463.0
Annual capital expenditure on WW (`) 3,853,463.0
SOLID WASTE MANAGEMENTWaste generated (TPD) 12.0
Waste collected (TPD) 12.0
Quantity of waste treated (TPD) 2.0
Waste received at scientific landfill (TPD) 0.0
Door to door colln.(no. of households andestablishments)
9,862.0
Waste segregation at source (Y/N) N
Annual revenue receipts from SW (`) 0.0
Annual revenue expenditure on SW (`) 18,660,970.0
Annual capital expenditure on SW (`) 4,338,169.0
201

Pen Municipal Council
Service Level Benchmark Indicators
WATER SUPPLY
WASTE WATER
SOLID WASTE MANAGEMENT STORM WATER
Blank values represent 'zero', 'not applicable' or 'no data' in the charts above.
202

Pulgaon Municipal Council Background
GENERAL INFORMATIONClass Class C No. of slum settlements 5
District Wardha Slum population 3,284
Area (sq. km.) 3 Slum households 579
Total city population 41,340 Total annual city capital receipts (`) 22,117,000
Total households 8,568 Total annual city capital expenditure (`) 1,616,000
Density (persons per sq. km.) 15,311 Total annual city revenue receipts (`) 61,346,000
Total municipal staff 138 Total annual city revenue expenditure (`) 55,170,000
WATER SUPPLYTotal water produced (MLD) 2.8
Ground water (MLD) 0.0
Surface water (MLD) 2.8
Average daily volume treated (MLD) 2.8
Installed storage capacity (MLD) 2.1
Total water connections (nos.) 3,402.0
Water connections in slums (nos.) 410.0
Area covered by network (sq. km.) 2.7
No. of days of supply in a month 15.0
Annual revenue receipts from water (`) 2,555,000.0
Annual revenue expenditure on water (`) 5,452,000.0
Annual capital expenditure on water (`) 600,000.0
WASTE WATERArea covered by waste water network (sq. km.) 2.7
Underground sewerage network (sq. km) 0.0
Closed drains (sq. km) 0.0
Open drains (sq. km) 2.7
Total sewerage connections (nos.) 0.0
Sewerage coverage: slums (%) 0.0
Installed STP treatment capacity (MLD) 0.0
Annual revenue receipts from WW (`) 0.0
Annual revenue expenditure on WW (`) 0.0
Annual capital expenditure on WW (`) 0.0
SOLID WASTE MANAGEMENTWaste generated (TPD) 3.0
Waste collected (TPD) 3.0
Quantity of waste treated (TPD) 0.0
Waste received at scientific landfill (TPD) 0.0
Door to door colln.(no. of households andestablishments)
3,761.0
Waste segregation at source (Y/N) N
Annual revenue receipts from SW (`) 0.0
Annual revenue expenditure on SW (`) 0.0
Annual capital expenditure on SW (`) 0.0
203

Pulgaon Municipal Council
Service Level Benchmark Indicators
WATER SUPPLY
WASTE WATER
SOLID WASTE MANAGEMENT STORM WATER
Blank values represent 'zero', 'not applicable' or 'no data' in the charts above.
204

Purna Municipal Council Background
GENERAL INFORMATIONClass Class C No. of slum settlements 20
District Parbhani Slum population 14,310
Area (sq. km.) 18 Slum households 3,100
Total city population 38,300 Total annual city capital receipts (`) 48,059,390
Total households 5,850 Total annual city capital expenditure (`) 67,342,429
Density (persons per sq. km.) 2,128 Total annual city revenue receipts (`) 59,328,000
Total municipal staff 149 Total annual city revenue expenditure (`) 67,342,000
WATER SUPPLYTotal water produced (MLD) 2.0
Ground water (MLD) 0.0
Surface water (MLD) 2.0
Average daily volume treated (MLD) 2.0
Installed storage capacity (MLD) 2.3
Total water connections (nos.) 1,373.0
Water connections in slums (nos.) 410.0
Area covered by network (sq. km.) 9.0
No. of days of supply in a month 20.0
Annual revenue receipts from water (`) 1,226,000.0
Annual revenue expenditure on water (`) 4,229,000.0
Annual capital expenditure on water (`) 1,887,000.0
WASTE WATERArea covered by waste water network (sq. km.) 8.4
Underground sewerage network (sq. km) 0.0
Closed drains (sq. km) 0.0
Open drains (sq. km) 8.4
Total sewerage connections (nos.) 0.0
Sewerage coverage: slums (%) 0.0
Installed STP treatment capacity (MLD) 0.0
Annual revenue receipts from WW (`) 0.0
Annual revenue expenditure on WW (`) 0.0
Annual capital expenditure on WW (`) 0.0
SOLID WASTE MANAGEMENTWaste generated (TPD) 2.0
Waste collected (TPD) 2.0
Quantity of waste treated (TPD) 0.0
Waste received at scientific landfill (TPD) 0.0
Door to door colln.(no. of households andestablishments)
0.0
Waste segregation at source (Y/N) N
Annual revenue receipts from SW (`) 0.0
Annual revenue expenditure on SW (`) 0.0
Annual capital expenditure on SW (`) 0.0
205

Purna Municipal Council
Service Level Benchmark Indicators
WATER SUPPLY
WASTE WATER
SOLID WASTE MANAGEMENT STORM WATER
Blank values represent 'zero', 'not applicable' or 'no data' in the charts above.
206

Rahimatpur Municipal Council Background
GENERAL INFORMATIONClass Class C No. of slum settlements 0
District Satara Slum population 0
Area (sq. km.) 39 Slum households 0
Total city population 18,218 Total annual city capital receipts (`) 34,697,000
Total households 3,607 Total annual city capital expenditure (`) 10,631,000
Density (persons per sq. km.) 468 Total annual city revenue receipts (`) 34,697,000
Total municipal staff 30 Total annual city revenue expenditure (`) 24,074,000
WATER SUPPLYTotal water produced (MLD) 1.7
Ground water (MLD) 0.0
Surface water (MLD) 1.7
Average daily volume treated (MLD) 1.7
Installed storage capacity (MLD) 0.8
Total water connections (nos.) 1,649.0
Water connections in slums (nos.) 0.0
Area covered by network (sq. km.) 6.0
No. of days of supply in a month 30.0
Annual revenue receipts from water (`) 1,491,000.0
Annual revenue expenditure on water (`) 3,403,000.0
Annual capital expenditure on water (`) 3,403,000.0
WASTE WATERArea covered by waste water network (sq. km.) 18.0
Underground sewerage network (sq. km) 0.0
Closed drains (sq. km) 12.0
Open drains (sq. km) 6.0
Total sewerage connections (nos.) 0.0
Sewerage coverage: slums (%) 0.0
Installed STP treatment capacity (MLD) 0.0
Annual revenue receipts from WW (`) 0.0
Annual revenue expenditure on WW (`) 1,282,000.0
Annual capital expenditure on WW (`) 227,000.0
SOLID WASTE MANAGEMENTWaste generated (TPD) 0.2
Waste collected (TPD) 0.2
Quantity of waste treated (TPD) 0.0
Waste received at scientific landfill (TPD) 0.0
Door to door colln.(no. of households andestablishments)
3,245.0
Waste segregation at source (Y/N) N
Annual revenue receipts from SW (`) 0.0
Annual revenue expenditure on SW (`) 1,938,000.0
Annual capital expenditure on SW (`) 1,938,000.0
207

Rahimatpur Municipal Council
Service Level Benchmark Indicators
WATER SUPPLY
WASTE WATER
SOLID WASTE MANAGEMENT STORM WATER
Blank values represent 'zero', 'not applicable' or 'no data' in the charts above.
208

Rahta Pimplas Municipal Council Background
GENERAL INFORMATIONClass Class C No. of slum settlements 6
District Ahmednagar Slum population 3,360
Area (sq. km.) 22 Slum households 672
Total city population 22,208 Total annual city capital receipts (`) 31,115,000
Total households 4,073 Total annual city capital expenditure (`) 25,973,000
Density (persons per sq. km.) 1,010 Total annual city revenue receipts (`) 73,503,000
Total municipal staff 77 Total annual city revenue expenditure (`) 70,434,000
WATER SUPPLYTotal water produced (MLD) 2.0
Ground water (MLD) 2.0
Surface water (MLD) 0.0
Average daily volume treated (MLD) 0.0
Installed storage capacity (MLD) 0.7
Total water connections (nos.) 1,948.0
Water connections in slums (nos.) 0.0
Area covered by network (sq. km.) 18.0
No. of days of supply in a month 15.0
Annual revenue receipts from water (`) 2,650,000.0
Annual revenue expenditure on water (`) 3,898,000.0
Annual capital expenditure on water (`) 1,178,000.0
WASTE WATERArea covered by waste water network (sq. km.) 7.0
Underground sewerage network (sq. km) 2.5
Closed drains (sq. km) 2.5
Open drains (sq. km) 2.0
Total sewerage connections (nos.) 1,197.0
Sewerage coverage: slums (%) 0.0
Installed STP treatment capacity (MLD) 0.0
Annual revenue receipts from WW (`) 0.0
Annual revenue expenditure on WW (`) 73,000.0
Annual capital expenditure on WW (`) 73,000.0
SOLID WASTE MANAGEMENTWaste generated (TPD) 3.0
Waste collected (TPD) 0.0
Quantity of waste treated (TPD) 0.0
Waste received at scientific landfill (TPD) 0.0
Door to door colln.(no. of households andestablishments)
1,620.0
Waste segregation at source (Y/N) Y
Annual revenue receipts from SW (`) 0.0
Annual revenue expenditure on SW (`) 0.0
Annual capital expenditure on SW (`) 0.0
209

Rahta Pimplas Municipal Council
Service Level Benchmark Indicators
WATER SUPPLY
WASTE WATER
SOLID WASTE MANAGEMENT STORM WATER
Blank values represent 'zero', 'not applicable' or 'no data' in the charts above.
210

Rahuri Municipal Council Background
GENERAL INFORMATIONClass Class C No. of slum settlements 1
District Ahmednagar Slum population 241
Area (sq. km.) 42 Slum households 43
Total city population 39,330 Total annual city capital receipts (`) 27,970,429
Total households 7,297 Total annual city capital expenditure (`) 35,770,202
Density (persons per sq. km.) 928 Total annual city revenue receipts (`) 89,603,799
Total municipal staff 177 Total annual city revenue expenditure (`) 85,459,665
WATER SUPPLYTotal water produced (MLD) 3.6
Ground water (MLD) 0.0
Surface water (MLD) 3.6
Average daily volume treated (MLD) 3.5
Installed storage capacity (MLD) 2.4
Total water connections (nos.) 4,399.0
Water connections in slums (nos.) 1.0
Area covered by network (sq. km.) 24.8
No. of days of supply in a month 26.8
Annual revenue receipts from water (`) 4,043,114.0
Annual revenue expenditure on water (`) 5,140,155.0
Annual capital expenditure on water (`) 1,550,929.0
WASTE WATERArea covered by waste water network (sq. km.) 4.3
Underground sewerage network (sq. km) 0.0
Closed drains (sq. km) 0.3
Open drains (sq. km) 4.0
Total sewerage connections (nos.) 0.0
Sewerage coverage: slums (%) 0.0
Installed STP treatment capacity (MLD) 0.0
Annual revenue receipts from WW (`) 0.0
Annual revenue expenditure on WW (`) 0.0
Annual capital expenditure on WW (`) 358,814.0
SOLID WASTE MANAGEMENTWaste generated (TPD) 6.0
Waste collected (TPD) 6.0
Quantity of waste treated (TPD) 1.5
Waste received at scientific landfill (TPD) 0.0
Door to door colln.(no. of households andestablishments)
0.0
Waste segregation at source (Y/N) N
Annual revenue receipts from SW (`) 0.0
Annual revenue expenditure on SW (`) 8,149,798.0
Annual capital expenditure on SW (`) 1,691,926.0
211

Rahuri Municipal Council
Service Level Benchmark Indicators
WATER SUPPLY
WASTE WATER
SOLID WASTE MANAGEMENT STORM WATER
Blank values represent 'zero', 'not applicable' or 'no data' in the charts above.
212

Rajapur Municipal Council Background
GENERAL INFORMATIONClass Class C No. of slum settlements 0
District Ratnagiri Slum population 0
Area (sq. km.) 6 Slum households 0
Total city population 11,041 Total annual city capital receipts (`) 6,850,000
Total households 2,760 Total annual city capital expenditure (`) 16,813,000
Density (persons per sq. km.) 1,781 Total annual city revenue receipts (`) 17,481,000
Total municipal staff 67 Total annual city revenue expenditure (`) 15,575,000
WATER SUPPLYTotal water produced (MLD) 1.7
Ground water (MLD) 0.0
Surface water (MLD) 1.7
Average daily volume treated (MLD) 1.7
Installed storage capacity (MLD) 1.9
Total water connections (nos.) 1,845.0
Water connections in slums (nos.) 0.0
Area covered by network (sq. km.) 6.2
No. of days of supply in a month 30.0
Annual revenue receipts from water (`) 1,566,000.0
Annual revenue expenditure on water (`) 2,340,000.0
Annual capital expenditure on water (`) 64,000.0
WASTE WATERArea covered by waste water network (sq. km.) 22.5
Underground sewerage network (sq. km) 0.0
Closed drains (sq. km) 14.1
Open drains (sq. km) 8.4
Total sewerage connections (nos.) 0.0
Sewerage coverage: slums (%) 0.0
Installed STP treatment capacity (MLD) 0.0
Annual revenue receipts from WW (`) 13,000.0
Annual revenue expenditure on WW (`) 0.0
Annual capital expenditure on WW (`) 275,000.0
SOLID WASTE MANAGEMENTWaste generated (TPD) 1.0
Waste collected (TPD) 0.3
Quantity of waste treated (TPD) 0.3
Waste received at scientific landfill (TPD) 0.0
Door to door colln.(no. of households andestablishments)
1,120.0
Waste segregation at source (Y/N) N
Annual revenue receipts from SW (`) 0.0
Annual revenue expenditure on SW (`) 0.0
Annual capital expenditure on SW (`) 1,177,000.0
213

Rajapur Municipal Council
Service Level Benchmark Indicators
WATER SUPPLY
WASTE WATER
SOLID WASTE MANAGEMENT STORM WATER
Blank values represent 'zero', 'not applicable' or 'no data' in the charts above.
214

Rajura Municipal Council Background
GENERAL INFORMATIONClass Class C No. of slum settlements 3
District Chandrapur Slum population 4,971
Area (sq. km.) 3 Slum households 933
Total city population 33,335 Total annual city capital receipts (`) 99,381,000
Total households 6,553 Total annual city capital expenditure (`) 69,938,000
Density (persons per sq. km.) 11,495 Total annual city revenue receipts (`) 46,133,000
Total municipal staff 175 Total annual city revenue expenditure (`) 45,930,000
WATER SUPPLYTotal water produced (MLD) 3.0
Ground water (MLD) 0.0
Surface water (MLD) 3.0
Average daily volume treated (MLD) 3.0
Installed storage capacity (MLD) 1.8
Total water connections (nos.) 2,894.0
Water connections in slums (nos.) 350.0
Area covered by network (sq. km.) 98.0
No. of days of supply in a month 30.0
Annual revenue receipts from water (`) 1,658,000.0
Annual revenue expenditure on water (`) 7,040,000.0
Annual capital expenditure on water (`) 0.0
WASTE WATERArea covered by waste water network (sq. km.) 1.0
Underground sewerage network (sq. km) 0.0
Closed drains (sq. km) 0.0
Open drains (sq. km) 1.0
Total sewerage connections (nos.) 0.0
Sewerage coverage: slums (%) 0.0
Installed STP treatment capacity (MLD) 0.0
Annual revenue receipts from WW (`) 0.0
Annual revenue expenditure on WW (`) 0.0
Annual capital expenditure on WW (`) 3,673,000.0
SOLID WASTE MANAGEMENTWaste generated (TPD) 5.0
Waste collected (TPD) 5.0
Quantity of waste treated (TPD) 0.0
Waste received at scientific landfill (TPD) 0.0
Door to door colln.(no. of households andestablishments)
5,289.0
Waste segregation at source (Y/N) N
Annual revenue receipts from SW (`) 0.0
Annual revenue expenditure on SW (`) 0.0
Annual capital expenditure on SW (`) 770,000.0
215

Rajura Municipal Council
Service Level Benchmark Indicators
WATER SUPPLY
WASTE WATER
SOLID WASTE MANAGEMENT STORM WATER
Blank values represent 'zero', 'not applicable' or 'no data' in the charts above.
216

Ramtek Municipal Council Background
GENERAL INFORMATIONClass Class C No. of slum settlements 2
District Nagpur Slum population 500
Area (sq. km.) 4 Slum households 135
Total city population 24,509 Total annual city capital receipts (`) 30,640,520
Total households 4,932 Total annual city capital expenditure (`) 23,103,165
Density (persons per sq. km.) 7,003 Total annual city revenue receipts (`) 22,973,041
Total municipal staff 46 Total annual city revenue expenditure (`) 13,044,901
WATER SUPPLYTotal water produced (MLD) 1.6
Ground water (MLD) 0.1
Surface water (MLD) 1.5
Average daily volume treated (MLD) 1.5
Installed storage capacity (MLD) 1.0
Total water connections (nos.) 2,400.0
Water connections in slums (nos.) 0.0
Area covered by network (sq. km.) 3.7
No. of days of supply in a month 30.0
Annual revenue receipts from water (`) 1,906,602.0
Annual revenue expenditure on water (`) 4,578,419.0
Annual capital expenditure on water (`) 0.0
WASTE WATERArea covered by waste water network (sq. km.) 1,900.0
Underground sewerage network (sq. km) 0.0
Closed drains (sq. km) 900.0
Open drains (sq. km) 1,000.0
Total sewerage connections (nos.) 0.0
Sewerage coverage: slums (%) 0.0
Installed STP treatment capacity (MLD) 0.0
Annual revenue receipts from WW (`) 0.0
Annual revenue expenditure on WW (`) 770,228.0
Annual capital expenditure on WW (`) 0.0
SOLID WASTE MANAGEMENTWaste generated (TPD) 7.0
Waste collected (TPD) 7.0
Quantity of waste treated (TPD) 0.0
Waste received at scientific landfill (TPD) 0.0
Door to door colln.(no. of households andestablishments)
3,410.0
Waste segregation at source (Y/N) N
Annual revenue receipts from SW (`) 0.0
Annual revenue expenditure on SW (`) 259,459.0
Annual capital expenditure on SW (`) 0.0
217

Ramtek Municipal Council
Service Level Benchmark Indicators
WATER SUPPLY
WASTE WATER
SOLID WASTE MANAGEMENT STORM WATER
Blank values represent 'zero', 'not applicable' or 'no data' in the charts above.
218

Raver Municipal Council Background
GENERAL INFORMATIONClass Class C No. of slum settlements 0
District Jalgaon Slum population 0
Area (sq. km.) 2 Slum households 0
Total city population 27,633 Total annual city capital receipts (`) 31,496,000
Total households 4,606 Total annual city capital expenditure (`) 30,680,000
Density (persons per sq. km.) 12,560 Total annual city revenue receipts (`) 31,774,100
Total municipal staff 121 Total annual city revenue expenditure (`) 34,875,000
WATER SUPPLYTotal water produced (MLD) 3.3
Ground water (MLD) 0.0
Surface water (MLD) 3.3
Average daily volume treated (MLD) 30.0
Installed storage capacity (MLD) 2.2
Total water connections (nos.) 3,500.0
Water connections in slums (nos.) 0.0
Area covered by network (sq. km.) 2.5
No. of days of supply in a month 15.0
Annual revenue receipts from water (`) 0.0
Annual revenue expenditure on water (`) 4,057,000.0
Annual capital expenditure on water (`) 0.0
WASTE WATERArea covered by waste water network (sq. km.) 18.4
Underground sewerage network (sq. km) 0.0
Closed drains (sq. km) 8.9
Open drains (sq. km) 9.5
Total sewerage connections (nos.) 0.0
Sewerage coverage: slums (%) 0.0
Installed STP treatment capacity (MLD) 0.0
Annual revenue receipts from WW (`) 0.0
Annual revenue expenditure on WW (`) 0.0
Annual capital expenditure on WW (`) 0.0
SOLID WASTE MANAGEMENTWaste generated (TPD) 8.0
Waste collected (TPD) 8.0
Quantity of waste treated (TPD) 0.0
Waste received at scientific landfill (TPD) 0.0
Door to door colln.(no. of households andestablishments)
4,255.0
Waste segregation at source (Y/N) N
Annual revenue receipts from SW (`) 0.0
Annual revenue expenditure on SW (`) 0.0
Annual capital expenditure on SW (`) 0.0
219

Raver Municipal Council
Service Level Benchmark Indicators
WATER SUPPLY
WASTE WATER
SOLID WASTE MANAGEMENT STORM WATER
Blank values represent 'zero', 'not applicable' or 'no data' in the charts above.
220

Risod Municipal Council Background
GENERAL INFORMATIONClass Class C No. of slum settlements 2
District Washim Slum population 4,360
Area (sq. km.) 14 Slum households 1,040
Total city population 32,994 Total annual city capital receipts (`) 6,478,371
Total households 6,522 Total annual city capital expenditure (`) 20,931,982
Density (persons per sq. km.) 2,291 Total annual city revenue receipts (`) 17,473,700
Total municipal staff 128 Total annual city revenue expenditure (`) 7,599,500
WATER SUPPLYTotal water produced (MLD) 1.2
Ground water (MLD) 0.0
Surface water (MLD) 1.2
Average daily volume treated (MLD) 1.2
Installed storage capacity (MLD) 1.4
Total water connections (nos.) 2,704.0
Water connections in slums (nos.) 359.0
Area covered by network (sq. km.) 6.0
No. of days of supply in a month 15.0
Annual revenue receipts from water (`) 2,341,000.0
Annual revenue expenditure on water (`) 6,398,000.0
Annual capital expenditure on water (`) 0.0
WASTE WATERArea covered by waste water network (sq. km.) 6.0
Underground sewerage network (sq. km) 0.0
Closed drains (sq. km) 0.0
Open drains (sq. km) 6.0
Total sewerage connections (nos.) 0.0
Sewerage coverage: slums (%) 0.0
Installed STP treatment capacity (MLD) 0.0
Annual revenue receipts from WW (`) 0.0
Annual revenue expenditure on WW (`) 0.0
Annual capital expenditure on WW (`) 0.0
SOLID WASTE MANAGEMENTWaste generated (TPD) 8.0
Waste collected (TPD) 8.0
Quantity of waste treated (TPD) 0.0
Waste received at scientific landfill (TPD) 0.0
Door to door colln.(no. of households andestablishments)
6,872.0
Waste segregation at source (Y/N) N
Annual revenue receipts from SW (`) 0.0
Annual revenue expenditure on SW (`) 0.0
Annual capital expenditure on SW (`) 2,858,000.0
221

Risod Municipal Council
Service Level Benchmark Indicators
WATER SUPPLY
WASTE WATER
SOLID WASTE MANAGEMENT STORM WATER
Blank values represent 'zero', 'not applicable' or 'no data' in the charts above.
222

Roha Municipal Council Background
GENERAL INFORMATIONClass Class C No. of slum settlements 1
District Raigad Slum population 90
Area (sq. km.) 7 Slum households 18
Total city population 31,254 Total annual city capital receipts (`) 62,065,940
Total households 4,525 Total annual city capital expenditure (`) 50,320,465
Density (persons per sq. km.) 4,596 Total annual city revenue receipts (`) 39,720,183
Total municipal staff 38 Total annual city revenue expenditure (`) 26,785,702
WATER SUPPLYTotal water produced (MLD) 4.0
Ground water (MLD) 0.0
Surface water (MLD) 4.0
Average daily volume treated (MLD) 4.0
Installed storage capacity (MLD) 2.1
Total water connections (nos.) 2,688.0
Water connections in slums (nos.) 4.0
Area covered by network (sq. km.) 6.8
No. of days of supply in a month 30.0
Annual revenue receipts from water (`) 4,169,861.0
Annual revenue expenditure on water (`) 3,941,200.0
Annual capital expenditure on water (`) 0.0
WASTE WATERArea covered by waste water network (sq. km.) 5.0
Underground sewerage network (sq. km) 0.0
Closed drains (sq. km) 0.0
Open drains (sq. km) 5.0
Total sewerage connections (nos.) 0.0
Sewerage coverage: slums (%) 0.0
Installed STP treatment capacity (MLD) 0.0
Annual revenue receipts from WW (`) 0.0
Annual revenue expenditure on WW (`) 2,475,381.0
Annual capital expenditure on WW (`) 0.0
SOLID WASTE MANAGEMENTWaste generated (TPD) 7.0
Waste collected (TPD) 7.0
Quantity of waste treated (TPD) 0.0
Waste received at scientific landfill (TPD) 0.0
Door to door colln.(no. of households andestablishments)
5,792.0
Waste segregation at source (Y/N) N
Annual revenue receipts from SW (`) 0.0
Annual revenue expenditure on SW (`) 0.0
Annual capital expenditure on SW (`) 0.0
223

Roha Municipal Council
Service Level Benchmark Indicators
WATER SUPPLY
WASTE WATER
SOLID WASTE MANAGEMENT STORM WATER
Blank values represent 'zero', 'not applicable' or 'no data' in the charts above.
224

Sailu Municipal Council Background
GENERAL INFORMATIONClass Class C No. of slum settlements 23
District Parbhani Slum population 16,225
Area (sq. km.) 20 Slum households 3,245
Total city population 45,470 Total annual city capital receipts (`) 75,125,000
Total households 5,873 Total annual city capital expenditure (`) 68,371,000
Density (persons per sq. km.) 2,274 Total annual city revenue receipts (`) 33,170,000
Total municipal staff 177 Total annual city revenue expenditure (`) 33,142,000
WATER SUPPLYTotal water produced (MLD) 3.0
Ground water (MLD) 3.0
Surface water (MLD) 0.0
Average daily volume treated (MLD) 0.0
Installed storage capacity (MLD) 1.4
Total water connections (nos.) 2,915.0
Water connections in slums (nos.) 1,125.0
Area covered by network (sq. km.) 13.8
No. of days of supply in a month 15.0
Annual revenue receipts from water (`) 632,000.0
Annual revenue expenditure on water (`) 3,273,000.0
Annual capital expenditure on water (`) 3,273,000.0
WASTE WATERArea covered by waste water network (sq. km.) 9.2
Underground sewerage network (sq. km) 0.0
Closed drains (sq. km) 0.0
Open drains (sq. km) 9.2
Total sewerage connections (nos.) 0.0
Sewerage coverage: slums (%) 0.0
Installed STP treatment capacity (MLD) 0.0
Annual revenue receipts from WW (`) 0.0
Annual revenue expenditure on WW (`) 0.0
Annual capital expenditure on WW (`) 0.0
SOLID WASTE MANAGEMENTWaste generated (TPD) 13.0
Waste collected (TPD) 13.0
Quantity of waste treated (TPD) 0.0
Waste received at scientific landfill (TPD) 0.0
Door to door colln.(no. of households andestablishments)
500.0
Waste segregation at source (Y/N) N
Annual revenue receipts from SW (`) 0.0
Annual revenue expenditure on SW (`) 0.0
Annual capital expenditure on SW (`) 0.0
225

Sailu Municipal Council
Service Level Benchmark Indicators
WATER SUPPLY
WASTE WATER
SOLID WASTE MANAGEMENT STORM WATER
Blank values represent 'zero', 'not applicable' or 'no data' in the charts above.
226

Sangola Municipal Council Background
GENERAL INFORMATIONClass Class C No. of slum settlements 4
District Solapur Slum population 2,200
Area (sq. km.) 69 Slum households 450
Total city population 36,000 Total annual city capital receipts (`) 13,913,283
Total households 6,500 Total annual city capital expenditure (`) 13,913,283
Density (persons per sq. km.) 523 Total annual city revenue receipts (`) 72,556,978
Total municipal staff 178 Total annual city revenue expenditure (`) 64,842,522
WATER SUPPLYTotal water produced (MLD) 2.9
Ground water (MLD) 0.8
Surface water (MLD) 2.1
Average daily volume treated (MLD) 2.3
Installed storage capacity (MLD) 1.5
Total water connections (nos.) 3,749.0
Water connections in slums (nos.) 0.0
Area covered by network (sq. km.) 8.3
No. of days of supply in a month 30.0
Annual revenue receipts from water (`) 5,441,485.0
Annual revenue expenditure on water (`) 8,299,450.0
Annual capital expenditure on water (`) 305,482.0
WASTE WATERArea covered by waste water network (sq. km.) 5.0
Underground sewerage network (sq. km) 0.0
Closed drains (sq. km) 1.0
Open drains (sq. km) 4.0
Total sewerage connections (nos.) 0.0
Sewerage coverage: slums (%) 0.0
Installed STP treatment capacity (MLD) 0.0
Annual revenue receipts from WW (`) 0.0
Annual revenue expenditure on WW (`) 1,068,393.0
Annual capital expenditure on WW (`) 161,756.0
SOLID WASTE MANAGEMENTWaste generated (TPD) 7.0
Waste collected (TPD) 7.0
Quantity of waste treated (TPD) 0.0
Waste received at scientific landfill (TPD) 0.0
Door to door colln.(no. of households andestablishments)
1,385.0
Waste segregation at source (Y/N) N
Annual revenue receipts from SW (`) 1,998,563.0
Annual revenue expenditure on SW (`) 0.0
Annual capital expenditure on SW (`) 3,098,800.0
227

Sangola Municipal Council
Service Level Benchmark Indicators
WATER SUPPLY
WASTE WATER
SOLID WASTE MANAGEMENT STORM WATER
Blank values represent 'zero', 'not applicable' or 'no data' in the charts above.
228

Sasvad Municipal Council Background
GENERAL INFORMATIONClass Class C No. of slum settlements 1
District Pune Slum population 450
Area (sq. km.) 23 Slum households 150
Total city population 31,174 Total annual city capital receipts (`) 31,379,000
Total households 6,781 Total annual city capital expenditure (`) 7,516,000
Density (persons per sq. km.) 1,379 Total annual city revenue receipts (`) 50,882,000
Total municipal staff 89 Total annual city revenue expenditure (`) 39,982,000
WATER SUPPLYTotal water produced (MLD) 5.0
Ground water (MLD) 0.0
Surface water (MLD) 5.0
Average daily volume treated (MLD) 5.0
Installed storage capacity (MLD) 3.5
Total water connections (nos.) 4,981.0
Water connections in slums (nos.) 32.0
Area covered by network (sq. km.) 15.5
No. of days of supply in a month 30.0
Annual revenue receipts from water (`) 8,176,000.0
Annual revenue expenditure on water (`) 9,980,000.0
Annual capital expenditure on water (`) 700,000.0
WASTE WATERArea covered by waste water network (sq. km.) 21.0
Underground sewerage network (sq. km) 10.5
Closed drains (sq. km) 0.0
Open drains (sq. km) 10.5
Total sewerage connections (nos.) 0.0
Sewerage coverage: slums (%) 0.0
Installed STP treatment capacity (MLD) 0.0
Annual revenue receipts from WW (`) 1,472,000.0
Annual revenue expenditure on WW (`) 1,677,000.0
Annual capital expenditure on WW (`) 231,000.0
SOLID WASTE MANAGEMENTWaste generated (TPD) 6.0
Waste collected (TPD) 6.0
Quantity of waste treated (TPD) 0.0
Waste received at scientific landfill (TPD) 0.0
Door to door colln.(no. of households andestablishments)
7,081.0
Waste segregation at source (Y/N) N
Annual revenue receipts from SW (`) 0.0
Annual revenue expenditure on SW (`) 9,498,000.0
Annual capital expenditure on SW (`) 2,332,000.0
229

Sasvad Municipal Council
Service Level Benchmark Indicators
WATER SUPPLY
WASTE WATER
SOLID WASTE MANAGEMENT STORM WATER
Blank values represent 'zero', 'not applicable' or 'no data' in the charts above.
230

Satana Municipal Council Background
GENERAL INFORMATIONClass Class C No. of slum settlements 0
District Nashik Slum population 0
Area (sq. km.) 16 Slum households 0
Total city population 37,170 Total annual city capital receipts (`) 21,401,062
Total households 6,562 Total annual city capital expenditure (`) 18,443,143
Density (persons per sq. km.) 2,323 Total annual city revenue receipts (`) 47,418,533
Total municipal staff 198 Total annual city revenue expenditure (`) 48,006,121
WATER SUPPLYTotal water produced (MLD) 2.2
Ground water (MLD) 0.0
Surface water (MLD) 2.2
Average daily volume treated (MLD) 2.2
Installed storage capacity (MLD) 2.2
Total water connections (nos.) 4,875.0
Water connections in slums (nos.) 0.0
Area covered by network (sq. km.) 16.0
No. of days of supply in a month 15.0
Annual revenue receipts from water (`) 4,607,893.0
Annual revenue expenditure on water (`) 7,184,575.0
Annual capital expenditure on water (`) 3,132,103.0
WASTE WATERArea covered by waste water network (sq. km.) 2.5
Underground sewerage network (sq. km) 0.0
Closed drains (sq. km) 0.0
Open drains (sq. km) 2.5
Total sewerage connections (nos.) 0.0
Sewerage coverage: slums (%) 0.0
Installed STP treatment capacity (MLD) 0.0
Annual revenue receipts from WW (`) 0.0
Annual revenue expenditure on WW (`) 2,829,816.0
Annual capital expenditure on WW (`) 534,560.0
SOLID WASTE MANAGEMENTWaste generated (TPD) 11.0
Waste collected (TPD) 11.0
Quantity of waste treated (TPD) 0.0
Waste received at scientific landfill (TPD) 0.0
Door to door colln.(no. of households andestablishments)
6,672.0
Waste segregation at source (Y/N) N
Annual revenue receipts from SW (`) 0.0
Annual revenue expenditure on SW (`) 6,790,425.0
Annual capital expenditure on SW (`) 0.0
231

Satana Municipal Council
Service Level Benchmark Indicators
WATER SUPPLY
WASTE WATER
SOLID WASTE MANAGEMENT STORM WATER
Blank values represent 'zero', 'not applicable' or 'no data' in the charts above.
232

Savda Municipal Council Background
GENERAL INFORMATIONClass Class C No. of slum settlements 2
District Jalgaon Slum population 2,765
Area (sq. km.) 2 Slum households 553
Total city population 20,824 Total annual city capital receipts (`) 1,106,000
Total households 4,156 Total annual city capital expenditure (`) 907,000
Density (persons per sq. km.) 9,916 Total annual city revenue receipts (`) 25,343,000
Total municipal staff 140 Total annual city revenue expenditure (`) 24,961,000
WATER SUPPLYTotal water produced (MLD) 1.5
Ground water (MLD) 0.0
Surface water (MLD) 1.5
Average daily volume treated (MLD) 1.5
Installed storage capacity (MLD) 1.1
Total water connections (nos.) 2,708.0
Water connections in slums (nos.) 14.0
Area covered by network (sq. km.) 1.2
No. of days of supply in a month 30.0
Annual revenue receipts from water (`) 2,743,100.0
Annual revenue expenditure on water (`) 4,332,000.0
Annual capital expenditure on water (`) 4,432,000.0
WASTE WATERArea covered by waste water network (sq. km.) 1.4
Underground sewerage network (sq. km) 0.0
Closed drains (sq. km) 0.0
Open drains (sq. km) 1.4
Total sewerage connections (nos.) 0.0
Sewerage coverage: slums (%) 0.0
Installed STP treatment capacity (MLD) 0.0
Annual revenue receipts from WW (`) 0.0
Annual revenue expenditure on WW (`) 836,000.0
Annual capital expenditure on WW (`) 0.0
SOLID WASTE MANAGEMENTWaste generated (TPD) 5.0
Waste collected (TPD) 5.0
Quantity of waste treated (TPD) 0.0
Waste received at scientific landfill (TPD) 0.0
Door to door colln.(no. of households andestablishments)
1,631.0
Waste segregation at source (Y/N) N
Annual revenue receipts from SW (`) 0.0
Annual revenue expenditure on SW (`) 953,000.0
Annual capital expenditure on SW (`) 21,000.0
233

Savda Municipal Council
Service Level Benchmark Indicators
WATER SUPPLY
WASTE WATER
SOLID WASTE MANAGEMENT STORM WATER
Blank values represent 'zero', 'not applicable' or 'no data' in the charts above.
234

Sawantwadi Municipal Council Background
GENERAL INFORMATIONClass Class C No. of slum settlements 0
District Sindhudurg Slum population 0
Area (sq. km.) 7 Slum households 0
Total city population 24,174 Total annual city capital receipts (`) 4,661,663
Total households 6,656 Total annual city capital expenditure (`) 11,311,289
Density (persons per sq. km.) 3,555 Total annual city revenue receipts (`) 58,239,978
Total municipal staff 130 Total annual city revenue expenditure (`) 58,128,735
WATER SUPPLYTotal water produced (MLD) 3.5
Ground water (MLD) 0.0
Surface water (MLD) 3.5
Average daily volume treated (MLD) 2.8
Installed storage capacity (MLD) 2,300,000.0
Total water connections (nos.) 3,153.0
Water connections in slums (nos.) 0.0
Area covered by network (sq. km.) 6.8
No. of days of supply in a month 30.0
Annual revenue receipts from water (`) 7,018,557.0
Annual revenue expenditure on water (`) 5,891,094.0
Annual capital expenditure on water (`) 1,160,510.0
WASTE WATERArea covered by waste water network (sq. km.) 0.0
Underground sewerage network (sq. km) 0.0
Closed drains (sq. km) 0.0
Open drains (sq. km) 0.0
Total sewerage connections (nos.) 0.0
Sewerage coverage: slums (%) 0.0
Installed STP treatment capacity (MLD) 0.0
Annual revenue receipts from WW (`) 0.0
Annual revenue expenditure on WW (`) 0.0
Annual capital expenditure on WW (`) 0.0
SOLID WASTE MANAGEMENTWaste generated (TPD) 6.0
Waste collected (TPD) 6.0
Quantity of waste treated (TPD) 0.0
Waste received at scientific landfill (TPD) 0.0
Door to door colln.(no. of households andestablishments)
6,656.0
Waste segregation at source (Y/N) Y
Annual revenue receipts from SW (`) 103,982.0
Annual revenue expenditure on SW (`) 516,028.0
Annual capital expenditure on SW (`) 0.0
235

Sawantwadi Municipal Council
Service Level Benchmark Indicators
WATER SUPPLY
WASTE WATER
SOLID WASTE MANAGEMENT STORM WATER
Blank values represent 'zero', 'not applicable' or 'no data' in the charts above.
236

Sawner Municipal Council Background
GENERAL INFORMATIONClass Class C No. of slum settlements 6
District Nagpur Slum population 4,766
Area (sq. km.) 4 Slum households 1,145
Total city population 32,000 Total annual city capital receipts (`) 153,163,000
Total households 6,400 Total annual city capital expenditure (`) 75,194,000
Density (persons per sq. km.) 8,421 Total annual city revenue receipts (`) 153,163,000
Total municipal staff 109 Total annual city revenue expenditure (`) 75,194,000
WATER SUPPLYTotal water produced (MLD) 2.3
Ground water (MLD) 0.0
Surface water (MLD) 2.3
Average daily volume treated (MLD) 2.3
Installed storage capacity (MLD) 11.5
Total water connections (nos.) 3,686.0
Water connections in slums (nos.) 170.0
Area covered by network (sq. km.) 3.8
No. of days of supply in a month 30.0
Annual revenue receipts from water (`) 4,414,000.0
Annual revenue expenditure on water (`) 4,676,000.0
Annual capital expenditure on water (`) 0.0
WASTE WATERArea covered by waste water network (sq. km.) 3.2
Underground sewerage network (sq. km) 0.0
Closed drains (sq. km) 0.0
Open drains (sq. km) 3.2
Total sewerage connections (nos.) 0.0
Sewerage coverage: slums (%) 0.0
Installed STP treatment capacity (MLD) 0.0
Annual revenue receipts from WW (`) 0.0
Annual revenue expenditure on WW (`) 3,022,000.0
Annual capital expenditure on WW (`) 1,976,778.0
SOLID WASTE MANAGEMENTWaste generated (TPD) 8.0
Waste collected (TPD) 7.9
Quantity of waste treated (TPD) 5.0
Waste received at scientific landfill (TPD) 0.0
Door to door colln.(no. of households andestablishments)
5,727.0
Waste segregation at source (Y/N) N
Annual revenue receipts from SW (`) 0.0
Annual revenue expenditure on SW (`) 463,150.0
Annual capital expenditure on SW (`) 0.0
237

Sawner Municipal Council
Service Level Benchmark Indicators
WATER SUPPLY
WASTE WATER
SOLID WASTE MANAGEMENT STORM WATER
Blank values represent 'zero', 'not applicable' or 'no data' in the charts above.
238

Shahade Municipal Council Background
GENERAL INFORMATIONClass Class C No. of slum settlements 11
District Nandurbar Slum population 5,160
Area (sq. km.) 7 Slum households 1,032
Total city population 63,946 Total annual city capital receipts (`) 9,429,000
Total households 11,025 Total annual city capital expenditure (`) 15,725,825
Density (persons per sq. km.) 9,689 Total annual city revenue receipts (`) 54,710,000
Total municipal staff 169 Total annual city revenue expenditure (`) 63,503,000
WATER SUPPLYTotal water produced (MLD) 3.0
Ground water (MLD) 3.0
Surface water (MLD) 0.0
Average daily volume treated (MLD) 0.0
Installed storage capacity (MLD) 22.5
Total water connections (nos.) 4,761.0
Water connections in slums (nos.) 700.0
Area covered by network (sq. km.) 5.5
No. of days of supply in a month 10.0
Annual revenue receipts from water (`) 7,722,000.0
Annual revenue expenditure on water (`) 6,865,000.0
Annual capital expenditure on water (`) 642,000.0
WASTE WATERArea covered by waste water network (sq. km.) 2.5
Underground sewerage network (sq. km) 0.0
Closed drains (sq. km) 0.0
Open drains (sq. km) 2.5
Total sewerage connections (nos.) 0.0
Sewerage coverage: slums (%) 0.0
Installed STP treatment capacity (MLD) 0.0
Annual revenue receipts from WW (`) 0.0
Annual revenue expenditure on WW (`) 0.0
Annual capital expenditure on WW (`) 0.0
SOLID WASTE MANAGEMENTWaste generated (TPD) 11.0
Waste collected (TPD) 11.0
Quantity of waste treated (TPD) 0.0
Waste received at scientific landfill (TPD) 0.0
Door to door colln.(no. of households andestablishments)
7,642.0
Waste segregation at source (Y/N) N
Annual revenue receipts from SW (`) 0.0
Annual revenue expenditure on SW (`) 0.0
Annual capital expenditure on SW (`) 3,126,000.0
239

Shahade Municipal Council
Service Level Benchmark Indicators
WATER SUPPLY
WASTE WATER
SOLID WASTE MANAGEMENT STORM WATER
Blank values represent 'zero', 'not applicable' or 'no data' in the charts above.
240

Shendurjana Municipal Council Background
GENERAL INFORMATIONClass Class C No. of slum settlements 4
District Amravati Slum population 6,099
Area (sq. km.) 19 Slum households 1,210
Total city population 22,523 Total annual city capital receipts (`) 33,846,623
Total households 5,324 Total annual city capital expenditure (`) 10,557,436
Density (persons per sq. km.) 1,173 Total annual city revenue receipts (`) 26,404,838
Total municipal staff 42 Total annual city revenue expenditure (`) 21,950,238
WATER SUPPLYTotal water produced (MLD) 2.3
Ground water (MLD) 0.0
Surface water (MLD) 2.3
Average daily volume treated (MLD) 2.3
Installed storage capacity (MLD) 1.0
Total water connections (nos.) 2,340.0
Water connections in slums (nos.) 65.0
Area covered by network (sq. km.) 14.8
No. of days of supply in a month 15.0
Annual revenue receipts from water (`) 1,983,465.0
Annual revenue expenditure on water (`) 2,249,131.0
Annual capital expenditure on water (`) 2,248,164.0
WASTE WATERArea covered by waste water network (sq. km.) 13.4
Underground sewerage network (sq. km) 0.0
Closed drains (sq. km) 0.0
Open drains (sq. km) 13.4
Total sewerage connections (nos.) 0.0
Sewerage coverage: slums (%) 0.0
Installed STP treatment capacity (MLD) 0.0
Annual revenue receipts from WW (`) 161,496.0
Annual revenue expenditure on WW (`) 1,456,373.0
Annual capital expenditure on WW (`) 57,178.0
SOLID WASTE MANAGEMENTWaste generated (TPD) 6.0
Waste collected (TPD) 6.0
Quantity of waste treated (TPD) 0.0
Waste received at scientific landfill (TPD) 0.0
Door to door colln.(no. of households andestablishments)
5,351.0
Waste segregation at source (Y/N) N
Annual revenue receipts from SW (`) 0.0
Annual revenue expenditure on SW (`) 1,163,608.0
Annual capital expenditure on SW (`) 893,000.0
241

Shendurjana Municipal Council
Service Level Benchmark Indicators
WATER SUPPLY
WASTE WATER
SOLID WASTE MANAGEMENT STORM WATER
Blank values represent 'zero', 'not applicable' or 'no data' in the charts above.
242

Shirur Municipal Council Background
GENERAL INFORMATIONClass Class C No. of slum settlements 11
District Pune Slum population 7,214
Area (sq. km.) 6 Slum households 1,240
Total city population 35,627 Total annual city capital receipts (`) 24,934,989
Total households 7,289 Total annual city capital expenditure (`) 38,499,230
Density (persons per sq. km.) 5,567 Total annual city revenue receipts (`) 77,496,879
Total municipal staff 116 Total annual city revenue expenditure (`) 81,902,543
WATER SUPPLYTotal water produced (MLD) 6.0
Ground water (MLD) 0.0
Surface water (MLD) 6.0
Average daily volume treated (MLD) 5.0
Installed storage capacity (MLD) 4.0
Total water connections (nos.) 3,917.0
Water connections in slums (nos.) 0.0
Area covered by network (sq. km.) 4.9
No. of days of supply in a month 29.0
Annual revenue receipts from water (`) 4,447,604.0
Annual revenue expenditure on water (`) 7,564,464.0
Annual capital expenditure on water (`) 0.0
WASTE WATERArea covered by waste water network (sq. km.) 6.4
Underground sewerage network (sq. km) 0.0
Closed drains (sq. km) 1.4
Open drains (sq. km) 5.0
Total sewerage connections (nos.) 0.0
Sewerage coverage: slums (%) 0.0
Installed STP treatment capacity (MLD) 0.0
Annual revenue receipts from WW (`) 0.0
Annual revenue expenditure on WW (`) 2,362,115.0
Annual capital expenditure on WW (`) 1,227,607.0
SOLID WASTE MANAGEMENTWaste generated (TPD) 6.0
Waste collected (TPD) 5.0
Quantity of waste treated (TPD) 0.0
Waste received at scientific landfill (TPD) 0.0
Door to door colln.(no. of households andestablishments)
6,587.0
Waste segregation at source (Y/N) N
Annual revenue receipts from SW (`) 1,052,282.0
Annual revenue expenditure on SW (`) 2,194,329.0
Annual capital expenditure on SW (`) 2,184,352.0
243

Shirur Municipal Council
Service Level Benchmark Indicators
WATER SUPPLY
WASTE WATER
SOLID WASTE MANAGEMENT STORM WATER
Blank values represent 'zero', 'not applicable' or 'no data' in the charts above.
244
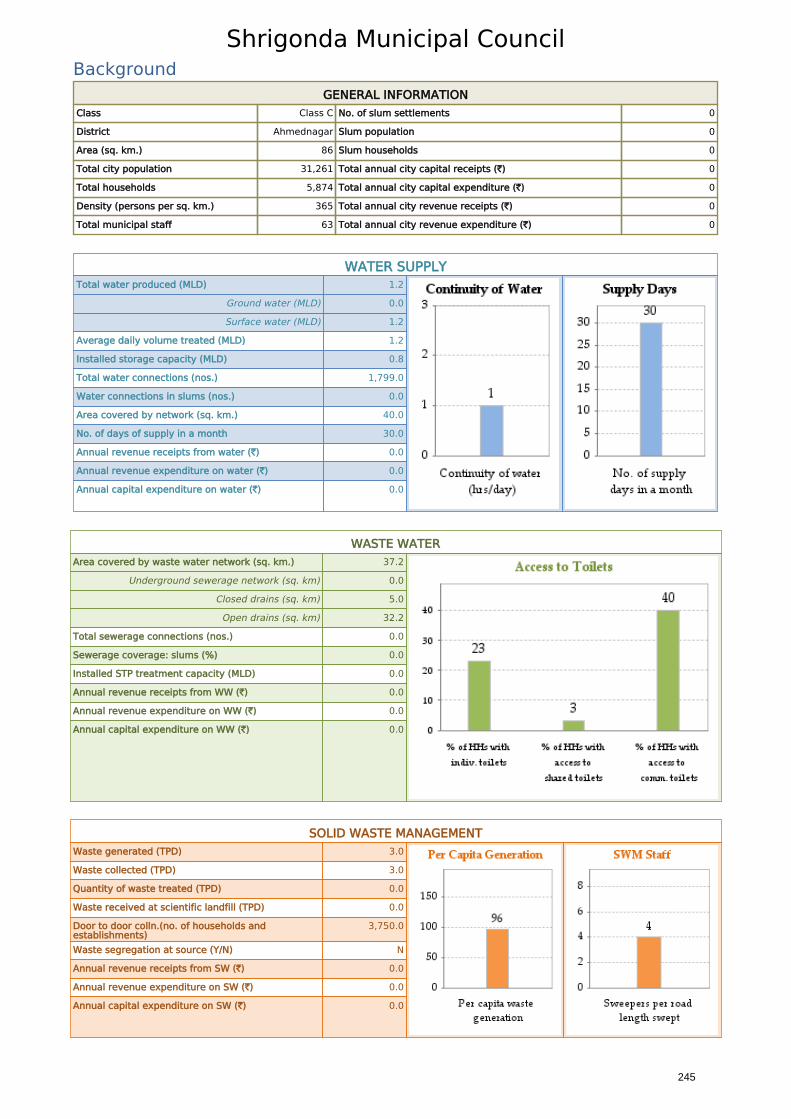
Shrigonda Municipal Council Background
GENERAL INFORMATIONClass Class C No. of slum settlements 0
District Ahmednagar Slum population 0
Area (sq. km.) 86 Slum households 0
Total city population 31,261 Total annual city capital receipts (`) 0
Total households 5,874 Total annual city capital expenditure (`) 0
Density (persons per sq. km.) 365 Total annual city revenue receipts (`) 0
Total municipal staff 63 Total annual city revenue expenditure (`) 0
WATER SUPPLYTotal water produced (MLD) 1.2
Ground water (MLD) 0.0
Surface water (MLD) 1.2
Average daily volume treated (MLD) 1.2
Installed storage capacity (MLD) 0.8
Total water connections (nos.) 1,799.0
Water connections in slums (nos.) 0.0
Area covered by network (sq. km.) 40.0
No. of days of supply in a month 30.0
Annual revenue receipts from water (`) 0.0
Annual revenue expenditure on water (`) 0.0
Annual capital expenditure on water (`) 0.0
WASTE WATERArea covered by waste water network (sq. km.) 37.2
Underground sewerage network (sq. km) 0.0
Closed drains (sq. km) 5.0
Open drains (sq. km) 32.2
Total sewerage connections (nos.) 0.0
Sewerage coverage: slums (%) 0.0
Installed STP treatment capacity (MLD) 0.0
Annual revenue receipts from WW (`) 0.0
Annual revenue expenditure on WW (`) 0.0
Annual capital expenditure on WW (`) 0.0
SOLID WASTE MANAGEMENTWaste generated (TPD) 3.0
Waste collected (TPD) 3.0
Quantity of waste treated (TPD) 0.0
Waste received at scientific landfill (TPD) 0.0
Door to door colln.(no. of households andestablishments)
3,750.0
Waste segregation at source (Y/N) N
Annual revenue receipts from SW (`) 0.0
Annual revenue expenditure on SW (`) 0.0
Annual capital expenditure on SW (`) 0.0
245

Shrigonda Municipal Council
Service Level Benchmark Indicators
WATER SUPPLY
WASTE WATER
SOLID WASTE MANAGEMENT STORM WATER
Blank values represent 'zero', 'not applicable' or 'no data' in the charts above.
246

Shrivardhan Municipal Council Background
GENERAL INFORMATIONClass Class C No. of slum settlements 0
District Raigad Slum population 0
Area (sq. km.) 4 Slum households 0
Total city population 15,991 Total annual city capital receipts (`) 0
Total households 3,372 Total annual city capital expenditure (`) 0
Density (persons per sq. km.) 3,998 Total annual city revenue receipts (`) 23,757,681
Total municipal staff 42 Total annual city revenue expenditure (`) 33,918,054
WATER SUPPLYTotal water produced (MLD) 3.8
Ground water (MLD) 3.8
Surface water (MLD) 0.0
Average daily volume treated (MLD) 0.0
Installed storage capacity (MLD) 0.6
Total water connections (nos.) 1,889.0
Water connections in slums (nos.) 0.0
Area covered by network (sq. km.) 4.0
No. of days of supply in a month 30.0
Annual revenue receipts from water (`) 1,603,144.0
Annual revenue expenditure on water (`) 1,117,002.0
Annual capital expenditure on water (`) 0.0
WASTE WATERArea covered by waste water network (sq. km.) 4.5
Underground sewerage network (sq. km) 0.0
Closed drains (sq. km) 0.5
Open drains (sq. km) 4.0
Total sewerage connections (nos.) 0.0
Sewerage coverage: slums (%) 0.0
Installed STP treatment capacity (MLD) 0.0
Annual revenue receipts from WW (`) 0.0
Annual revenue expenditure on WW (`) 0.0
Annual capital expenditure on WW (`) 0.0
SOLID WASTE MANAGEMENTWaste generated (TPD) 2.0
Waste collected (TPD) 2.0
Quantity of waste treated (TPD) 0.0
Waste received at scientific landfill (TPD) 0.0
Door to door colln.(no. of households andestablishments)
0.0
Waste segregation at source (Y/N) N
Annual revenue receipts from SW (`) 1,489,362.0
Annual revenue expenditure on SW (`) 0.0
Annual capital expenditure on SW (`) 0.0
247

Shrivardhan Municipal Council
Service Level Benchmark Indicators
WATER SUPPLY
WASTE WATER
SOLID WASTE MANAGEMENT STORM WATER
Blank values represent 'zero', 'not applicable' or 'no data' in the charts above.
248

Sindi Municipal Council Background
GENERAL INFORMATIONClass Class C No. of slum settlements 3
District Wardha Slum population 2,475
Area (sq. km.) 10 Slum households 495
Total city population 14,266 Total annual city capital receipts (`) 25,366,000
Total households 2,670 Total annual city capital expenditure (`) 29,563,000
Density (persons per sq. km.) 1,359 Total annual city revenue receipts (`) 25,366,000
Total municipal staff 42 Total annual city revenue expenditure (`) 29,563,000
WATER SUPPLYTotal water produced (MLD) 1.0
Ground water (MLD) 0.0
Surface water (MLD) 1.0
Average daily volume treated (MLD) 0.0
Installed storage capacity (MLD) 0.6
Total water connections (nos.) 1,535.0
Water connections in slums (nos.) 132.0
Area covered by network (sq. km.) 7.1
No. of days of supply in a month 30.0
Annual revenue receipts from water (`) 1,294,000.0
Annual revenue expenditure on water (`) 1,495,000.0
Annual capital expenditure on water (`) 1,495,206.0
WASTE WATERArea covered by waste water network (sq. km.) 5.5
Underground sewerage network (sq. km) 0.0
Closed drains (sq. km) 0.0
Open drains (sq. km) 5.5
Total sewerage connections (nos.) 0.0
Sewerage coverage: slums (%) 0.0
Installed STP treatment capacity (MLD) 0.0
Annual revenue receipts from WW (`) 0.0
Annual revenue expenditure on WW (`) 969,000.0
Annual capital expenditure on WW (`) 969,279.0
SOLID WASTE MANAGEMENTWaste generated (TPD) 3.0
Waste collected (TPD) 3.0
Quantity of waste treated (TPD) 0.0
Waste received at scientific landfill (TPD) 0.0
Door to door colln.(no. of households andestablishments)
0.0
Waste segregation at source (Y/N) N
Annual revenue receipts from SW (`) 856,000.0
Annual revenue expenditure on SW (`) 265,000.0
Annual capital expenditure on SW (`) 265,000.0
249
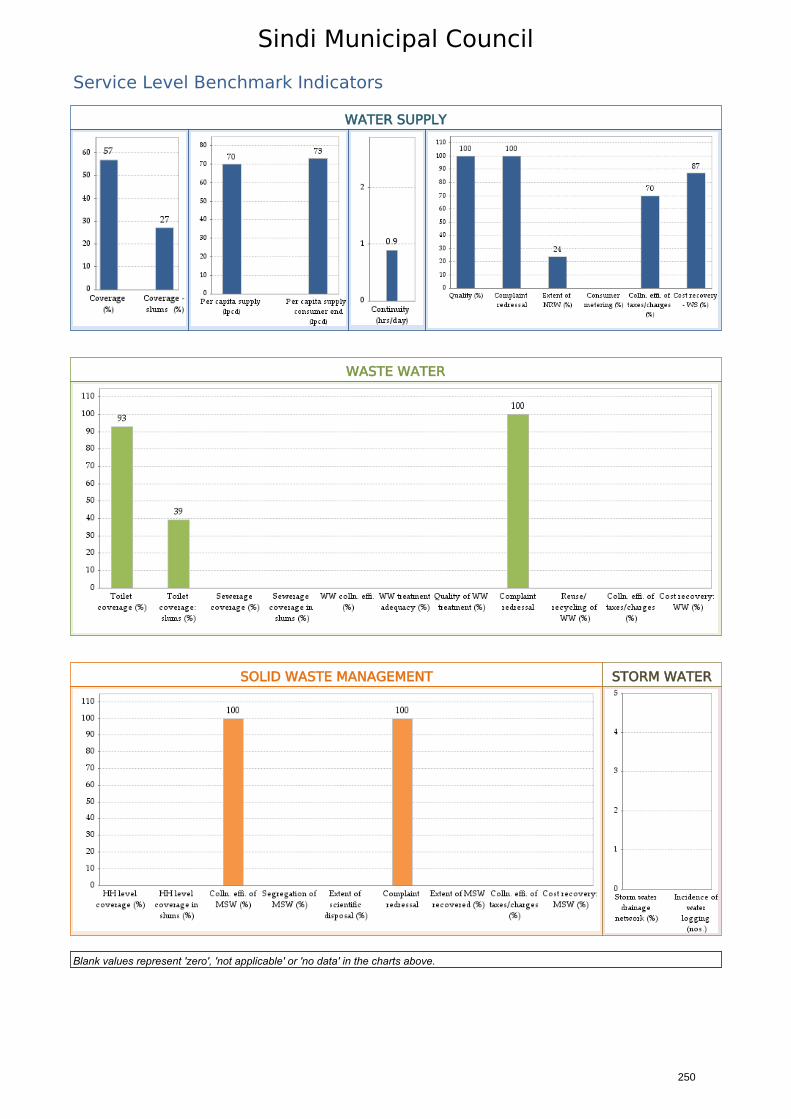
Sindi Municipal Council
Service Level Benchmark Indicators
WATER SUPPLY
WASTE WATER
SOLID WASTE MANAGEMENT STORM WATER
Blank values represent 'zero', 'not applicable' or 'no data' in the charts above.
250

Sindkhed Raja Municipal Council Background
GENERAL INFORMATIONClass Class C No. of slum settlements 2
District Buldhana Slum population 3,117
Area (sq. km.) 40 Slum households 603
Total city population 16,500 Total annual city capital receipts (`) 819,000
Total households 3,273 Total annual city capital expenditure (`) 13,118,000
Density (persons per sq. km.) 418 Total annual city revenue receipts (`) 18,810,000
Total municipal staff 24 Total annual city revenue expenditure (`) 23,712,000
WATER SUPPLYTotal water produced (MLD) 2.0
Ground water (MLD) 0.1
Surface water (MLD) 1.9
Average daily volume treated (MLD) 1.5
Installed storage capacity (MLD) 0.6
Total water connections (nos.) 1,678.0
Water connections in slums (nos.) 65.0
Area covered by network (sq. km.) 6.3
No. of days of supply in a month 15.0
Annual revenue receipts from water (`) 1,495,000.0
Annual revenue expenditure on water (`) 1,764,000.0
Annual capital expenditure on water (`) 0.0
WASTE WATERArea covered by waste water network (sq. km.) 0.0
Underground sewerage network (sq. km) 0.0
Closed drains (sq. km) 0.0
Open drains (sq. km) 0.0
Total sewerage connections (nos.) 0.0
Sewerage coverage: slums (%) 0.0
Installed STP treatment capacity (MLD) 0.0
Annual revenue receipts from WW (`) 0.0
Annual revenue expenditure on WW (`) 0.0
Annual capital expenditure on WW (`) 1,424,000.0
SOLID WASTE MANAGEMENTWaste generated (TPD) 4.0
Waste collected (TPD) 4.0
Quantity of waste treated (TPD) 0.0
Waste received at scientific landfill (TPD) 0.0
Door to door colln.(no. of households andestablishments)
2,825.0
Waste segregation at source (Y/N) N
Annual revenue receipts from SW (`) 0.0
Annual revenue expenditure on SW (`) 0.0
Annual capital expenditure on SW (`) 3,081,000.0
251

Sindkhed Raja Municipal Council
Service Level Benchmark Indicators
WATER SUPPLY
WASTE WATER
SOLID WASTE MANAGEMENT STORM WATER
Blank values represent 'zero', 'not applicable' or 'no data' in the charts above.
252

Sinnar Municipal Council Background
GENERAL INFORMATIONClass Class C No. of slum settlements 11
District Nashik Slum population 12,900
Area (sq. km.) 5 Slum households 2,580
Total city population 44,242 Total annual city capital receipts (`) 29,500,000
Total households 8,556 Total annual city capital expenditure (`) 4,000,000
Density (persons per sq. km.) 8,348 Total annual city revenue receipts (`) 83,195,000
Total municipal staff 120 Total annual city revenue expenditure (`) 92,111,000
WATER SUPPLYTotal water produced (MLD) 5.0
Ground water (MLD) 0.0
Surface water (MLD) 5.0
Average daily volume treated (MLD) 5.0
Installed storage capacity (MLD) 28.0
Total water connections (nos.) 5,250.0
Water connections in slums (nos.) 1,500.0
Area covered by network (sq. km.) 5.3
No. of days of supply in a month 30.0
Annual revenue receipts from water (`) 83,195,000.0
Annual revenue expenditure on water (`) 86,488,000.0
Annual capital expenditure on water (`) 0.0
WASTE WATERArea covered by waste water network (sq. km.) 5.0
Underground sewerage network (sq. km) 0.0
Closed drains (sq. km) 5.0
Open drains (sq. km) 0.0
Total sewerage connections (nos.) 0.0
Sewerage coverage: slums (%) 0.0
Installed STP treatment capacity (MLD) 0.0
Annual revenue receipts from WW (`) 0.0
Annual revenue expenditure on WW (`) 0.0
Annual capital expenditure on WW (`) 0.0
SOLID WASTE MANAGEMENTWaste generated (TPD) 15.2
Waste collected (TPD) 15.2
Quantity of waste treated (TPD) 0.0
Waste received at scientific landfill (TPD) 0.0
Door to door colln.(no. of households andestablishments)
10,356.0
Waste segregation at source (Y/N) N
Annual revenue receipts from SW (`) 0.0
Annual revenue expenditure on SW (`) 1,153,000.0
Annual capital expenditure on SW (`) 0.0
253
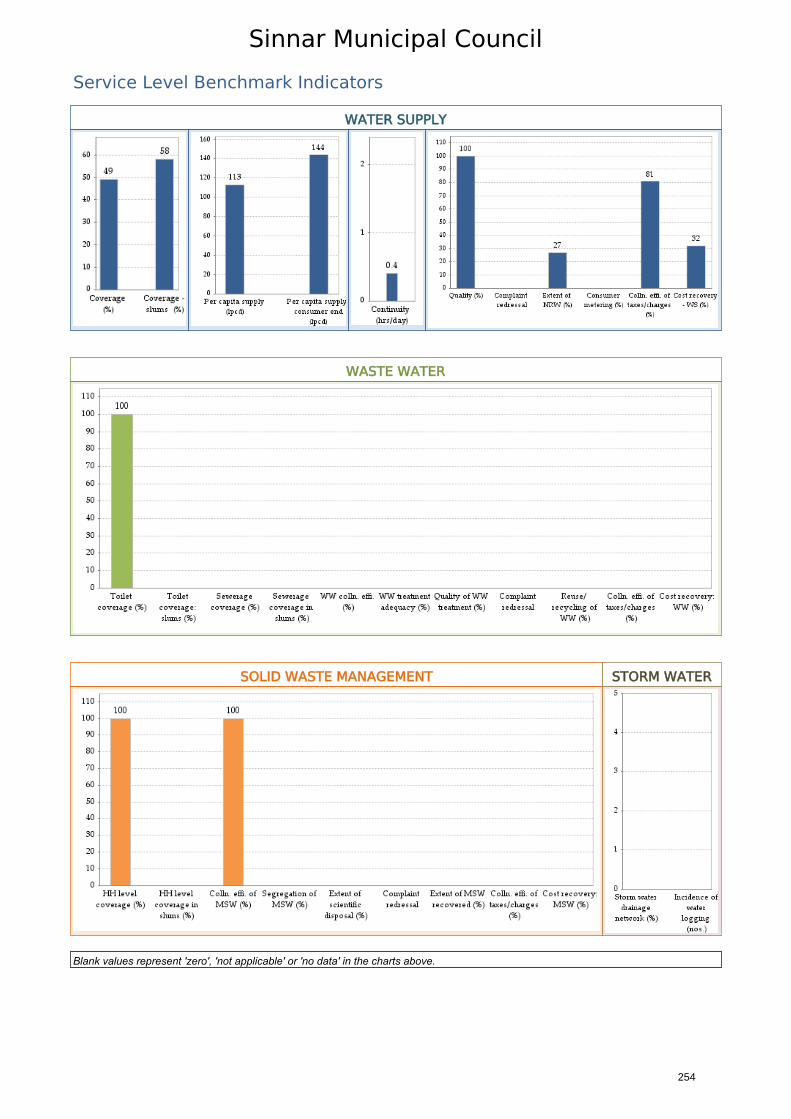
Sinnar Municipal Council
Service Level Benchmark Indicators
WATER SUPPLY
WASTE WATER
SOLID WASTE MANAGEMENT STORM WATER
Blank values represent 'zero', 'not applicable' or 'no data' in the charts above.
254

Sonpeth Municipal Council Background
GENERAL INFORMATIONClass Class C No. of slum settlements 10
District Parbhani Slum population 7,700
Area (sq. km.) 13 Slum households 1,340
Total city population 18,874 Total annual city capital receipts (`) 37,974,494
Total households 2,721 Total annual city capital expenditure (`) 41,533,219
Density (persons per sq. km.) 1,441 Total annual city revenue receipts (`) 10,198,942
Total municipal staff 47 Total annual city revenue expenditure (`) 6,672,995
WATER SUPPLYTotal water produced (MLD) 1.6
Ground water (MLD) 1.6
Surface water (MLD) 0.0
Average daily volume treated (MLD) 0.0
Installed storage capacity (MLD) 0.4
Total water connections (nos.) 1,015.0
Water connections in slums (nos.) 0.0
Area covered by network (sq. km.) 13.1
No. of days of supply in a month 30.0
Annual revenue receipts from water (`) 750,154.0
Annual revenue expenditure on water (`) 861,063.0
Annual capital expenditure on water (`) 235,000.0
WASTE WATERArea covered by waste water network (sq. km.) 10.0
Underground sewerage network (sq. km) 0.0
Closed drains (sq. km) 0.0
Open drains (sq. km) 10.0
Total sewerage connections (nos.) 0.0
Sewerage coverage: slums (%) 0.0
Installed STP treatment capacity (MLD) 0.0
Annual revenue receipts from WW (`) 0.0
Annual revenue expenditure on WW (`) 0.0
Annual capital expenditure on WW (`) 0.0
SOLID WASTE MANAGEMENTWaste generated (TPD) 5.0
Waste collected (TPD) 5.0
Quantity of waste treated (TPD) 2.0
Waste received at scientific landfill (TPD) 0.0
Door to door colln.(no. of households andestablishments)
218.0
Waste segregation at source (Y/N) N
Annual revenue receipts from SW (`) 0.0
Annual revenue expenditure on SW (`) 0.0
Annual capital expenditure on SW (`) 0.0
255

Sonpeth Municipal Council
Service Level Benchmark Indicators
WATER SUPPLY
WASTE WATER
SOLID WASTE MANAGEMENT STORM WATER
Blank values represent 'zero', 'not applicable' or 'no data' in the charts above.
256

Talode Municipal Council Background
GENERAL INFORMATIONClass Class C No. of slum settlements 14
District Nandurbar Slum population 6,808
Area (sq. km.) 2 Slum households 1,417
Total city population 27,704 Total annual city capital receipts (`) 8,064,000
Total households 4,886 Total annual city capital expenditure (`) 7,674,000
Density (persons per sq. km.) 13,192 Total annual city revenue receipts (`) 18,392,000
Total municipal staff 76 Total annual city revenue expenditure (`) 19,826,000
WATER SUPPLYTotal water produced (MLD) 1.2
Ground water (MLD) 1.2
Surface water (MLD) 0.0
Average daily volume treated (MLD) 0.0
Installed storage capacity (MLD) 1.4
Total water connections (nos.) 1,445.0
Water connections in slums (nos.) 0.0
Area covered by network (sq. km.) 1.5
No. of days of supply in a month 15.0
Annual revenue receipts from water (`) 1,108,000.0
Annual revenue expenditure on water (`) 1,167,000.0
Annual capital expenditure on water (`) 0.0
WASTE WATERArea covered by waste water network (sq. km.) 1,502.0
Underground sewerage network (sq. km) 0.0
Closed drains (sq. km) 1,500.0
Open drains (sq. km) 2.0
Total sewerage connections (nos.) 0.0
Sewerage coverage: slums (%) 0.0
Installed STP treatment capacity (MLD) 0.0
Annual revenue receipts from WW (`) 0.0
Annual revenue expenditure on WW (`) 0.0
Annual capital expenditure on WW (`) 0.0
SOLID WASTE MANAGEMENTWaste generated (TPD) 7.0
Waste collected (TPD) 6.5
Quantity of waste treated (TPD) 0.0
Waste received at scientific landfill (TPD) 0.0
Door to door colln.(no. of households andestablishments)
4,657.0
Waste segregation at source (Y/N) N
Annual revenue receipts from SW (`) 0.0
Annual revenue expenditure on SW (`) 0.0
Annual capital expenditure on SW (`) 4,242,000.0
257

Talode Municipal Council
Service Level Benchmark Indicators
WATER SUPPLY
WASTE WATER
SOLID WASTE MANAGEMENT STORM WATER
Blank values represent 'zero', 'not applicable' or 'no data' in the charts above.
258

Tasgaon Municipal Council Background
GENERAL INFORMATIONClass Class C No. of slum settlements 5
District Sangli Slum population 1,764
Area (sq. km.) 43 Slum households 393
Total city population 37,673 Total annual city capital receipts (`) 39,157,613
Total households 5,520 Total annual city capital expenditure (`) 15,403,711
Density (persons per sq. km.) 868 Total annual city revenue receipts (`) 53,277,300
Total municipal staff 92 Total annual city revenue expenditure (`) 63,003,663
WATER SUPPLYTotal water produced (MLD) 4.2
Ground water (MLD) 0.0
Surface water (MLD) 4.2
Average daily volume treated (MLD) 3.8
Installed storage capacity (MLD) 17.5
Total water connections (nos.) 4,272.0
Water connections in slums (nos.) 0.0
Area covered by network (sq. km.) 11.0
No. of days of supply in a month 28.0
Annual revenue receipts from water (`) 5,926,647.0
Annual revenue expenditure on water (`) 13,358,836.0
Annual capital expenditure on water (`) 909,538.0
WASTE WATERArea covered by waste water network (sq. km.) 10.0
Underground sewerage network (sq. km) 0.0
Closed drains (sq. km) 0.0
Open drains (sq. km) 10.0
Total sewerage connections (nos.) 0.0
Sewerage coverage: slums (%) 0.0
Installed STP treatment capacity (MLD) 0.0
Annual revenue receipts from WW (`) 0.0
Annual revenue expenditure on WW (`) 214,850.0
Annual capital expenditure on WW (`) 1,673,822.0
SOLID WASTE MANAGEMENTWaste generated (TPD) 8.0
Waste collected (TPD) 7.4
Quantity of waste treated (TPD) 7.4
Waste received at scientific landfill (TPD) 0.0
Door to door colln.(no. of households andestablishments)
4,996.0
Waste segregation at source (Y/N) N
Annual revenue receipts from SW (`) 788,540.0
Annual revenue expenditure on SW (`) 4,030,115.0
Annual capital expenditure on SW (`) 5,399,087.0
259
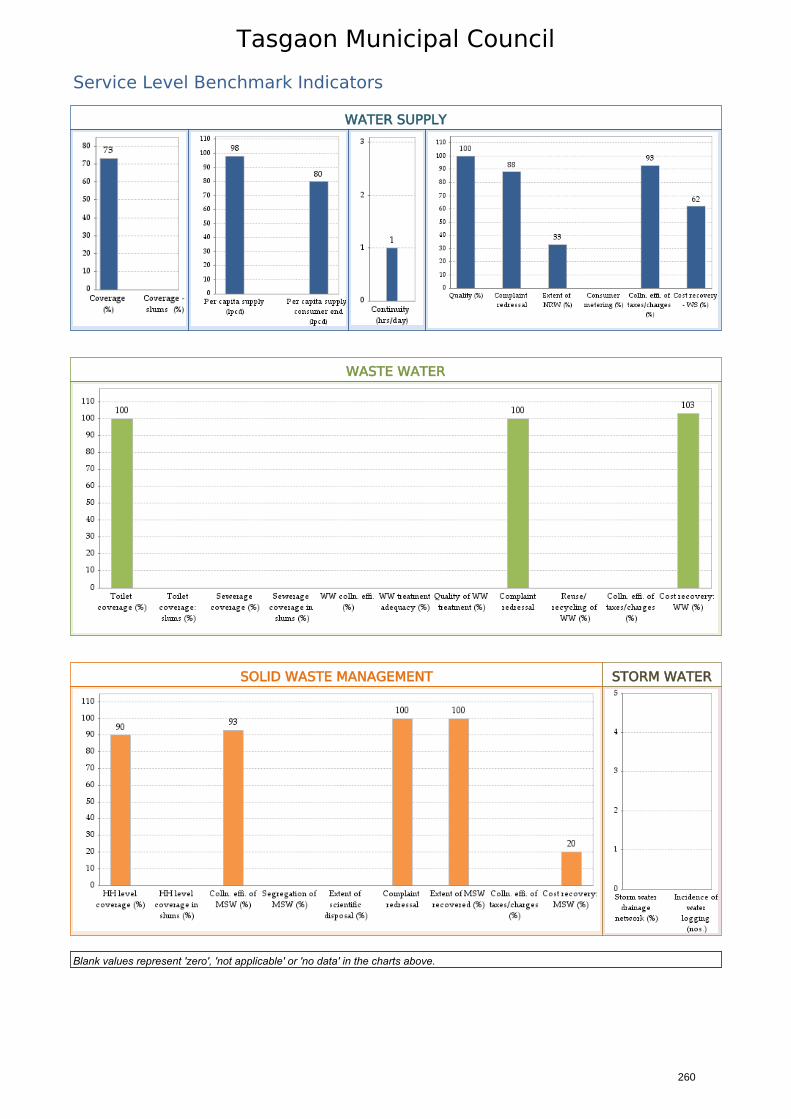
Tasgaon Municipal Council
Service Level Benchmark Indicators
WATER SUPPLY
WASTE WATER
SOLID WASTE MANAGEMENT STORM WATER
Blank values represent 'zero', 'not applicable' or 'no data' in the charts above.
260

Telhara Municipal Council Background
GENERAL INFORMATIONClass Class C No. of slum settlements 0
District Akola Slum population 0
Area (sq. km.) 21 Slum households 0
Total city population 24,430 Total annual city capital receipts (`) 0
Total households 4,500 Total annual city capital expenditure (`) 0
Density (persons per sq. km.) 1,158 Total annual city revenue receipts (`) 0
Total municipal staff 76 Total annual city revenue expenditure (`) 0
WATER SUPPLYTotal water produced (MLD) 1.6
Ground water (MLD) 1.6
Surface water (MLD) 0.0
Average daily volume treated (MLD) 0.0
Installed storage capacity (MLD) 1.1
Total water connections (nos.) 0.0
Water connections in slums (nos.) 0.0
Area covered by network (sq. km.) 1.7
No. of days of supply in a month 30.0
Annual revenue receipts from water (`) 0.0
Annual revenue expenditure on water (`) 0.0
Annual capital expenditure on water (`) 0.0
WASTE WATERArea covered by waste water network (sq. km.) 1.1
Underground sewerage network (sq. km) 0.0
Closed drains (sq. km) 0.0
Open drains (sq. km) 1.1
Total sewerage connections (nos.) 0.0
Sewerage coverage: slums (%) 0.0
Installed STP treatment capacity (MLD) 0.0
Annual revenue receipts from WW (`) 0.0
Annual revenue expenditure on WW (`) 0.0
Annual capital expenditure on WW (`) 0.0
SOLID WASTE MANAGEMENTWaste generated (TPD) 5.0
Waste collected (TPD) 4.8
Quantity of waste treated (TPD) 0.0
Waste received at scientific landfill (TPD) 0.0
Door to door colln.(no. of households andestablishments)
0.0
Waste segregation at source (Y/N) N
Annual revenue receipts from SW (`) 0.0
Annual revenue expenditure on SW (`) 0.0
Annual capital expenditure on SW (`) 0.0
261

Telhara Municipal Council
Service Level Benchmark Indicators
WATER SUPPLY
WASTE WATER
SOLID WASTE MANAGEMENT STORM WATER
Blank values represent 'zero', 'not applicable' or 'no data' in the charts above.
262

Tirora Municipal Council Background
GENERAL INFORMATIONClass Class C No. of slum settlements 4
District Gondia Slum population 5,000
Area (sq. km.) 15 Slum households 1,200
Total city population 28,161 Total annual city capital receipts (`) 52,043,000
Total households 5,587 Total annual city capital expenditure (`) 55,215,000
Density (persons per sq. km.) 1,841 Total annual city revenue receipts (`) 4,593,772
Total municipal staff 99 Total annual city revenue expenditure (`) 18,776,000
WATER SUPPLYTotal water produced (MLD) 1.7
Ground water (MLD) 0.0
Surface water (MLD) 1.7
Average daily volume treated (MLD) 1.7
Installed storage capacity (MLD) 0.8
Total water connections (nos.) 1,679.0
Water connections in slums (nos.) 0.0
Area covered by network (sq. km.) 15.0
No. of days of supply in a month 0.0
Annual revenue receipts from water (`) 0.0
Annual revenue expenditure on water (`) 0.0
Annual capital expenditure on water (`) 0.0
WASTE WATERArea covered by waste water network (sq. km.) 10.0
Underground sewerage network (sq. km) 0.0
Closed drains (sq. km) 0.0
Open drains (sq. km) 10.0
Total sewerage connections (nos.) 0.0
Sewerage coverage: slums (%) 0.0
Installed STP treatment capacity (MLD) 0.0
Annual revenue receipts from WW (`) 0.0
Annual revenue expenditure on WW (`) 0.0
Annual capital expenditure on WW (`) 0.0
SOLID WASTE MANAGEMENTWaste generated (TPD) 6.1
Waste collected (TPD) 6.0
Quantity of waste treated (TPD) 0.0
Waste received at scientific landfill (TPD) 0.0
Door to door colln.(no. of households andestablishments)
2,040.0
Waste segregation at source (Y/N) N
Annual revenue receipts from SW (`) 0.0
Annual revenue expenditure on SW (`) 0.0
Annual capital expenditure on SW (`) 2,096,000.0
263

Tirora Municipal Council
Service Level Benchmark Indicators
WATER SUPPLY
WASTE WATER
SOLID WASTE MANAGEMENT STORM WATER
Blank values represent 'zero', 'not applicable' or 'no data' in the charts above.
264

Trimbak Municipal Council Background
GENERAL INFORMATIONClass Class C No. of slum settlements 5
District Nashik Slum population 1,800
Area (sq. km.) 2 Slum households 365
Total city population 12,500 Total annual city capital receipts (`) 3,637,000
Total households 2,337 Total annual city capital expenditure (`) 4,327,000
Density (persons per sq. km.) 6,579 Total annual city revenue receipts (`) 18,913,000
Total municipal staff 47 Total annual city revenue expenditure (`) 15,153,000
WATER SUPPLYTotal water produced (MLD) 1.2
Ground water (MLD) 0.0
Surface water (MLD) 1.2
Average daily volume treated (MLD) 1.2
Installed storage capacity (MLD) 3.8
Total water connections (nos.) 1,412.0
Water connections in slums (nos.) 19.0
Area covered by network (sq. km.) 1.9
No. of days of supply in a month 30.0
Annual revenue receipts from water (`) 2,268,000.0
Annual revenue expenditure on water (`) 2,312,000.0
Annual capital expenditure on water (`) 0.0
WASTE WATERArea covered by waste water network (sq. km.) 0.5
Underground sewerage network (sq. km) 0.0
Closed drains (sq. km) 0.0
Open drains (sq. km) 0.5
Total sewerage connections (nos.) 0.0
Sewerage coverage: slums (%) 0.0
Installed STP treatment capacity (MLD) 1.2
Annual revenue receipts from WW (`) 0.0
Annual revenue expenditure on WW (`) 515,000.0
Annual capital expenditure on WW (`) 451,000.0
SOLID WASTE MANAGEMENTWaste generated (TPD) 3.0
Waste collected (TPD) 3.0
Quantity of waste treated (TPD) 0.5
Waste received at scientific landfill (TPD) 0.0
Door to door colln.(no. of households andestablishments)
2,300.0
Waste segregation at source (Y/N) N
Annual revenue receipts from SW (`) 1,465,000.0
Annual revenue expenditure on SW (`) 1,454,000.0
Annual capital expenditure on SW (`) 1,454,000.0
265

Trimbak Municipal Council
Service Level Benchmark Indicators
WATER SUPPLY
WASTE WATER
SOLID WASTE MANAGEMENT STORM WATER
Blank values represent 'zero', 'not applicable' or 'no data' in the charts above.
266

Tuljapur Municipal Council Background
GENERAL INFORMATIONClass Class C No. of slum settlements 6
District Osmanabad Slum population 14,505
Area (sq. km.) 4 Slum households 2,419
Total city population 34,876 Total annual city capital receipts (`) 99,017,571
Total households 6,975 Total annual city capital expenditure (`) 34,438,851
Density (persons per sq. km.) 8,304 Total annual city revenue receipts (`) 104,068,565
Total municipal staff 175 Total annual city revenue expenditure (`) 21,583,144
WATER SUPPLYTotal water produced (MLD) 3.8
Ground water (MLD) 0.1
Surface water (MLD) 3.7
Average daily volume treated (MLD) 3.9
Installed storage capacity (MLD) 1.7
Total water connections (nos.) 3,932.0
Water connections in slums (nos.) 1,107.0
Area covered by network (sq. km.) 3.1
No. of days of supply in a month 30.0
Annual revenue receipts from water (`) 3,228,817.0
Annual revenue expenditure on water (`) 6,569,965.0
Annual capital expenditure on water (`) 2,679,020.0
WASTE WATERArea covered by waste water network (sq. km.) 4.2
Underground sewerage network (sq. km) 0.0
Closed drains (sq. km) 0.0
Open drains (sq. km) 4.2
Total sewerage connections (nos.) 0.0
Sewerage coverage: slums (%) 0.0
Installed STP treatment capacity (MLD) 0.0
Annual revenue receipts from WW (`) 0.0
Annual revenue expenditure on WW (`) 0.0
Annual capital expenditure on WW (`) 691,189.0
SOLID WASTE MANAGEMENTWaste generated (TPD) 19.0
Waste collected (TPD) 18.4
Quantity of waste treated (TPD) 0.0
Waste received at scientific landfill (TPD) 0.0
Door to door colln.(no. of households andestablishments)
400.0
Waste segregation at source (Y/N) N
Annual revenue receipts from SW (`) 0.0
Annual revenue expenditure on SW (`) 8,012,470.0
Annual capital expenditure on SW (`) 6,571,956.0
267

Tuljapur Municipal Council
Service Level Benchmark Indicators
WATER SUPPLY
WASTE WATER
SOLID WASTE MANAGEMENT STORM WATER
Blank values represent 'zero', 'not applicable' or 'no data' in the charts above.
268

Umari Municipal Council Background
GENERAL INFORMATIONClass Class C No. of slum settlements 0
District Nanded Slum population 0
Area (sq. km.) 6 Slum households 0
Total city population 20,500 Total annual city capital receipts (`) 2,245,000
Total households 4,228 Total annual city capital expenditure (`) 4,621,000
Density (persons per sq. km.) 3,596 Total annual city revenue receipts (`) 21,347,000
Total municipal staff 61 Total annual city revenue expenditure (`) 8,959,675
WATER SUPPLYTotal water produced (MLD) 0.7
Ground water (MLD) 0.2
Surface water (MLD) 0.5
Average daily volume treated (MLD) 0.5
Installed storage capacity (MLD) 0.7
Total water connections (nos.) 1,373.0
Water connections in slums (nos.) 0.0
Area covered by network (sq. km.) 5.7
No. of days of supply in a month 0.0
Annual revenue receipts from water (`) 0.0
Annual revenue expenditure on water (`) 0.0
Annual capital expenditure on water (`) 0.0
WASTE WATERArea covered by waste water network (sq. km.) 5.0
Underground sewerage network (sq. km) 0.0
Closed drains (sq. km) 0.0
Open drains (sq. km) 5.0
Total sewerage connections (nos.) 0.0
Sewerage coverage: slums (%) 0.0
Installed STP treatment capacity (MLD) 0.0
Annual revenue receipts from WW (`) 0.0
Annual revenue expenditure on WW (`) 0.0
Annual capital expenditure on WW (`) 0.0
SOLID WASTE MANAGEMENTWaste generated (TPD) 10.0
Waste collected (TPD) 10.0
Quantity of waste treated (TPD) 0.0
Waste received at scientific landfill (TPD) 0.0
Door to door colln.(no. of households andestablishments)
2,120.0
Waste segregation at source (Y/N) N
Annual revenue receipts from SW (`) 0.0
Annual revenue expenditure on SW (`) 0.0
Annual capital expenditure on SW (`) 0.0
269

Umari Municipal Council
Service Level Benchmark Indicators
WATER SUPPLY
WASTE WATER
SOLID WASTE MANAGEMENT STORM WATER
Blank values represent 'zero', 'not applicable' or 'no data' in the charts above.
270

Umarkhed Municipal Council Background
GENERAL INFORMATIONClass Class C No. of slum settlements 5
District Yavatmal Slum population 5,179
Area (sq. km.) 2 Slum households 1,028
Total city population 42,054 Total annual city capital receipts (`) 41,104,176
Total households 8,615 Total annual city capital expenditure (`) 36,695,669
Density (persons per sq. km.) 23,363 Total annual city revenue receipts (`) 232,893,597
Total municipal staff 231 Total annual city revenue expenditure (`) 96,468,437
WATER SUPPLYTotal water produced (MLD) 2.4
Ground water (MLD) 0.6
Surface water (MLD) 1.8
Average daily volume treated (MLD) 1.8
Installed storage capacity (MLD) 1.8
Total water connections (nos.) 4,367.0
Water connections in slums (nos.) 565.0
Area covered by network (sq. km.) 1.8
No. of days of supply in a month 15.0
Annual revenue receipts from water (`) 4,491,000.0
Annual revenue expenditure on water (`) 9,580,000.0
Annual capital expenditure on water (`) 5,760,000.0
WASTE WATERArea covered by waste water network (sq. km.) 1.3
Underground sewerage network (sq. km) 0.0
Closed drains (sq. km) 0.0
Open drains (sq. km) 1.3
Total sewerage connections (nos.) 0.0
Sewerage coverage: slums (%) 0.0
Installed STP treatment capacity (MLD) 0.0
Annual revenue receipts from WW (`) 0.0
Annual revenue expenditure on WW (`) 4,800,000.0
Annual capital expenditure on WW (`) 1,555,000.0
SOLID WASTE MANAGEMENTWaste generated (TPD) 12.5
Waste collected (TPD) 12.5
Quantity of waste treated (TPD) 0.0
Waste received at scientific landfill (TPD) 0.0
Door to door colln.(no. of households andestablishments)
5,457.0
Waste segregation at source (Y/N) N
Annual revenue receipts from SW (`) 2,773,908.0
Annual revenue expenditure on SW (`) 4,600,000.0
Annual capital expenditure on SW (`) 1,755,202.0
271

Umarkhed Municipal Council
Service Level Benchmark Indicators
WATER SUPPLY
WASTE WATER
SOLID WASTE MANAGEMENT STORM WATER
Blank values represent 'zero', 'not applicable' or 'no data' in the charts above.
272

Umerga Municipal Council Background
GENERAL INFORMATIONClass Class C No. of slum settlements 0
District Osmanabad Slum population 0
Area (sq. km.) 2 Slum households 0
Total city population 40,000 Total annual city capital receipts (`) 96,499,982
Total households 6,790 Total annual city capital expenditure (`) 52,466,472
Density (persons per sq. km.) 18,182 Total annual city revenue receipts (`) 130,749,555
Total municipal staff 261 Total annual city revenue expenditure (`) 72,647,658
WATER SUPPLYTotal water produced (MLD) 2.3
Ground water (MLD) 0.0
Surface water (MLD) 2.3
Average daily volume treated (MLD) 4.2
Installed storage capacity (MLD) 1.7
Total water connections (nos.) 5,793.0
Water connections in slums (nos.) 0.0
Area covered by network (sq. km.) 2.0
No. of days of supply in a month 30.0
Annual revenue receipts from water (`) 7,083,798.0
Annual revenue expenditure on water (`) 7,525,078.0
Annual capital expenditure on water (`) 0.0
WASTE WATERArea covered by waste water network (sq. km.) 1.9
Underground sewerage network (sq. km) 0.0
Closed drains (sq. km) 0.0
Open drains (sq. km) 1.9
Total sewerage connections (nos.) 0.0
Sewerage coverage: slums (%) 0.0
Installed STP treatment capacity (MLD) 0.0
Annual revenue receipts from WW (`) 0.0
Annual revenue expenditure on WW (`) 597,315.0
Annual capital expenditure on WW (`) 0.0
SOLID WASTE MANAGEMENTWaste generated (TPD) 13.0
Waste collected (TPD) 13.0
Quantity of waste treated (TPD) 0.0
Waste received at scientific landfill (TPD) 0.0
Door to door colln.(no. of households andestablishments)
5,170.0
Waste segregation at source (Y/N) N
Annual revenue receipts from SW (`) 251,912.0
Annual revenue expenditure on SW (`) 10,285,328.0
Annual capital expenditure on SW (`) 544,500.0
273

Umerga Municipal Council
Service Level Benchmark Indicators
WATER SUPPLY
WASTE WATER
SOLID WASTE MANAGEMENT STORM WATER
Blank values represent 'zero', 'not applicable' or 'no data' in the charts above.
274

Uran Municipal Council Background
GENERAL INFORMATIONClass Class C No. of slum settlements 3
District Raigad Slum population 768
Area (sq. km.) 2 Slum households 192
Total city population 28,987 Total annual city capital receipts (`) 52,886,850
Total households 8,525 Total annual city capital expenditure (`) 338,157
Density (persons per sq. km.) 12,603 Total annual city revenue receipts (`) 76,936,744
Total municipal staff 188 Total annual city revenue expenditure (`) 74,606,175
WATER SUPPLYTotal water produced (MLD) 3.5
Ground water (MLD) 0.0
Surface water (MLD) 3.5
Average daily volume treated (MLD) 0.0
Installed storage capacity (MLD) 4.0
Total water connections (nos.) 4,108.0
Water connections in slums (nos.) 52.0
Area covered by network (sq. km.) 2.3
No. of days of supply in a month 30.0
Annual revenue receipts from water (`) 16,388,482.0
Annual revenue expenditure on water (`) 14,279,387.0
Annual capital expenditure on water (`) 3,009,430.0
WASTE WATERArea covered by waste water network (sq. km.) 2.0
Underground sewerage network (sq. km) 0.0
Closed drains (sq. km) 0.0
Open drains (sq. km) 2.0
Total sewerage connections (nos.) 0.0
Sewerage coverage: slums (%) 0.0
Installed STP treatment capacity (MLD) 0.0
Annual revenue receipts from WW (`) 136,460.0
Annual revenue expenditure on WW (`) 15,104,950.0
Annual capital expenditure on WW (`) 1,069,984.0
SOLID WASTE MANAGEMENTWaste generated (TPD) 8.1
Waste collected (TPD) 8.0
Quantity of waste treated (TPD) 0.0
Waste received at scientific landfill (TPD) 0.0
Door to door colln.(no. of households andestablishments)
9,848.0
Waste segregation at source (Y/N) N
Annual revenue receipts from SW (`) 0.0
Annual revenue expenditure on SW (`) 2,770,524.0
Annual capital expenditure on SW (`) 0.0
275

Uran Municipal Council
Service Level Benchmark Indicators
WATER SUPPLY
WASTE WATER
SOLID WASTE MANAGEMENT STORM WATER
Blank values represent 'zero', 'not applicable' or 'no data' in the charts above.
276

Vadgaon Kasba Municipal Council Background
GENERAL INFORMATIONClass Class C No. of slum settlements 0
District Kolhapur Slum population 0
Area (sq. km.) 10 Slum households 0
Total city population 30,000 Total annual city capital receipts (`) 14,784,562
Total households 5,921 Total annual city capital expenditure (`) 14,214,614
Density (persons per sq. km.) 3,000 Total annual city revenue receipts (`) 28,897,049
Total municipal staff 91 Total annual city revenue expenditure (`) 27,008,252
WATER SUPPLYTotal water produced (MLD) 2.1
Ground water (MLD) 0.1
Surface water (MLD) 2.0
Average daily volume treated (MLD) 1.9
Installed storage capacity (MLD) 1.5
Total water connections (nos.) 3,639.0
Water connections in slums (nos.) 0.0
Area covered by network (sq. km.) 7.4
No. of days of supply in a month 26.0
Annual revenue receipts from water (`) 1,639,968.0
Annual revenue expenditure on water (`) 3,351,605.0
Annual capital expenditure on water (`) 4,238,005.0
WASTE WATERArea covered by waste water network (sq. km.) 1.3
Underground sewerage network (sq. km) 0.0
Closed drains (sq. km) 0.0
Open drains (sq. km) 1.3
Total sewerage connections (nos.) 0.0
Sewerage coverage: slums (%) 0.0
Installed STP treatment capacity (MLD) 0.0
Annual revenue receipts from WW (`) 93,487.0
Annual revenue expenditure on WW (`) 1,211,895.0
Annual capital expenditure on WW (`) 918,558.0
SOLID WASTE MANAGEMENTWaste generated (TPD) 6.9
Waste collected (TPD) 6.9
Quantity of waste treated (TPD) 0.0
Waste received at scientific landfill (TPD) 0.0
Door to door colln.(no. of households andestablishments)
3,310.0
Waste segregation at source (Y/N) N
Annual revenue receipts from SW (`) 0.0
Annual revenue expenditure on SW (`) 5,125,605.0
Annual capital expenditure on SW (`) 0.0
277

Vadgaon Kasba Municipal Council
Service Level Benchmark Indicators
WATER SUPPLY
WASTE WATER
SOLID WASTE MANAGEMENT STORM WATER
Blank values represent 'zero', 'not applicable' or 'no data' in the charts above.
278

Vaijapur Municipal Council Background
GENERAL INFORMATIONClass Class C No. of slum settlements 6
District Aurangabad Slum population 4,110
Area (sq. km.) 11 Slum households 729
Total city population 43,032 Total annual city capital receipts (`) 31,037,468
Total households 7,825 Total annual city capital expenditure (`) 31,269,572
Density (persons per sq. km.) 4,060 Total annual city revenue receipts (`) 41,872,207
Total municipal staff 230 Total annual city revenue expenditure (`) 72,004,468
WATER SUPPLYTotal water produced (MLD) 7.6
Ground water (MLD) 0.5
Surface water (MLD) 7.1
Average daily volume treated (MLD) 4.2
Installed storage capacity (MLD) 17.0
Total water connections (nos.) 6,395.0
Water connections in slums (nos.) 0.0
Area covered by network (sq. km.) 8.2
No. of days of supply in a month 15.0
Annual revenue receipts from water (`) 4,304,052.0
Annual revenue expenditure on water (`) 9,403,354.0
Annual capital expenditure on water (`) 692,136.0
WASTE WATERArea covered by waste water network (sq. km.) 6.5
Underground sewerage network (sq. km) 0.0
Closed drains (sq. km) 0.0
Open drains (sq. km) 6.5
Total sewerage connections (nos.) 0.0
Sewerage coverage: slums (%) 0.0
Installed STP treatment capacity (MLD) 0.0
Annual revenue receipts from WW (`) 0.0
Annual revenue expenditure on WW (`) 3,053,383.0
Annual capital expenditure on WW (`) 1,400,758.0
SOLID WASTE MANAGEMENTWaste generated (TPD) 7.0
Waste collected (TPD) 6.5
Quantity of waste treated (TPD) 0.0
Waste received at scientific landfill (TPD) 0.0
Door to door colln.(no. of households andestablishments)
8,878.0
Waste segregation at source (Y/N) N
Annual revenue receipts from SW (`) 1,249,368.0
Annual revenue expenditure on SW (`) 0.0
Annual capital expenditure on SW (`) 0.0
279

Vaijapur Municipal Council
Service Level Benchmark Indicators
WATER SUPPLY
WASTE WATER
SOLID WASTE MANAGEMENT STORM WATER
Blank values represent 'zero', 'not applicable' or 'no data' in the charts above.
280

Vengurla Municipal Council Background
GENERAL INFORMATIONClass Class C No. of slum settlements 0
District Sindhudurg Slum population 0
Area (sq. km.) 13 Slum households 0
Total city population 12,645 Total annual city capital receipts (`) 62
Total households 3,011 Total annual city capital expenditure (`) 144
Density (persons per sq. km.) 973 Total annual city revenue receipts (`) 116
Total municipal staff 61 Total annual city revenue expenditure (`) 124
WATER SUPPLYTotal water produced (MLD) 0.9
Ground water (MLD) 0.1
Surface water (MLD) 0.8
Average daily volume treated (MLD) 0.8
Installed storage capacity (MLD) 0.9
Total water connections (nos.) 884.0
Water connections in slums (nos.) 0.0
Area covered by network (sq. km.) 13.0
No. of days of supply in a month 27.0
Annual revenue receipts from water (`) 10.5
Annual revenue expenditure on water (`) 7.5
Annual capital expenditure on water (`) 0.0
WASTE WATERArea covered by waste water network (sq. km.) 13.0
Underground sewerage network (sq. km) 0.0
Closed drains (sq. km) 3.0
Open drains (sq. km) 10.0
Total sewerage connections (nos.) 0.0
Sewerage coverage: slums (%) 0.0
Installed STP treatment capacity (MLD) 0.0
Annual revenue receipts from WW (`) 0.1
Annual revenue expenditure on WW (`) 10.2
Annual capital expenditure on WW (`) 0.0
SOLID WASTE MANAGEMENTWaste generated (TPD) 6.0
Waste collected (TPD) 6.0
Quantity of waste treated (TPD) 0.0
Waste received at scientific landfill (TPD) 0.0
Door to door colln.(no. of households andestablishments)
3,350.0
Waste segregation at source (Y/N) N
Annual revenue receipts from SW (`) 9.4
Annual revenue expenditure on SW (`) 3.9
Annual capital expenditure on SW (`) 17.0
281
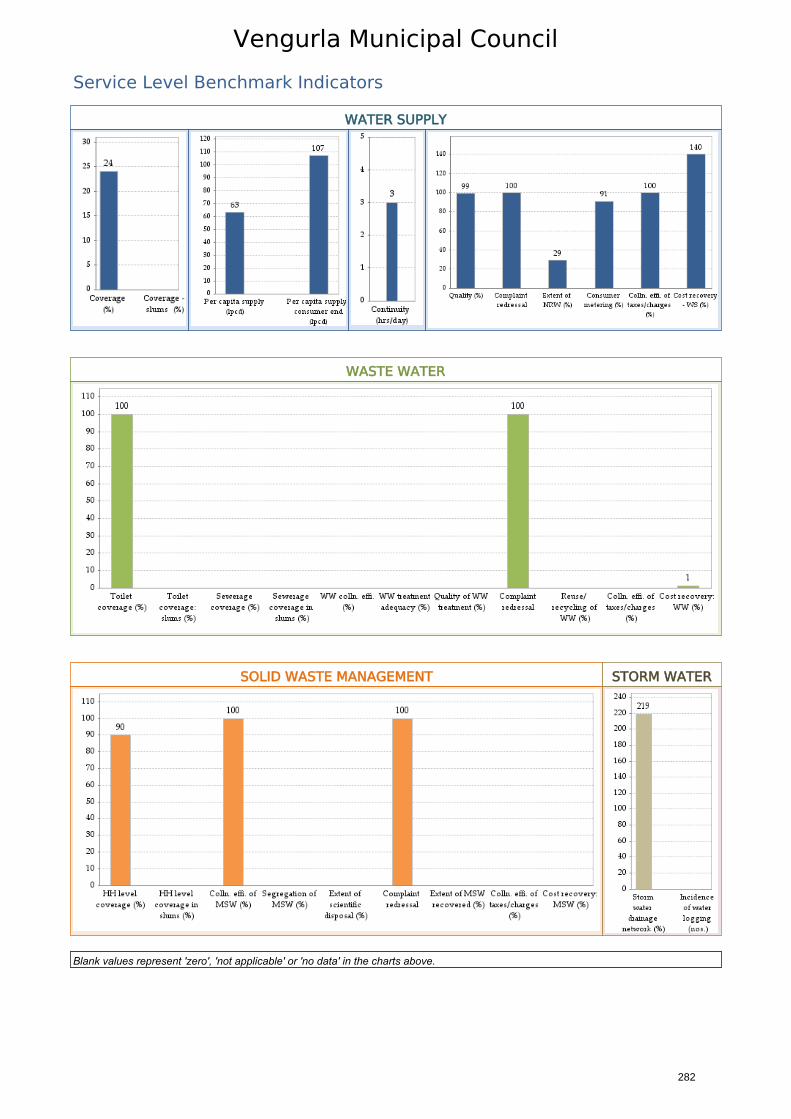
Vengurla Municipal Council
Service Level Benchmark Indicators
WATER SUPPLY
WASTE WATER
SOLID WASTE MANAGEMENT STORM WATER
Blank values represent 'zero', 'not applicable' or 'no data' in the charts above.
282

Wai Municipal Council Background
GENERAL INFORMATIONClass Class C No. of slum settlements 4
District Satara Slum population 1,500
Area (sq. km.) 4 Slum households 342
Total city population 36,110 Total annual city capital receipts (`) 73,236,096
Total households 7,200 Total annual city capital expenditure (`) 14,622,388
Density (persons per sq. km.) 10,031 Total annual city revenue receipts (`) 73,236,096
Total municipal staff 130 Total annual city revenue expenditure (`) 102,294,178
WATER SUPPLYTotal water produced (MLD) 4.8
Ground water (MLD) 0.0
Surface water (MLD) 4.8
Average daily volume treated (MLD) 4.8
Installed storage capacity (MLD) 1.7
Total water connections (nos.) 5,358.0
Water connections in slums (nos.) 18.0
Area covered by network (sq. km.) 3.6
No. of days of supply in a month 30.0
Annual revenue receipts from water (`) 4,946,120.0
Annual revenue expenditure on water (`) 7,924,151.0
Annual capital expenditure on water (`) 4,740,665.0
WASTE WATERArea covered by waste water network (sq. km.) 3.6
Underground sewerage network (sq. km) 0.0
Closed drains (sq. km) 0.0
Open drains (sq. km) 3.6
Total sewerage connections (nos.) 0.0
Sewerage coverage: slums (%) 0.0
Installed STP treatment capacity (MLD) 0.0
Annual revenue receipts from WW (`) 0.0
Annual revenue expenditure on WW (`) 0.0
Annual capital expenditure on WW (`) 0.0
SOLID WASTE MANAGEMENTWaste generated (TPD) 12.0
Waste collected (TPD) 12.0
Quantity of waste treated (TPD) 0.0
Waste received at scientific landfill (TPD) 0.0
Door to door colln.(no. of households andestablishments)
7,194.0
Waste segregation at source (Y/N) N
Annual revenue receipts from SW (`) 0.0
Annual revenue expenditure on SW (`) 0.0
Annual capital expenditure on SW (`) 558,000.0
283

Wai Municipal Council
Service Level Benchmark Indicators
WATER SUPPLY
WASTE WATER
SOLID WASTE MANAGEMENT STORM WATER
Blank values represent 'zero', 'not applicable' or 'no data' in the charts above.
284

Warud Municipal Council Background
GENERAL INFORMATIONClass Class C No. of slum settlements 0
District Amravati Slum population 0
Area (sq. km.) 13 Slum households 0
Total city population 45,106 Total annual city capital receipts (`) 18,425,000
Total households 9,021 Total annual city capital expenditure (`) 15,991,000
Density (persons per sq. km.) 3,580 Total annual city revenue receipts (`) 61,376,000
Total municipal staff 150 Total annual city revenue expenditure (`) 57,213,000
WATER SUPPLYTotal water produced (MLD) 2.1
Ground water (MLD) 0.0
Surface water (MLD) 2.1
Average daily volume treated (MLD) 2.1
Installed storage capacity (MLD) 1.4
Total water connections (nos.) 5,035.0
Water connections in slums (nos.) 0.0
Area covered by network (sq. km.) 12.3
No. of days of supply in a month 15.0
Annual revenue receipts from water (`) 6,601,000.0
Annual revenue expenditure on water (`) 8,040,000.0
Annual capital expenditure on water (`) 8,040,000.0
WASTE WATERArea covered by waste water network (sq. km.) 11.0
Underground sewerage network (sq. km) 0.0
Closed drains (sq. km) 0.0
Open drains (sq. km) 11.0
Total sewerage connections (nos.) 0.0
Sewerage coverage: slums (%) 0.0
Installed STP treatment capacity (MLD) 0.0
Annual revenue receipts from WW (`) 0.0
Annual revenue expenditure on WW (`) 0.0
Annual capital expenditure on WW (`) 0.0
SOLID WASTE MANAGEMENTWaste generated (TPD) 18.0
Waste collected (TPD) 18.0
Quantity of waste treated (TPD) 0.0
Waste received at scientific landfill (TPD) 0.0
Door to door colln.(no. of households andestablishments)
9,821.0
Waste segregation at source (Y/N) N
Annual revenue receipts from SW (`) 402,000.0
Annual revenue expenditure on SW (`) 1,210,000.0
Annual capital expenditure on SW (`) 1,209,000.0
285

Warud Municipal Council
Service Level Benchmark Indicators
WATER SUPPLY
WASTE WATER
SOLID WASTE MANAGEMENT STORM WATER
Blank values represent 'zero', 'not applicable' or 'no data' in the charts above.
286
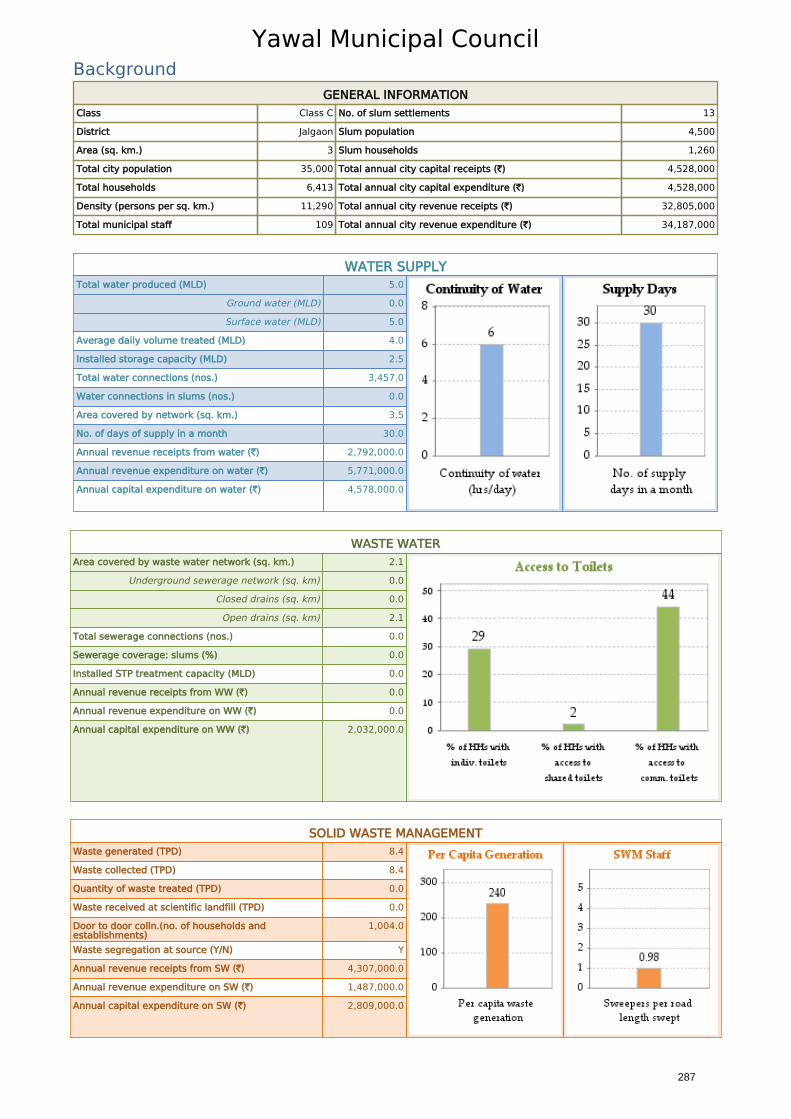
Yawal Municipal Council Background
GENERAL INFORMATIONClass Class C No. of slum settlements 13
District Jalgaon Slum population 4,500
Area (sq. km.) 3 Slum households 1,260
Total city population 35,000 Total annual city capital receipts (`) 4,528,000
Total households 6,413 Total annual city capital expenditure (`) 4,528,000
Density (persons per sq. km.) 11,290 Total annual city revenue receipts (`) 32,805,000
Total municipal staff 109 Total annual city revenue expenditure (`) 34,187,000
WATER SUPPLYTotal water produced (MLD) 5.0
Ground water (MLD) 0.0
Surface water (MLD) 5.0
Average daily volume treated (MLD) 4.0
Installed storage capacity (MLD) 2.5
Total water connections (nos.) 3,457.0
Water connections in slums (nos.) 0.0
Area covered by network (sq. km.) 3.5
No. of days of supply in a month 30.0
Annual revenue receipts from water (`) 2,792,000.0
Annual revenue expenditure on water (`) 5,771,000.0
Annual capital expenditure on water (`) 4,578,000.0
WASTE WATERArea covered by waste water network (sq. km.) 2.1
Underground sewerage network (sq. km) 0.0
Closed drains (sq. km) 0.0
Open drains (sq. km) 2.1
Total sewerage connections (nos.) 0.0
Sewerage coverage: slums (%) 0.0
Installed STP treatment capacity (MLD) 0.0
Annual revenue receipts from WW (`) 0.0
Annual revenue expenditure on WW (`) 0.0
Annual capital expenditure on WW (`) 2,032,000.0
SOLID WASTE MANAGEMENTWaste generated (TPD) 8.4
Waste collected (TPD) 8.4
Quantity of waste treated (TPD) 0.0
Waste received at scientific landfill (TPD) 0.0
Door to door colln.(no. of households andestablishments)
1,004.0
Waste segregation at source (Y/N) Y
Annual revenue receipts from SW (`) 4,307,000.0
Annual revenue expenditure on SW (`) 1,487,000.0
Annual capital expenditure on SW (`) 2,809,000.0
287

Yawal Municipal Council
Service Level Benchmark Indicators
WATER SUPPLY
WASTE WATER
SOLID WASTE MANAGEMENT STORM WATER
Blank values represent 'zero', 'not applicable' or 'no data' in the charts above.
288

Yevla Municipal Council Background
GENERAL INFORMATIONClass Class C No. of slum settlements 0
District Nashik Slum population 0
Area (sq. km.) 13 Slum households 0
Total city population 49,896 Total annual city capital receipts (`) 0
Total households 8,591 Total annual city capital expenditure (`) 0
Density (persons per sq. km.) 3,898 Total annual city revenue receipts (`) 0
Total municipal staff 254 Total annual city revenue expenditure (`) 0
WATER SUPPLYTotal water produced (MLD) 4.0
Ground water (MLD) 0.0
Surface water (MLD) 4.0
Average daily volume treated (MLD) 4.8
Installed storage capacity (MLD) 1.9
Total water connections (nos.) 6,568.0
Water connections in slums (nos.) 0.0
Area covered by network (sq. km.) 0.0
No. of days of supply in a month 0.0
Annual revenue receipts from water (`) 0.0
Annual revenue expenditure on water (`) 0.0
Annual capital expenditure on water (`) 0.0
WASTE WATERArea covered by waste water network (sq. km.) 36.4
Underground sewerage network (sq. km) 0.0
Closed drains (sq. km) 0.0
Open drains (sq. km) 36.4
Total sewerage connections (nos.) 0.0
Sewerage coverage: slums (%) 0.0
Installed STP treatment capacity (MLD) 0.0
Annual revenue receipts from WW (`) 0.0
Annual revenue expenditure on WW (`) 0.0
Annual capital expenditure on WW (`) 0.0
SOLID WASTE MANAGEMENTWaste generated (TPD) 12.0
Waste collected (TPD) 12.0
Quantity of waste treated (TPD) 0.0
Waste received at scientific landfill (TPD) 0.0
Door to door colln.(no. of households andestablishments)
1,170.0
Waste segregation at source (Y/N) N
Annual revenue receipts from SW (`) 0.0
Annual revenue expenditure on SW (`) 0.0
Annual capital expenditure on SW (`) 0.0
289

Yevla Municipal Council
Service Level Benchmark Indicators
WATER SUPPLY
WASTE WATER
SOLID WASTE MANAGEMENT STORM WATER
Blank values represent 'zero', 'not applicable' or 'no data' in the charts above.
290

Th
Th
im
thr
pe
M
CE
Pr
Ce
M
PA
CE
Ka
In
Te
Fa
ww
he Perfor
he PAS Pr
mprove del
ree majo
erformance
aharashtra
EPT Unive
roject. It i
entre (UM
aharashtra
AS Proje
EPT Unive
asturbhai
ndia
el: +91‐79‐2
ax: 91‐79‐26
ww.pas.or
rmance A
roject aim
livery of w
or compo
e improve
a.
ersity has
is being i
MC) in Gu
a.
ect
ersity
Lalbhai C
26302470
6302075
rg.in
Assessme
ms to deve
water and s
nents of
ement. It
received a
mplement
ujarat and
Campus, U
ent System
elop appr
sanitation
perform
covers all
a grant fro
ted by CE
d All Ind
University
m (PAS)
opriate m
in cities a
mance me
l the 400+
m the Bill
EPT Unive
dia Institu
Road, Na
Project
methods an
and towns
asuremen
+ urban l
l and Meli
ersity wit
ute of Lo
avrangpura
nd tools t
in India. T
t, perform
ocal gove
inda Gates
th support
ocal Self‐G
a, Ahmed
to measur
The PAS P
mance m
rnments i
s Foundati
t of Urba
Governme
abad 380
e, monito
Project inc
monitoring
in Gujara
ion for the
n Manage
ent (AIILSG
009 Gujar
r and
cludes
and
at and
e PAS
ement
G) in
rat,