Embed Size (px)
Citation preview
(CE0) DC PUBLIC LIBRARY
25 - CE0
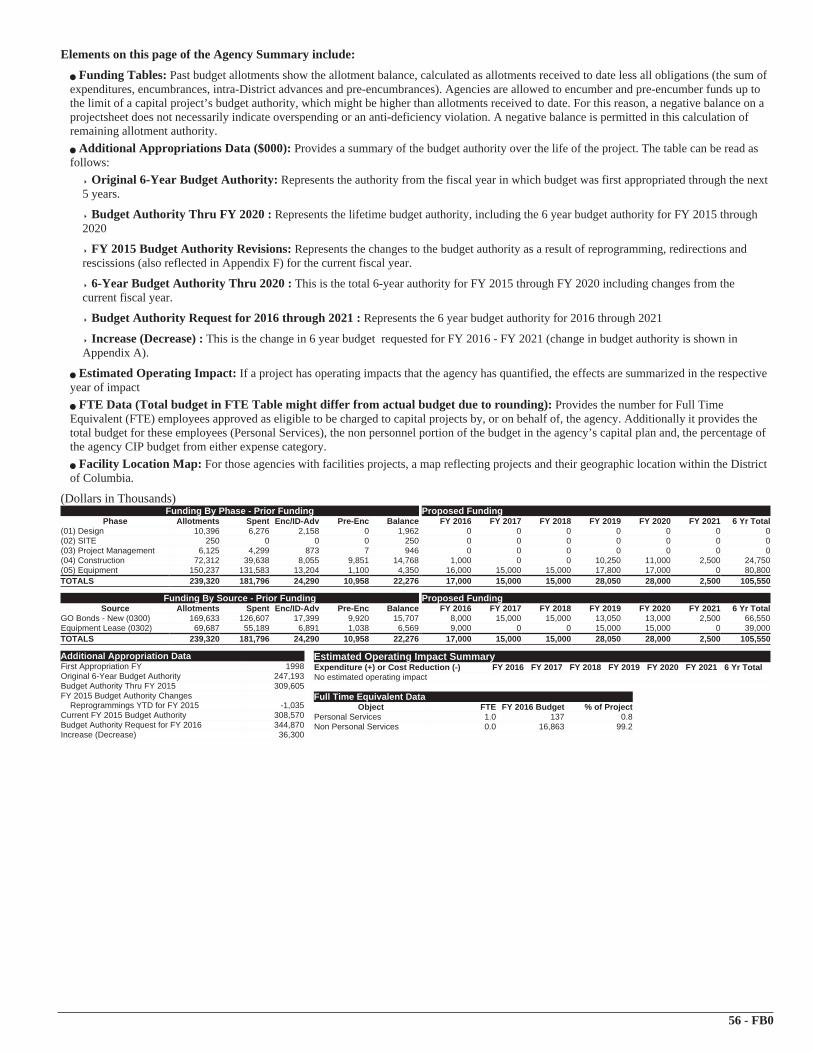
Elements on this page of the Agency Summary include:
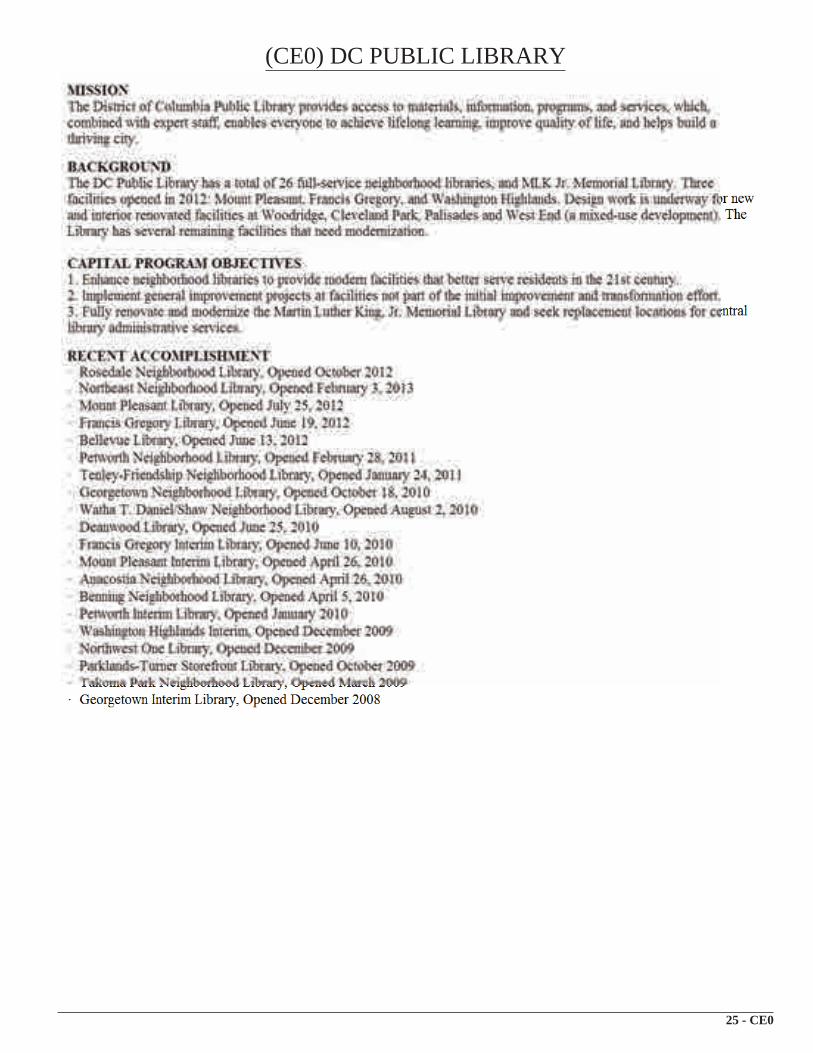
Funding Tables: Past budget allotments show the allotment balance, calculated as allotments received to date less all obligations (the sum of expenditures, encumbrances, intra-District advances and pre-encumbrances). Agencies are allowed to encumber and pre-encumber funds up to the limit of a capital project’s budget authority, which might be higher than allotments received to date. For this reason, a negative balance on a projectsheet does not necessarily indicate overspending or an anti-deficiency violation. A negative balance is permitted in this calculation of remaining allotment authority. Additional Appropriations Data ($000): Provides a summary of the budget authority over the life of the project. The table can be read as
follows: Original 6-Year Budget Authority: Represents the authority from the fiscal year in which budget was first appropriated through the next
5 years.
Budget Authority Thru FY 2020 : Represents the lifetime budget authority, including the 6 year budget authority for FY 2015 through 2020
FY 2015 Budget Authority Revisions: Represents the changes to the budget authority as a result of reprogramming, redirections and rescissions (also reflected in Appendix F) for the current fiscal year.
6-Year Budget Authority Thru 2020 : This is the total 6-year authority for FY 2015 through FY 2020 including changes from the current fiscal year.
Budget Authority Request for 2016 through 2021 : Represents the 6 year budget authority for 2016 through 2021
Increase (Decrease) : This is the change in 6 year budget requested for FY 2016 - FY 2021 (change in budget authority is shown in Appendix A).
Estimated Operating Impact: If a project has operating impacts that the agency has quantified, the effects are summarized in the respective year of impact FTE Data (Total budget in FTE Table might differ from actual budget due to rounding): Provides the number for Full Time
Equivalent (FTE) employees approved as eligible to be charged to capital projects by, or on behalf of, the agency. Additionally it provides the total budget for these employees (Personal Services), the non personnel portion of the budget in the agency’s capital plan and, the percentage of the agency CIP budget from either expense category. Facility Location Map: For those agencies with facilities projects, a map reflecting projects and their geographic location within the District
of Columbia.
(Dollars in Thousands)Funding By Phase - Prior Funding Proposed Funding
Phase Allotments Spent Enc/ID-Adv Pre-Enc Balance FY 2016 FY 2017 FY 2018 FY 2019 FY 2020 FY 2021 6 Yr Total(01) Design 41,241 26,952 442 1,338 12,508 144 0 0 0 0 0 144(02) SITE 3,091 1,562 107 0 1,422 445 0 0 0 0 0 445(03) Project Management 40,409 26,727 1,809 90 11,782 1,909 2,250 13,000 2,750 0 0 19,909(04) Construction 154,289 139,347 6,840 2,188 5,915 18,597 42,200 62,000 68,250 35,500 16,400 242,947(05) Equipment 11,925 10,175 128 1 1,620 0 0 0 0 0 0 0TOTALS 250,954 204,763 9,326 3,617 33,248 21,095 44,450 75,000 71,000 35,500 16,400 263,445
Funding By Source - Prior Funding Proposed FundingSource Allotments Spent Enc/ID-Adv Pre-Enc Balance FY 2016 FY 2017 FY 2018 FY 2019 FY 2020 FY 2021 6 Yr Total
GO Bonds - New (0300) 206,884 160,761 9,289 3,616 33,217 21,095 44,450 75,000 71,000 35,500 16,400 263,445Pay Go (0301) 3,729 3,729 0 0 0 0 0 0 0 0 0 0Capital Fund - Federal Payment (0355) 16,000 15,958 11 1 30 0 0 0 0 0 0 0
Capital (9000) 24,341 24,315 26 0 0 0 0 0 0 0 0 0TOTALS 250,954 204,763 9,326 3,617 33,248 21,095 44,450 75,000 71,000 35,500 16,400 263,445
Additional Appropriation DataFirst Appropriation FY 1999Original 6-Year Budget Authority 240,044Budget Authority Thru FY 2015 502,714FY 2015 Budget Authority Changes
Reprogrammings YTD for FY 2015 -214Current FY 2015 Budget Authority 502,499Budget Authority Request for FY 2016 514,399Increase (Decrease) 11,900
Estimated Operating Impact SummaryExpenditure (+) or Cost Reduction (-) FY 2016 FY 2017 FY 2018 FY 2019 FY 2020 FY 2021 6 Year
TotalPersonnel Services 0 1,695 1,695 3,485 5,600 1,695 14,170Materials/Supplies 0 450 450 650 1,125 450 3,125Fixed Costs 0 230 230 468 950 230 2,108Contractual Services 190 450 450 690 1,020 450 3,250IT 10 62 0 54 155 0 281Equipment 10 62 0 54 155 0 281TOTAL 210 2,950 2,825 5,400 9,005 2,825 23,215
Full Time Equivalent DataObject FTE FY 2016 Budget % of Project
Personal Services 3.6 479 2.3Non Personal Services 0.0 20,616 97.7
26 - CE0
76
2
1
8
5
3
4
5
3
1
4
2
6
66
395 695
295
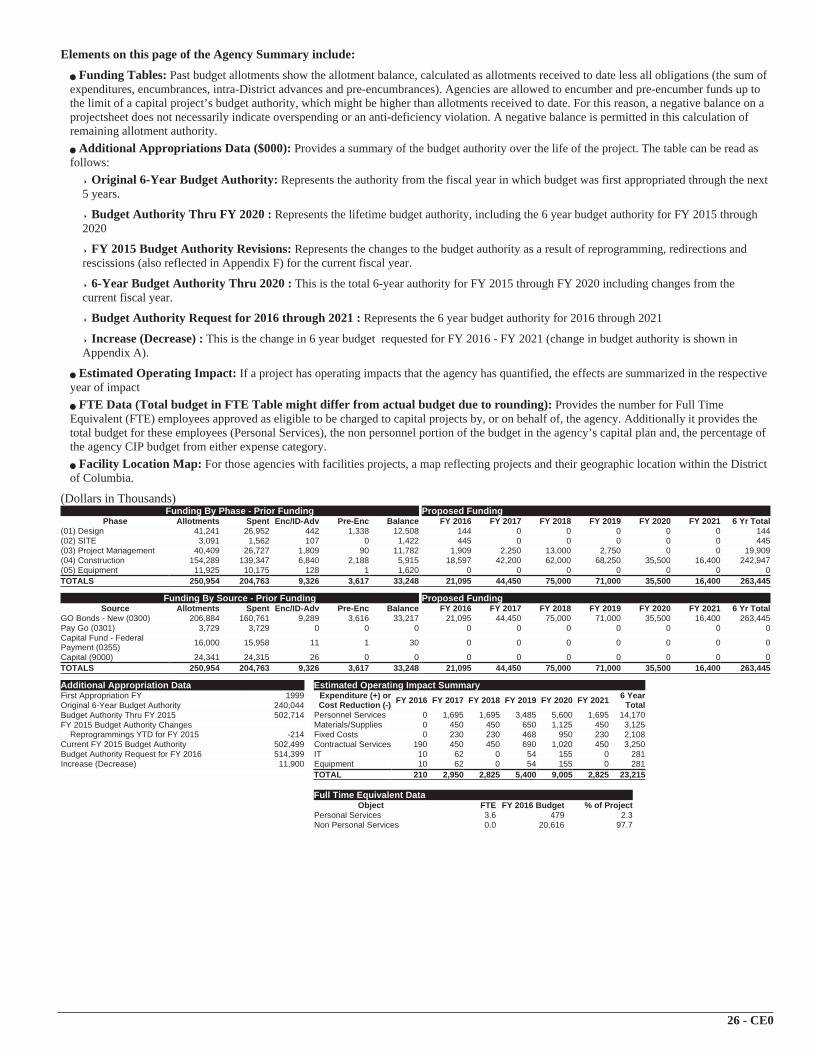
District of ColumbiaPublic Libraries
Projects funded in FY 2016
1. Cleveland Park Library2. Lamond Riggs Library3. Martin Luther King Jr. Memorial Central Library4. Palisades Library5. Southwest Library6. Southeast Library
Information on this map is for illustration only. The user acknowledges and agreesthat the use of this information is at the sole risk of the user. No endorsement, liability, or responsibility for information or opinions
expressed are assumed or accepted by any agency of the DC Government.
Sources: Office of the ChiefTechnology Officer (OCTO)
Executive Office of the Mayor (EOM)Prepared by: dcgis.dc.gov
Date: March 2015Coordinate System:
NAD 1983 State PlaneMaryland FIPS 1900
0 1.5 3 miles N
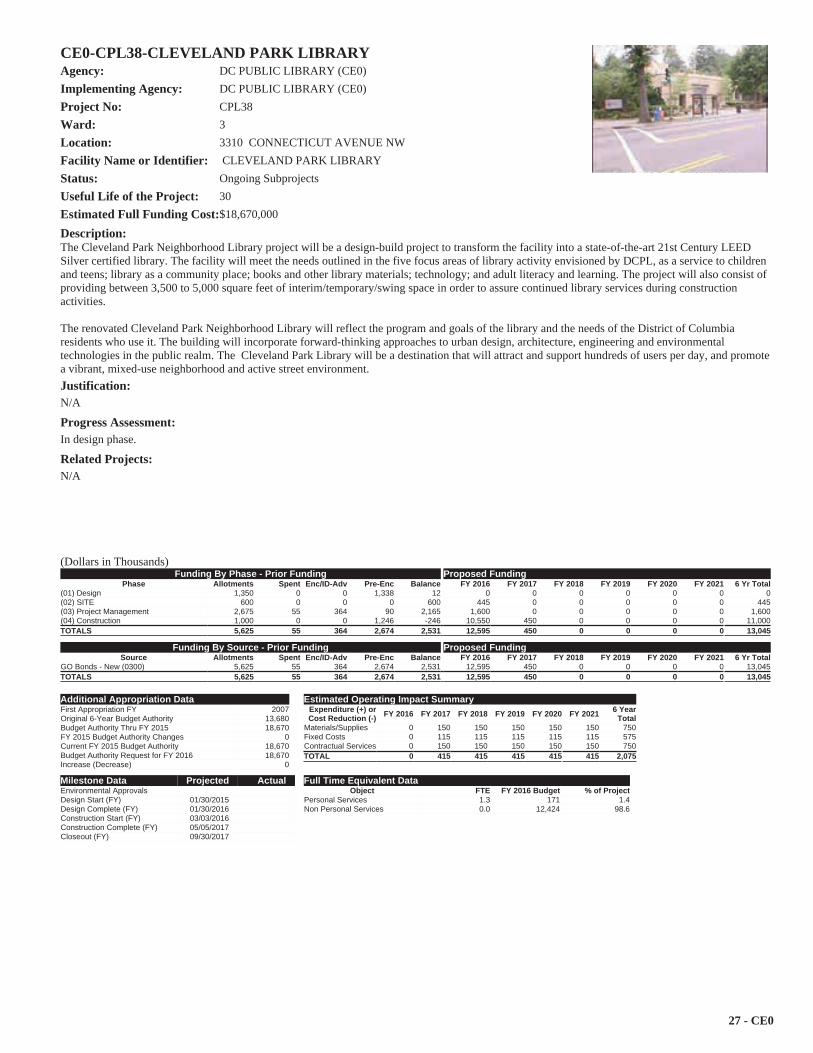
CE0-CPL38-CLEVELAND PARK LIBRARYAgency: DC PUBLIC LIBRARY (CE0)Implementing Agency: DC PUBLIC LIBRARY (CE0)Project No: CPL38Ward: 3Location: 3310 CONNECTICUT AVENUE NWFacility Name or Identifier: CLEVELAND PARK LIBRARYStatus: Ongoing SubprojectsUseful Life of the Project: 30Estimated Full Funding Cost:$18,670,000
Description:The Cleveland Park Neighborhood Library project will be a design-build project to transform the facility into a state-of-the-art 21st Century LEED Silver certified library. The facility will meet the needs outlined in the five focus areas of library activity envisioned by DCPL, as a service to children and teens; library as a community place; books and other library materials; technology; and adult literacy and learning. The project will also consist of providing between 3,500 to 5,000 square feet of interim/temporary/swing space in order to assure continued library services during construction activities.
The renovated Cleveland Park Neighborhood Library will reflect the program and goals of the library and the needs of the District of Columbia residents who use it. The building will incorporate forward-thinking approaches to urban design, architecture, engineering and environmentaltechnologies in the public realm. The Cleveland Park Library will be a destination that will attract and support hundreds of users per day, and promote a vibrant, mixed-use neighborhood and active street environment. Justification:N/A
Progress Assessment:In design phase.
Related Projects:N/A
(Dollars in Thousands)Funding By Phase - Prior Funding Proposed Funding
Phase Allotments Spent Enc/ID-Adv Pre-Enc Balance FY 2016 FY 2017 FY 2018 FY 2019 FY 2020 FY 2021 6 Yr Total(01) Design 1,350 0 0 1,338 12 0 0 0 0 0 0 0(02) SITE 600 0 0 0 600 445 0 0 0 0 0 445(03) Project Management 2,675 55 364 90 2,165 1,600 0 0 0 0 0 1,600(04) Construction 1,000 0 0 1,246 -246 10,550 450 0 0 0 0 11,000TOTALS 5,625 55 364 2,674 2,531 12,595 450 0 0 0 0 13,045
Funding By Source - Prior Funding Proposed FundingSource Allotments Spent Enc/ID-Adv Pre-Enc Balance FY 2016 FY 2017 FY 2018 FY 2019 FY 2020 FY 2021 6 Yr Total
GO Bonds - New (0300) 5,625 55 364 2,674 2,531 12,595 450 0 0 0 0 13,045TOTALS 5,625 55 364 2,674 2,531 12,595 450 0 0 0 0 13,045
Additional Appropriation DataFirst Appropriation FY 2007Original 6-Year Budget Authority 13,680Budget Authority Thru FY 2015 18,670FY 2015 Budget Authority Changes 0Current FY 2015 Budget Authority 18,670Budget Authority Request for FY 2016 18,670Increase (Decrease) 0
Estimated Operating Impact SummaryExpenditure (+) or Cost Reduction (-) FY 2016 FY 2017 FY 2018 FY 2019 FY 2020 FY 2021 6 Year
TotalMaterials/Supplies 0 150 150 150 150 150 750Fixed Costs 0 115 115 115 115 115 575Contractual Services 0 150 150 150 150 150 750TOTAL 0 415 415 415 415 415 2,075
Milestone Data Projected ActualEnvironmental ApprovalsDesign Start (FY) 01/30/2015Design Complete (FY) 01/30/2016Construction Start (FY) 03/03/2016Construction Complete (FY) 05/05/2017Closeout (FY) 09/30/2017
Full Time Equivalent DataObject FTE FY 2016 Budget % of Project
Personal Services 1.3 171 1.4Non Personal Services 0.0 12,424 98.6
27 - CE0
CE0-LB310-GENERAL IMPROVEMENT- LIBRARIESAgency: DC PUBLIC LIBRARY (CE0)Implementing Agency: DC PUBLIC LIBRARY (CE0)Project No: LB310Ward:Location: DISTRICT-WIDEFacility Name or Identifier: VARIOUSStatus: Ongoing SubprojectsUseful Life of the Project: 10Estimated Full Funding Cost:$25,107,000
Description:This project addresses critical capital upgrades and replacements at various library facilities. The work will include installation and replacement of HVAC systems; upgrade of security, fire, life/safety and emergency power systems; ADA code compliance for restrooms and elevators; roof replacements and upgrades; and interior upgrades to various libraries.Justification:N/A
Progress Assessment:The project is ongoing every year.
Related Projects:None.
(Dollars in Thousands)Funding By Phase - Prior Funding Proposed Funding
Phase Allotments Spent Enc/ID-Adv Pre-Enc Balance FY 2016 FY 2017 FY 2018 FY 2019 FY 2020 FY 2021 6 Yr Total(01) Design 1,936 1,403 229 0 304 144 0 0 0 0 0 144(03) Project Management 9,066 5,609 612 0 2,846 0 0 0 0 0 0 0(04) Construction 10,616 8,222 1,016 942 435 1,256 0 0 0 0 1,400 2,656(05) Equipment 689 675 8 0 6 0 0 0 0 0 0 0TOTALS 22,307 15,909 1,865 942 3,591 1,400 0 0 0 0 1,400 2,800
Funding By Source - Prior Funding Proposed FundingSource Allotments Spent Enc/ID-Adv Pre-Enc Balance FY 2016 FY 2017 FY 2018 FY 2019 FY 2020 FY 2021 6 Yr Total
GO Bonds - New (0300) 14,862 8,490 1,839 942 3,591 1,400 0 0 0 0 1,400 2,800Capital (9000) 7,445 7,419 26 0 0 0 0 0 0 0 0 0TOTALS 22,307 15,909 1,865 942 3,591 1,400 0 0 0 0 1,400 2,800
Additional Appropriation DataFirst Appropriation FY 2005Original 6-Year Budget Authority 10,408Budget Authority Thru FY 2015 22,388FY 2015 Budget Authority Changes
Reprogrammings YTD for FY 2015 -82Current FY 2015 Budget Authority 22,307Budget Authority Request for FY 2016 25,107Increase (Decrease) 2,800
Estimated Operating Impact SummaryExpenditure (+) or Cost Reduction (-) FY 2016 FY 2017 FY 2018 FY 2019 FY 2020 FY 2021 6 Year
TotalContractual Services 190 0 0 0 0 0 190IT 10 0 0 0 0 0 10Equipment 10 0 0 0 0 0 10TOTAL 210 0 0 0 0 0 210
Milestone Data Projected ActualEnvironmental ApprovalsDesign Start (FY)Design Complete (FY)Construction Start (FY)Construction Complete (FY)Closeout (FY)
Full Time Equivalent DataObject FTE FY 2016 Budget % of Project
Personal Services 0.0 0 0.0Non Personal Services 0.0 1,400 100.0
28 - CE0
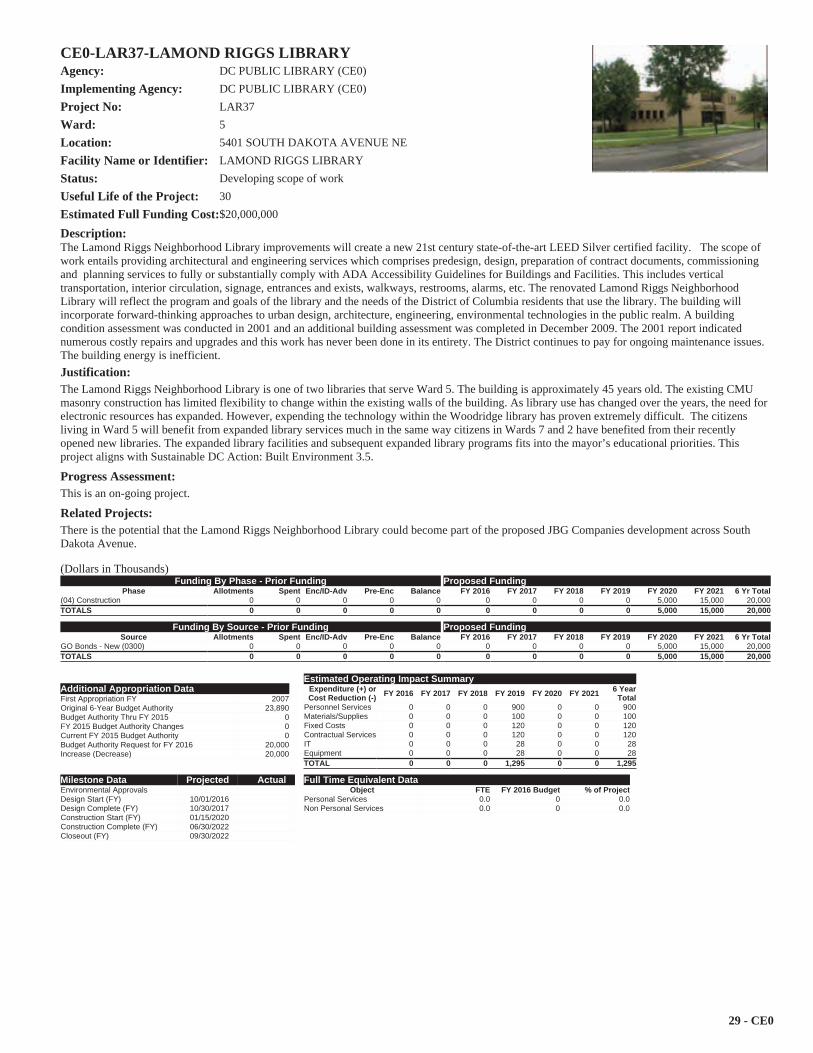
CE0-LAR37-LAMOND RIGGS LIBRARYAgency: DC PUBLIC LIBRARY (CE0)Implementing Agency: DC PUBLIC LIBRARY (CE0)Project No: LAR37Ward: 5Location: 5401 SOUTH DAKOTA AVENUE NEFacility Name or Identifier: LAMOND RIGGS LIBRARYStatus: Developing scope of workUseful Life of the Project: 30Estimated Full Funding Cost:$20,000,000
Description:The Lamond Riggs Neighborhood Library improvements will create a new 21st century state-of-the-art LEED Silver certified facility. The scope of work entails providing architectural and engineering services which comprises predesign, design, preparation of contract documents, commissioning and planning services to fully or substantially comply with ADA Accessibility Guidelines for Buildings and Facilities. This includes vertical transportation, interior circulation, signage, entrances and exists, walkways, restrooms, alarms, etc. The renovated Lamond Riggs Neighborhood Library will reflect the program and goals of the library and the needs of the District of Columbia residents that use the library. The building will incorporate forward-thinking approaches to urban design, architecture, engineering, environmental technologies in the public realm. A building condition assessment was conducted in 2001 and an additional building assessment was completed in December 2009. The 2001 report indicated numerous costly repairs and upgrades and this work has never been done in its entirety. The District continues to pay for ongoing maintenance issues. The building energy is inefficient. Justification:The Lamond Riggs Neighborhood Library is one of two libraries that serve Ward 5. The building is approximately 45 years old. The existing CMU masonry construction has limited flexibility to change within the existing walls of the building. As library use has changed over the years, the need for electronic resources has expanded. However, expending the technology within the Woodridge library has proven extremely difficult. The citizens living in Ward 5 will benefit from expanded library services much in the same way citizens in Wards 7 and 2 have benefited from their recently opened new libraries. The expanded library facilities and subsequent expanded library programs fits into the mayor’s educational priorities. This project aligns with Sustainable DC Action: Built Environment 3.5.
Progress Assessment:This is an on-going project.
Related Projects:There is the potential that the Lamond Riggs Neighborhood Library could become part of the proposed JBG Companies development across South Dakota Avenue.
(Dollars in Thousands)Funding By Phase - Prior Funding Proposed Funding
Phase Allotments Spent Enc/ID-Adv Pre-Enc Balance FY 2016 FY 2017 FY 2018 FY 2019 FY 2020 FY 2021 6 Yr Total(04) Construction 0 0 0 0 0 0 0 0 0 5,000 15,000 20,000TOTALS 0 0 0 0 0 0 0 0 0 5,000 15,000 20,000
Funding By Source - Prior Funding Proposed FundingSource Allotments Spent Enc/ID-Adv Pre-Enc Balance FY 2016 FY 2017 FY 2018 FY 2019 FY 2020 FY 2021 6 Yr Total
GO Bonds - New (0300) 0 0 0 0 0 0 0 0 0 5,000 15,000 20,000TOTALS 0 0 0 0 0 0 0 0 0 5,000 15,000 20,000
Additional Appropriation DataFirst Appropriation FY 2007Original 6-Year Budget Authority 23,890Budget Authority Thru FY 2015 0FY 2015 Budget Authority Changes 0Current FY 2015 Budget Authority 0Budget Authority Request for FY 2016 20,000Increase (Decrease) 20,000
Estimated Operating Impact SummaryExpenditure (+) or Cost Reduction (-) FY 2016 FY 2017 FY 2018 FY 2019 FY 2020 FY 2021 6 Year
TotalPersonnel Services 0 0 0 900 0 0 900Materials/Supplies 0 0 0 100 0 0 100Fixed Costs 0 0 0 120 0 0 120Contractual Services 0 0 0 120 0 0 120IT 0 0 0 28 0 0 28Equipment 0 0 0 28 0 0 28TOTAL 0 0 0 1,295 0 0 1,295
Milestone Data Projected ActualEnvironmental ApprovalsDesign Start (FY) 10/01/2016Design Complete (FY) 10/30/2017Construction Start (FY) 01/15/2020Construction Complete (FY) 06/30/2022Closeout (FY) 09/30/2022
Full Time Equivalent DataObject FTE FY 2016 Budget % of Project
Personal Services 0.0 0 0.0Non Personal Services 0.0 0 0.0
29 - CE0
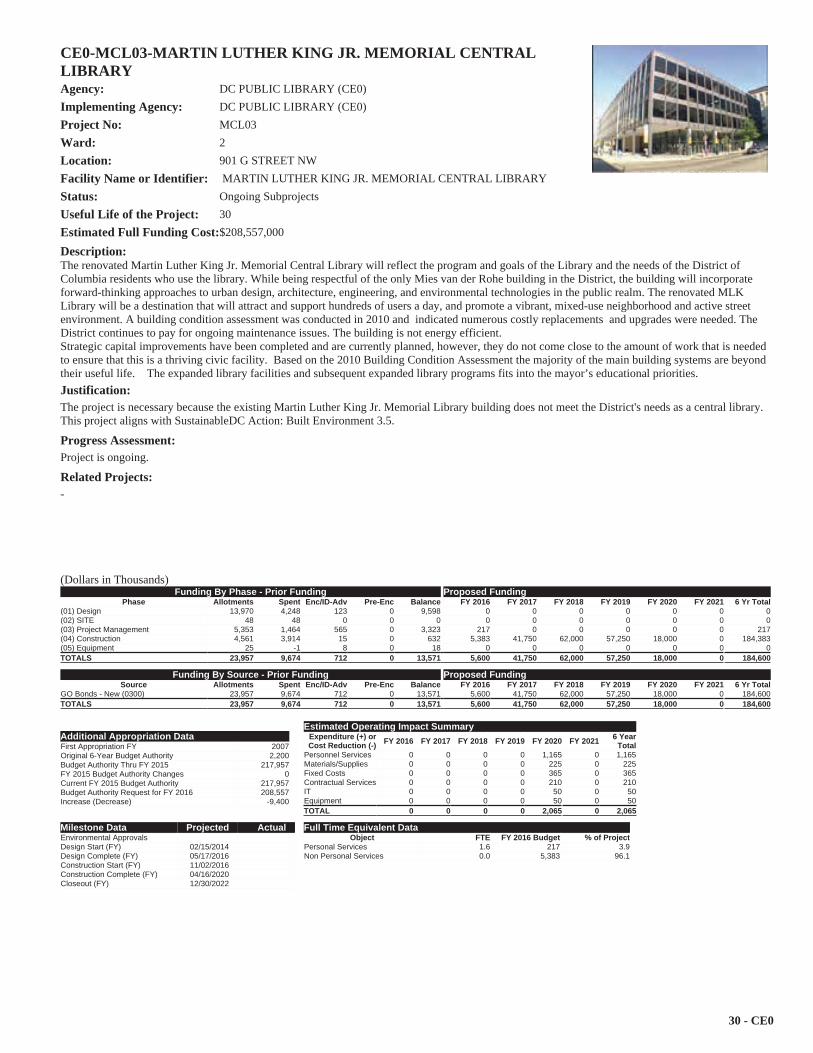
CE0-MCL03-MARTIN LUTHER KING JR. MEMORIAL CENTRAL LIBRARYAgency: DC PUBLIC LIBRARY (CE0)Implementing Agency: DC PUBLIC LIBRARY (CE0)Project No: MCL03Ward: 2Location: 901 G STREET NWFacility Name or Identifier: MARTIN LUTHER KING JR. MEMORIAL CENTRAL LIBRARYStatus: Ongoing SubprojectsUseful Life of the Project: 30Estimated Full Funding Cost:$208,557,000
Description:The renovated Martin Luther King Jr. Memorial Central Library will reflect the program and goals of the Library and the needs of the District of Columbia residents who use the library. While being respectful of the only Mies van der Rohe building in the District, the building will incorporate forward-thinking approaches to urban design, architecture, engineering, and environmental technologies in the public realm. The renovated MLK Library will be a destination that will attract and support hundreds of users a day, and promote a vibrant, mixed-use neighborhood and active street environment. A building condition assessment was conducted in 2010 and indicated numerous costly replacements and upgrades were needed. The District continues to pay for ongoing maintenance issues. The building is not energy efficient.Strategic capital improvements have been completed and are currently planned, however, they do not come close to the amount of work that is needed to ensure that this is a thriving civic facility. Based on the 2010 Building Condition Assessment the majority of the main building systems are beyond their useful life. The expanded library facilities and subsequent expanded library programs fits into the mayor’s educational priorities.Justification:The project is necessary because the existing Martin Luther King Jr. Memorial Library building does not meet the District's needs as a central library. This project aligns with SustainableDC Action: Built Environment 3.5.
Progress Assessment:Project is ongoing.
Related Projects:-
(Dollars in Thousands)Funding By Phase - Prior Funding Proposed Funding
Phase Allotments Spent Enc/ID-Adv Pre-Enc Balance FY 2016 FY 2017 FY 2018 FY 2019 FY 2020 FY 2021 6 Yr Total(01) Design 13,970 4,248 123 0 9,598 0 0 0 0 0 0 0(02) SITE 48 48 0 0 0 0 0 0 0 0 0 0(03) Project Management 5,353 1,464 565 0 3,323 217 0 0 0 0 0 217(04) Construction 4,561 3,914 15 0 632 5,383 41,750 62,000 57,250 18,000 0 184,383(05) Equipment 25 -1 8 0 18 0 0 0 0 0 0 0TOTALS 23,957 9,674 712 0 13,571 5,600 41,750 62,000 57,250 18,000 0 184,600
Funding By Source - Prior Funding Proposed FundingSource Allotments Spent Enc/ID-Adv Pre-Enc Balance FY 2016 FY 2017 FY 2018 FY 2019 FY 2020 FY 2021 6 Yr Total
GO Bonds - New (0300) 23,957 9,674 712 0 13,571 5,600 41,750 62,000 57,250 18,000 0 184,600TOTALS 23,957 9,674 712 0 13,571 5,600 41,750 62,000 57,250 18,000 0 184,600
Additional Appropriation DataFirst Appropriation FY 2007Original 6-Year Budget Authority 2,200Budget Authority Thru FY 2015 217,957FY 2015 Budget Authority Changes 0Current FY 2015 Budget Authority 217,957Budget Authority Request for FY 2016 208,557Increase (Decrease) -9,400
Estimated Operating Impact SummaryExpenditure (+) or Cost Reduction (-) FY 2016 FY 2017 FY 2018 FY 2019 FY 2020 FY 2021 6 Year
TotalPersonnel Services 0 0 0 0 1,165 0 1,165Materials/Supplies 0 0 0 0 225 0 225Fixed Costs 0 0 0 0 365 0 365Contractual Services 0 0 0 0 210 0 210IT 0 0 0 0 50 0 50Equipment 0 0 0 0 50 0 50TOTAL 0 0 0 0 2,065 0 2,065
Milestone Data Projected ActualEnvironmental ApprovalsDesign Start (FY) 02/15/2014Design Complete (FY) 05/17/2016Construction Start (FY) 11/02/2016Construction Complete (FY) 04/16/2020Closeout (FY) 12/30/2022
Full Time Equivalent DataObject FTE FY 2016 Budget % of Project
Personal Services 1.6 217 3.9Non Personal Services 0.0 5,383 96.1
30 - CE0
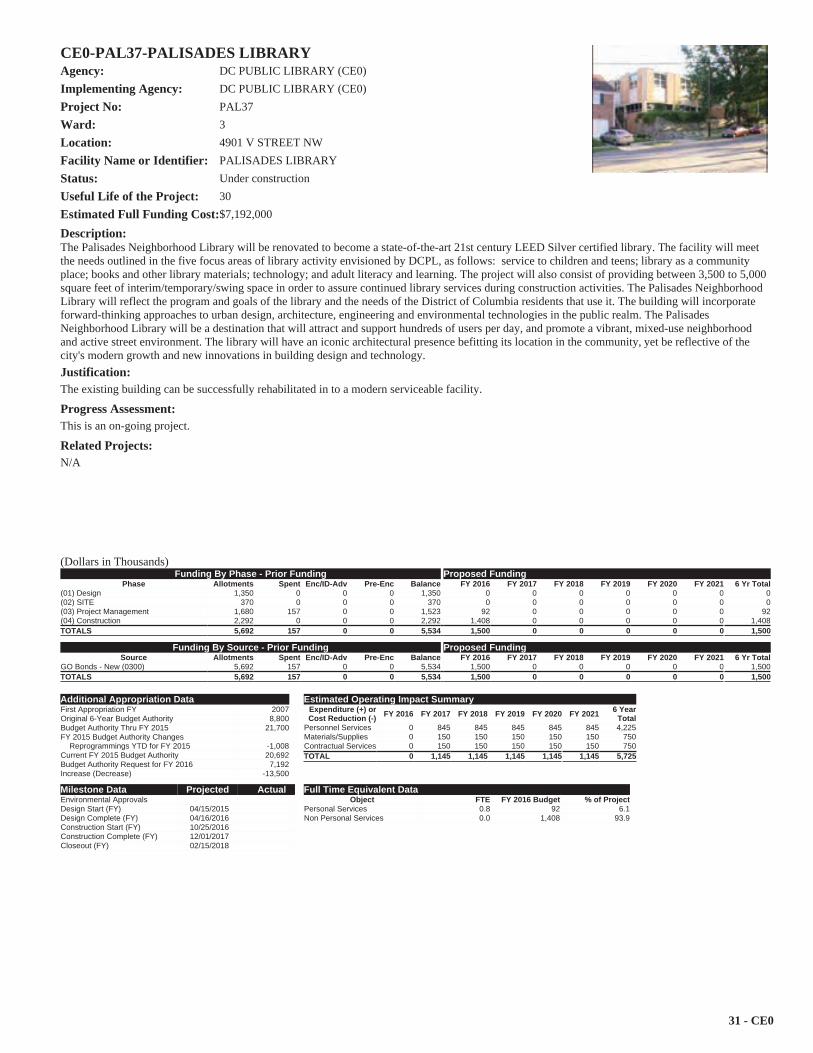
CE0-PAL37-PALISADES LIBRARYAgency: DC PUBLIC LIBRARY (CE0)Implementing Agency: DC PUBLIC LIBRARY (CE0)Project No: PAL37Ward: 3Location: 4901 V STREET NWFacility Name or Identifier: PALISADES LIBRARYStatus: Under constructionUseful Life of the Project: 30Estimated Full Funding Cost:$7,192,000
Description:The Palisades Neighborhood Library will be renovated to become a state-of-the-art 21st century LEED Silver certified library. The facility will meet the needs outlined in the five focus areas of library activity envisioned by DCPL, as follows: service to children and teens; library as a community place; books and other library materials; technology; and adult literacy and learning. The project will also consist of providing between 3,500 to 5,000 square feet of interim/temporary/swing space in order to assure continued library services during construction activities. The Palisades Neighborhood Library will reflect the program and goals of the library and the needs of the District of Columbia residents that use it. The building will incorporate forward-thinking approaches to urban design, architecture, engineering and environmental technologies in the public realm. The PalisadesNeighborhood Library will be a destination that will attract and support hundreds of users per day, and promote a vibrant, mixed-use neighborhood and active street environment. The library will have an iconic architectural presence befitting its location in the community, yet be reflective of the city's modern growth and new innovations in building design and technology. Justification:The existing building can be successfully rehabilitated in to a modern serviceable facility.
Progress Assessment:This is an on-going project.
Related Projects:N/A
(Dollars in Thousands)Funding By Phase - Prior Funding Proposed Funding
Phase Allotments Spent Enc/ID-Adv Pre-Enc Balance FY 2016 FY 2017 FY 2018 FY 2019 FY 2020 FY 2021 6 Yr Total(01) Design 1,350 0 0 0 1,350 0 0 0 0 0 0 0(02) SITE 370 0 0 0 370 0 0 0 0 0 0 0(03) Project Management 1,680 157 0 0 1,523 92 0 0 0 0 0 92(04) Construction 2,292 0 0 0 2,292 1,408 0 0 0 0 0 1,408TOTALS 5,692 157 0 0 5,534 1,500 0 0 0 0 0 1,500
Funding By Source - Prior Funding Proposed FundingSource Allotments Spent Enc/ID-Adv Pre-Enc Balance FY 2016 FY 2017 FY 2018 FY 2019 FY 2020 FY 2021 6 Yr Total
GO Bonds - New (0300) 5,692 157 0 0 5,534 1,500 0 0 0 0 0 1,500TOTALS 5,692 157 0 0 5,534 1,500 0 0 0 0 0 1,500
Additional Appropriation DataFirst Appropriation FY 2007Original 6-Year Budget Authority 8,800Budget Authority Thru FY 2015 21,700FY 2015 Budget Authority Changes
Reprogrammings YTD for FY 2015 -1,008Current FY 2015 Budget Authority 20,692Budget Authority Request for FY 2016 7,192Increase (Decrease) -13,500
Estimated Operating Impact SummaryExpenditure (+) or Cost Reduction (-) FY 2016 FY 2017 FY 2018 FY 2019 FY 2020 FY 2021 6 Year
TotalPersonnel Services 0 845 845 845 845 845 4,225Materials/Supplies 0 150 150 150 150 150 750Contractual Services 0 150 150 150 150 150 750TOTAL 0 1,145 1,145 1,145 1,145 1,145 5,725
Milestone Data Projected ActualEnvironmental ApprovalsDesign Start (FY) 04/15/2015Design Complete (FY) 04/16/2016Construction Start (FY) 10/25/2016Construction Complete (FY) 12/01/2017Closeout (FY) 02/15/2018
Full Time Equivalent DataObject FTE FY 2016 Budget % of Project
Personal Services 0.8 92 6.1Non Personal Services 0.0 1,408 93.9
31 - CE0
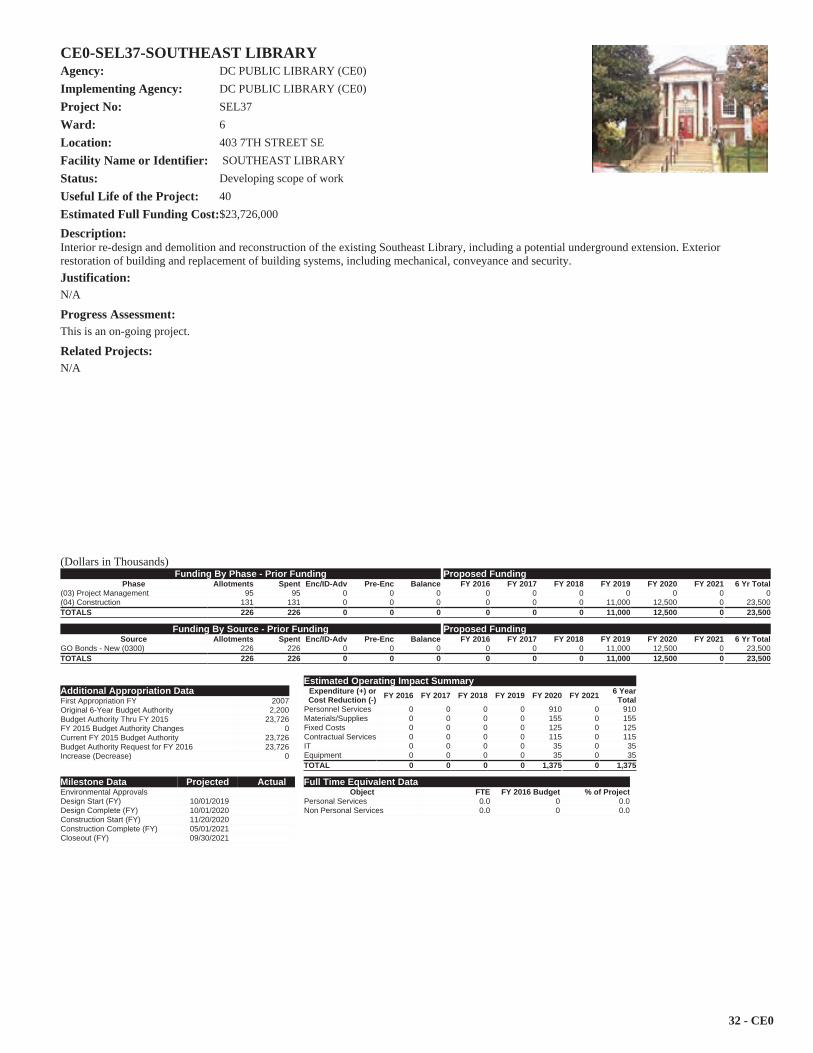
CE0-SEL37-SOUTHEAST LIBRARYAgency: DC PUBLIC LIBRARY (CE0)Implementing Agency: DC PUBLIC LIBRARY (CE0)Project No: SEL37Ward: 6Location: 403 7TH STREET SEFacility Name or Identifier: SOUTHEAST LIBRARYStatus: Developing scope of workUseful Life of the Project: 40Estimated Full Funding Cost:$23,726,000
Description:Interior re-design and demolition and reconstruction of the existing Southeast Library, including a potential underground extension. Exterior restoration of building and replacement of building systems, including mechanical, conveyance and security. Justification:N/A
Progress Assessment:This is an on-going project.
Related Projects:N/A
(Dollars in Thousands)Funding By Phase - Prior Funding Proposed Funding
Phase Allotments Spent Enc/ID-Adv Pre-Enc Balance FY 2016 FY 2017 FY 2018 FY 2019 FY 2020 FY 2021 6 Yr Total(03) Project Management 95 95 0 0 0 0 0 0 0 0 0 0(04) Construction 131 131 0 0 0 0 0 0 11,000 12,500 0 23,500TOTALS 226 226 0 0 0 0 0 0 11,000 12,500 0 23,500
Funding By Source - Prior Funding Proposed FundingSource Allotments Spent Enc/ID-Adv Pre-Enc Balance FY 2016 FY 2017 FY 2018 FY 2019 FY 2020 FY 2021 6 Yr Total
GO Bonds - New (0300) 226 226 0 0 0 0 0 0 11,000 12,500 0 23,500TOTALS 226 226 0 0 0 0 0 0 11,000 12,500 0 23,500
Additional Appropriation DataFirst Appropriation FY 2007Original 6-Year Budget Authority 2,200Budget Authority Thru FY 2015 23,726FY 2015 Budget Authority Changes 0Current FY 2015 Budget Authority 23,726Budget Authority Request for FY 2016 23,726Increase (Decrease) 0
Estimated Operating Impact SummaryExpenditure (+) or Cost Reduction (-) FY 2016 FY 2017 FY 2018 FY 2019 FY 2020 FY 2021 6 Year
TotalPersonnel Services 0 0 0 0 910 0 910Materials/Supplies 0 0 0 0 155 0 155Fixed Costs 0 0 0 0 125 0 125Contractual Services 0 0 0 0 115 0 115IT 0 0 0 0 35 0 35Equipment 0 0 0 0 35 0 35TOTAL 0 0 0 0 1,375 0 1,375
Milestone Data Projected ActualEnvironmental ApprovalsDesign Start (FY) 10/01/2019Design Complete (FY) 10/01/2020Construction Start (FY) 11/20/2020Construction Complete (FY) 05/01/2021Closeout (FY) 09/30/2021
Full Time Equivalent DataObject FTE FY 2016 Budget % of Project
Personal Services 0.0 0 0.0Non Personal Services 0.0 0 0.0
32 - CE0

CE0-SWL37-SOUTHWEST LIBRARYAgency: DC PUBLIC LIBRARY (CE0)Implementing Agency: DC PUBLIC LIBRARY (CE0)Project No: SWL37Ward: 6Location: 900 WESLEY PLACE SWFacility Name or Identifier: SOUTHWEST LIBRARYStatus: Developing scope of workUseful Life of the Project: 30Estimated Full Funding Cost:$18,000,000
Description:This project involves creating a new 21st century state-of-the-art LEED Silver certified facility. The scope of work entails providing architectural and engineering services which comprises predesign, design, preparation of contract documents, commissioning, and planning services to fully or substantially comply with ADA Accessibility Guidelines for Buildings and Facilities; and to include vertical transportation, interior circulation, signage, entrances and exists, walkways, restrooms, alarms, etc. The Southwest Neighborhood Library will reflect the program and goals of the library and the needs of the District of Columbia residents who use it. The building will incorporate forward-thinking approaches to urban design, architecture, engineering, and environmental technologies in the public realm. The Southwest Library will be a destination that will attract and support hundreds of users per day, and promote a vibrant, mixed-use neighborhood and active street environment. A building condition assessment was conducted in 2001 and an additional building assessment was completed in December 2009. The 2001 report indicated numerous costly repairs and upgrades; this work has never been done in its entirety. The District continues to pay for ongoing maintenance issues. The building energy is inefficient.Justification:The building is approximately 45 years old. The existing CMU masonry construction has limited flexibility to change within the existing walls of the building. As library use has changed over the years the need for electronic resources has expanded. However, expending the technology within the Southwest Library has proven extremely difficult. The citizens living in Ward 6 will benefit from expanded library services much in the same way citizens in Wards 7 and 2 have benefited from their recently opened new libraries. The expanded library facilities and subsequent expanded library programs fits into the mayor’s educational priorities. This project aligns with Sustainable DC Action: Built Environment 3.5.
Progress Assessment:This is a new project.
Related Projects:Mixed-use development is underway at the Southwest Waterfront.
(Dollars in Thousands)Funding By Phase - Prior Funding Proposed Funding
Phase Allotments Spent Enc/ID-Adv Pre-Enc Balance FY 2016 FY 2017 FY 2018 FY 2019 FY 2020 FY 2021 6 Yr Total(03) Project Management 0 0 0 0 0 0 2,250 13,000 2,750 0 0 18,000TOTALS 0 0 0 0 0 0 2,250 13,000 2,750 0 0 18,000
Funding By Source - Prior Funding Proposed FundingSource Allotments Spent Enc/ID-Adv Pre-Enc Balance FY 2016 FY 2017 FY 2018 FY 2019 FY 2020 FY 2021 6 Yr Total
GO Bonds - New (0300) 0 0 0 0 0 0 2,250 13,000 2,750 0 0 18,000TOTALS 0 0 0 0 0 0 2,250 13,000 2,750 0 0 18,000
Additional Appropriation DataFirst Appropriation FY 2007Original 6-Year Budget Authority 25,050Budget Authority Thru FY 2015 0FY 2015 Budget Authority Changes 0Current FY 2015 Budget Authority 0Budget Authority Request for FY 2016 18,000Increase (Decrease) 18,000
Estimated Operating Impact SummaryExpenditure (+) or Cost Reduction (-) FY 2016 FY 2017 FY 2018 FY 2019 FY 2020 FY 2021 6 Year
TotalPersonnel Services 0 0 0 890 0 0 890Materials/Supplies 0 0 0 100 0 0 100Fixed Costs 0 0 0 118 0 0 118Contractual Services 0 0 0 120 0 0 120IT 0 0 0 26 0 0 26Equipment 0 0 0 26 0 0 26TOTAL 0 0 0 1,280 0 0 1,280
Milestone Data Projected ActualEnvironmental ApprovalsDesign Start (FY) 10/01/2016Design Complete (FY) 09/30/2017Construction Start (FY) 01/02/2018Construction Complete (FY) 06/15/2020Closeout (FY) 08/15/2020
Full Time Equivalent DataObject FTE FY 2016 Budget % of Project
Personal Services 0.0 0 0.0Non Personal Services 0.0 0 0.0
33 - CE0

This page is intentionally left blank.
(CR0) DEPT. OF CONSUMER AND REGULATORY AFFAIRS
35 - CR0
Elements on this page of the Agency Summary include:
Funding Tables: Past budget allotments show the allotment balance, calculated as allotments received to date less all obligations (the sum of expenditures, encumbrances, intra-District advances and pre-encumbrances). Agencies are allowed to encumber and pre-encumber funds up to the limit of a capital project’s budget authority, which might be higher than allotments received to date. For this reason, a negative balance on a projectsheet does not necessarily indicate overspending or an anti-deficiency violation. A negative balance is permitted in this calculation of remaining allotment authority. Additional Appropriations Data ($000): Provides a summary of the budget authority over the life of the project. The table can be read as
follows: Original 6-Year Budget Authority: Represents the authority from the fiscal year in which budget was first appropriated through the next
5 years.
Budget Authority Thru FY 2020 : Represents the lifetime budget authority, including the 6 year budget authority for FY 2015 through 2020
FY 2015 Budget Authority Revisions: Represents the changes to the budget authority as a result of reprogramming, redirections and rescissions (also reflected in Appendix F) for the current fiscal year.
6-Year Budget Authority Thru 2020 : This is the total 6-year authority for FY 2015 through FY 2020 including changes from the current fiscal year.
Budget Authority Request for 2016 through 2021 : Represents the 6 year budget authority for 2016 through 2021
Increase (Decrease) : This is the change in 6 year budget requested for FY 2016 - FY 2021 (change in budget authority is shown in Appendix A).
Estimated Operating Impact: If a project has operating impacts that the agency has quantified, the effects are summarized in the respective year of impact FTE Data (Total budget in FTE Table might differ from actual budget due to rounding): Provides the number for Full Time
Equivalent (FTE) employees approved as eligible to be charged to capital projects by, or on behalf of, the agency. Additionally it provides the total budget for these employees (Personal Services), the non personnel portion of the budget in the agency’s capital plan and, the percentage of the agency CIP budget from either expense category. Facility Location Map: For those agencies with facilities projects, a map reflecting projects and their geographic location within the District
of Columbia.
(Dollars in Thousands)Funding By Phase - Prior Funding Proposed Funding
Phase Allotments Spent Enc/ID-Adv Pre-Enc Balance FY 2016 FY 2017 FY 2018 FY 2019 FY 2020 FY 2021 6 Yr Total(03) Project Management 165 165 0 0 0 0 0 0 0 0 0 0(04) Construction 50,360 49,281 926 0 153 0 0 0 0 0 0 0(05) Equipment 1,327 1,327 0 0 0 0 0 0 0 0 0 0(06) IT Requirements Development/SystemsDesign
13,708 12,483 996 0 228 0 0 0 0 2,000 2,000 4,000
(07) IT Development & Testing 273 273 0 0 0 0 0 0 0 0 0 0
(08) IT Deployment & Turnover 36 36 0 0 0 0 0 0 0 0 0 0
TOTALS 65,868 63,564 1,922 0 382 0 0 0 0 2,000 2,000 4,000
Funding By Source - Prior Funding Proposed FundingSource Allotments Spent Enc/ID-Adv Pre-Enc Balance FY 2016 FY 2017 FY 2018 FY 2019 FY 2020 FY 2021 6 Yr Total
GO Bonds - New (0300) 22,439 20,163 1,895 0 382 0 0 0 0 0 0 0Pay Go (0301) 4,808 4,792 16 0 0 0 0 0 0 2,000 2,000 4,000Equipment Lease (0302) 971 971 0 0 0 0 0 0 0 0 0 0Alternative Financing (0303) 1,646 1,646 0 0 0 0 0 0 0 0 0 0Capital (9000) 36,005 35,993 12 0 0 0 0 0 0 0 0 0TOTALS 65,868 63,564 1,922 0 382 0 0 0 0 2,000 2,000 4,000
Additional Appropriation DataFirst Appropriation FY 2001Original 6-Year Budget Authority 72,143Budget Authority Thru FY 2015 70,892FY 2015 Budget Authority Changes
Reprogrammings YTD for FY 2015 -1,023Current FY 2015 Budget Authority 69,868Budget Authority Request for FY 2016 69,868Increase (Decrease) 0
Estimated Operating Impact SummaryExpenditure (+) or Cost Reduction (-) FY 2016 FY 2017 FY 2018 FY 2019 FY 2020 FY 2021 6 Yr TotalNo estimated operating impact
Full Time Equivalent DataObject FTE FY 2016 Budget % of Project
Personal Services 0.0 0 0.0Non Personal Services 0.0 0 0.0
36 - CR0
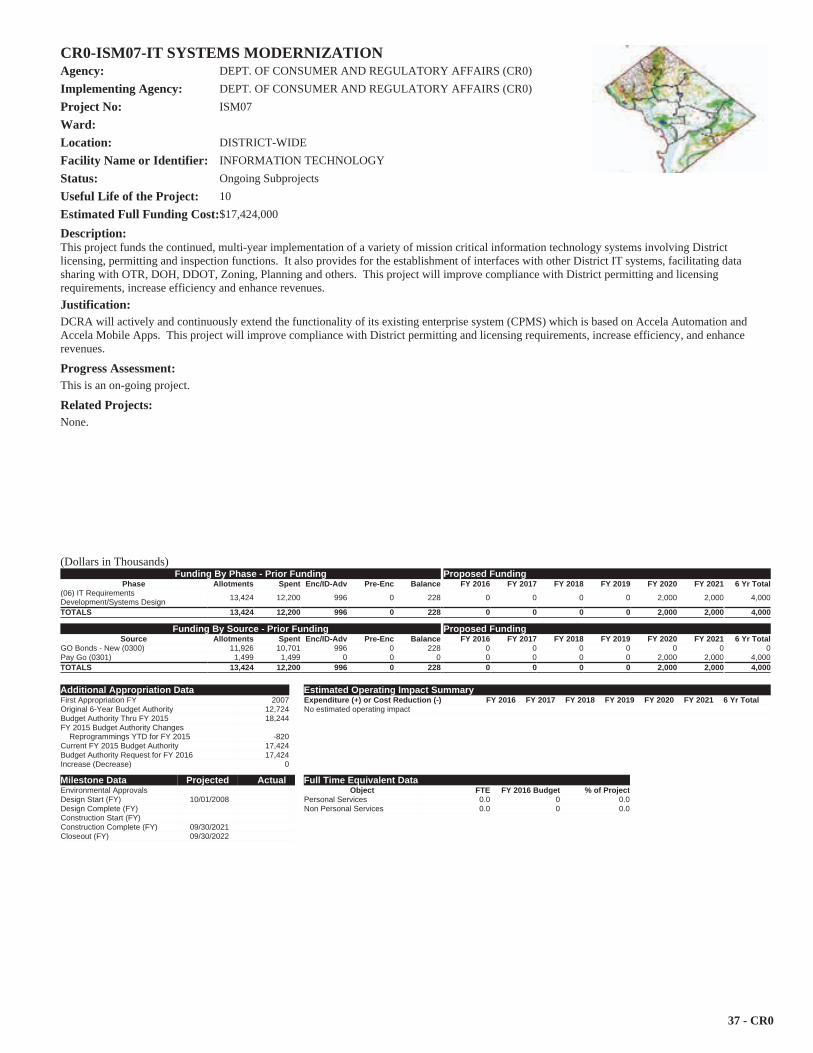
CR0-ISM07-IT SYSTEMS MODERNIZATIONAgency: DEPT. OF CONSUMER AND REGULATORY AFFAIRS (CR0)Implementing Agency: DEPT. OF CONSUMER AND REGULATORY AFFAIRS (CR0)Project No: ISM07Ward:Location: DISTRICT-WIDEFacility Name or Identifier: INFORMATION TECHNOLOGYStatus: Ongoing SubprojectsUseful Life of the Project: 10Estimated Full Funding Cost:$17,424,000
Description:This project funds the continued, multi-year implementation of a variety of mission critical information technology systems involving District licensing, permitting and inspection functions. It also provides for the establishment of interfaces with other District IT systems, facilitating data sharing with OTR, DOH, DDOT, Zoning, Planning and others. This project will improve compliance with District permitting and licensingrequirements, increase efficiency and enhance revenues.Justification:DCRA will actively and continuously extend the functionality of its existing enterprise system (CPMS) which is based on Accela Automation and Accela Mobile Apps. This project will improve compliance with District permitting and licensing requirements, increase efficiency, and enhance revenues.
Progress Assessment:This is an on-going project.
Related Projects:None.
(Dollars in Thousands)Funding By Phase - Prior Funding Proposed Funding
Phase Allotments Spent Enc/ID-Adv Pre-Enc Balance FY 2016 FY 2017 FY 2018 FY 2019 FY 2020 FY 2021 6 Yr Total(06) IT Requirements Development/Systems Design 13,424 12,200 996 0 228 0 0 0 0 2,000 2,000 4,000
TOTALS 13,424 12,200 996 0 228 0 0 0 0 2,000 2,000 4,000
Funding By Source - Prior Funding Proposed FundingSource Allotments Spent Enc/ID-Adv Pre-Enc Balance FY 2016 FY 2017 FY 2018 FY 2019 FY 2020 FY 2021 6 Yr Total
GO Bonds - New (0300) 11,926 10,701 996 0 228 0 0 0 0 0 0 0Pay Go (0301) 1,499 1,499 0 0 0 0 0 0 0 2,000 2,000 4,000TOTALS 13,424 12,200 996 0 228 0 0 0 0 2,000 2,000 4,000
Additional Appropriation DataFirst Appropriation FY 2007Original 6-Year Budget Authority 12,724Budget Authority Thru FY 2015 18,244FY 2015 Budget Authority Changes
Reprogrammings YTD for FY 2015 -820Current FY 2015 Budget Authority 17,424Budget Authority Request for FY 2016 17,424Increase (Decrease) 0
Estimated Operating Impact SummaryExpenditure (+) or Cost Reduction (-) FY 2016 FY 2017 FY 2018 FY 2019 FY 2020 FY 2021 6 Yr TotalNo estimated operating impact
Milestone Data Projected ActualEnvironmental ApprovalsDesign Start (FY) 10/01/2008Design Complete (FY)Construction Start (FY)Construction Complete (FY) 09/30/2021Closeout (FY) 09/30/2022
Full Time Equivalent DataObject FTE FY 2016 Budget % of Project
Personal Services 0.0 0 0.0Non Personal Services 0.0 0 0.0
37 - CR0

This page is intentionally left blank.
(EB0) DEPUTY MAYOR FOR PLANNING AND ECON DEV
39 - EB0
Elements on this page of the Agency Summary include:
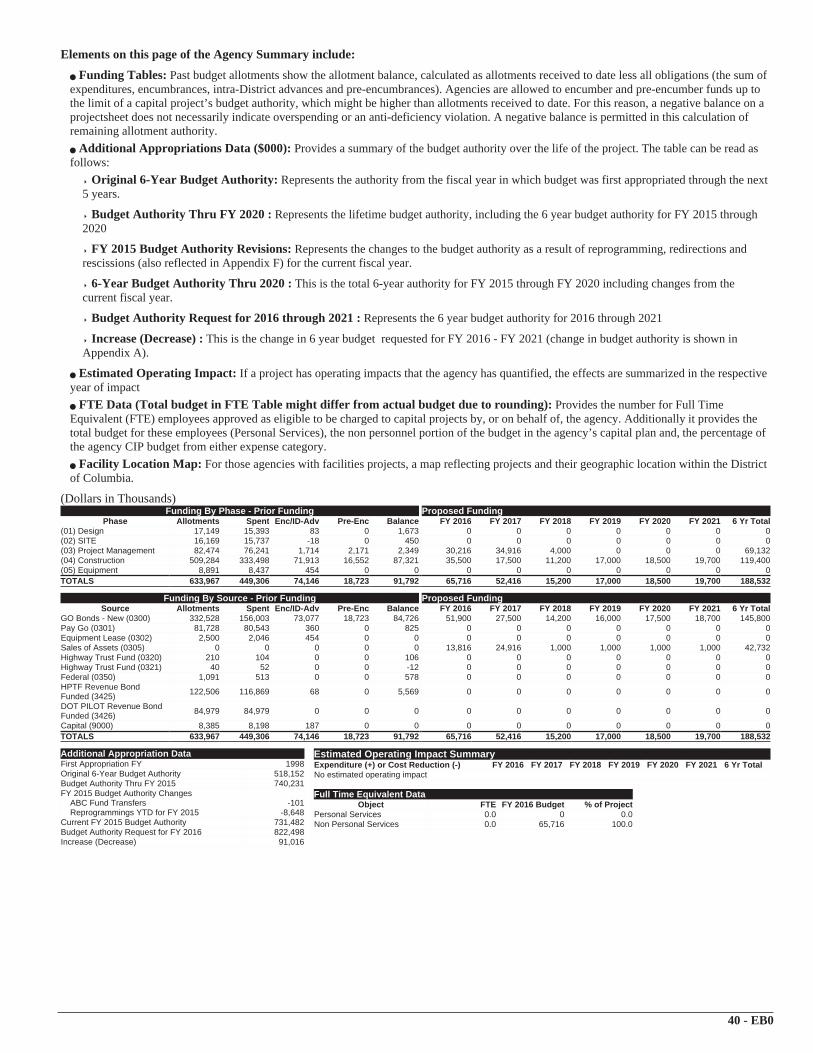
Funding Tables: Past budget allotments show the allotment balance, calculated as allotments received to date less all obligations (the sum of expenditures, encumbrances, intra-District advances and pre-encumbrances). Agencies are allowed to encumber and pre-encumber funds up to the limit of a capital project’s budget authority, which might be higher than allotments received to date. For this reason, a negative balance on a projectsheet does not necessarily indicate overspending or an anti-deficiency violation. A negative balance is permitted in this calculation of remaining allotment authority. Additional Appropriations Data ($000): Provides a summary of the budget authority over the life of the project. The table can be read as
follows: Original 6-Year Budget Authority: Represents the authority from the fiscal year in which budget was first appropriated through the next
5 years.
Budget Authority Thru FY 2020 : Represents the lifetime budget authority, including the 6 year budget authority for FY 2015 through 2020
FY 2015 Budget Authority Revisions: Represents the changes to the budget authority as a result of reprogramming, redirections and rescissions (also reflected in Appendix F) for the current fiscal year.
6-Year Budget Authority Thru 2020 : This is the total 6-year authority for FY 2015 through FY 2020 including changes from the current fiscal year.
Budget Authority Request for 2016 through 2021 : Represents the 6 year budget authority for 2016 through 2021
Increase (Decrease) : This is the change in 6 year budget requested for FY 2016 - FY 2021 (change in budget authority is shown in Appendix A).
Estimated Operating Impact: If a project has operating impacts that the agency has quantified, the effects are summarized in the respective year of impact FTE Data (Total budget in FTE Table might differ from actual budget due to rounding): Provides the number for Full Time
Equivalent (FTE) employees approved as eligible to be charged to capital projects by, or on behalf of, the agency. Additionally it provides the total budget for these employees (Personal Services), the non personnel portion of the budget in the agency’s capital plan and, the percentage of the agency CIP budget from either expense category. Facility Location Map: For those agencies with facilities projects, a map reflecting projects and their geographic location within the District
of Columbia.
(Dollars in Thousands)Funding By Phase - Prior Funding Proposed Funding
Phase Allotments Spent Enc/ID-Adv Pre-Enc Balance FY 2016 FY 2017 FY 2018 FY 2019 FY 2020 FY 2021 6 Yr Total(01) Design 17,149 15,393 83 0 1,673 0 0 0 0 0 0 0(02) SITE 16,169 15,737 -18 0 450 0 0 0 0 0 0 0(03) Project Management 82,474 76,241 1,714 2,171 2,349 30,216 34,916 4,000 0 0 0 69,132(04) Construction 509,284 333,498 71,913 16,552 87,321 35,500 17,500 11,200 17,000 18,500 19,700 119,400(05) Equipment 8,891 8,437 454 0 0 0 0 0 0 0 0 0TOTALS 633,967 449,306 74,146 18,723 91,792 65,716 52,416 15,200 17,000 18,500 19,700 188,532
Funding By Source - Prior Funding Proposed FundingSource Allotments Spent Enc/ID-Adv Pre-Enc Balance FY 2016 FY 2017 FY 2018 FY 2019 FY 2020 FY 2021 6 Yr Total
GO Bonds - New (0300) 332,528 156,003 73,077 18,723 84,726 51,900 27,500 14,200 16,000 17,500 18,700 145,800Pay Go (0301) 81,728 80,543 360 0 825 0 0 0 0 0 0 0Equipment Lease (0302) 2,500 2,046 454 0 0 0 0 0 0 0 0 0Sales of Assets (0305) 0 0 0 0 0 13,816 24,916 1,000 1,000 1,000 1,000 42,732Highway Trust Fund (0320) 210 104 0 0 106 0 0 0 0 0 0 0Highway Trust Fund (0321) 40 52 0 0 -12 0 0 0 0 0 0 0Federal (0350) 1,091 513 0 0 578 0 0 0 0 0 0 0HPTF Revenue Bond Funded (3425) 122,506 116,869 68 0 5,569 0 0 0 0 0 0 0
DOT PILOT Revenue Bond Funded (3426) 84,979 84,979 0 0 0 0 0 0 0 0 0 0
Capital (9000) 8,385 8,198 187 0 0 0 0 0 0 0 0 0TOTALS 633,967 449,306 74,146 18,723 91,792 65,716 52,416 15,200 17,000 18,500 19,700 188,532
Additional Appropriation DataFirst Appropriation FY 1998Original 6-Year Budget Authority 518,152Budget Authority Thru FY 2015 740,231FY 2015 Budget Authority Changes
ABC Fund TransfersReprogrammings YTD for FY 2015
-101-8,648
Current FY 2015 Budget Authority 731,482Budget Authority Request for FY 2016 822,498Increase (Decrease) 91,016
Estimated Operating Impact SummaryExpenditure (+) or Cost Reduction (-) FY 2016 FY 2017 FY 2018 FY 2019 FY 2020 FY 2021 6 Yr TotalNo estimated operating impact
Full Time Equivalent DataObject FTE FY 2016 Budget % of Project
Personal Services 0.0 0 0.0Non Personal Services 0.0 65,716 100.0
40 - EB0
76
2
1
8
5
3
4
1
6
4
2
7
5
3
66
395 695
295
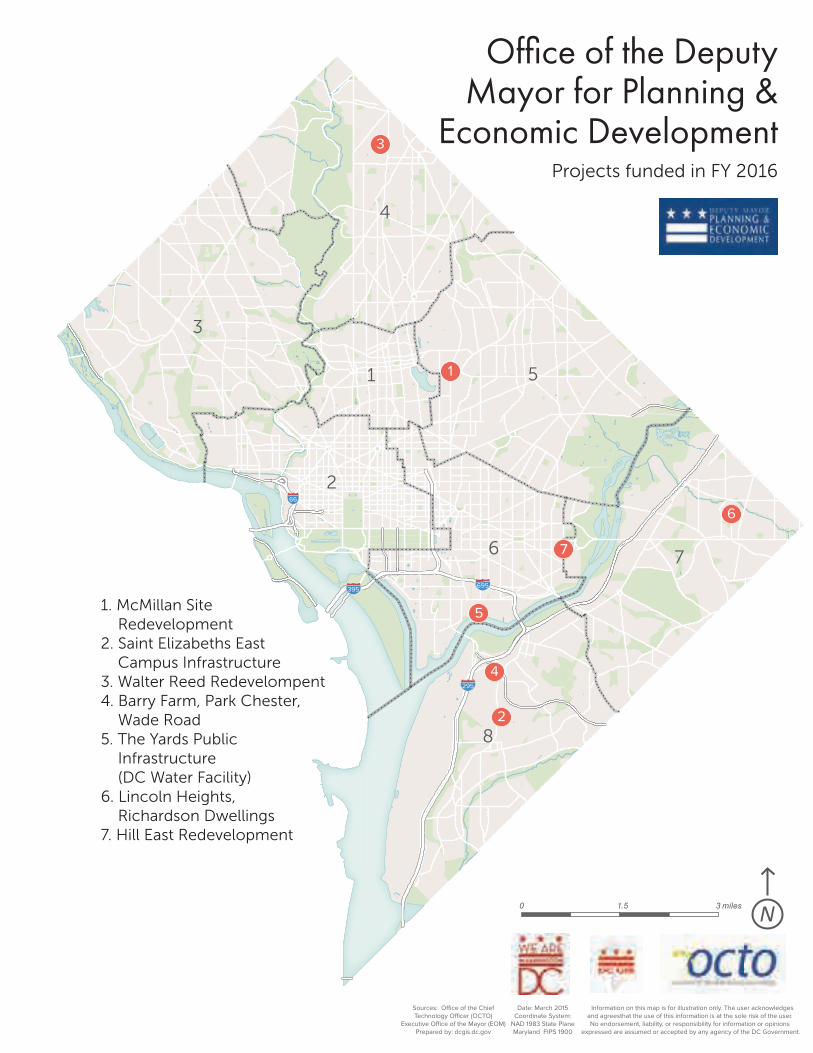
Office of the DeputyMayor for Planning &
Economic DevelopmentProjects funded in FY 2016
1. McMillan Site Redevelopment2. Saint Elizabeths East Campus Infrastructure3. Walter Reed Redevelompent4. Barry Farm, Park Chester, Wade Road5. The Yards Public Infrastructure (DC Water Facility)6. Lincoln Heights, Richardson Dwellings7. Hill East Redevelopment
Information on this map is for illustration only. The user acknowledges and agreesthat the use of this information is at the sole risk of the user. No endorsement, liability, or responsibility for information or opinions
expressed are assumed or accepted by any agency of the DC Government.
Sources: Office of the ChiefTechnology Officer (OCTO)
Executive Office of the Mayor (EOM)Prepared by: dcgis.dc.gov
Date: March 2015Coordinate System:
NAD 1983 State PlaneMaryland FIPS 1900
0 1.5 3 miles N
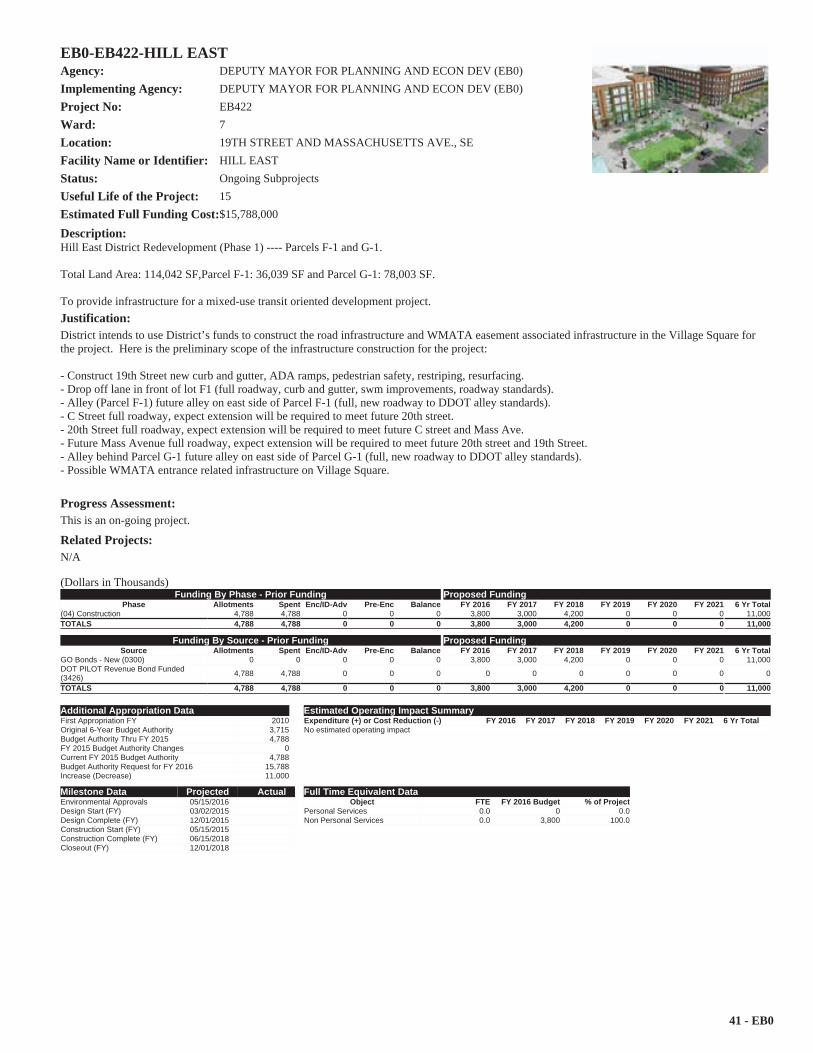
EB0-EB422-HILL EAST Agency: DEPUTY MAYOR FOR PLANNING AND ECON DEV (EB0)Implementing Agency: DEPUTY MAYOR FOR PLANNING AND ECON DEV (EB0)Project No: EB422Ward: 7Location: 19TH STREET AND MASSACHUSETTS AVE., SE Facility Name or Identifier: HILL EAST Status: Ongoing SubprojectsUseful Life of the Project: 15Estimated Full Funding Cost:$15,788,000
Description:Hill East District Redevelopment (Phase 1) ---- Parcels F-1 and G-1.
Total Land Area: 114,042 SF,Parcel F-1: 36,039 SF and Parcel G-1: 78,003 SF.
To provide infrastructure for a mixed-use transit oriented development project.Justification:District intends to use District’s funds to construct the road infrastructure and WMATA easement associated infrastructure in the Village Square for the project. Here is the preliminary scope of the infrastructure construction for the project:
- Construct 19th Street new curb and gutter, ADA ramps, pedestrian safety, restriping, resurfacing.- Drop off lane in front of lot F1 (full roadway, curb and gutter, swm improvements, roadway standards).- Alley (Parcel F-1) future alley on east side of Parcel F-1 (full, new roadway to DDOT alley standards).- C Street full roadway, expect extension will be required to meet future 20th street.- 20th Street full roadway, expect extension will be required to meet future C street and Mass Ave.- Future Mass Avenue full roadway, expect extension will be required to meet future 20th street and 19th Street.- Alley behind Parcel G-1 future alley on east side of Parcel G-1 (full, new roadway to DDOT alley standards).- Possible WMATA entrance related infrastructure on Village Square.
Progress Assessment:This is an on-going project.
Related Projects:N/A
(Dollars in Thousands)Funding By Phase - Prior Funding Proposed Funding
Phase Allotments Spent Enc/ID-Adv Pre-Enc Balance FY 2016 FY 2017 FY 2018 FY 2019 FY 2020 FY 2021 6 Yr Total(04) Construction 4,788 4,788 0 0 0 3,800 3,000 4,200 0 0 0 11,000TOTALS 4,788 4,788 0 0 0 3,800 3,000 4,200 0 0 0 11,000
Funding By Source - Prior Funding Proposed FundingSource Allotments Spent Enc/ID-Adv Pre-Enc Balance FY 2016 FY 2017 FY 2018 FY 2019 FY 2020 FY 2021 6 Yr Total
GO Bonds - New (0300) 0 0 0 0 0 3,800 3,000 4,200 0 0 0 11,000DOT PILOT Revenue Bond Funded (3426) 4,788 4,788 0 0 0 0 0 0 0 0 0 0
TOTALS 4,788 4,788 0 0 0 3,800 3,000 4,200 0 0 0 11,000
Additional Appropriation DataFirst Appropriation FY 2010Original 6-Year Budget Authority 3,715Budget Authority Thru FY 2015 4,788FY 2015 Budget Authority Changes 0Current FY 2015 Budget Authority 4,788Budget Authority Request for FY 2016 15,788Increase (Decrease) 11,000
Estimated Operating Impact SummaryExpenditure (+) or Cost Reduction (-) FY 2016 FY 2017 FY 2018 FY 2019 FY 2020 FY 2021 6 Yr TotalNo estimated operating impact
Milestone Data Projected ActualEnvironmental Approvals 05/15/2016Design Start (FY) 03/02/2015Design Complete (FY) 12/01/2015Construction Start (FY) 05/15/2015Construction Complete (FY) 06/15/2018Closeout (FY) 12/01/2018
Full Time Equivalent DataObject FTE FY 2016 Budget % of Project
Personal Services 0.0 0 0.0Non Personal Services 0.0 3,800 100.0
41 - EB0
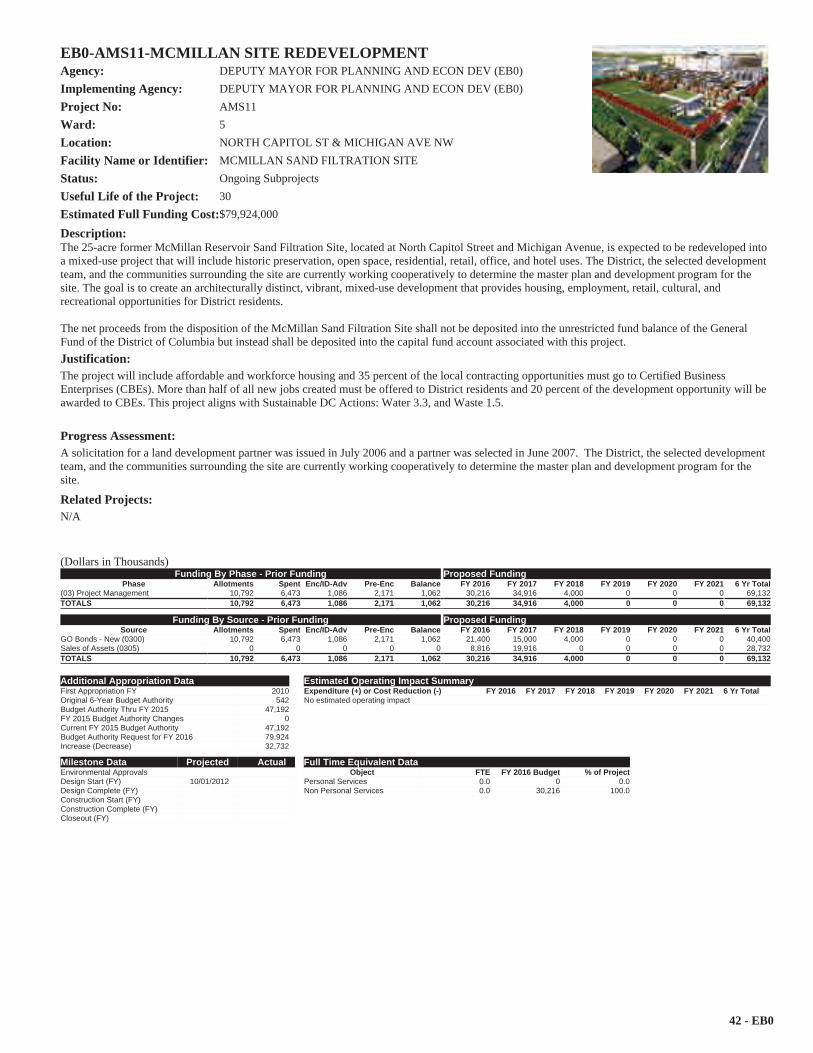
EB0-AMS11-MCMILLAN SITE REDEVELOPMENTAgency: DEPUTY MAYOR FOR PLANNING AND ECON DEV (EB0)Implementing Agency: DEPUTY MAYOR FOR PLANNING AND ECON DEV (EB0)Project No: AMS11Ward: 5Location: NORTH CAPITOL ST & MICHIGAN AVE NWFacility Name or Identifier: MCMILLAN SAND FILTRATION SITEStatus: Ongoing SubprojectsUseful Life of the Project: 30Estimated Full Funding Cost:$79,924,000
Description:The 25-acre former McMillan Reservoir Sand Filtration Site, located at North Capitol Street and Michigan Avenue, is expected to be redeveloped into a mixed-use project that will include historic preservation, open space, residential, retail, office, and hotel uses. The District, the selected development team, and the communities surrounding the site are currently working cooperatively to determine the master plan and development program for the site. The goal is to create an architecturally distinct, vibrant, mixed-use development that provides housing, employment, retail, cultural, and recreational opportunities for District residents.
The net proceeds from the disposition of the McMillan Sand Filtration Site shall not be deposited into the unrestricted fund balance of the General Fund of the District of Columbia but instead shall be deposited into the capital fund account associated with this project.Justification:The project will include affordable and workforce housing and 35 percent of the local contracting opportunities must go to Certified Business Enterprises (CBEs). More than half of all new jobs created must be offered to District residents and 20 percent of the development opportunity will be awarded to CBEs. This project aligns with Sustainable DC Actions: Water 3.3, and Waste 1.5.
Progress Assessment:A solicitation for a land development partner was issued in July 2006 and a partner was selected in June 2007. The District, the selected development team, and the communities surrounding the site are currently working cooperatively to determine the master plan and development program for the site.
Related Projects:N/A
(Dollars in Thousands)Funding By Phase - Prior Funding Proposed Funding
Phase Allotments Spent Enc/ID-Adv Pre-Enc Balance FY 2016 FY 2017 FY 2018 FY 2019 FY 2020 FY 2021 6 Yr Total(03) Project Management 10,792 6,473 1,086 2,171 1,062 30,216 34,916 4,000 0 0 0 69,132TOTALS 10,792 6,473 1,086 2,171 1,062 30,216 34,916 4,000 0 0 0 69,132
Funding By Source - Prior Funding Proposed FundingSource Allotments Spent Enc/ID-Adv Pre-Enc Balance FY 2016 FY 2017 FY 2018 FY 2019 FY 2020 FY 2021 6 Yr Total
GO Bonds - New (0300) 10,792 6,473 1,086 2,171 1,062 21,400 15,000 4,000 0 0 0 40,400Sales of Assets (0305) 0 0 0 0 0 8,816 19,916 0 0 0 0 28,732TOTALS 10,792 6,473 1,086 2,171 1,062 30,216 34,916 4,000 0 0 0 69,132
Additional Appropriation DataFirst Appropriation FY 2010Original 6-Year Budget Authority 542Budget Authority Thru FY 2015 47,192FY 2015 Budget Authority Changes 0Current FY 2015 Budget Authority 47,192Budget Authority Request for FY 2016 79,924Increase (Decrease) 32,732
Estimated Operating Impact SummaryExpenditure (+) or Cost Reduction (-) FY 2016 FY 2017 FY 2018 FY 2019 FY 2020 FY 2021 6 Yr TotalNo estimated operating impact
Milestone Data Projected ActualEnvironmental ApprovalsDesign Start (FY) 10/01/2012Design Complete (FY)Construction Start (FY)Construction Complete (FY)Closeout (FY)
Full Time Equivalent DataObject FTE FY 2016 Budget % of Project
Personal Services 0.0 0 0.0Non Personal Services 0.0 30,216 100.0
42 - EB0
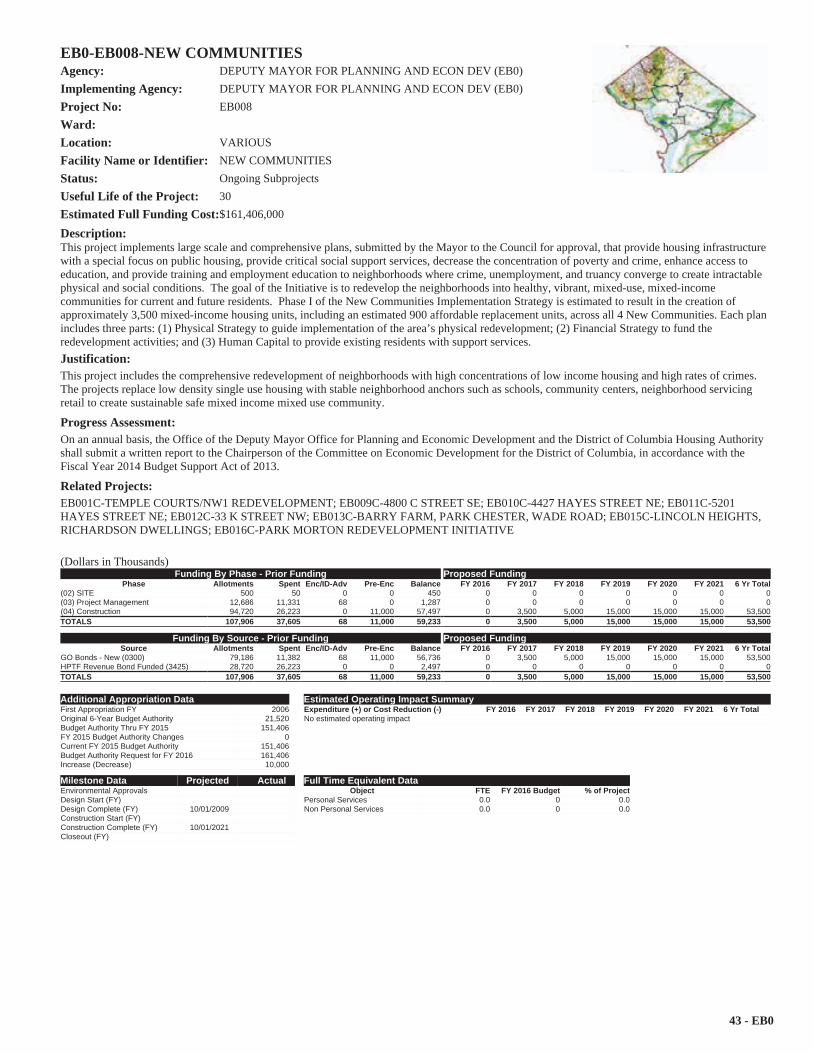
EB0-EB008-NEW COMMUNITIESAgency: DEPUTY MAYOR FOR PLANNING AND ECON DEV (EB0)Implementing Agency: DEPUTY MAYOR FOR PLANNING AND ECON DEV (EB0)Project No: EB008Ward:Location: VARIOUSFacility Name or Identifier: NEW COMMUNITIESStatus: Ongoing SubprojectsUseful Life of the Project: 30Estimated Full Funding Cost:$161,406,000
Description:This project implements large scale and comprehensive plans, submitted by the Mayor to the Council for approval, that provide housing infrastructure with a special focus on public housing, provide critical social support services, decrease the concentration of poverty and crime, enhance access to education, and provide training and employment education to neighborhoods where crime, unemployment, and truancy converge to create intractable physical and social conditions. The goal of the Initiative is to redevelop the neighborhoods into healthy, vibrant, mixed-use, mixed-income communities for current and future residents. Phase I of the New Communities Implementation Strategy is estimated to result in the creation of approximately 3,500 mixed-income housing units, including an estimated 900 affordable replacement units, across all 4 New Communities. Each plan includes three parts: (1) Physical Strategy to guide implementation of the area’s physical redevelopment; (2) Financial Strategy to fund the redevelopment activities; and (3) Human Capital to provide existing residents with support services.Justification:This project includes the comprehensive redevelopment of neighborhoods with high concentrations of low income housing and high rates of crimes.The projects replace low density single use housing with stable neighborhood anchors such as schools, community centers, neighborhood servicing retail to create sustainable safe mixed income mixed use community.
Progress Assessment:On an annual basis, the Office of the Deputy Mayor Office for Planning and Economic Development and the District of Columbia Housing Authority shall submit a written report to the Chairperson of the Committee on Economic Development for the District of Columbia, in accordance with the Fiscal Year 2014 Budget Support Act of 2013.
Related Projects:EB001C-TEMPLE COURTS/NW1 REDEVELOPMENT; EB009C-4800 C STREET SE; EB010C-4427 HAYES STREET NE; EB011C-5201 HAYES STREET NE; EB012C-33 K STREET NW; EB013C-BARRY FARM, PARK CHESTER, WADE ROAD; EB015C-LINCOLN HEIGHTS, RICHARDSON DWELLINGS; EB016C-PARK MORTON REDEVELOPMENT INITIATIVE
(Dollars in Thousands)Funding By Phase - Prior Funding Proposed Funding
Phase Allotments Spent Enc/ID-Adv Pre-Enc Balance FY 2016 FY 2017 FY 2018 FY 2019 FY 2020 FY 2021 6 Yr Total(02) SITE 500 50 0 0 450 0 0 0 0 0 0 0(03) Project Management 12,686 11,331 68 0 1,287 0 0 0 0 0 0 0(04) Construction 94,720 26,223 0 11,000 57,497 0 3,500 5,000 15,000 15,000 15,000 53,500TOTALS 107,906 37,605 68 11,000 59,233 0 3,500 5,000 15,000 15,000 15,000 53,500
Funding By Source - Prior Funding Proposed FundingSource Allotments Spent Enc/ID-Adv Pre-Enc Balance FY 2016 FY 2017 FY 2018 FY 2019 FY 2020 FY 2021 6 Yr Total
GO Bonds - New (0300) 79,186 11,382 68 11,000 56,736 0 3,500 5,000 15,000 15,000 15,000 53,500HPTF Revenue Bond Funded (3425) 28,720 26,223 0 0 2,497 0 0 0 0 0 0 0TOTALS 107,906 37,605 68 11,000 59,233 0 3,500 5,000 15,000 15,000 15,000 53,500
Additional Appropriation DataFirst Appropriation FY 2006Original 6-Year Budget Authority 21,520Budget Authority Thru FY 2015 151,406FY 2015 Budget Authority Changes 0Current FY 2015 Budget Authority 151,406Budget Authority Request for FY 2016 161,406Increase (Decrease) 10,000
Estimated Operating Impact SummaryExpenditure (+) or Cost Reduction (-) FY 2016 FY 2017 FY 2018 FY 2019 FY 2020 FY 2021 6 Yr TotalNo estimated operating impact
Milestone Data Projected ActualEnvironmental ApprovalsDesign Start (FY)Design Complete (FY) 10/01/2009Construction Start (FY)Construction Complete (FY) 10/01/2021Closeout (FY)
Full Time Equivalent DataObject FTE FY 2016 Budget % of Project
Personal Services 0.0 0 0.0Non Personal Services 0.0 0 0.0
43 - EB0
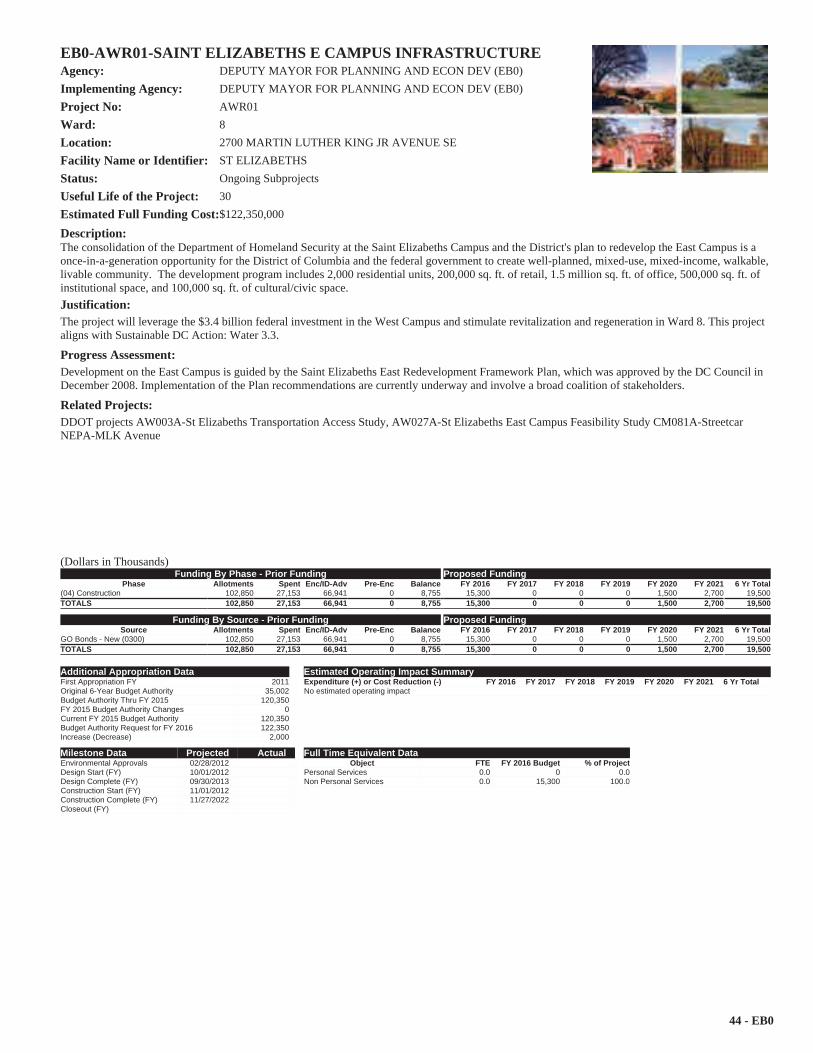
EB0-AWR01-SAINT ELIZABETHS E CAMPUS INFRASTRUCTUREAgency: DEPUTY MAYOR FOR PLANNING AND ECON DEV (EB0)Implementing Agency: DEPUTY MAYOR FOR PLANNING AND ECON DEV (EB0)Project No: AWR01Ward: 8Location: 2700 MARTIN LUTHER KING JR AVENUE SEFacility Name or Identifier: ST ELIZABETHSStatus: Ongoing SubprojectsUseful Life of the Project: 30Estimated Full Funding Cost:$122,350,000
Description:The consolidation of the Department of Homeland Security at the Saint Elizabeths Campus and the District's plan to redevelop the East Campus is a once-in-a-generation opportunity for the District of Columbia and the federal government to create well-planned, mixed-use, mixed-income, walkable, livable community. The development program includes 2,000 residential units, 200,000 sq. ft. of retail, 1.5 million sq. ft. of office, 500,000 sq. ft. of institutional space, and 100,000 sq. ft. of cultural/civic space.Justification:The project will leverage the $3.4 billion federal investment in the West Campus and stimulate revitalization and regeneration in Ward 8. This project aligns with Sustainable DC Action: Water 3.3.
Progress Assessment:Development on the East Campus is guided by the Saint Elizabeths East Redevelopment Framework Plan, which was approved by the DC Council in December 2008. Implementation of the Plan recommendations are currently underway and involve a broad coalition of stakeholders.
Related Projects:DDOT projects AW003A-St Elizabeths Transportation Access Study, AW027A-St Elizabeths East Campus Feasibility Study CM081A-StreetcarNEPA-MLK Avenue
(Dollars in Thousands)Funding By Phase - Prior Funding Proposed Funding
Phase Allotments Spent Enc/ID-Adv Pre-Enc Balance FY 2016 FY 2017 FY 2018 FY 2019 FY 2020 FY 2021 6 Yr Total(04) Construction 102,850 27,153 66,941 0 8,755 15,300 0 0 0 1,500 2,700 19,500TOTALS 102,850 27,153 66,941 0 8,755 15,300 0 0 0 1,500 2,700 19,500
Funding By Source - Prior Funding Proposed FundingSource Allotments Spent Enc/ID-Adv Pre-Enc Balance FY 2016 FY 2017 FY 2018 FY 2019 FY 2020 FY 2021 6 Yr Total
GO Bonds - New (0300) 102,850 27,153 66,941 0 8,755 15,300 0 0 0 1,500 2,700 19,500TOTALS 102,850 27,153 66,941 0 8,755 15,300 0 0 0 1,500 2,700 19,500
Additional Appropriation DataFirst Appropriation FY 2011Original 6-Year Budget Authority 35,002Budget Authority Thru FY 2015 120,350FY 2015 Budget Authority Changes 0Current FY 2015 Budget Authority 120,350Budget Authority Request for FY 2016 122,350Increase (Decrease) 2,000
Estimated Operating Impact SummaryExpenditure (+) or Cost Reduction (-) FY 2016 FY 2017 FY 2018 FY 2019 FY 2020 FY 2021 6 Yr TotalNo estimated operating impact
Milestone Data Projected ActualEnvironmental Approvals 02/28/2012Design Start (FY) 10/01/2012Design Complete (FY) 09/30/2013Construction Start (FY) 11/01/2012Construction Complete (FY) 11/27/2022Closeout (FY)
Full Time Equivalent DataObject FTE FY 2016 Budget % of Project
Personal Services 0.0 0 0.0Non Personal Services 0.0 15,300 100.0
44 - EB0
EB0-ASC13-SKYLAND SHOPPING CENTERAgency: DEPUTY MAYOR FOR PLANNING AND ECON DEV (EB0)Implementing Agency: DEPUTY MAYOR FOR PLANNING AND ECON DEV (EB0)Project No: ASC13Ward: 7Location: ALABAMA AVE & GOOD HOPE RD SEFacility Name or Identifier: SKYLAND SHOPPING CENTERStatus: Ongoing SubprojectsUseful Life of the Project: 30Estimated Full Funding Cost:$16,485,000
Description:The Skyland Shopping Center is an underutilized, non-contiguous shopping center with 15 owners, non-retail uses, compromised buildings, no anchor tenant, and no coherent leasing strategy. The site will be redeveloped with approximately 20 townhouses, 10 live/work, 440 apartment units, 145,000 square feet of retail, 195,389 other commercial uses, 311 surface parking spaces, and 1,433 structured parking spaces. This additional funding will complete site infrastructure improvements necessary for commercial development to begin.Justification:The project will eliminate slum and blight and create retail and housing options for the residents of Ward 7.
Progress Assessment:Legal issues associated with the project are resolved, and the District is working closely with the development team and its architects, Torti Gallas & Partners, to accelerate the pre-development work so the project moves on a parallel track with the legal process.
Related Projects:NA
(Dollars in Thousands)Funding By Phase - Prior Funding Proposed Funding
Phase Allotments Spent Enc/ID-Adv Pre-Enc Balance FY 2016 FY 2017 FY 2018 FY 2019 FY 2020 FY 2021 6 Yr Total(04) Construction 15,985 9,735 354 5,500 396 500 0 0 0 0 0 500TOTALS 15,985 9,735 354 5,500 396 500 0 0 0 0 0 500
Funding By Source - Prior Funding Proposed FundingSource Allotments Spent Enc/ID-Adv Pre-Enc Balance FY 2016 FY 2017 FY 2018 FY 2019 FY 2020 FY 2021 6 Yr Total
GO Bonds - New (0300) 15,985 9,735 354 5,500 396 500 0 0 0 0 0 500TOTALS 15,985 9,735 354 5,500 396 500 0 0 0 0 0 500
Additional Appropriation DataFirst Appropriation FY 2011Original 6-Year Budget Authority 485Budget Authority Thru FY 2015 19,193FY 2015 Budget Authority Changes
Reprogrammings YTD for FY 2015 -3,208Current FY 2015 Budget Authority 15,985Budget Authority Request for FY 2016 16,485Increase (Decrease) 500
Estimated Operating Impact SummaryExpenditure (+) or Cost Reduction (-) FY 2016 FY 2017 FY 2018 FY 2019 FY 2020 FY 2021 6 Yr TotalNo estimated operating impact
Milestone Data Projected ActualEnvironmental ApprovalsDesign Start (FY) 06/01/2012 06/01/2011Design Complete (FY) 11/30/2012Construction Start (FY) 03/01/2013Construction Complete (FY) 09/30/2016Closeout (FY)
Full Time Equivalent DataObject FTE FY 2016 Budget % of Project
Personal Services 0.0 0 0.0Non Personal Services 0.0 500 100.0
45 - EB0
EB0-AWT01-WALTER REED REDEVELOPMENTAgency: DEPUTY MAYOR FOR PLANNING AND ECON DEV (EB0)Implementing Agency: DEPUTY MAYOR FOR PLANNING AND ECON DEV (EB0)Project No: AWT01Ward: 4Location: 6900 GEORGIA AVENUE NWFacility Name or Identifier: WALTER REED HOSPITAL SITEStatus: Ongoing SubprojectsUseful Life of the Project: 30Estimated Full Funding Cost:$33,798,000
Description:This project takes a former military installation and reintegrates 62 acres into the fabric of Ward 4. The project will catalyze the redevelopment of Upper Georgia Ave by taking down the previously gated campus and creating new mixed-use opportunities along this key gateway into the District.Justification:The District Government, as the local redevelopment authority formally recognized by the US Department of Defense, has undertaken the responsibility of developing a homeless accommodation and reuse plan for the 62.5 acre surplus portion of the WRAMC. The costs for this project are 90% funded by a federal grant from the Department of Defense with a 10% District match. Under BRAC law, each LRA is required to submit its reuse and homeless plan to HUD 270 days from the submission deadline for all notices of interest. For WRAMC, that deadline was November 30, 2010. Successful implementation of the plan will result in an integration of this 60+ acres into the community making the over 40+ acres of green/open space available to the community. The proposed commercial development is estimated to result in annual tax revenues in excess of $18 million. The proposed reuse plan is consistent with the comprehensive plan and incorporates policy priorities of the Mayor. This project aligns with Sustainable DC Action: Water 3.3.
Progress Assessment:The project is progressing as planned.
Related Projects:Fire and Emergency Medical Services project LC437C-Engine 22 Firehouse Replacement.
(Dollars in Thousands)Funding By Phase - Prior Funding Proposed Funding
Phase Allotments Spent Enc/ID-Adv Pre-Enc Balance FY 2016 FY 2017 FY 2018 FY 2019 FY 2020 FY 2021 6 Yr Total(04) Construction 4,798 1,673 1,078 0 2,047 10,000 11,000 2,000 2,000 2,000 2,000 29,000TOTALS 4,798 1,673 1,078 0 2,047 10,000 11,000 2,000 2,000 2,000 2,000 29,000
Funding By Source - Prior Funding Proposed FundingSource Allotments Spent Enc/ID-Adv Pre-Enc Balance FY 2016 FY 2017 FY 2018 FY 2019 FY 2020 FY 2021 6 Yr Total
GO Bonds - New (0300) 4,798 1,673 1,078 0 2,047 5,000 6,000 1,000 1,000 1,000 1,000 15,000Sales of Assets (0305) 0 0 0 0 0 5,000 5,000 1,000 1,000 1,000 1,000 14,000TOTALS 4,798 1,673 1,078 0 2,047 10,000 11,000 2,000 2,000 2,000 2,000 29,000
Additional Appropriation DataFirst Appropriation FY 2011Original 6-Year Budget Authority 1,500Budget Authority Thru FY 2015 4,798FY 2015 Budget Authority Changes 0Current FY 2015 Budget Authority 4,798Budget Authority Request for FY 2016 33,798Increase (Decrease) 29,000
Estimated Operating Impact SummaryExpenditure (+) or Cost Reduction (-) FY 2016 FY 2017 FY 2018 FY 2019 FY 2020 FY 2021 6 Yr TotalNo estimated operating impact
Milestone Data Projected ActualEnvironmental Approvals 08/20/2014Design Start (FY) 07/01/2011Design Complete (FY) 06/01/2012Construction Start (FY) 11/01/2014Construction Complete (FY) 09/30/2021Closeout (FY)
Full Time Equivalent DataObject FTE FY 2016 Budget % of Project
Personal Services 0.0 0 0.0Non Personal Services 0.0 10,000 100.0
46 - EB0
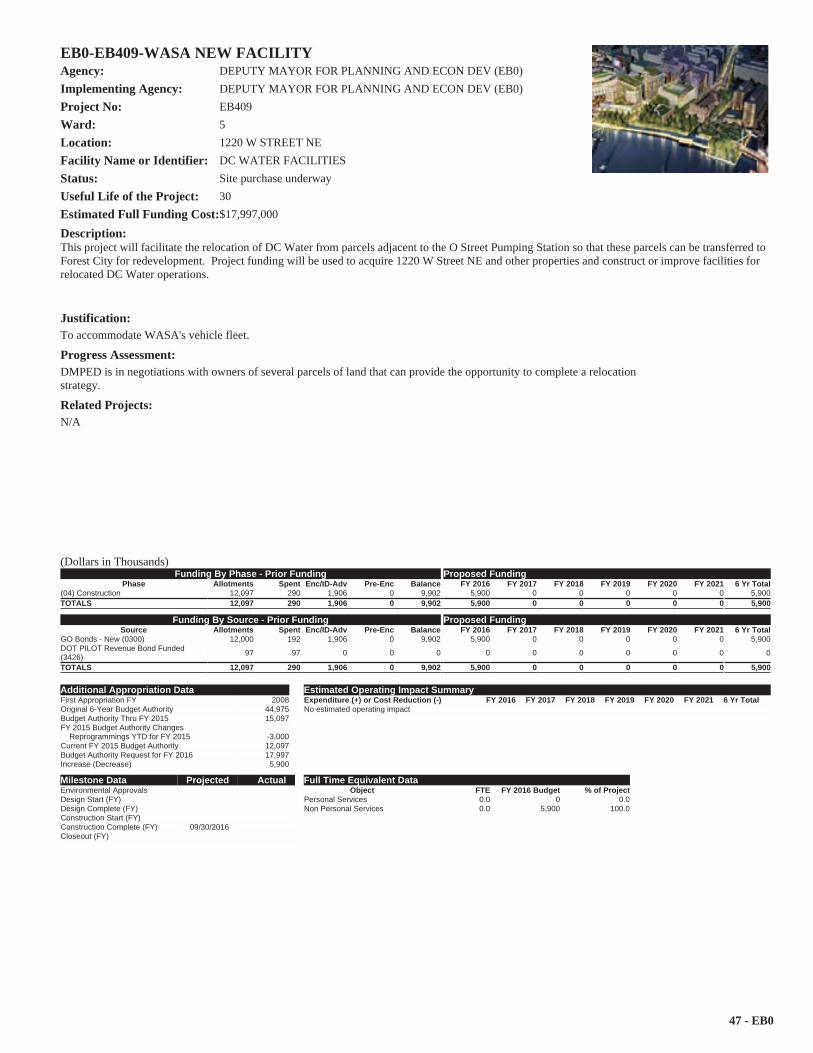
EB0-EB409-WASA NEW FACILITYAgency: DEPUTY MAYOR FOR PLANNING AND ECON DEV (EB0)Implementing Agency: DEPUTY MAYOR FOR PLANNING AND ECON DEV (EB0)Project No: EB409Ward: 5Location: 1220 W STREET NEFacility Name or Identifier: DC WATER FACILITIESStatus: Site purchase underwayUseful Life of the Project: 30Estimated Full Funding Cost:$17,997,000
Description:This project will facilitate the relocation of DC Water from parcels adjacent to the O Street Pumping Station so that these parcels can be transferred to Forest City for redevelopment. Project funding will be used to acquire 1220 W Street NE and other properties and construct or improve facilities for relocated DC Water operations.
Justification:To accommodate WASA's vehicle fleet.
Progress Assessment:DMPED is in negotiations with owners of several parcels of land that can provide the opportunity to complete a relocationstrategy.
Related Projects:N/A
(Dollars in Thousands)Funding By Phase - Prior Funding Proposed Funding
Phase Allotments Spent Enc/ID-Adv Pre-Enc Balance FY 2016 FY 2017 FY 2018 FY 2019 FY 2020 FY 2021 6 Yr Total(04) Construction 12,097 290 1,906 0 9,902 5,900 0 0 0 0 0 5,900TOTALS 12,097 290 1,906 0 9,902 5,900 0 0 0 0 0 5,900
Funding By Source - Prior Funding Proposed FundingSource Allotments Spent Enc/ID-Adv Pre-Enc Balance FY 2016 FY 2017 FY 2018 FY 2019 FY 2020 FY 2021 6 Yr Total
GO Bonds - New (0300) 12,000 192 1,906 0 9,902 5,900 0 0 0 0 0 5,900DOT PILOT Revenue Bond Funded (3426) 97 97 0 0 0 0 0 0 0 0 0 0
TOTALS 12,097 290 1,906 0 9,902 5,900 0 0 0 0 0 5,900
Additional Appropriation DataFirst Appropriation FY 2008Original 6-Year Budget Authority 44,975Budget Authority Thru FY 2015 15,097FY 2015 Budget Authority Changes
Reprogrammings YTD for FY 2015 -3,000Current FY 2015 Budget Authority 12,097Budget Authority Request for FY 2016 17,997Increase (Decrease) 5,900
Estimated Operating Impact SummaryExpenditure (+) or Cost Reduction (-) FY 2016 FY 2017 FY 2018 FY 2019 FY 2020 FY 2021 6 Yr TotalNo estimated operating impact
Milestone Data Projected ActualEnvironmental ApprovalsDesign Start (FY)Design Complete (FY)Construction Start (FY)Construction Complete (FY) 09/30/2016Closeout (FY)
Full Time Equivalent DataObject FTE FY 2016 Budget % of Project
Personal Services 0.0 0 0.0Non Personal Services 0.0 5,900 100.0
47 - EB0

This page is intentionally left blank.
(FA0) METROPOLITAN POLICE DEPARTMENT
49 - FA0
Elements on this page of the Agency Summary include:
Funding Tables: Past budget allotments show the allotment balance, calculated as allotments received to date less all obligations (the sum of expenditures, encumbrances, intra-District advances and pre-encumbrances). Agencies are allowed to encumber and pre-encumber funds up to the limit of a capital project’s budget authority, which might be higher than allotments received to date. For this reason, a negative balance on a projectsheet does not necessarily indicate overspending or an anti-deficiency violation. A negative balance is permitted in this calculation of remaining allotment authority. Additional Appropriations Data ($000): Provides a summary of the budget authority over the life of the project. The table can be read as
follows: Original 6-Year Budget Authority: Represents the authority from the fiscal year in which budget was first appropriated through the next
5 years.
Budget Authority Thru FY 2020 : Represents the lifetime budget authority, including the 6 year budget authority for FY 2015 through 2020
FY 2015 Budget Authority Revisions: Represents the changes to the budget authority as a result of reprogramming, redirections and rescissions (also reflected in Appendix F) for the current fiscal year.
6-Year Budget Authority Thru 2020 : This is the total 6-year authority for FY 2015 through FY 2020 including changes from the current fiscal year.
Budget Authority Request for 2016 through 2021 : Represents the 6 year budget authority for 2016 through 2021
Increase (Decrease) : This is the change in 6 year budget requested for FY 2016 - FY 2021 (change in budget authority is shown in Appendix A).
Estimated Operating Impact: If a project has operating impacts that the agency has quantified, the effects are summarized in the respective year of impact FTE Data (Total budget in FTE Table might differ from actual budget due to rounding): Provides the number for Full Time
Equivalent (FTE) employees approved as eligible to be charged to capital projects by, or on behalf of, the agency. Additionally it provides the total budget for these employees (Personal Services), the non personnel portion of the budget in the agency’s capital plan and, the percentage of the agency CIP budget from either expense category. Facility Location Map: For those agencies with facilities projects, a map reflecting projects and their geographic location within the District
of Columbia.
(Dollars in Thousands)Funding By Phase - Prior Funding Proposed Funding
Phase Allotments Spent Enc/ID-Adv Pre-Enc Balance FY 2016 FY 2017 FY 2018 FY 2019 FY 2020 FY 2021 6 Yr Total(01) Design 2,750 2,459 194 4 93 0 0 0 0 0 0 0(02) SITE 846 841 5 0 0 0 0 0 0 0 0 0(03) Project Management 471 471 0 0 0 0 0 0 0 0 0 0(04) Construction 62,182 49,893 6,294 903 5,092 500 0 0 3,000 3,000 3,000 9,500(05) Equipment 102,539 94,201 4,636 1,418 2,283 6,500 6,500 0 10,000 10,000 0 33,000(06) IT Requirements Development/SystemsDesign
13,200 12,710 490 0 0 0 0 0 0 0 0 0
(07) IT Development & Testing 4,803 4,799 4 0 0 0 0 0 0 0 0 0
(08) IT Deployment & Turnover 716 716 0 0 0 0 0 0 0 0 0 0
TOTALS 187,507 166,092 11,622 2,325 7,468 7,000 6,500 0 13,000 13,000 3,000 42,500
Funding By Source - Prior Funding Proposed FundingSource Allotments Spent Enc/ID-Adv Pre-Enc Balance FY 2016 FY 2017 FY 2018 FY 2019 FY 2020 FY 2021 6 Yr Total
GO Bonds - New (0300) 96,051 83,365 7,252 1,251 4,182 2,000 0 0 3,000 3,000 3,000 11,000Pay Go (0301) 26,093 24,921 159 0 1,012 0 0 0 0 0 0 0Equipment Lease (0302) 61,864 54,306 4,210 1,074 2,274 5,000 6,500 0 10,000 10,000 0 31,500Local Transportation Revenue (0330) 1,500 1,500 0 0 0 0 0 0 0 0 0 0
LRMF - Bus Shelter Ad Revenue (0333) 2,000 2,000 0 0 0 0 0 0 0 0 0 0
TOTALS 187,507 166,092 11,622 2,325 7,468 7,000 6,500 0 13,000 13,000 3,000 42,500
Additional Appropriation DataFirst Appropriation FY 1999Original 6-Year Budget Authority 174,963Budget Authority Thru FY 2015 217,055FY 2015 Budget Authority Changes
Reprogrammings YTD for FY 2015 4,452Current FY 2015 Budget Authority 221,507Budget Authority Request for FY 2016 230,007Increase (Decrease) 8,500
Estimated Operating Impact SummaryExpenditure (+) or Cost Reduction (-) FY 2016 FY 2017 FY 2018 FY 2019 FY 2020 FY 2021 6 Yr TotalNo estimated operating impact
Full Time Equivalent DataObject FTE FY 2016 Budget % of Project
Personal Services 0.0 0 0.0Non Personal Services 0.0 7,000 100.0
50 - FA0
AM0-PL110-MPD SCHEDULED CAPITAL IMPROVEMENTSAgency: METROPOLITAN POLICE DEPARTMENT (FA0)Implementing Agency: DEPARTMENT OF GENERAL SERVICES (AM0)Project No: PL110Ward:Location: DISTRICT-WIDEFacility Name or Identifier: VARIOUSStatus: Ongoing SubprojectsUseful Life of the Project: 10Estimated Full Funding Cost:$30,637,000
Description:This project will address deferred facility needs of the Department by implementing infrastructure upgrades and quality of life improvements to community police stations, the police academy, and other police facilities. The scope of work includes upgrades to mechanical, electrical and plumbing (MEP) systems, to exterior security and conveying systems, and, to fire alarm and fire suppression systems. The scope also includes the major repair and replacement of roofs and windows; ADA upgrades (signage, accessible entry, parking, restrooms, etc.); fluourescent lighting systems with energy efficient lamps and electronic ballasts.Justification:Most of the District-owned police facilities are beyond the useful life identified in MPD’s 1998 and 2005 Condition Assessment reports and need infrastructure upgrades.
Progress Assessment:The project is progressing as planned.
Related Projects:DGS project PL902C-Critical System Replacement
(Dollars in Thousands)Funding By Phase - Prior Funding Proposed Funding
Phase Allotments Spent Enc/ID-Adv Pre-Enc Balance FY 2016 FY 2017 FY 2018 FY 2019 FY 2020 FY 2021 6 Yr Total(01) Design 1,216 1,010 109 0 97 0 0 0 0 0 0 0(02) SITE 846 841 5 0 0 0 0 0 0 0 0 0(03) Project Management 100 100 0 0 0 0 0 0 0 0 0 0(04) Construction 18,974 16,122 381 903 1,568 500 0 0 3,000 3,000 3,000 9,500TOTALS 21,137 18,074 495 903 1,665 500 0 0 3,000 3,000 3,000 9,500
Funding By Source - Prior Funding Proposed FundingSource Allotments Spent Enc/ID-Adv Pre-Enc Balance FY 2016 FY 2017 FY 2018 FY 2019 FY 2020 FY 2021 6 Yr Total
GO Bonds - New (0300) 8,495 6,545 394 903 653 500 0 0 3,000 3,000 3,000 9,500Pay Go (0301) 11,142 10,029 100 0 1,012 0 0 0 0 0 0 0Local Transportation Revenue (0330) 1,500 1,500 0 0 0 0 0 0 0 0 0 0TOTALS 21,137 18,074 495 903 1,665 500 0 0 3,000 3,000 3,000 9,500
Additional Appropriation DataFirst Appropriation FY 2012Original 6-Year Budget Authority 32,387Budget Authority Thru FY 2015 27,137FY 2015 Budget Authority Changes 0Current FY 2015 Budget Authority 27,137Budget Authority Request for FY 2016 30,637Increase (Decrease) 3,500
Estimated Operating Impact SummaryExpenditure (+) or Cost Reduction (-) FY 2016 FY 2017 FY 2018 FY 2019 FY 2020 FY 2021 6 Yr TotalNo estimated operating impact
Milestone Data Projected ActualEnvironmental ApprovalsDesign Start (FY) 10/01/2009Design Complete (FY) 10/01/2010Construction Start (FY) 10/01/2010Construction Complete (FY) 09/30/2020Closeout (FY) 09/30/2021
Full Time Equivalent DataObject FTE FY 2016 Budget % of Project
Personal Services 0.0 0 0.0Non Personal Services 0.0 500 100.0
51 - FA0
ELC-PEQ20-SPECIALIZED VEHICLES - MPDAgency: METROPOLITAN POLICE DEPARTMENT (FA0)Implementing Agency: EQUIPMENT LEASE - CAPITAL (ELC)Project No: PEQ20Ward:Location: DISTRICT-WIDEFacility Name or Identifier: VEHICLESStatus: Ongoing SubprojectsUseful Life of the Project: 5Estimated Full Funding Cost:$106,736,000
Description:Project requirements are to support the annual replacement of the Police patrol cars for MPD, currently on a 5 year replacement schedule. As part of the Public Justice cluster, MPD requires the replacement vehicles to support daily police operations, as required by law and the citizens of the District of Columbia to preserve law and order within the District. The goal is to maintain the existing fleet of police vehicles according to an established replacement cycle. This project's budget returns the MPD to a required funding level.Justification:MPD’s fleet program is a part of the citywide Master Lease program. MPD maintains 1,639 vehicles in the fleet including 802 marked cruisers, 409 unmarked cruisers, and 428 specialty/support vehicles. The Department seeks to continue the replacement cycle of patrol cars, motorcycles and related equipment required to operate these vehicles. The replacement schedule for FY 2009 and FY 2010 has been modified to account for the reduced funding levels. Long term projections on impact have not been completed. This project aligns with SustainableDC Action: Transportation 4.2.
Progress Assessment:MPD will continue to replace vehicles in accordance with the preferred replacement cycle for patrol vehicles.
Related Projects:PEQ22C-Specialized Vehicles-MPD
(Dollars in Thousands)Funding By Phase - Prior Funding Proposed Funding
Phase Allotments Spent Enc/ID-Adv Pre-Enc Balance FY 2016 FY 2017 FY 2018 FY 2019 FY 2020 FY 2021 6 Yr Total(05) Equipment 75,236 71,014 4,197 0 24 5,000 6,500 0 10,000 10,000 0 31,500TOTALS 75,236 71,014 4,197 0 24 5,000 6,500 0 10,000 10,000 0 31,500
Funding By Source - Prior Funding Proposed FundingSource Allotments Spent Enc/ID-Adv Pre-Enc Balance FY 2016 FY 2017 FY 2018 FY 2019 FY 2020 FY 2021 6 Yr Total
GO Bonds - New (0300) 21,324 21,316 0 0 8 0 0 0 0 0 0 0Equipment Lease (0302) 53,912 49,699 4,197 0 16 5,000 6,500 0 10,000 10,000 0 31,500TOTALS 75,236 71,014 4,197 0 24 5,000 6,500 0 10,000 10,000 0 31,500
Additional Appropriation DataFirst Appropriation FY 1999Original 6-Year Budget Authority 21,200Budget Authority Thru FY 2015 100,236FY 2015 Budget Authority Changes 0Current FY 2015 Budget Authority 100,236Budget Authority Request for FY 2016 106,736Increase (Decrease) 6,500
Estimated Operating Impact SummaryExpenditure (+) or Cost Reduction (-) FY 2016 FY 2017 FY 2018 FY 2019 FY 2020 FY 2021 6 Yr TotalNo estimated operating impact
Milestone Data Projected ActualEnvironmental ApprovalsDesign Start (FY)Design Complete (FY)Construction Start (FY)Construction Complete (FY)Closeout (FY) 09/30/2021
Full Time Equivalent DataObject FTE FY 2016 Budget % of Project
Personal Services 0.0 0 0.0Non Personal Services 0.0 5,000 100.0
52 - FA0
FA0-PEQ22-SPECIALIZED VEHICLES - MPDAgency: METROPOLITAN POLICE DEPARTMENT (FA0)Implementing Agency: METROPOLITAN POLICE DEPARTMENT (FA0)Project No: PEQ22Ward:Location: DISTRICT-WIDEFacility Name or Identifier: VEHICLESStatus: Ongoing SubprojectsUseful Life of the Project: 5Estimated Full Funding Cost:$11,283,000
Description:Project requirements are to support the annual replacement of the Police patrol cars for MPD, currently on a 5 year replacement schedule. As part of the Public Justice cluster, MPD requires the replacement vehicles to support the daily police operations, required by law and the citizens of the District of Columbia to preserve law and order within the District. The goal is to maintain the existing fleet of police vehicles according to an established replacement cycle. This budget returns MPD to the required funding level.Justification:MPD maintains 1,639 vehicles in its fleet including 802 marked cruisers, 409 unmarked cruisers, and 428 speciality/support vehicles.
Progress Assessment:This project is ongoing to facilitate more rapid replacement of fleet vehicles.
Related Projects:PEQ20C-Specialized Vehicles-MPD master lease project
(Dollars in Thousands)Funding By Phase - Prior Funding Proposed Funding
Phase Allotments Spent Enc/ID-Adv Pre-Enc Balance FY 2016 FY 2017 FY 2018 FY 2019 FY 2020 FY 2021 6 Yr Total(05) Equipment 9,783 9,308 430 44 1 1,500 0 0 0 0 0 1,500TOTALS 9,783 9,308 430 44 1 1,500 0 0 0 0 0 1,500
Funding By Source - Prior Funding Proposed FundingSource Allotments Spent Enc/ID-Adv Pre-Enc Balance FY 2016 FY 2017 FY 2018 FY 2019 FY 2020 FY 2021 6 Yr Total
GO Bonds - New (0300) 5,553 5,078 430 44 1 1,500 0 0 0 0 0 1,500Pay Go (0301) 4,230 4,230 0 0 0 0 0 0 0 0 0 0TOTALS 9,783 9,308 430 44 1 1,500 0 0 0 0 0 1,500
Additional Appropriation DataFirst Appropriation FY 2012Original 6-Year Budget Authority 9,688Budget Authority Thru FY 2015 12,783FY 2015 Budget Authority Changes 0Current FY 2015 Budget Authority 12,783Budget Authority Request for FY 2016 11,283Increase (Decrease) -1,500
Estimated Operating Impact SummaryExpenditure (+) or Cost Reduction (-) FY 2016 FY 2017 FY 2018 FY 2019 FY 2020 FY 2021 6 Yr TotalNo estimated operating impact
Milestone Data Projected ActualEnvironmental ApprovalsDesign Start (FY)Design Complete (FY)Construction Start (FY)Construction Complete (FY)Closeout (FY)
Full Time Equivalent DataObject FTE FY 2016 Budget % of Project
Personal Services 0.0 0 0.0Non Personal Services 0.0 1,500 100.0
53 - FA0

This page is intentionally left blank.
(FB0) FIRE AND EMERGENCY MEDICAL SERVICES
55 - FB0
Elements on this page of the Agency Summary include:
Funding Tables: Past budget allotments show the allotment balance, calculated as allotments received to date less all obligations (the sum of expenditures, encumbrances, intra-District advances and pre-encumbrances). Agencies are allowed to encumber and pre-encumber funds up to the limit of a capital project’s budget authority, which might be higher than allotments received to date. For this reason, a negative balance on a projectsheet does not necessarily indicate overspending or an anti-deficiency violation. A negative balance is permitted in this calculation of remaining allotment authority. Additional Appropriations Data ($000): Provides a summary of the budget authority over the life of the project. The table can be read as
follows: Original 6-Year Budget Authority: Represents the authority from the fiscal year in which budget was first appropriated through the next
5 years.
Budget Authority Thru FY 2020 : Represents the lifetime budget authority, including the 6 year budget authority for FY 2015 through 2020
FY 2015 Budget Authority Revisions: Represents the changes to the budget authority as a result of reprogramming, redirections and rescissions (also reflected in Appendix F) for the current fiscal year.
6-Year Budget Authority Thru 2020 : This is the total 6-year authority for FY 2015 through FY 2020 including changes from the current fiscal year.
Budget Authority Request for 2016 through 2021 : Represents the 6 year budget authority for 2016 through 2021
Increase (Decrease) : This is the change in 6 year budget requested for FY 2016 - FY 2021 (change in budget authority is shown in Appendix A).
Estimated Operating Impact: If a project has operating impacts that the agency has quantified, the effects are summarized in the respective year of impact FTE Data (Total budget in FTE Table might differ from actual budget due to rounding): Provides the number for Full Time
Equivalent (FTE) employees approved as eligible to be charged to capital projects by, or on behalf of, the agency. Additionally it provides the total budget for these employees (Personal Services), the non personnel portion of the budget in the agency’s capital plan and, the percentage of the agency CIP budget from either expense category. Facility Location Map: For those agencies with facilities projects, a map reflecting projects and their geographic location within the District
of Columbia.
(Dollars in Thousands)Funding By Phase - Prior Funding Proposed Funding
Phase Allotments Spent Enc/ID-Adv Pre-Enc Balance FY 2016 FY 2017 FY 2018 FY 2019 FY 2020 FY 2021 6 Yr Total(01) Design 10,396 6,276 2,158 0 1,962 0 0 0 0 0 0 0(02) SITE 250 0 0 0 250 0 0 0 0 0 0 0(03) Project Management 6,125 4,299 873 7 946 0 0 0 0 0 0 0(04) Construction 72,312 39,638 8,055 9,851 14,768 1,000 0 0 10,250 11,000 2,500 24,750(05) Equipment 150,237 131,583 13,204 1,100 4,350 16,000 15,000 15,000 17,800 17,000 0 80,800TOTALS 239,320 181,796 24,290 10,958 22,276 17,000 15,000 15,000 28,050 28,000 2,500 105,550
Funding By Source - Prior Funding Proposed FundingSource Allotments Spent Enc/ID-Adv Pre-Enc Balance FY 2016 FY 2017 FY 2018 FY 2019 FY 2020 FY 2021 6 Yr Total
GO Bonds - New (0300) 169,633 126,607 17,399 9,920 15,707 8,000 15,000 15,000 13,050 13,000 2,500 66,550Equipment Lease (0302) 69,687 55,189 6,891 1,038 6,569 9,000 0 0 15,000 15,000 0 39,000TOTALS 239,320 181,796 24,290 10,958 22,276 17,000 15,000 15,000 28,050 28,000 2,500 105,550
Additional Appropriation DataFirst Appropriation FY 1998Original 6-Year Budget Authority 247,193Budget Authority Thru FY 2015 309,605FY 2015 Budget Authority Changes
Reprogrammings YTD for FY 2015 -1,035Current FY 2015 Budget Authority 308,570Budget Authority Request for FY 2016 344,870Increase (Decrease) 36,300
Estimated Operating Impact SummaryExpenditure (+) or Cost Reduction (-) FY 2016 FY 2017 FY 2018 FY 2019 FY 2020 FY 2021 6 Yr TotalNo estimated operating impact
Full Time Equivalent DataObject FTE FY 2016 Budget % of Project
Personal Services 1.0 137 0.8Non Personal Services 0.0 16,863 99.2
56 - FB0
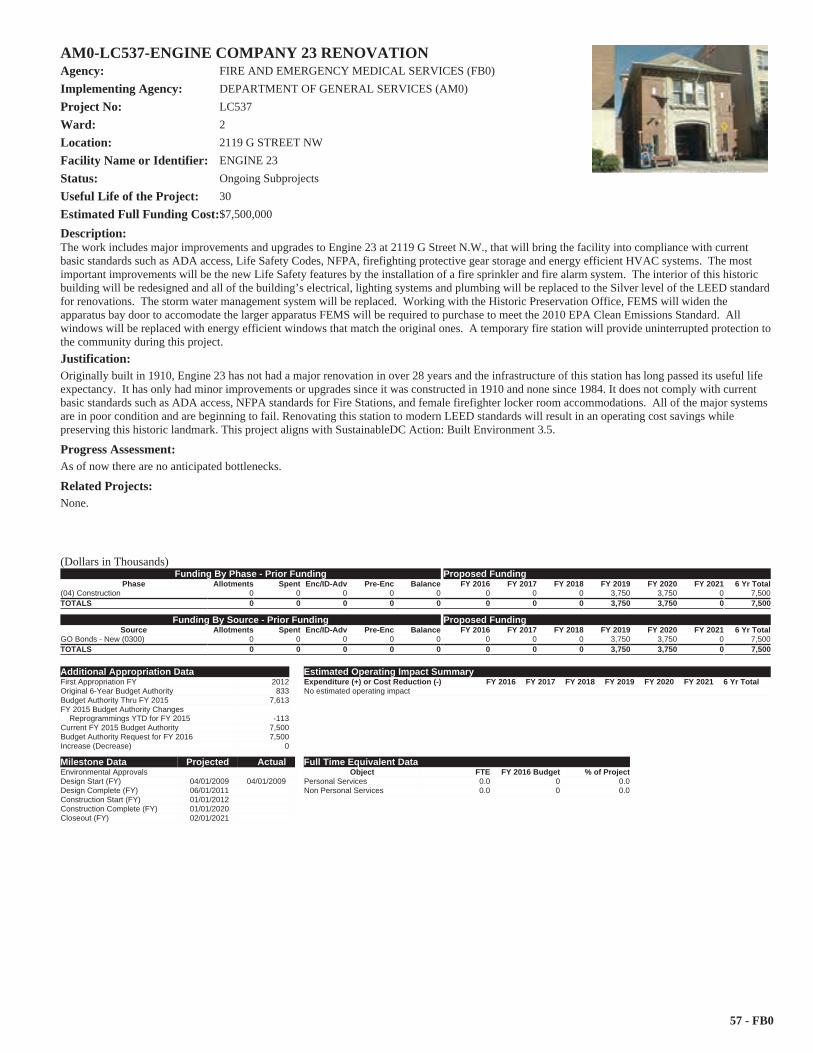
AM0-LC537-ENGINE COMPANY 23 RENOVATIONAgency: FIRE AND EMERGENCY MEDICAL SERVICES (FB0)Implementing Agency: DEPARTMENT OF GENERAL SERVICES (AM0)Project No: LC537Ward: 2Location: 2119 G STREET NWFacility Name or Identifier: ENGINE 23Status: Ongoing SubprojectsUseful Life of the Project: 30Estimated Full Funding Cost:$7,500,000
Description:The work includes major improvements and upgrades to Engine 23 at 2119 G Street N.W., that will bring the facility into compliance with current basic standards such as ADA access, Life Safety Codes, NFPA, firefighting protective gear storage and energy efficient HVAC systems. The most important improvements will be the new Life Safety features by the installation of a fire sprinkler and fire alarm system. The interior of this historic building will be redesigned and all of the building’s electrical, lighting systems and plumbing will be replaced to the Silver level of the LEED standard for renovations. The storm water management system will be replaced. Working with the Historic Preservation Office, FEMS will widen the apparatus bay door to accomodate the larger apparatus FEMS will be required to purchase to meet the 2010 EPA Clean Emissions Standard. All windows will be replaced with energy efficient windows that match the original ones. A temporary fire station will provide uninterrupted protection to the community during this project.Justification:Originally built in 1910, Engine 23 has not had a major renovation in over 28 years and the infrastructure of this station has long passed its useful life expectancy. It has only had minor improvements or upgrades since it was constructed in 1910 and none since 1984. It does not comply with current basic standards such as ADA access, NFPA standards for Fire Stations, and female firefighter locker room accommodations. All of the major systems are in poor condition and are beginning to fail. Renovating this station to modern LEED standards will result in an operating cost savings while preserving this historic landmark. This project aligns with SustainableDC Action: Built Environment 3.5.
Progress Assessment:As of now there are no anticipated bottlenecks.
Related Projects:None.
(Dollars in Thousands)Funding By Phase - Prior Funding Proposed Funding
Phase Allotments Spent Enc/ID-Adv Pre-Enc Balance FY 2016 FY 2017 FY 2018 FY 2019 FY 2020 FY 2021 6 Yr Total(04) Construction 0 0 0 0 0 0 0 0 3,750 3,750 0 7,500TOTALS 0 0 0 0 0 0 0 0 3,750 3,750 0 7,500
Funding By Source - Prior Funding Proposed FundingSource Allotments Spent Enc/ID-Adv Pre-Enc Balance FY 2016 FY 2017 FY 2018 FY 2019 FY 2020 FY 2021 6 Yr Total
GO Bonds - New (0300) 0 0 0 0 0 0 0 0 3,750 3,750 0 7,500TOTALS 0 0 0 0 0 0 0 0 3,750 3,750 0 7,500
Additional Appropriation DataFirst Appropriation FY 2012Original 6-Year Budget Authority 833Budget Authority Thru FY 2015 7,613FY 2015 Budget Authority Changes
Reprogrammings YTD for FY 2015 -113Current FY 2015 Budget Authority 7,500Budget Authority Request for FY 2016 7,500Increase (Decrease) 0
Estimated Operating Impact SummaryExpenditure (+) or Cost Reduction (-) FY 2016 FY 2017 FY 2018 FY 2019 FY 2020 FY 2021 6 Yr TotalNo estimated operating impact
Milestone Data Projected ActualEnvironmental ApprovalsDesign Start (FY) 04/01/2009 04/01/2009Design Complete (FY) 06/01/2011Construction Start (FY) 01/01/2012Construction Complete (FY) 01/01/2020Closeout (FY) 02/01/2021
Full Time Equivalent DataObject FTE FY 2016 Budget % of Project
Personal Services 0.0 0 0.0Non Personal Services 0.0 0 0.0
57 - FB0
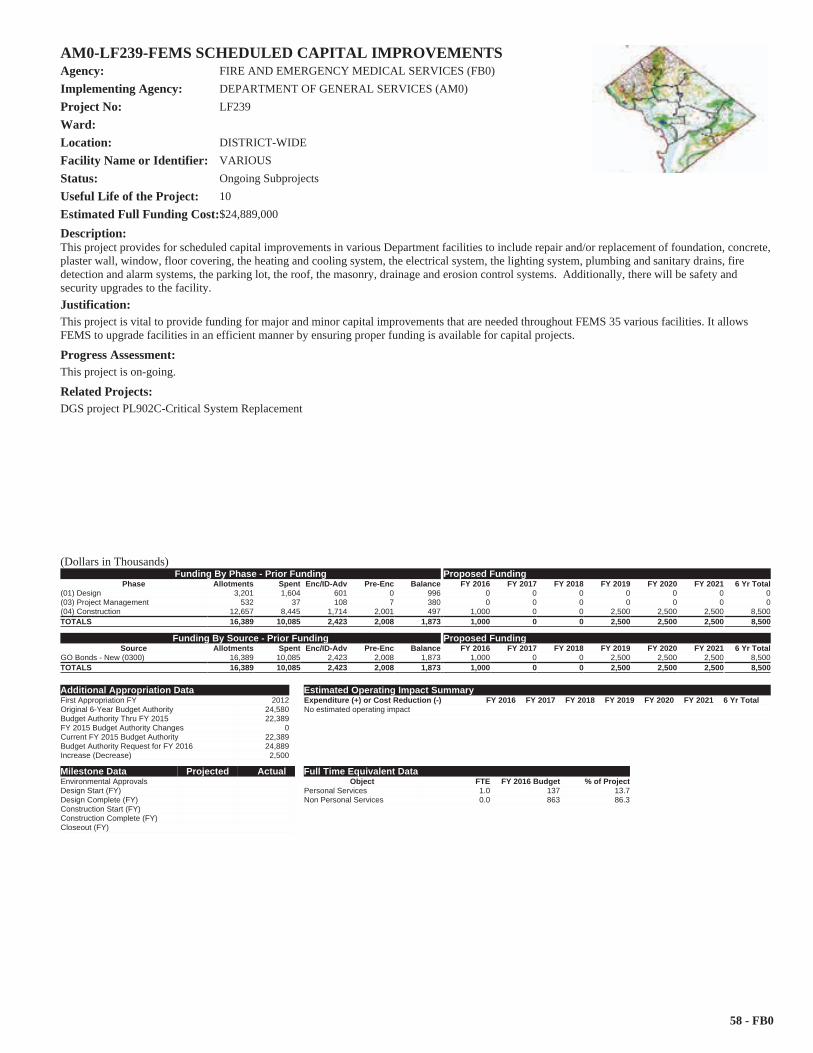
AM0-LF239-FEMS SCHEDULED CAPITAL IMPROVEMENTSAgency: FIRE AND EMERGENCY MEDICAL SERVICES (FB0)Implementing Agency: DEPARTMENT OF GENERAL SERVICES (AM0)Project No: LF239Ward:Location: DISTRICT-WIDEFacility Name or Identifier: VARIOUSStatus: Ongoing SubprojectsUseful Life of the Project: 10Estimated Full Funding Cost:$24,889,000
Description:This project provides for scheduled capital improvements in various Department facilities to include repair and/or replacement of foundation, concrete, plaster wall, window, floor covering, the heating and cooling system, the electrical system, the lighting system, plumbing and sanitary drains, fire detection and alarm systems, the parking lot, the roof, the masonry, drainage and erosion control systems. Additionally, there will be safety and security upgrades to the facility.Justification:This project is vital to provide funding for major and minor capital improvements that are needed throughout FEMS 35 various facilities. It allows FEMS to upgrade facilities in an efficient manner by ensuring proper funding is available for capital projects.
Progress Assessment:This project is on-going.
Related Projects:DGS project PL902C-Critical System Replacement
(Dollars in Thousands)Funding By Phase - Prior Funding Proposed Funding
Phase Allotments Spent Enc/ID-Adv Pre-Enc Balance FY 2016 FY 2017 FY 2018 FY 2019 FY 2020 FY 2021 6 Yr Total(01) Design 3,201 1,604 601 0 996 0 0 0 0 0 0 0(03) Project Management 532 37 108 7 380 0 0 0 0 0 0 0(04) Construction 12,657 8,445 1,714 2,001 497 1,000 0 0 2,500 2,500 2,500 8,500TOTALS 16,389 10,085 2,423 2,008 1,873 1,000 0 0 2,500 2,500 2,500 8,500
Funding By Source - Prior Funding Proposed FundingSource Allotments Spent Enc/ID-Adv Pre-Enc Balance FY 2016 FY 2017 FY 2018 FY 2019 FY 2020 FY 2021 6 Yr Total
GO Bonds - New (0300) 16,389 10,085 2,423 2,008 1,873 1,000 0 0 2,500 2,500 2,500 8,500TOTALS 16,389 10,085 2,423 2,008 1,873 1,000 0 0 2,500 2,500 2,500 8,500
Additional Appropriation DataFirst Appropriation FY 2012Original 6-Year Budget Authority 24,580Budget Authority Thru FY 2015 22,389FY 2015 Budget Authority Changes 0Current FY 2015 Budget Authority 22,389Budget Authority Request for FY 2016 24,889Increase (Decrease) 2,500
Estimated Operating Impact SummaryExpenditure (+) or Cost Reduction (-) FY 2016 FY 2017 FY 2018 FY 2019 FY 2020 FY 2021 6 Yr TotalNo estimated operating impact
Milestone Data Projected ActualEnvironmental ApprovalsDesign Start (FY)Design Complete (FY)Construction Start (FY)Construction Complete (FY)Closeout (FY)
Full Time Equivalent DataObject FTE FY 2016 Budget % of Project
Personal Services 1.0 137 13.7Non Personal Services 0.0 863 86.3
58 - FB0
FB0-20600-FIRE APPARATUSAgency: FIRE AND EMERGENCY MEDICAL SERVICES (FB0)Implementing Agency: FIRE AND EMERGENCY MEDICAL SERVICES (FB0)Project No: 20600Ward:Location: DISTRICT-WIDEFacility Name or Identifier: EQUIPMENTStatus: Ongoing SubprojectsUseful Life of the Project: 7Estimated Full Funding Cost:$67,121,000
Description:This project provides for the purchase of pumpers, ladder trucks, heavy rescue trucks, ambulances, and large support vehicles. Existing vehicles need to be replaced at the rate that meets NFPA standards and as they wear out and surpass their economic retention levels.Justification:Replacing older firefighting apparatus and ambulances at a rate that keeps the Department’s fleet at an age and condition that meets NFPA standards is essential to maintaining an effective firefighting force. This project is necessary to ensure that the fleet is reliable and does not deteriorate into a condition that leaves it unreliable and requiring extensive maintenance to keep it running. This project aligns with Sustainable-DC Action: Transportation
Progress Assessment:On-going fleet replacement project.
Related Projects:20630C-Fire Apparatus master lease project.
(Dollars in Thousands)Funding By Phase - Prior Funding Proposed Funding
Phase Allotments Spent Enc/ID-Adv Pre-Enc Balance FY 2016 FY 2017 FY 2018 FY 2019 FY 2020 FY 2021 6 Yr Total(05) Equipment 25,321 21,258 6,279 62 -2,278 7,000 15,000 15,000 2,800 2,000 0 41,800TOTALS 25,321 21,258 6,279 62 -2,278 7,000 15,000 15,000 2,800 2,000 0 41,800
Funding By Source - Prior Funding Proposed FundingSource Allotments Spent Enc/ID-Adv Pre-Enc Balance FY 2016 FY 2017 FY 2018 FY 2019 FY 2020 FY 2021 6 Yr Total
GO Bonds - New (0300) 25,321 21,258 6,279 62 -2,278 7,000 15,000 15,000 2,800 2,000 0 41,800TOTALS 25,321 21,258 6,279 62 -2,278 7,000 15,000 15,000 2,800 2,000 0 41,800
Additional Appropriation DataFirst Appropriation FY 1998Original 6-Year Budget Authority 21,892Budget Authority Thru FY 2015 29,321FY 2015 Budget Authority Changes 0Current FY 2015 Budget Authority 29,321Budget Authority Request for FY 2016 67,121Increase (Decrease) 37,800
Estimated Operating Impact SummaryExpenditure (+) or Cost Reduction (-) FY 2016 FY 2017 FY 2018 FY 2019 FY 2020 FY 2021 6 Yr TotalNo estimated operating impact
Milestone Data Projected ActualEnvironmental ApprovalsDesign Start (FY)Design Complete (FY)Construction Start (FY)Construction Complete (FY)Closeout (FY)
Full Time Equivalent DataObject FTE FY 2016 Budget % of Project
Personal Services 0.0 0 0.0Non Personal Services 0.0 7,000 100.0
59 - FB0
ELC-20630-FIRE APPARATUSAgency: FIRE AND EMERGENCY MEDICAL SERVICES (FB0)Implementing Agency: EQUIPMENT LEASE - CAPITAL (ELC)Project No: 20630Ward:Location: DISTRICT WIDEFacility Name or Identifier: EQUIPMENTStatus: Ongoing SubprojectsUseful Life of the Project: 7Estimated Full Funding Cost:$135,078,000
Description:This project provides for the purchase of pumpers, ladder trucks, heavy rescue trucks, ambulances, and large support vehicles. Existing vehicles need to be replaced at the rate that meets NFPA standards and as they wear out and surpass their economic retention levels.Justification:Replacing older firefighting apparatus and ambulances at a rate that keeps the Department’s fleet at an age and condition that meets NFPA standards is essential to maintaining an effective firefighting force. This project is necessary to ensure that the fleet is reliable and does not deteriorate into a condition that leaves it unreliable and requiring extensive maintenance to keep it running. This project aligns with SustainableDC Action: Transportation 4.2.
Progress Assessment:This is an on-going fleet replacement project.
Related Projects:20600C-Fire Apparatus
(Dollars in Thousands)Funding By Phase - Prior Funding Proposed Funding
Phase Allotments Spent Enc/ID-Adv Pre-Enc Balance FY 2016 FY 2017 FY 2018 FY 2019 FY 2020 FY 2021 6 Yr Total(05) Equipment 96,078 81,522 6,891 1,038 6,627 9,000 0 0 15,000 15,000 0 39,000TOTALS 96,078 81,522 6,891 1,038 6,627 9,000 0 0 15,000 15,000 0 39,000
Funding By Source - Prior Funding Proposed FundingSource Allotments Spent Enc/ID-Adv Pre-Enc Balance FY 2016 FY 2017 FY 2018 FY 2019 FY 2020 FY 2021 6 Yr Total
GO Bonds - New (0300) 26,391 26,333 0 0 59 0 0 0 0 0 0 0Equipment Lease (0302) 69,687 55,189 6,891 1,038 6,569 9,000 0 0 15,000 15,000 0 39,000TOTALS 96,078 81,522 6,891 1,038 6,627 9,000 0 0 15,000 15,000 0 39,000
Additional Appropriation DataFirst Appropriation FY 1999Original 6-Year Budget Authority 34,183Budget Authority Thru FY 2015 135,078FY 2015 Budget Authority Changes 0Current FY 2015 Budget Authority 135,078Budget Authority Request for FY 2016 135,078Increase (Decrease) 0
Estimated Operating Impact SummaryExpenditure (+) or Cost Reduction (-) FY 2016 FY 2017 FY 2018 FY 2019 FY 2020 FY 2021 6 Yr TotalNo estimated operating impact
Milestone Data Projected ActualEnvironmental ApprovalsDesign Start (FY)Design Complete (FY)Construction Start (FY)Construction Complete (FY)Closeout (FY)
Full Time Equivalent DataObject FTE FY 2016 Budget % of Project
Personal Services 0.0 0 0.0Non Personal Services 0.0 9,000 100.0
60 - FB0
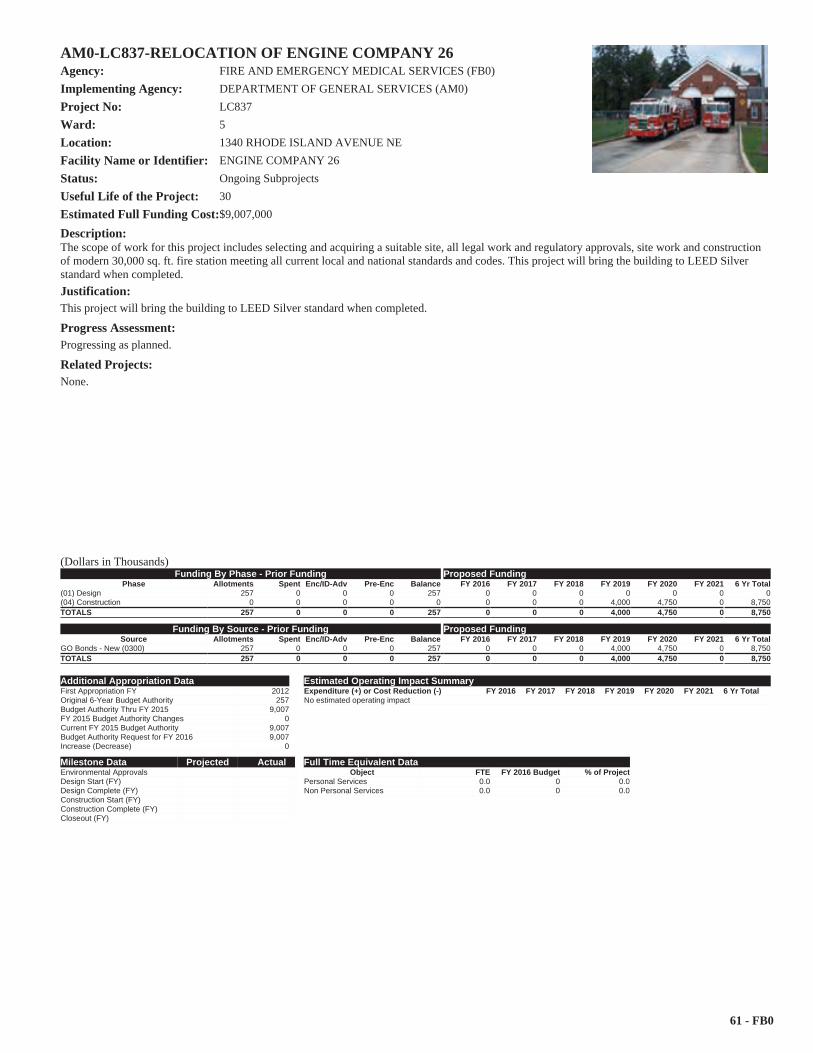
AM0-LC837-RELOCATION OF ENGINE COMPANY 26Agency: FIRE AND EMERGENCY MEDICAL SERVICES (FB0)Implementing Agency: DEPARTMENT OF GENERAL SERVICES (AM0)Project No: LC837Ward: 5Location: 1340 RHODE ISLAND AVENUE NEFacility Name or Identifier: ENGINE COMPANY 26Status: Ongoing SubprojectsUseful Life of the Project: 30Estimated Full Funding Cost:$9,007,000
Description:The scope of work for this project includes selecting and acquiring a suitable site, all legal work and regulatory approvals, site work and construction of modern 30,000 sq. ft. fire station meeting all current local and national standards and codes. This project will bring the building to LEED Silver standard when completed.Justification:This project will bring the building to LEED Silver standard when completed.
Progress Assessment:Progressing as planned.
Related Projects:None.
(Dollars in Thousands)Funding By Phase - Prior Funding Proposed Funding
Phase Allotments Spent Enc/ID-Adv Pre-Enc Balance FY 2016 FY 2017 FY 2018 FY 2019 FY 2020 FY 2021 6 Yr Total(01) Design 257 0 0 0 257 0 0 0 0 0 0 0(04) Construction 0 0 0 0 0 0 0 0 4,000 4,750 0 8,750TOTALS 257 0 0 0 257 0 0 0 4,000 4,750 0 8,750
Funding By Source - Prior Funding Proposed FundingSource Allotments Spent Enc/ID-Adv Pre-Enc Balance FY 2016 FY 2017 FY 2018 FY 2019 FY 2020 FY 2021 6 Yr Total
GO Bonds - New (0300) 257 0 0 0 257 0 0 0 4,000 4,750 0 8,750TOTALS 257 0 0 0 257 0 0 0 4,000 4,750 0 8,750
Additional Appropriation DataFirst Appropriation FY 2012Original 6-Year Budget Authority 257Budget Authority Thru FY 2015 9,007FY 2015 Budget Authority Changes 0Current FY 2015 Budget Authority 9,007Budget Authority Request for FY 2016 9,007Increase (Decrease) 0
Estimated Operating Impact SummaryExpenditure (+) or Cost Reduction (-) FY 2016 FY 2017 FY 2018 FY 2019 FY 2020 FY 2021 6 Yr TotalNo estimated operating impact
Milestone Data Projected ActualEnvironmental ApprovalsDesign Start (FY)Design Complete (FY)Construction Start (FY)Construction Complete (FY)Closeout (FY)
Full Time Equivalent DataObject FTE FY 2016 Budget % of Project
Personal Services 0.0 0 0.0Non Personal Services 0.0 0 0.0
61 - FB0

This page is intentionally left blank.
(FL0) DEPARTMENT OF CORRECTIONS
63 - FL0
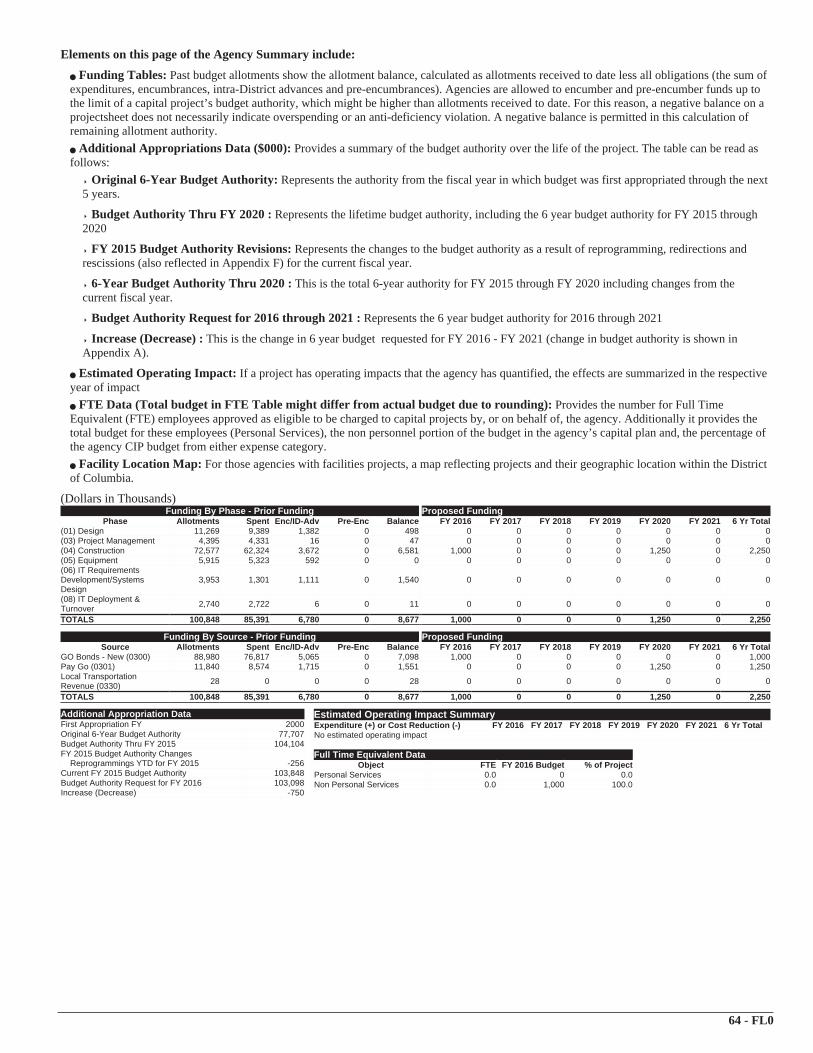
Elements on this page of the Agency Summary include:
Funding Tables: Past budget allotments show the allotment balance, calculated as allotments received to date less all obligations (the sum of expenditures, encumbrances, intra-District advances and pre-encumbrances). Agencies are allowed to encumber and pre-encumber funds up to the limit of a capital project’s budget authority, which might be higher than allotments received to date. For this reason, a negative balance on a projectsheet does not necessarily indicate overspending or an anti-deficiency violation. A negative balance is permitted in this calculation of remaining allotment authority. Additional Appropriations Data ($000): Provides a summary of the budget authority over the life of the project. The table can be read as
follows: Original 6-Year Budget Authority: Represents the authority from the fiscal year in which budget was first appropriated through the next
5 years.
Budget Authority Thru FY 2020 : Represents the lifetime budget authority, including the 6 year budget authority for FY 2015 through 2020
FY 2015 Budget Authority Revisions: Represents the changes to the budget authority as a result of reprogramming, redirections and rescissions (also reflected in Appendix F) for the current fiscal year.
6-Year Budget Authority Thru 2020 : This is the total 6-year authority for FY 2015 through FY 2020 including changes from the current fiscal year.
Budget Authority Request for 2016 through 2021 : Represents the 6 year budget authority for 2016 through 2021
Increase (Decrease) : This is the change in 6 year budget requested for FY 2016 - FY 2021 (change in budget authority is shown in Appendix A).
Estimated Operating Impact: If a project has operating impacts that the agency has quantified, the effects are summarized in the respective year of impact FTE Data (Total budget in FTE Table might differ from actual budget due to rounding): Provides the number for Full Time
Equivalent (FTE) employees approved as eligible to be charged to capital projects by, or on behalf of, the agency. Additionally it provides the total budget for these employees (Personal Services), the non personnel portion of the budget in the agency’s capital plan and, the percentage of the agency CIP budget from either expense category. Facility Location Map: For those agencies with facilities projects, a map reflecting projects and their geographic location within the District
of Columbia.
(Dollars in Thousands)Funding By Phase - Prior Funding Proposed Funding
Phase Allotments Spent Enc/ID-Adv Pre-Enc Balance FY 2016 FY 2017 FY 2018 FY 2019 FY 2020 FY 2021 6 Yr Total(01) Design 11,269 9,389 1,382 0 498 0 0 0 0 0 0 0(03) Project Management 4,395 4,331 16 0 47 0 0 0 0 0 0 0(04) Construction 72,577 62,324 3,672 0 6,581 1,000 0 0 0 1,250 0 2,250(05) Equipment 5,915 5,323 592 0 0 0 0 0 0 0 0 0(06) IT Requirements Development/SystemsDesign
3,953 1,301 1,111 0 1,540 0 0 0 0 0 0 0
(08) IT Deployment & Turnover 2,740 2,722 6 0 11 0 0 0 0 0 0 0
TOTALS 100,848 85,391 6,780 0 8,677 1,000 0 0 0 1,250 0 2,250
Funding By Source - Prior Funding Proposed FundingSource Allotments Spent Enc/ID-Adv Pre-Enc Balance FY 2016 FY 2017 FY 2018 FY 2019 FY 2020 FY 2021 6 Yr Total
GO Bonds - New (0300) 88,980 76,817 5,065 0 7,098 1,000 0 0 0 0 0 1,000Pay Go (0301) 11,840 8,574 1,715 0 1,551 0 0 0 0 1,250 0 1,250Local Transportation Revenue (0330) 28 0 0 0 28 0 0 0 0 0 0 0
TOTALS 100,848 85,391 6,780 0 8,677 1,000 0 0 0 1,250 0 2,250
Additional Appropriation DataFirst Appropriation FY 2000Original 6-Year Budget Authority 77,707Budget Authority Thru FY 2015 104,104FY 2015 Budget Authority Changes
Reprogrammings YTD for FY 2015 -256Current FY 2015 Budget Authority 103,848Budget Authority Request for FY 2016 103,098Increase (Decrease) -750
Estimated Operating Impact SummaryExpenditure (+) or Cost Reduction (-) FY 2016 FY 2017 FY 2018 FY 2019 FY 2020 FY 2021 6 Yr TotalNo estimated operating impact
Full Time Equivalent DataObject FTE FY 2016 Budget % of Project
Personal Services 0.0 0 0.0Non Personal Services 0.0 1,000 100.0
64 - FL0
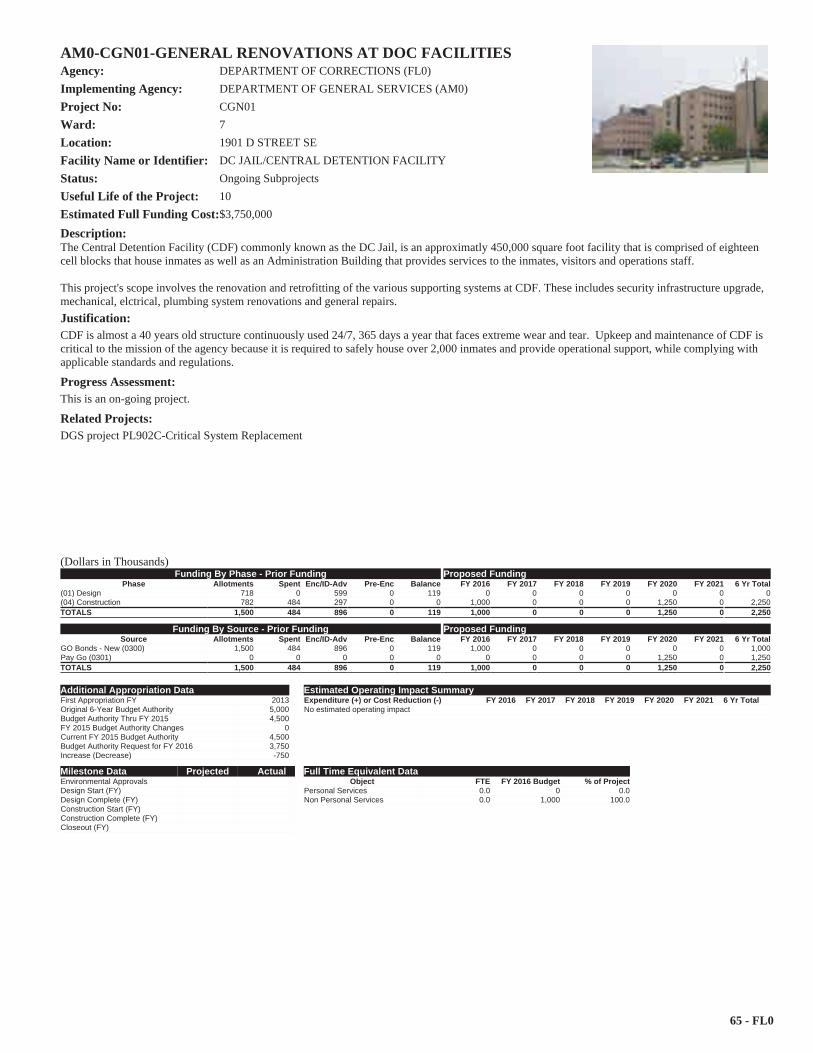
AM0-CGN01-GENERAL RENOVATIONS AT DOC FACILITIESAgency: DEPARTMENT OF CORRECTIONS (FL0)Implementing Agency: DEPARTMENT OF GENERAL SERVICES (AM0)Project No: CGN01Ward: 7Location: 1901 D STREET SEFacility Name or Identifier: DC JAIL/CENTRAL DETENTION FACILITYStatus: Ongoing SubprojectsUseful Life of the Project: 10Estimated Full Funding Cost:$3,750,000
Description:The Central Detention Facility (CDF) commonly known as the DC Jail, is an approximatly 450,000 square foot facility that is comprised of eighteen cell blocks that house inmates as well as an Administration Building that provides services to the inmates, visitors and operations staff.
This project's scope involves the renovation and retrofitting of the various supporting systems at CDF. These includes security infrastructure upgrade, mechanical, elctrical, plumbing system renovations and general repairs.Justification:CDF is almost a 40 years old structure continuously used 24/7, 365 days a year that faces extreme wear and tear. Upkeep and maintenance of CDF is critical to the mission of the agency because it is required to safely house over 2,000 inmates and provide operational support, while complying with applicable standards and regulations.
Progress Assessment:This is an on-going project.
Related Projects:DGS project PL902C-Critical System Replacement
(Dollars in Thousands)Funding By Phase - Prior Funding Proposed Funding
Phase Allotments Spent Enc/ID-Adv Pre-Enc Balance FY 2016 FY 2017 FY 2018 FY 2019 FY 2020 FY 2021 6 Yr Total(01) Design 718 0 599 0 119 0 0 0 0 0 0 0(04) Construction 782 484 297 0 0 1,000 0 0 0 1,250 0 2,250TOTALS 1,500 484 896 0 119 1,000 0 0 0 1,250 0 2,250
Funding By Source - Prior Funding Proposed FundingSource Allotments Spent Enc/ID-Adv Pre-Enc Balance FY 2016 FY 2017 FY 2018 FY 2019 FY 2020 FY 2021 6 Yr Total
GO Bonds - New (0300) 1,500 484 896 0 119 1,000 0 0 0 0 0 1,000Pay Go (0301) 0 0 0 0 0 0 0 0 0 1,250 0 1,250TOTALS 1,500 484 896 0 119 1,000 0 0 0 1,250 0 2,250
Additional Appropriation DataFirst Appropriation FY 2013Original 6-Year Budget Authority 5,000Budget Authority Thru FY 2015 4,500FY 2015 Budget Authority Changes 0Current FY 2015 Budget Authority 4,500Budget Authority Request for FY 2016 3,750Increase (Decrease) -750
Estimated Operating Impact SummaryExpenditure (+) or Cost Reduction (-) FY 2016 FY 2017 FY 2018 FY 2019 FY 2020 FY 2021 6 Yr TotalNo estimated operating impact
Milestone Data Projected ActualEnvironmental ApprovalsDesign Start (FY)Design Complete (FY)Construction Start (FY)Construction Complete (FY)Closeout (FY)
Full Time Equivalent DataObject FTE FY 2016 Budget % of Project
Personal Services 0.0 0 0.0Non Personal Services 0.0 1,000 100.0
65 - FL0