Embed Size (px)
Citation preview

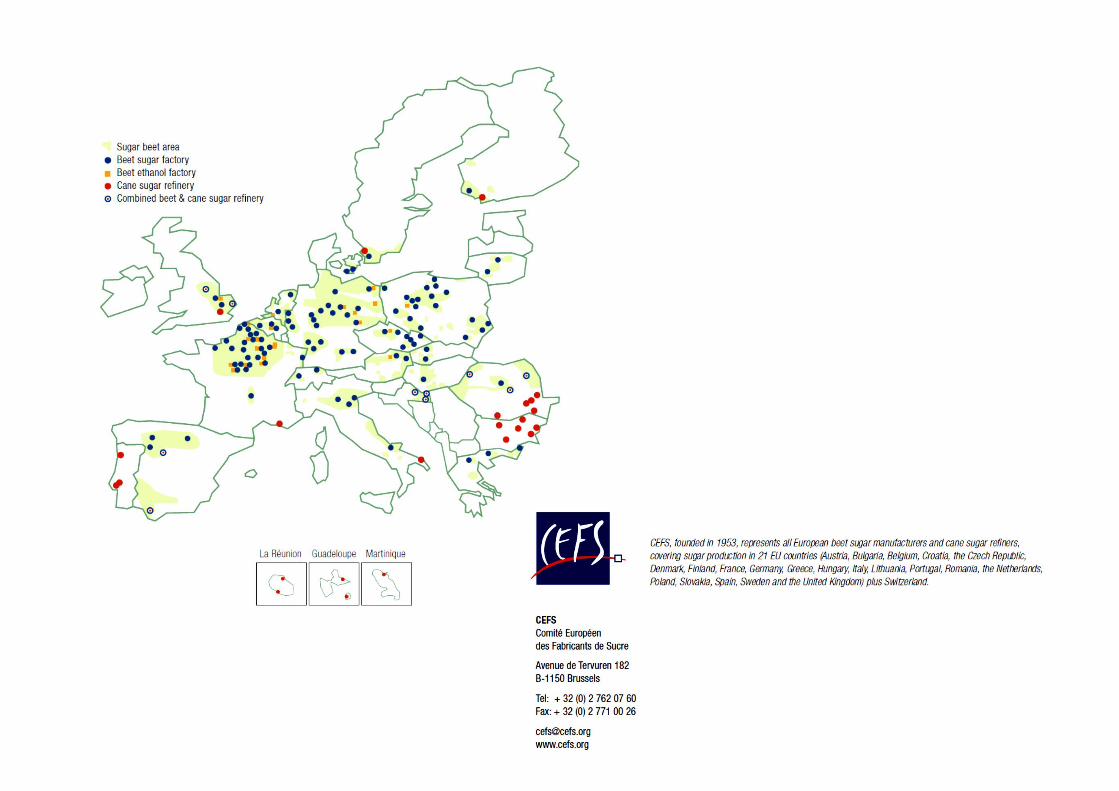
COMITE EUROPEEN DES FABRICANTS DE SUCRE
182, Av de Tervueren ■ B - 1150 BRUSSELS
Tel: 32 2 762 07 60 ■ Fax: 32 2 771 00 26
E-mail: [email protected]
Website: www.comitesucre.org
CEFS SUGAR STATISTICS
2015

INDEX CEFS STATISTICS 2015
Tables 4, 5 and 7 (respectively concerning average sugar yield, average sugar content in beet when delivered and average length of the beet sugar
campaign) show weighted EU averages (weighted by sugar production-Table 4 – or the sugar beet production –Tables 5 and 7- of each country on that given year) for the entire range of years. Arithmetical averages are no longer used.
ECONOMIC DATA
A. BEET STATISTICS
1. Total harvested beet areas
2. Total beet purchased (clean beet)
B. SUGAR STATISTICS 3. Total sugar production from sugar beet
4. Average sugar yield 5. Average sugar content in beet when delivered 6. Beet tonnages transformed daily 7. Average length of the beet sugar campaign C. CO-PRODUCTS
8. Production of beet sugar molasses in sugar factories 9. Production of beet pulp
STRUCTURAL DATA
10. Number of beet sugar and raw cane refinery companies by production year
11. Number of sugar beet factories operating in each production year 12. Number of sugar beet factories and daily capacity by production year 13. Number of beet growers 14. Sugar processing industry employment “during” the beet processing campaign (regular + seasonal staff)
15. Sugar processing industry employment “between” beet processing campaign ( regular staff)

INTRODUCTION TO THE 2015 EDITION OF CEFS STATISTICS
Following the 2013/14 campaign (11.0 tonnes/ha), the 2014/15 campaign holds a new record as it surpasses the 2011/2012 campaign (11.9 tonnes/ha) with an EU average of 12.7 tonnes/ha. This campaign still continues to maintain the increasing productivity levels achieved already by campaign 2008/09 (10.8 tonnes/ha). In addition to (and sometimes, despite) continuous improvements in beet cultivation and sugar extraction techniques, our 2015 Statistics still remind us that weather conditions remain an important variable in beet sugar production influencing both total sugar production as well as the relative sugar yields.

In the 2014/15 campaign beet sugar production is distributed among 19 EU28 countries as opposed to 23 before the restructuring, with 70% of the production concentrated in 4 countries. The 19 countries also include Croatia which joined the European Union as the 28th Member State in the year 2013. [Ndr. If all uses of beet sugar –food and non-food- are considered together that percentage represented 80% for the first 6 producing countries in the EU28 in 2015-See graph below]
The EU sugar sector after the 2006 Sugar Reform (Extract from The European Sugar Sector, a sustainable and reliable supplier for consumers (2010) – available under www.cefs.org)
Beet and sugar production in the EU is based on a market organisation, known as the common market organisation of the sugar sector or Sugar CMO. In 2006, this CMO was thoroughly reformed leading to a large reduction in quota sugar production of around 6 Mio tonnes (-30%). This left a remaining quota sugar production of around 13.3 Mio tonnes. Key to the reform was a 36% cut in the reference sugar price (from €631.9/tonne in 2006/2007 to €404.4/tonne in 2009/2010) and the removal of the intervention mechanism that guaranteed a minimum sugar price. Measures were taken to compensate farmers and a Restructuring Fund, financed by sugar producers, was set up to encourage less competitive sugar producers to leave the industry.

In the years leading up to and following the adoption of the CMO reform, the number of EU sugar factories has fallen sharply as the industry has undergone major restructuring driven by the need to improve efficiency. Virtually every country and region of the EU has been affected. This restructuring process has been radical. In the period 2000-2005 68 factories were closed, an average of 11 per year. Between 2006 and 2008 a further 83 factories were closed (almost 28 per year!), resulting in an overall reduction of 60% of European processing capacity between 2000 and 2008. At the same time, average factory size has continued to increase, in particular in Western European countries (EU15) which represent about 85% of the total EU beet sugar production (status in 2009). However with Croatia joining the European Union in 2013, 3 factories were added. Since 2010, the number of factories has remained stabled to 109 across EU28. The number of employees in the sector has followed suit. Between 2004 and 2009, for example, the number of employees in the sector has fallen by 44%. Despite this reduction, the sugar industry retains an important economic function in rural areas, where it guarantees jobs and training positions. As well as processing sugar beet, sugar factories are a partner for numerous small businesses and ancillary suppliers. Taking into account both direct and indirect employment the beet sugar industry in the EU supports about 180.000 jobs and contributes to the revenue of 140.000 farms (2013, source: CIBE, CEFS & EFFAT, EU Beet Sugar Sustainability Partnership).
As the sugar quotas will be ending in 2017, as a result of the reform of the Common Agricultural Policy (CAP) which entered into force on the 1st of January 2014, the landscape of EU beet sugar production will have to adapt to the new EU framework i.e. the EU will have one of the most liberal markets in the world.

DEFINITION OF DATA CEFS STATISTICS 2015
Designation Unit Periodicity Frequency Date available Sources
ECONOMIC DATA
A. Beet Statistics
1. Total harvested beet areas ha 01.Oct. -30.Sep. agronomic campaign Yearly Feb +1 year CEFS delegations
EC Commission
2. Total beet purchased (clean beet)
tonnes (clean beet;
regardless of sugar content)
01.Oct. -30.Sep. agronomic campaign Yearly Feb +1 year CEFS delegations
B. Sugar Statistics 01.Oct. -30.Sep. agronomic campaign Yearly Feb +1 year
CEFS delegations
EC Commission
3. Total sugar production from sugar beet tonnes 01.Oct. -30.Sep. agronomic campaign Yearly Feb +1 year
CEFS delegations
EC Commission
4. Average sugar yield* tonnes per ha 01.Oct. -30.Sep. agronomic campaign Yearly Feb +1 year CEFS delegations
EC Commission
5. Average sugar content in beet when delivered % 01.Oct. -30.Sep. agronomic campaign Yearly Feb +1 year CEFS delegations
6. Beet tonnages transformed daily tonnes 01.Oct. -30.Sep. agronomic campaign Yearly Feb +1 year CEFS delegations
7. Average length of the campaign * days slicing beet 01.Oct. -30.Sep. agronomic campaign Yearly Feb +1 year CEFS delegations
C. Co-products
8. Production of beet sugar molasses in sugar factories and refineries tonnes 01.Jul. -30.Jun. commercial campaign Yearly Feb +1 year CEFS delegations
9. Production of beet pulp tonnes 01.Oct. -30.Sep agronomic campaign Yearly Feb +1 year CEFS delegations
STRUCTURAL DATA
10. Number of sugar and refinery companies (legal entities) companies 01.Jan -31.Dec calendar year Yearly
Feb +1 year CEFS delegations
11. Number of factories operating in each production year beet factories 01.Jan -31.Dec calendar year Yearly Feb +1 year CEFS delegations
12. Number of beet sugar factories and daily capacity by production year tonnes 01.Jan -31.Dec calendar year Yearly Feb +1 year CEFS delegations
13. Number of beet growers 01.Jan -31.Dec calendar year Yearly Feb +1 year CEFS delegations
CIBE internal survey
14. Sugar processing industry employment during campaign seasonal + regular staff
Yearly Feb +1 year CEFS delegations
15. Sugar processing industry employment between the campaigns regular staff Yearly Feb +1 year CEFS delegations
* ‘Sugar yield’ in this table refers to the total sugar content in beet without distinction between the different possible uses of sugar beet (food and non-food uses)

1. TOTAL HARVESTED BEET AREAS (ha) CEFS STATISTICS 2015
2004/05 2005/06 2006/07 2007/08 2008/09 2009/10 2010/11 2011/12 2012/13 2013/14 2014/2015 Variation%
Austria 44753 44196 39412 42336 43027 43978 44918 46642 49340 50996 50655 -0,7%
Belgium 89523 86655 83419 85019 60256 63438 59542 64361 63169 61811 59782 -3,3%
Denmark 48500 47000 41700 39300 36500 38000 39200 39800 40600 37600 35500 -5,6%
Finland 30400 31100 23800 16000 13600 15000 14600 14200 11700 12000 13700 14,2%
France 385992 380430 379241 397936 349498 372.200 380.720 362000 341000 360700 371000 2,9%
Germany 436676 418820 359773 391496 363834 364207 362000 398000 345254 334600 339041 1,3%
Greece 32.930 41.965 26.879 13.722 13.848 23.412 14.000 6000 9309 5799 7000 20,7%
Ireland 31127 31000 - - - - - - - - - -
Italy 185805 253043 92103 85638 61172 62000 63000 45543 52500 40712 51985 27,7%
The Netherlands 97000 91459 83303 82260 72271 72380 70465 73125 73123 73276 75591 3,2%
Portugal 7905 3581 2500 1652 - - - - - - - -
Spain 103000 102000 103900 60300 51100 47000 47000 45000 36100 35029 38744 10,6%
Sweden 47500 48200 43700 40000 36600 40000 39000 40000 38200 35300 33700 -4,5%
United Kingdom 133100 125900 107123 106800 101600 103484 104000 99400 103800 106830 103000 -3,6%
Czech Republic 68970 63170 59447 54026 51289 54000 54000 59243 52000 61978 66156 6,7%
Hungary 64616 58334 45954 36229 6500 14000 14000 13000 18000 15685 11000 -29,9%
Latvia 14000 14000 11000 - - - - - - - - -
Lithuania 19400 17300 14400 13200 7000 15000 15000 18000 19000 17800 16000 -10,1%
Poland 296277 277979 240297 215296 175682 192000 195176 197000 193359 184837 197555 6,9%
Slovakia 34.215 32.263 27.492 18.913 11.030 15.887 18.000 17.768 19444 20077 22348 11,3%
Slovenia 6100 5048 7000 - - - - - - - - -
E.U.25 Countries 2177789 2173443 1792443 1700123 1454807 1535986 1534621 1539082 1464979 1455030 1492757 2,6%
Bulgaria - 1106 1500 - - - - - - - - -
Romania - 19034 29240 22282 18955 20000 23000 19000 28000 28600 29000 1,4%
Croatia - - - - - - 32851 28178 26526 24842 27000 8,7%
E.U.28 Countries 2177789 2193583 1823183 1722405 1473762 1555986 1590472 1586260 1519505 1508472 1548757 2,7%
Switzerland 18859 18500 18740 21184 20690 20821 18086 19770 19637 20440 21700 6,2%
E.U.28 + Switzerl. 2196648 2212083 1841923 1743589 1494452 1576807 1608558 1606030 1539142 1528912 1570457 2,7%
*(Romania) Based on campaign figures from the single CMO Management Committee.(December 2015)

2. TOTAL BEET PURCHASED (CLEAN BEET) CEFS STATISTICS 2015
2004/05 2005/06 2006/07 2007/08 2008/09 2009/10
2010/11
2011/12
2012/13
2013/14
2014/15 Variation
E.U.25 Countries
127127390
127526591
107311922
104001737
93719039
103983242
96938324
109778034
103799589
100393671
120725356
20,3%
E.U.28 Countries 127146763 128130591 108227222 104657648 94415567 104733242 99658012 112546208 106367713
101698697
122644518
20,6%
E.U.28 + Switzerl
128604012 129541606 109471415 106232627 96042382 106455081 100961231 114375595 108041967
103090675
124595518
20,9%

3. TOTAL SUGAR PRODUCTION FROM SUGAR BEET (tonnes) CEFS STATISTICS 2015
2004/05 2005/06 2006/07 2007/08 2008/09 2009/10 2010/11 2011/12 2012/13 2013/14 2014/15 Variation
Austria 458137 488932 407590 365404 410587 381233 443627 546928 469024 484279 403247 -15,9%
Belgium 990585 925266 855562 875021 724644 843158 689185 880660 761533 783168 815695 5,0%
Denmark 472000 475000 375000 380000 397000 444976 453395 519003 480366 461997 476000 3,0%
Finland
148000
179000
130000
101000
69000
88000
80675 94235 140460 116647
138228 87,3%
France
4143348
4140243
4150093
4445299
4069629
4460400
4.225.287 4.774.869 4222847 4140865
4576512 0,7%
Germany 4334165 4040625 3262168 3905768 3654836 4232290 3469277 4266670 4006872 3421767 4491076 31,0%
Greece 259.500 310.340 169.524 78.388 100.382 171.787 142.182 159278 158126 160199 195032 21,7%
Ireland 213178 205160 - - - - - - - - - -
Italy 1158163 1804422 657110 670327 498233 508842 554530 506523 546362 507841 676652 35,0%
The Netherlands 1033952 976148 871950 888808 860763 991807 870536 998368 968459 947865 1144121 20,7%
Portugal 74367 37239 25000 14154 - - - - - - - -
Spain 1057000 1083000 1031000 711000 608000 549741 527497 612813 531845 448856 578146 28,8%
Sweden 371000 406000 313000 354000 327000 403000 315429 416860 365869 377655 382000 1,1%
United Kingdom 1390026 1340862 1157427 1049244 1150000 1308056 994791
1.314.558 1143849 1233598
1446549 9,3%
Czech Republic 558418 558879 470488 353902 414673 478818 458876 615440 565462 539166 596415 10,6%
Hungary 499432 490836 348840 220856 66315 125114 120500 121880 111959 115649 129889 12,3%
Latvia 66505 71019 43442 - - - - - - - - -
Lithuania
104000
92000
77000
98000
43000
113089
92450 152403 190253 172153
182284 66,8%
Poland 2001411 2053975 1706798 1919481 1389071 1646225 1465670 1910567 1803332 1712914 2041224 15,1%
Slovakia 233.004 263.767 205.407 125.935 101.846 162.040 140.649 233207 228698 219042 213266 23,5%
Slovenia 35250 46920 43442 - - - - - - - - -
E.U.25 19601441 19989633 16300841 16556587 14884979 16908576 15044556 18124262 16695316 15843660 18486336 13,9%
Bulgaria - 2105 28000 - 198788 - - - - - - -
Romania - 72040 119070 80339 111479 146212 123664 145848 258621 261658 218983 -16,3%
Croatia 234550 240185 142119 192880 35989 -80,4%

E.U.28 19601441 20063778 16447911 16636926 15195246 17054788 15402769 18510295 17096056 16298198 18741308 12,4%
Switzerland 218954 216546 178904 248670 248922 275274 215120 290589 247582 21755 305100 40,5%
E.U.28 + Switzerl. 19820395 20280324 16626815 16885596 15444168 17330062 15617889 18800884 17343638 16515353 19046408 12,7%
* The volumes indicated comprise both the amounts of white sugar actually produced and those further processed into other products (food and non-food). Sugar extracted from molasses is also
included.
*(Romania) Provisional figures from the single CMO Management Committee.(December 2015)

4. AVERAGE SUGAR YIELD (t sugar/ha) CEFS STATISTICS 2015
2004/05 2005/06 2006/07 2007/08 2008/09 2009/10
2010/11
2011/12
2012/13
2013/14
2014/15 Average
last 5 years
Austria 10.02 11.1 10.3 8.4 13.4 8.7 9.9 11.7 9.4 9.4 7.96 9.7
Belgium 11.05 10.65 9.89 10.3 12 13.2 11.5 13.4 12.1 12.6 13.6 12.6
Denmark 9.7 10.1 9 9,7 10,9 11,7 11,6 13,0 11,71
12.3 13.4 12.4
Finland 4,9 5,8 5,5 6,3 5,1 5,8 5,5 6,6 6,2 6.2 6.7 6.3
France 11,91* 12,1* 11,8* 12,6* 12,97* 13,89* 12,4* 13,23* 12,63* 12,55* 13.69* 12.9
Germany 9,9 9,6 9,1 10,0 10,0 11,6 9,6 10,70 11,62 10.9 13.25 11.2
Greece 7,9 7,4 6,3 5,7 7,2 4,4 7,4 6,6 5,88 6.93 7,21 6.8
Ireland 6.88 6.62 - - - - - - - - -
Italy 6,23 7,13 7,13 7,83 8,14 8,21 8,80 11,12 10,41 12.31 13.02 11.1
The Netherlands 10,8 11,66 10,75 10,8 11,91 13,7 12,4 13,65 13,5 13.2 15.1 13.6
Portugal 9.79 11.67 11.60 8.6 - - - - - - - -
Spain 10,3 10,6 9,9 11,8 11,9 11,7 11,2 13,6 14,73 12.81 14.92 13.5
Sweden 7,8 8,4 7,2 8,9 8,9 10,4 8,5 10,0 9,6 10.7 11.3 10
United Kingdom 10,44 10,65 10,80 9,82 11,32 12,64 9,6 13,2 11,0 12.4 14.0 12,1
Czech Republic 8,1 8,85 8,43 8,02 9,43 9,29 8,8 10,4 10,4 9.7 11.1 10,1
Hungary 7,73 8,41 7,59 6,1 10,2 9,2 8,1 8,8 6,6 7.4 8.4 7,8
Latvia 4.90 5.24 5.24* - - - - - - - - -
Lithuania 5,4 5,3 5,40 7,4 6,10 7,3 6,8 8,16 7,6 10 11 8,6
Poland 6,8 7,4 7,1 8,9 7,9 8,6 7,5 9,7 9,5 9.6 10.3 9,3
Slovakia 6,81 8,18 7,47 6,66 9,23 10,20 8,29 13,20 11,80 8.6 9.54 10,3
Slovenia 5.78 9.29 6.20 - - - - - - - - -
E.U.25 Countries 9,6 9,8 9,6 10,4 11,0 11,8 10,4 11,9 11,5 11.5 12.8 11.6
Bulgaria - 1.90 3.20 - - - - - - - - -
Romania - 3.78 4.07 3.6 5.5 7.3 5.3 7.8 9.1 5.7 N/a+ N/a+
Croatia 7,2 8,5 5,4 7.4 9.9 7,7
E.U.28 Countries 9,6 9,8 9,6 10,3 10,8 11,8 10.3 11,8 11,4 11.3 12.7 11.5
Switzerland 11,6 11,7 9,5 11,7 12 13,2 11,9 15,0 12,6 10.6 14.1 12.8
E.U.28 + Switzerl. 9,6 9,8 9,6 10,3 10,8 11,8 10,2 11,7 11,4 11.3 12.7 11.4

N/a+: figure not available in the EU sugar balance sheets CMO 15.02.2016
*If production of “green juice” is taken into account, although it is not included in the definition of “sugar production” under Regulation EC/318/2006,
the sugar yields of France should read:11.91 (2004/2005), 12.1 (2005/2006), 11.8 ( 2006/2007), 12.6 (2007/2008), 13.0 (2008/2009),
13.3 (2009/2010),12.4 (2010/2011), 13.2 (2011/2012), 12.4 (2012/2013), 11.5 (2013/2014), 13.7 (2014/2015). Source : SNFS, 30 September 2015

5. AVERAGE SUGAR CONTENT IN BEET WHEN DELIVERED (%) CEFS STATISTICS 2015
2004/05 2005/06 2006/07 2007/08 2008/09 2009/10
2010/11
2011/12
2012/13
2013/14
2014/15 Variation
Austria 17.29 17.11 17.85 16.59 17.06 16.2 17.25 17,85 16,68 17,39 15,24 -12,4%
Belgium 17.07 17.32 16.73 17 17.8 18.6 17.14 17,79 18,02 17,74 17,2 -3,1%
Denmark 17.80 18.70 16.70 17.8 17.8 19.2 17.8 16,9 18,1 18,5 17,2 -7,0%
Finland 15.78 17.00 15.50 16.8 16.5 17.1 16.9 15,7 16,1 17,1 16,5 -3,5%
France 18.10 18.80 17.30 18.5 18.8 19.5 18.1 18,7 18,1 18 17,7 -1,7%
Germany 17.84 17.99 17.64 17.46 18.04 18.15 17.27 18,03 18,22 17,73 17,33 -2,3%
Greece 14.64 14.03 13.15 13.39 14.00 13.48 13.28 14,91 14,36 15,28 13,63 -10,8%
Ireland 16.75 16.66 - - - - - - - - - -
Italy 16.23 14.95 15.30 16.6 15.48 15.95 14.96 16,6 16,16 15,66 14,03 -10,4%
The Netherlands 16.28 16.84 16.31 17.36 17.21 17.69 16.80 17,02 17,13 16,88 16,66 -1,3%
Portugal 16.05 16.27 16 16.1 - - - - - - - -
Spain 17 17.20 16.80 17.6 17.8 17.3 17.7 18.2 18 17,52 17,2 -1,8%
Sweden 17.50 18.40 15.50 17.7 17.4 17.9 17.1 16.8 17,1 17,6 16,6 -5,7%
United Kingdom 17.39 17.20 16.67 18 17.3 18.43 16.87 18.4 17 17,49 17,2 -1,5%
Czech Republic 18.53 18.7 18.41 16.47 18.04 16.85 16.65 17.32 17 17,48 16,5 -5,8%
Hungary 15.87 15.91 16.84 15.84 17.14 16.57 15.04 17.12 15,96 16,34 14,6 -10,5%
Latvia 16 17.60 15.60 - - - - - - - - -
Lithuania 16.60 18.60 15.40 17.4 18.3 17.3 16.4 17.3 17,1 17,8 17,6 -1,1%
Poland 17.70 18.90 16.60 17.1 16.9 16.8 16.4 17.98 17,25 17,63 17,1 -3,1%
Slovakia 17.00 17.00 17.00 16.0 18 17.0 16 18.05 16 16,78 15,4 -8,2%
Slovenia 15 15.52 15.60 - - - - - - - - -
E.U.25 Countries 17.41 17.56 16.93 17.6 17.81 18.14 17.2 18 17.7 17,6 17,1 -3,3%
Bulgaria - - - - - - - - - - - -
Romania - 15.40 15.90 15.1 15 17.4 - - - - - -
Croatia - - - - - - 14.8 16.2 15.6 14.9 15 0.7%
E.U.28 Countries 17.41 17.55 16.92 17.6 17.79 18.14 17.3 18 18 18 17 -3,2%
Switzerland 17 17.50 16.40 17.8 17.3 18 18.5 18 16.9 17,6 17,6 0,0%
E.U.28 + Switzerl
.
17.41 17.42 16.91 17.6 17.78 18.13 17.4 18 18 17.6 17 -3,2%

6. BEET TONNAGES TRANSFORMED DAILY (tonnes) CEFS STATISTICS 2015
2004/05 2005/06 2006/07 2007/08 2008/09 2009/10 2010/11 2011/12 2012/13 2013/14 2014/15 Variation
E.U.25 Countries 1444742 1393011 1232911 1157019 981702 910361 880305 918581 739279 774298 785095 1%
E.U.28 Countries 1444742 1393818 1233911 1166429 991652 920311 899793 938345 758656 793340 796724 0,4%
E.U.28 + Switzerl
.
1453022 1402528 1242318 1174942 1000591 928963 908581 947645 768055 802542 806209 0,5%

7. AVERAGE LENGTH OF THE CAMPAIGN CEFS STATISTICS 2015
2004/05 2005/06 2006/07 2007/08 2008/09 2009/10 2010/11 2011/12 2012/13 2013/14 2014/15 Variation
Austria 76.2 78.3 99.0 102.4 120 122 119 136 130 138 176 27,5%
Belgium 98.0 95.0 96.0 92 112 126 115 131 118 112 121 8,0%
Denmark 97.0 89.0 112 120 115 118 112 138 136 118 123 4,2%
Finland 79.5 83.2 66 89 64 77 73 88 58 68 81 19,1%
France 86.0 86.0 88 91 92 103 102 112 104 104 113 8,7%
Germany 95.0 87.0 81.0 98 102 131 128 144 124 104 129 24,0%
Greece 74.0 95.0 67.0 42 47 82 56 21 88 55 71 28,3%
Ireland 77.0 - - - - - - - - - - -
Italy 60.0 104.0 81.0 70 70 74 84 65 70 50 90 79,0%
The Netherlands 85.3 104.1 97.7 93.4 128 140.2 126 129 120 120 130 8,3%
Portugal 94.0 43.0 25.0 23 - - - - - - - -
Spain 85.0 94.0 80.0 75 90 119 118 105 104 82 105 28,0%
Sweden 88.0 89.0 123.0 122 114 133 109 129 126 124 138 11,3%
United Kingdom 154.0 145.0 124.0 139.0 140.0 172.2 151 164 162 169 179 5,9%
Czech Republic 94.0 86.8 72.3 83.4 86 93.0 94 114 111 102 130 27,8%
Hungary 105.0 101.0 70.0 67 70 115 117 117 125 118 120 1,7%
Latvia - - - - - - - - - - - -
Lithuania 86.0 83.0 83.0 91 66 112 104 115 129 116 125 7,8%
Poland 87.0 88.0 88.4 94 89 116.5 101 103 109 93 111 19,4%
Slovakia 98.0 110.0 95.0 100 74 97 111 118 86 108 157 45,4%
Slovenia - - - - - - - - - - - -
E.U.25 Countries 92.4 95 89.8 95.2 100.8 120.46 113.3 123.8 124 125 125 0,0%
Bulgaria - 24.0 50.0 - - - - - - - - -
Romania - - - 69.7 70 (75.3)* (95.5)* (119)* (119)* - - -
Croatia 105 89 64 69 105 52,9%
E.U.28 Countries 92.4 95 89.8 95 100.6 120.46 113 124 116 108 125 15,1%
Switzerland 78.0 81.0 74.0 92.0 91. 75 74 100 90 76 103 36,2%
E.U.28+ Switzerl. 92.3 94.9 89.7 95 100.4 120.3 112.8 123.4 123.4 108 124 15,2%

8. PRODUCTION OF MOLASSES IN SUGAR FACTORIES & REFINERIES (tonnes) CEFS STATISTICS 2015
2004/05 2005/06 2006/07 2007/08 2008/09 2009/10 2010/11 2011/12 2012/13 2013/14 2014/15 Variation
Austria 102761 99629 100133 98758 111576 109227 95138 117458 115521 115711 166471 43,9%
Belgium 211918 129745 - 119142 125669 98412 113321 136743 116743 110954 114783 3,5%
Denmark 88970 81000 - 72300 73000 77000 70000 81000 75000 68000 77000 13,2%
Finland 39697 42315 - 23500 17000 19000 21000 27000 15000 18000 23000 27,8%
France 586000 - - 327580 - 107000 nc nc nc nc nc -
Germany 842468 797190 656450 737587 763641 754243 768310 726422 806538 713815 592469 -17,0%
Greece 94752 121997 62838 32484 36284 60311 31875 13867 19501 12555 16800 33,8%
Ireland - - - - - - - - - - - -
Italy 402000 580000 - - - - - - - - - -
The Netherlands 219371 245117 - 193206 218875 211118 181500 177000 180000 163856 188228 14,9%
Portugal 4140 8425 - 5815 - 4617 - - - - - -
Spain 322500 344000 354000 188200 156400 170700 138300 146335 120500 99858 125508 25,7%
Sweden 65463 67100 - 55700 51000 61000 58000 66000 58000 55000 61000 10,9%
United Kingdom 152407 128044 126443 112733 96956 92994 99809 92037 98458 106539 110545 3,8%
Czech Republic 140208 130986 110000 97780 80180 77581 88501 78220 66006 60494 89458 47,9%
Hungary 139443 82141 80408 56510 13398 26394 25592 31223 36402 30903 24343 -21,2%
Latvia - - - - - - - - - - - -
Lithuania 33976 27900 - 26200 - 18000 21000 25000 29000 24000 29000 20,8%
Poland 273999 387636 - 377603 - 381372 366453 431208 436904 439600 457584 4,1%
Slovakia 70228 82399 58921 34246 28123 36191 36686 38767 39142 39142 64249 64,1%
Slovenia - - - - - - - - - - - -
E.U.25 Countries 3790301 3355624 1549193 2559164 1772102 23055160 2115485 2188280 2212715 2058427 2140438 4,0%
Bulgaria - 2924 - - - 1000 - - - - - -
Romania - - 35533 - - - - - - - -
Croatia 59128 65684 58963 44917 46535 3,6%
E.U.28 Countries 3790301 3358548 1549193 2594697 172102 2306160 2174613 2253964 2271678 2103344 2186973 4,0%
Switzerland 47691 45126 39324 50694 50418 53883 43947 45700 52951 41116 56200 36,7%
E.U.28 + Switzerl. 3837992 3403674 1588517 2645391 1822520 2360043 2218560 2299664 2324629 2144460 2243173 4,6%

Fresh pulps
Humid pulps reduced to 13% of D.M.
Fresh pulps Supressed pulps reduced to 22% of
D.M.
Production of dry pulps With equal or less than 3% of
molasses
Production of dry pulps With more than 3% of molasses
Amount of molasses used in pulps
Austria - 8892 122592 87725 -
Belgium 2231 1136227 8094 - -
Denmark - 165000 120000 - 6300
Finland - 130000 - - -
France 56702 2713940 1124107 - -
Germany 28756 1550597 36791 1269692 -
Greece - 28900 - 13727 1213
Ireland - - - - -
Italy - - - - -
The Netherlands
- 1397358 35424 - -
Portugal - - - - -
Spain - 132232 52305 96395 4122
Sweden - 335000 49000 3000 15700
United Kingdom
- 104707 251720 321171 90520
Czech Republic - 1284832 256967 - -
Hungary - 212676 - - -
Latvia - - - - -
Lithuania - 99000 15000 - -
Poland 1091323 2956707 13405 127835 30807
Slovakia - 395009 - - -
Slovenia - - - - -
Bulgaria - - - - -
Romania - - - - -
Croatia 209 13388 53420 - -
EU28 1179221 12664464
2138825
1919545
148662
Switzerland nc 440000 - 32000 13000
TOTAL 1179221 13104465 2138825 1951545 161662
9. PRODUCTION OF BEET PULP (tonnes)
CEFS STATISTICS 2015

10. NUMBER OF SUGAR & REFINERY COMPANIES BY PRODUCTION YEAR CEFS STATISTICS 2015
2004/05 2005/06 2006/07 2007/08 2008/09 2009/10 2010/11
2011/12
2012/13
2013/14
2014/15
Austria 1 1 1 1 1 1 1 1 1 1 1
Belgium 2 2 2 2 2 2 2 2 2 2 2
Denmark 1 1 1 1 1 1 1 1 1 1 1
Finland 2 2 2 1 1 1 1 1 1 1 1
France 13 12 11 9 8 8 8 8 8 8 8
Germany 6 6 6 6 5 5 5 5 5 5 5
Greece 1 1 1 1 1 1 1 1 1 1 1
Ireland 1 1 - - - - - - - - -
Italy 8 8 5 5 4 4 4 4 4 4 4
The Netherlands 2 2 2 1 1 1 1 1 1 1 1
Portugal 3 3 3 3 2 3 3 - - - -
Spain 3 3 2 2 2 2 2 2 2 2 2
Sweden 1 1 1 2 1 1 1 1 1 1 1
United Kingdom 2 2 2 2 2 2 2 2 2 2 2
Czech Republic 7 7 6 5 5 5 5 5 5 5 5
Hungary 3 3 3 2 1 1 1 1 1 1 1
Latvia 2 2 2 - - - - - - - -
Lithuania 2 2 2 2 2 2 2 2 2 2 2
Poland 5 5 5 5 5 4 5 5 5 5 5
Slovakia 5 3 3 2 2 2 2 2 2 2 2
Slovenia 1 1 1 - - - - - - - -
E.U.25 Countries 71 68 61 52 46 46 47 44 44 44 44
Bulgaria 6 6 6 7 6 6 6 6 6 6 6
Romania - - - 6 6 6 6 6 6 6 6
Croatia 5 5 5 5 5
E.U.28 Countries 77 74 67 65 58 58 64 61 61 61 61
Switzerland 1 1 1 1 1 1 1 1 1 1 1
E.U.28 + Switzerl. 78 75 68 66 59 59 65 62 62 62 62

2004/05 2005/06 2006/07 2007/08 2008/09 2009/10 2010/11 2011/12 2012/13 2013/14 2014/15 Variation
Austria 3 3 2 2 2 2 2 2 2 2 2 0.0%
Belgium 6 5 5 5 3 3 3 3 3 3 3 0.0%
Denmark 3 3 3 2 2 2 2 2 2 2 2 0.0%
Finland 2 2 2 1 1 1 1 1 1 1 1 0.0%
France 30 30 30 30 25 25 25 25 25 25 25 0.0%
Germany 26 26 25 24 20 20 20 20 20 20 20 0.0%
Greece 5 5 5 3 3 3 3 3 3 3 3 0.0%
Ireland 2 1 - - - - - - -
Italy 17 19 6 6 4 4 4 4 4 4 4 0.0%
The Netherlands 5 3 3 3 2 2 2 2 2 2 2 0.0%
Portugal 1 1 1 1 - - - - - - - -
Spain 11 11 8 7 6 5 5 5 5 5 5 0.0%
Sweden 2 2 1 1 1 1 1 1 1 1 1 0.0%
United Kingdom 6 6 6 4 4 4 4 4 4 4 4 0.0%
Czech Republic 11 11 10 7 7 7 7 7 7 7 7 0.0%
Hungary 5 5 5 4 1 1 1 1 1 1 1 0.0%
Latvia 2 2 2 - - - - - - - - -
Lithuania 4 3 3 2 2 2 2 2 2 2 2 0.0%
Poland 43 40 31 29 19 18 18 18 18 18 18 0%
Slovakia 5 4 3 2 2 2 2 2 2 2 2 0.0%
Slovenia 1 1 1 - - - - - - - - -
E.U.25 Countries 190 183 152 133 104 102 102 102 102 102 102 0.0%
Bulgaria - 1 1 - - - - - - - - -
Romania 5 5 5 5 4 4 4 4 4 4 4 0.0%
Croatia 3 3 3 3 3 0.0%
E.U.28 Countries 195 189 158 138 108 106 109 109 109 109 109 0.0%
Switzerland 2 2 2 2 2 2 2 2 2 2 2 0.0%
E.U.28 + Switzerl. 197 191 160 140 110 109 111 111 111 111 111 0.0%
11. NUMBER OF FACTORIES OPERATING IN EACH PRODUCTION YEAR CEFS STATISTICS 2015

< 5000 t beet slicing daily capacity
2004/05 2005/06 2006/07 2007/08 2008/09 2009/10 2010/11 2011/12 2012/13 2013/14 2014/15
Austria - - - - - - - - - - -
Belgium - - - - - - - - - - -
Denmark - - - - - - - - - - -
Finland - - - - - - - - - - -
France 1 1 1 1 1 1 1 1 1 1 1
Germany 1 1 1 1 1 1 1 1 1 1 1
Greece 1 1 1 1 1 - - - 1 1 1
Ireland - - - - - - - - - - -
Italy - - - - - - - - - - -
The Netherlands - - - - - - - - - - -
Portugal - - - - -
- - - - - -
Spain 2 - - - - - - - - -
Sweden - - - - - - - - - - -
United Kingdom 1 1 1 - - - - 1 1 1 1
Czech Republic 9 9 8 5 5 5 5 5 5 5 5
Hungary - - - - - - - - - - -
Latvia - 2 2 - - - - - - - -
Lithuania 4 3 3 2 1 1 - - - - -
Poland 47 30 21 19 9 6 6 5 6 6 6
Slovakia 4 1 1 1 1 1 1 1 1 1 1
Slovenia 1 1 1 - - - - - - - -
E.U.25 Countries 71 50 40 30 19 15 14 14 14 14 14
Bulgaria - 1 1 - - - - - - - -
Romania - - - 5 4 - 1 - - - -
Croatia - - - - -
E.U.28 Countries 71 51 41 35 23 15 15 14 15 15 15
Switzerland - - - - - - - - - - -
E.U.28+Switzerl. 71 51 41 35 23 15 15 14 14 14 14

5000 < 8000 t beet slicing daily capacity
2004/05 2005/06 2006/07 2007/08 2008/09 2009/10 2010/11 2011/12 2012/13 2013/14 2014/15
Austria - - - - - - - - - - -
Belgium 2 1 1 - - - - - - - -
Denmark - - - - - - - - - - -
Finland 2 2 2 1 1 1 1 1 1 1 1
France 4 6 6 5 4 4 3 4 4 4 4
Germany 6 6 6 6 4 4 6 6 6 6 6
Greece 4 4 3 2 2 2 2 3 2 2 2
Ireland - - 2 - - - - - - - -
Italy 1 2 - - - - - - - - -
The Netherlands - - - - - - - - - - -
Portugal 1 1 1 1 -
- - - - - -
Spain 1 1 1 1 1 1 1 1 1 1 1
Sweden - - - - - - - - - - -
United Kingdom 1 1 1 - - - - 1 - - -
Czech Republic 1 1 1 1 1 1 1 1 1 1 1
Hungary 4 4 4 4 1 - 1 1 1 1 1
Latvia - - - - - - - - - - -
Lithuania - - - - 1 1 1 1 1 1 1
Poland 9 10 9 9 9 11 10 10 9 9 9
Slovakia 1 2 2 1 1 1 1 1 1 1 1
Slovenia - - - - - - - - - - -
E.U.25 Countries 37 41 39 31 25 26 27 30 28 28 28
Bulgaria - - - - - - - - - - -
Romania - - - - - - - - - - -
Croatia 3 3 3 3 3 3
E.U.28 Countries 37 41 39 31 25 26 27 30 31 31 31
Switzerland - - - - - - - - - - -
E.U.28+Switzerl. 37 41 39 31 25 26 27 30 31 31 31

8000 < 12000 t beet slicing daily capacity
2004/05 2005/06 2006/07 2007/08 2008/09 2009/10 2010/11 2011/12 2012/13 2013/14 2014/15
Austria - - - - - - - 1 1 1 1
Belgium 3 3 3 4 2 1 2 2 2 2 2
Denmark 2 2 2 2 2 2 2 2 2 2 2
Finland - - - - - - - - - - -
France 11 8 8 9 6 9 6 6 6 6 6
Germany 9 9 8 7 6 6 3 3 3 3 3
Greece - - - - - - 1 - - - -
Ireland - - - - - - - - - - -
Italy 7 6 1 - - - - - - - -
The Netherlands 1 - - - - - - - - - -
Portugal - - - - -
- - - - - -
Spain 8 7 7 6 5 4 4 4 4 4 4
Sweden 1 - - - - - - - - - -
United Kingdom 2 2 2 2 2 2 2 2 2 2 2
Czech Republic 1 - - - - - - - - - -
Hungary 1 1 1 - - - - - - - -
Latvia - - - - - - - - - - -
Lithuania - - - - - - - - - - -
Poland - - 1 1 - - 1 3 3 3 3
Slovakia - - - - - - - - - - -
Slovenia - - - - - - - - - - -
E.U.25 Countries 46 38 33 31 23 24 21 23 23 23 23
Bulgaria - - - - - - - - - - -
Romania - - - - - - - - - - -
Croatia - - - - -
E.U.28 Countries 46 38 33 31 23 24 21 23 23 23 23
Switzerland 2 2 2 2 - - 2 2 2 2 2
E.U.28+Switzerl. 48 40 35 33 23 24 23 25 25 25 25

12000 < 15000 t beet slicing daily capacity
2004/05 2005/06 2006/07 2007/08 2008/09 2009/10 2010/11 2011/12 2012/13 2013/14 2014/15
Austria 3 3 2 2 2 2 2 1 1 1 1
Belgium - - - - 2 - - - - -
Denmark 1 1 1 - - - - - - - -
Finland - - - - - - - - - - -
France 4 6 7 3 6 5 3 2 2 2 2
Germany 5 5 5 5 5 5 5 5 5 5 5
Greece - - - - - - - - - - -
Ireland - - - - - - - - - - -
Italy 9 10 4 6 4 4 4 4 4 4 4
The Netherlands 2 1 1 - - - - - - - -
Portugal - - - - -
- - - - - -
Spain - - - - - - - - - - -
Sweden - 1 - - - - - - - - -
United Kingdom 1 1 1 1 1 1 1 1 1 1 1
Czech Republic - - 1 1 1 - 1 1 1 1 1
Hungary - - - - - - - - - - -
Latvia - - - - - - - - - - -
Lithuania - - - - - - - - - - -
Poland - - - - - 1 1 - - - -
Slovakia - - - - - - - - - - -
Slovenia - - - - - - - - - - -
E.U.25 Countries 25 28 22 18 19 20 17 14 14 14 14
Bulgaria - - - - - - - - - - -
Romania - - - - - - - - - - -
Croatia - - - - -
E.U.28 Countries 25 28 22 18 19 20 17 14 14 14 14
Switzerland - - - - - - - - - - -
E.U.28+Switzerl. 25 28 22 18 19 20 17 14 14 14 14

>15000 t beet slicing daily capacity
2004/05 2005/06 2006/07 2007/08 2008/09 2009/10 2010/11 2011/12 2012/13 2013/14 2014/15
Austria - - - - - - - - - - -
Belgium 1 1 1 1 1 - 1 1 1 1 1
Denmark - - - - - - - - - - -
Finland - - - - - - - - - - -
France 10 9 8 12 8 6 12 12 12 12 12
Germany 5 5 5 5 4 4 5 5 5 5 5
Greece - - - - - - - - - - -
Ireland - - - - - - - - - - -
Italy - 1 1 - - - - - - - -
The Netherlands 2 2 2 3 2 2 2 2 2 2 2
Portugal - - - - -
- - - - - -
Spain - - - - - - - - - - -
Sweden 1 1 1 1 1 1 1 1 1 1 1
United Kingdom 1 1 1 1 1 1 1 1 1 1 1
Czech Republic - - - - - - - - - - -
Hungary - - - - - - - - - - -
Latvia - - - - - - - - - - -
Lithuania - - - - - - - - - - -
Poland - - - - 1 - - - - - -
Slovakia - - - - - - - - - - -
Slovenia - - - - - - - - - - -
E.U.25 Countries 20 20 19 23 18 14 22 22 22 22 22
Bulgaria - - - - - - - - - - -
Romania - - - - - - - - - - -
Croatia - - - - -
E.U.28 Countries 20 20 19 23 18 14 22 22 22 22 22
Switzerland - - - - - - - - - - -
E.U.28+Switzerl. 20 20 19 23 18 14 22 22 22 22 22

2004/05 2005/06 2006/07 2007/08 2008/09 2009/10
2010/11
2011/12
2012/13
2013/14
2014/2015 Variation
Austria 9479 9318 8915 8566 8281 8069 7818 7574 7486 7345 7184 -2,2%
Belgium 14684 14301 13697 12996 8572 8342 8192 7994 7812 7611 7656 0,6%
Denmark 4670 4370 3790 2840 1870 1590 1510 1445 1406 1321 1268 -4,0%
Finland 2300 2170 2040 1510 1060 1010 930 875 750 757 812 7,3%
France 29800 29500 29130 31000 26000 26000 26000 26000 26000 26000 26000 0,0%
Germany 46646 46676 42956 40125 34436 33256 32542 31319 31319 30663 30231 -1,4%
Greece 13423 15532 10136 5458 5015 7165 4114 2133 3100 1875 2360 25,9%
Ireland 3706 3700 - - - - - - - - - -
Italy 46645 40000 17000 13300 9201 9362 10909 7000 9500 9500 8.200 -13,7%
The Netherlands 15241 14466 13894 12350 9431 9120 8890 8457 8284 8154 8130 -0,3%
Portugal 700 385 300 146 206
218 - - - - - -
Spain 20000 19000 16000 12700 9500 8900 8500 9722 7500 6800 6800 0,0%
Sweden 3620 3470 3170 2610 2370 2210 2150 2080 2012 1919 1873 -2,4%
United Kingdom 6970 6646 6508 4876 4566 4202 4092 3681 3650 3583 3487 -2,7%
Czech Republic 935 901 866 767 718 711 730 712 723 758 746 -1,6%
Hungary 809 809 809 679 74 114 155 173 221 237 389 64,1%
Latvia 418 386 386 - - - - - - - - -
Lithuania 1800 1580 1510 1160 1000 636 593 602 402 381 371 -2,6%
Poland 77963 72790 63722 60832 40988 39986 38208 35860 35861 35723 34591 -3,2%
Slovakia 412 387 355 225 152 180 187 186 197 194 213 9,8%
Slovenia - - - - - - - - - - - -
E.U.25 Countries 300211 286387 235184 212140 163439 161071 155520 145813 146223 142821 140311 -1,8%
Bulgaria - 20 25 - - - - - - - - -
Romania 14311 18483 13764 5462 1555 1463 1362 1177 (1177)* (1177)* (1177)* 0.0%
Croatia 1363 1087 1148 990 867 -12,4%
E.U.28 Countries 314532 304890 248973 217602 164994 162534 158245 148077 148548 144988 141178 -2,6%
Switzerland 7253 7126 7017 6897 6749 6472 6153 6100 6006 5942 5851 -1,5%
E.U.28 + Switzerl. 321785 312016 255990 224499 171743 169006 164398 154177 154554 150930 147029 -2,6%
13. NUMBER OF BEET GROWERS CEFS STATISTICS 2015

14. Sugar processing industry employment “during” the beet processing campaign * CEFS STATISTICS 2015
* The employment ‘during’ the campaign includes permanent staff and seasonal workers. + Estimate based on previous year’s data
2004/05 2005/06 2006/07 2007/08 2008/09 2009/10 2010/2011 2011/12 2012/13 2013/14 2014/15 Variation
Austria 1049 1015 872 868 858 835 794 793 798 812 828 2,0%
Belgium 970 810 776 963 767 646 658 713 665 655 664 1,4%
Denmark 821 763 687 644 635 627 600 572 551 552 527 -4,5%
Finland 196 489 451 320 275 297 260 282 278 304 295 -3,0%
France 8606 8160 7683 7259 6531 6609 6645 6733 6743 6741 6682 -0,9%
Germany 6517 6294 5783 5483 4813 4856 4408 4967 5070 5135 5266 2,6%
Greece 2553 2488 2263 1530 1593 1491 1350 1176 874 850 470 -44,7%
Ireland 650 325 325 325 - - - - - - - -
Italy 4700 5000 1700 1370 1320 1240 1240 1240 1240 1240 1100 -11,3%
The Netherlands 1459 1180 1066 824 732 693 678 664 771 791 792 0,2%
Portugal 285 246 240 173 150 156 - - - - - -
Spain 2900 2720 2190 1860 1700 1450 1490 1592 1700 1818 1722 -5,3%
Sweden 747 719 631 558 525 508 490 489 476 479 483 0,8%
United Kingdom 1264 1284 1252 1213 1000 1435 1247 1365 1296 1342 1122 -16,4%
Czech Republic 1284 1949 1842 1238 1230 1218 1214 1371 1485 1410 1423 0,9%
Hungary 1249 1101 1101 787 223 208 202 273 315 321 282 -12,1%
Latvia - - - - - - - - - - - -
Lithuania 1443 1094 948 917 740 391 300 218 287 287 289 0,7%
Poland 14937 13532 10122 8522 5918 4848 5177 4857 5366 5244 5065 -3,4%
Slovakia 996 980 710 550 550 304 312 435 430 450 450 0,0%
Slovenia - - - - - - - - - - - -
E.U.25 Countries 52626 50149 40642 35404 29560 27812 27065 27740 28345 28431 27459 -3,4%
Bulgaria - 350 370 - - - - - - - - -
Romania - 1780 1780 1780 1780 1200 (1200)+ (1200)+ (1200)+ (1200)* (1200)* 0,0%
Croatia 1380 1135 1067 967 634 -34,4%
E.U.28 Countries 52626 52279 42792 37184 31340 29012 29645 30075 30612 30598 29293 -4,3%
Switzerland 377 372 363 353 350 347 340 346 345 330 315 -4,5%
E.U.28 + Switzerl.
53003
52651
43155
37537
31690
29359
29985
30421 30957
30928
29608
-4.3%

15. Sugar processing industry employment “between” the beet processing campaign CEFS STATISTICS 2015
2004/05 2005/06 2006/07 2007/08 2008/09 2009/10 2010/11 2011/12 2012/13 2013/14 2014/15 Variation
Austria 563 568 564 467 475 450 424 438 470 468 507 8,3%
Belgium 442 153 204 758 624 543 565 641 584 584 540 -7,5%
Denmark 717 668 598 597 600 603 580 537 540 527 510 -3,2%
Finland 129 437 314 296 250 298 260 270 285 288 275 -4,5%
France 6112 5781 5472 5129 4830 4474 4808 4906 4950 4969 4923 -0,9%
Germany 6099 5939 5446 5179 4544 4491 4084 4578 4687 4713 4828 2,4%
Greece 936 866 742 630 603 603 450 278 284 270 250 -7,4%
Ireland 450 - - - - - - - - - - -
Italy 2300 1800 800 586 440 440 440 440 440 440 300 -31,8%
The Netherlands 1048 878 802 678 620 621 615 604 779 767 701 -8,7%
Portugal 164 150 150 133 130 146 - - - - - -
Spain 1590 1520 1230 1225 1150 1100 1100 1066 1100 1100 855 -23,0%
Sweden 662 620 500 466 440 426 415 431 407 410 399 -2,7%
United Kingdom 1000 1000 930 998 1000 1113 1079 1188 1109 1166 1009 -13,5%
Czech Republic 998 1219 1152 845 831 870 850 957 1045 1001 979 -2,2%
Hungary - - - 418 202 208 223 198 218 217 226 4,1%
Latvia - - - - - - - - - - - -
Lithuania 976 797 725 664 580 338 295 179 234 241 237 -1,7%
Poland 8991 7617 6530 5612 4049 3282 3561 3068 3447 3475 3410 -1,9%
Slovakia 752 735 512 300 300 260 260 280 280 300 300 0,0%
Slovenia - - - - - - - - - - - -
E.U.25 Countries 33929 30748 26671 24981 21673 20566 20009 20059 20461 20937 20248 -3,3%
Bulgaria - 240 240 - - - - - - - - -
Romania - 1230 1230 400 (400)+ (400)+ (400)+ (400)* (400)* 0.0%
Croatia 1001 849 818 741 400 -46,0%
E.U.28 Countries 33929 30988 26911 26211 22903 20966 21410 21308 22077 22078 21048 -4,7%
Switzerland 316 309 300 282 277 272 269 271 265 265 255 -3,8%
E.U.28 + Switzerl. 34245 31297 27211 26493 23180 21238 21679 21579 21524 21602 20903 -3,3%
* The employment ‘between’ the campaign is only permanent staff + Estimate based on previous year’s data