Embed Size (px)
Citation preview
Hiramatsu et al., Sci. Adv. 2019; 5 : eaau0241 16 January 2019
S C I E N C E A D V A N C E S | R E S E A R C H A R T I C L E
1 of 8
C E L L B I O L O G Y
High-throughput label-free molecular fingerprinting flow cytometryKotaro Hiramatsu1,2,3*†, Takuro Ideguchi2,3,4*, Yusuke Yonamine5, SangWook Lee1, Yizhi Luo1, Kazuki Hashimoto1, Takuro Ito1,6, Misa Hase1, Jee-Woong Park1, Yusuke Kasai7, Shinya Sakuma7, Takeshi Hayakawa8,9, Fumihito Arai7,8, Yu Hoshino5, Keisuke Goda1,6†
Flow cytometry is an indispensable tool in biology for counting and analyzing single cells in large heterogeneous populations. However, it predominantly relies on fluorescent labeling to differentiate cells and, hence, comes with several fundamental drawbacks. Here, we present a high-throughput Raman flow cytometer on a microfluidic chip that chemically probes single live cells in a label-free manner. It is based on a rapid-scan Fourier-transform coher-ent anti-Stokes Raman scattering spectrometer as an optical interrogator, enabling us to obtain the broadband molecular vibrational spectrum of every single cell in the fingerprint region (400 to 1600 cm−1) with a record- high throughput of ~2000 events/s. As a practical application of the method not feasible with conventional flow cytom-etry, we demonstrate high-throughput label-free single-cell analysis of the astaxanthin productivity and photo-synthetic dynamics of Haematococcus lacustris.
INTRODUCTIONFlow cytometry is an essential tool in a diverse range of fields such as microbiology, immunology, and stem cell biology (1–4). It counts and analyzes large heterogeneous cell populations via the expres-sion of cell surface and intracellular molecules (1). To differentiate cells, flow cytometry predominantly relies on the measurement of fluorescence signals produced by fluorescent-labeled antibodies for detecting proteins or ligands that bind to specific cell-associated molecules (1). Unfortunately, such fluorescent labeling inevitably comes with several fundamental drawbacks such as cellular toxicity, photobleaching, interference with natural biological functions, spectral overlap, autofluorescence, and nonspecific binding (5). In addition, the process of labeling can be time-consuming and affect the results of time-sensitive samples (6). Furthermore, fluorescent labeling is not applicable to many cell types that are difficult or im-possible to label due to the unavailability or unstable binding effi-ciency of fluorescent probes, in particular microorganisms such as bacteria and microalgae (5), limiting the effectiveness and broad use of flow cytometry.
To circumvent the drawbacks associated with fluorescent label-ing, Raman flow cytometry has been proposed and demonstrated (7, 8). Raman flow cytometry is based on the Raman effect, which is the inelastic scattering of incident photons by molecular vibrations, and can probe single cells via intracellular molecular vibrations in a label-free manner. Raman flow cytometry provides substantial
advantages over conventional fluorescent labeling–based flow cy-tometry. Specifically, since Raman flow cytometry directly probes intracellular molecules, it is free from cellular toxicity, photobleach-ing, interference with biological functions, and nonspecific binding. Moreover, with narrow Raman lines, Raman flow cytometry offers much richer cellular information than fluorescent labeling–based flow cytometry, which only provides up to several colors (molecules) due to their spectral overlap. Unfortunately, despite all these advan-tages, the throughput of Raman flow cytometry is significantly low and limited to ~1 event/s due to the weak interaction between light and molecules in Raman scattering (7, 9).
In the past years, efforts have been made to circumvent this pre-dicament by using a few coherent techniques (10–12). In multiplex coherent anti-Stokes Raman scattering (CARS) flow cytometry (10), its throughput was limited to 160 events/s in the narrow CH-stretching region (2600 to 3200 cm−1), mainly due to the limited readout rate of a charge-coupled device camera. In stimulated Raman scattering (SRS) flow cytometry (12), its throughput was improved to 560 events/s in an even narrower part of the CH- stretching re-gion (2900 to 3100 cm−1). Although these reports have shown the feasibility of Raman flow cytometry, its implementation is inade-quate for practical use in terms of information content (i.e., spec-tral content or specificity), sensitivity, or throughput (fig. S1).
Here, we present a high-throughput Raman flow cytometer on a microfluidic chip that chemically probes large heterogeneous populations of single live cells in a label-free manner. The high- throughput yet high-sensitivity Raman spectral acquisition is made possible by using a rapid-scan Fourier-transform CARS (FT-CARS) spectrometer (the fastest broadband coherent Raman spectrometer to date) (13, 14) as an optical interrogator, which provides several orders of magnitude faster data acquisition than a spontaneous Raman scattering spectrometer. FT-CARS spectroscopy is also advanta-geous over conventional frequency-domain multiplex CARS spec-troscopy by virtue of its ability to acquire broadband nonresonant background-free (distortion-free) Raman spectra (13, 14). Our use of an acoustofluidic-focusing microfluidic chip for tight three- dimensional (3D) focusing of every single cell in high-speed flow
1Department of Chemistry, The University of Tokyo, Tokyo 113-0033, Japan. 2Research Centre for Spectrochemistry, The University of Tokyo, Tokyo 113-0033, Japan. 3PRESTO, Japan Science and Technology Agency, Saitama 332-0012, Japan. 4Depart-ment of Physics, The University of Tokyo, Tokyo 113-0033, Japan. 5Department of Chemical Engineering, Kyushu University, Fukuoka 819-0395, Japan. 6Japan Science and Technology Agency, Saitama 332-0012, Japan. 7Department of Micro-Nano Mechanical Science and Engineering, Nagoya University, Aichi 464-8603, Japan. 8Institute of Innovation for Future Society, Nagoya University, Aichi 464-8603, Japan. 9Department of Precision Mechanics, Faculty of Science and Engineering, Chuo University, Tokyo 112-8551, Japan.*These authors contributed equally to this work.†Corresponding author. Email: [email protected] (K.H.); [email protected] (K.G.)
Copyright © 2019 The Authors, some rights reserved; exclusive licensee American Association for the Advancement of Science. No claim to original U.S. Government Works. Distributed under a Creative Commons Attribution NonCommercial License 4.0 (CC BY-NC).
on August 19, 2019
http://advances.sciencemag.org/
Dow
nloaded from
Hiramatsu et al., Sci. Adv. 2019; 5 : eaau0241 16 January 2019
S C I E N C E A D V A N C E S | R E S E A R C H A R T I C L E
2 of 8
allows stable Raman spectral acquisition with high efficiency. In addition, an optical subsystem to obtain forward scattering signals and/or bright-field images in conjunction with FT-CARS spectra is equipped to confirm the presence or absence of cells at the optical interrogation point. The seamless integration of these techniques enables us to obtain the broadband molecular vibrational spectrum of every single cell in the fingerprint region (400 to 1600 cm−1) with a record-high throughput of ~2000 events/s, which is comparable to the throughput of conventional fluorescent labeling–based flow cytometers. This throughput is approximately 1000 times higher than that of previously demonstrated broadband Raman flow cytom-eters (fig. S1) (9–11). Furthermore, our method is essentially supe-rior to SRS flow cytometry (12), as it offers much richer information content (i.e., spectral content) and is free from the broad background signal originating from cross-phase modulation, which is detrimental in SRS (15), as evidenced by our demonstrations below. Our proof- of-principle demonstration of the method using polymer beads and Euglena gracilis (a microalgal model organism) shows its high chem-ical specificity and classification accuracy without labeling. To show a practical application of the method that is not feasible with con-ventional fluorescent labeling–based flow cytometry mainly due to the lack of fluorescent probes in the field of microbiology, we show high-throughput label-free single-cell analysis of the astaxanthin productivity and photosynthetic dynamics of Haematococcus lacustris, a commercially important microalgal species widely known to pro-duce natural astaxanthin as a super antioxidant (16).
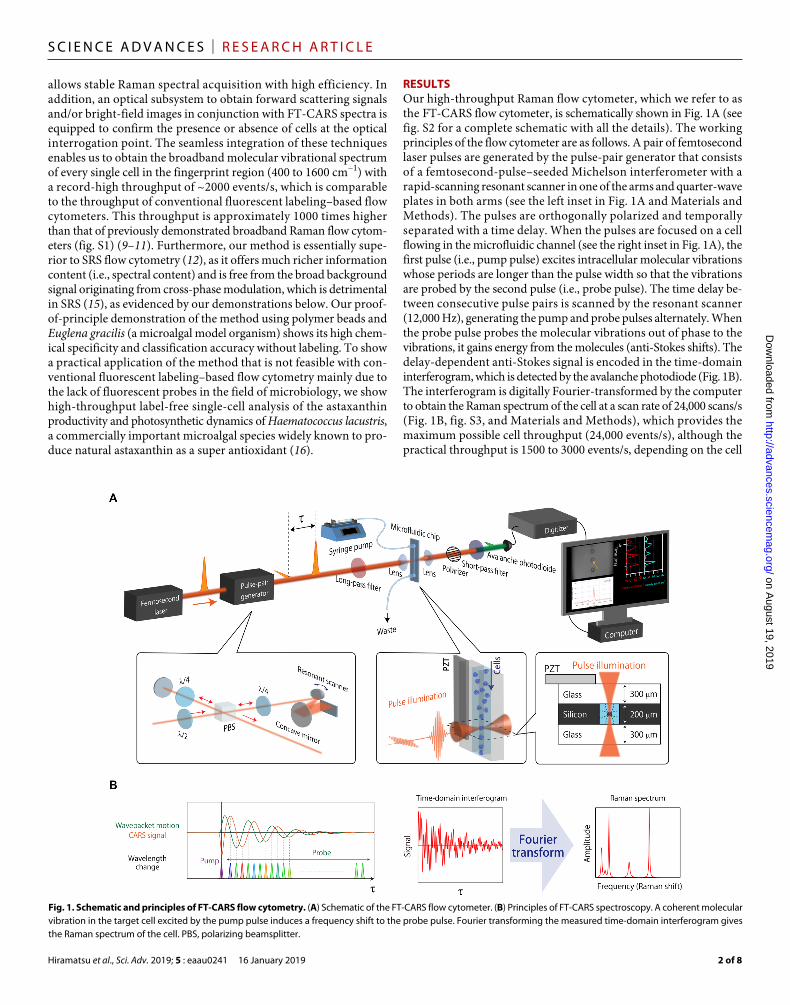
RESULTSOur high-throughput Raman flow cytometer, which we refer to as the FT-CARS flow cytometer, is schematically shown in Fig. 1A (see fig. S2 for a complete schematic with all the details). The working principles of the flow cytometer are as follows. A pair of femto second laser pulses are generated by the pulse-pair generator that consists of a femtosecond-pulse–seeded Michelson interferometer with a rapid-scanning resonant scanner in one of the arms and quarter-wave plates in both arms (see the left inset in Fig. 1A and Materials and Methods). The pulses are orthogonally polarized and temporally separated with a time delay. When the pulses are focused on a cell flowing in the microfluidic channel (see the right inset in Fig. 1A), the first pulse (i.e., pump pulse) excites intracellular molecular vibrations whose periods are longer than the pulse width so that the vibrations are probed by the second pulse (i.e., probe pulse). The time delay be-tween consecutive pulse pairs is scanned by the resonant scanner (12,000 Hz), generating the pump and probe pulses alternately. When the probe pulse probes the molecular vibrations out of phase to the vibrations, it gains energy from the molecules (anti-Stokes shifts). The delay-dependent anti-Stokes signal is encoded in the time-domain interferogram, which is detected by the avalanche photodiode (Fig. 1B). The interferogram is digitally Fourier-transformed by the computer to obtain the Raman spectrum of the cell at a scan rate of 24,000 scans/s (Fig. 1B, fig. S3, and Materials and Methods), which provides the maximum possible cell throughput (24,000 events/s), although the practical throughput is 1500 to 3000 events/s, depending on the cell
Fig. 1. Schematic and principles of FT-CARS flow cytometry. (A) Schematic of the FT-CARS flow cytometer. (B) Principles of FT-CARS spectroscopy. A coherent molecular vibration in the target cell excited by the pump pulse induces a frequency shift to the probe pulse. Fourier transforming the measured time-domain interferogram gives the Raman spectrum of the cell. PBS, polarizing beamsplitter.
on August 19, 2019
http://advances.sciencemag.org/
Dow
nloaded from
Hiramatsu et al., Sci. Adv. 2019; 5 : eaau0241 16 January 2019
S C I E N C E A D V A N C E S | R E S E A R C H A R T I C L E
3 of 8
size and concentration not to clog the microfluidic channel. To ensure accurate and consistent measurements in the high-speed flow, cells are 2D focused into a single stream by acoustic standing waves generated by the piezoelectric transducer (PZT) (see the right inset in Fig. 1A) so that all the cells are optically interrogated at the center of the microchannel (see figs. S4 and S5 and Materials and Methods for the details of the fabricated microfluidic chip and the fabrication steps).
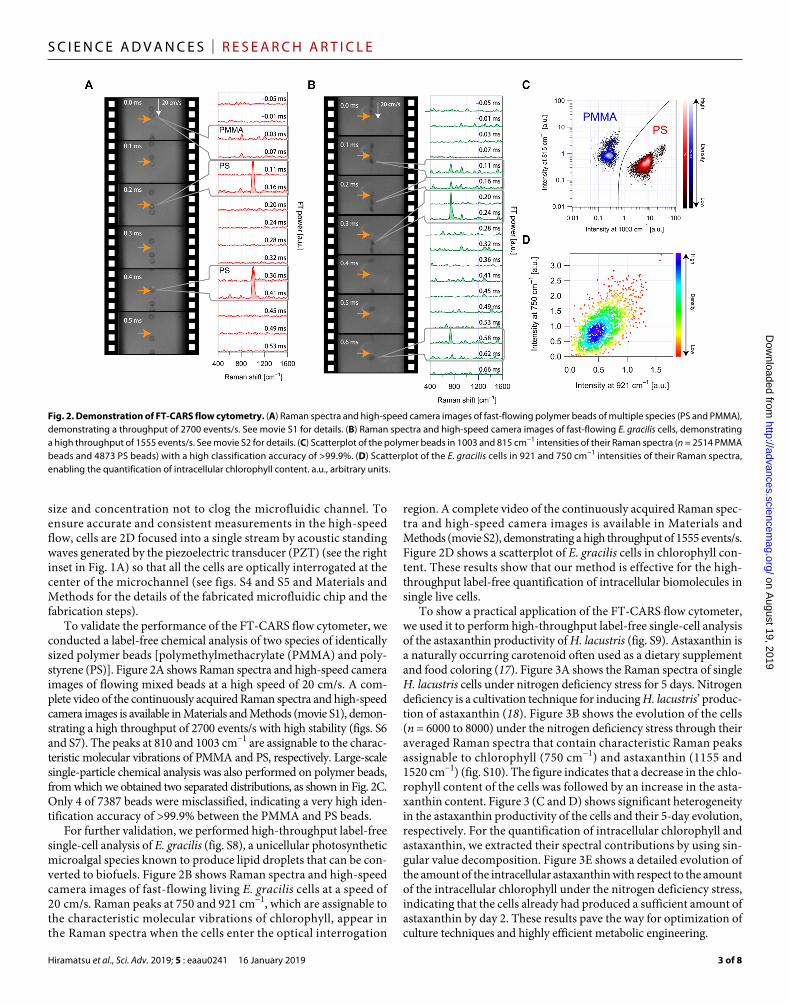
To validate the performance of the FT-CARS flow cytometer, we conducted a label-free chemical analysis of two species of identically sized polymer beads [polymethylmethacrylate (PMMA) and poly-styrene (PS)]. Figure 2A shows Raman spectra and high-speed camera images of flowing mixed beads at a high speed of 20 cm/s. A com-plete video of the continuously acquired Raman spectra and high- speed camera images is available in Materials and Methods (movie S1), demon-strating a high throughput of 2700 events/s with high stability (figs. S6 and S7). The peaks at 810 and 1003 cm−1 are assignable to the charac-teristic molecular vibrations of PMMA and PS, respectively. Large-scale single-particle chemical analysis was also performed on polymer beads, from which we obtained two separated distributions, as shown in Fig. 2C. Only 4 of 7387 beads were misclassified, indicating a very high iden-tification accuracy of >99.9% between the PMMA and PS beads.
For further validation, we performed high-throughput label-free single-cell analysis of E. gracilis (fig. S8), a unicellular photosynthetic microalgal species known to produce lipid droplets that can be con-verted to biofuels. Figure 2B shows Raman spectra and high-speed camera images of fast-flowing living E. gracilis cells at a speed of 20 cm/s. Raman peaks at 750 and 921 cm−1, which are assignable to the characteristic molecular vibrations of chlorophyll, appear in the Raman spectra when the cells enter the optical interrogation
region. A complete video of the continuously acquired Raman spec-tra and high-speed camera images is available in Materials and Methods (movie S2), demonstrating a high throughput of 1555 events/s. Figure 2D shows a scatterplot of E. gracilis cells in chlorophyll con-tent. These results show that our method is effective for the high- throughput label-free quantification of intracellular biomolecules in single live cells.
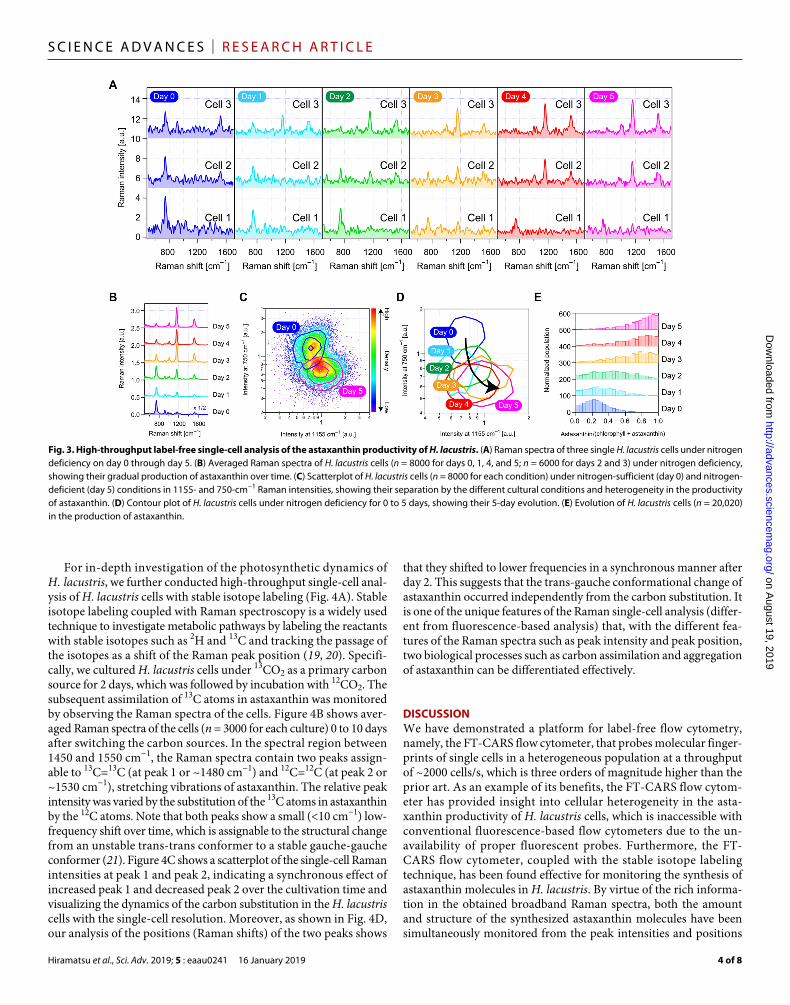
To show a practical application of the FT-CARS flow cytometer, we used it to perform high-throughput label-free single-cell analysis of the astaxanthin productivity of H. lacustris (fig. S9). Astaxanthin is a naturally occurring carotenoid often used as a dietary supplement and food coloring (17). Figure 3A shows the Raman spectra of single H. lacustris cells under nitrogen deficiency stress for 5 days. Nitrogen deficiency is a cultivation technique for inducing H. lacustris’ produc-tion of astaxanthin (18). Figure 3B shows the evolution of the cells (n = 6000 to 8000) under the nitrogen deficiency stress through their averaged Raman spectra that contain characteristic Raman peaks assignable to chlorophyll (750 cm−1) and astaxanthin (1155 and 1520 cm−1) (fig. S10). The figure indicates that a decrease in the chlo-rophyll content of the cells was followed by an increase in the asta-xanthin content. Figure 3 (C and D) shows significant heterogeneity in the astaxanthin productivity of the cells and their 5-day evolution, respectively. For the quantification of intracellular chlorophyll and astaxanthin, we extracted their spectral contributions by using sin-gular value decomposition. Figure 3E shows a detailed evolution of the amount of the intracellular astaxanthin with respect to the amount of the intracellular chlorophyll under the nitrogen deficiency stress, indicating that the cells already had produced a sufficient amount of astaxanthin by day 2. These results pave the way for optimization of culture techniques and highly efficient metabolic engineering.
Fig. 2. Demonstration of FT-CARS flow cytometry. (A) Raman spectra and high-speed camera images of fast-flowing polymer beads of multiple species (PS and PMMA), demonstrating a throughput of 2700 events/s. See movie S1 for details. (B) Raman spectra and high-speed camera images of fast-flowing E. gracilis cells, demonstrating a high throughput of 1555 events/s. See movie S2 for details. (C) Scatterplot of the polymer beads in 1003 and 815 cm−1 intensities of their Raman spectra (n = 2514 PMMA beads and 4873 PS beads) with a high classification accuracy of >99.9%. (D) Scatterplot of the E. gracilis cells in 921 and 750 cm−1 intensities of their Raman spectra, enabling the quantification of intracellular chlorophyll content. a.u., arbitrary units.
on August 19, 2019
http://advances.sciencemag.org/
Dow
nloaded from
Hiramatsu et al., Sci. Adv. 2019; 5 : eaau0241 16 January 2019
S C I E N C E A D V A N C E S | R E S E A R C H A R T I C L E
4 of 8
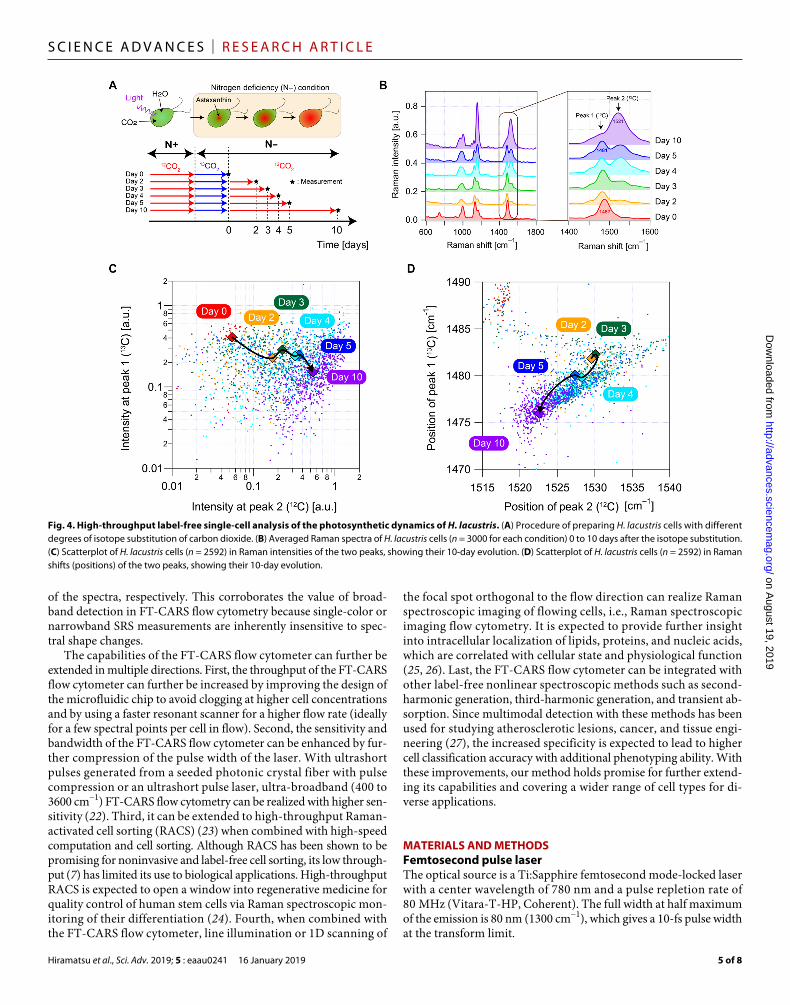
For in-depth investigation of the photosynthetic dynamics of H. lacustris, we further conducted high-throughput single-cell anal-ysis of H. lacustris cells with stable isotope labeling (Fig. 4A). Stable isotope labeling coupled with Raman spectroscopy is a widely used technique to investigate metabolic pathways by labeling the reactants with stable isotopes such as 2H and 13C and tracking the passage of the isotopes as a shift of the Raman peak position (19, 20). Specifi-cally, we cultured H. lacustris cells under 13CO2 as a primary carbon source for 2 days, which was followed by incubation with 12CO2. The subsequent assimilation of 13C atoms in astaxanthin was monitored by observing the Raman spectra of the cells. Figure 4B shows aver-aged Raman spectra of the cells (n = 3000 for each culture) 0 to 10 days after switching the carbon sources. In the spectral region between 1450 and 1550 cm−1, the Raman spectra contain two peaks assign-able to 13C=13C (at peak 1 or ~1480 cm−1) and 12C=12C (at peak 2 or ~1530 cm−1), stretching vibrations of astaxanthin. The relative peak intensity was varied by the substitution of the 13C atoms in astaxanthin by the 12C atoms. Note that both peaks show a small (<10 cm−1) low- frequency shift over time, which is assignable to the structural change from an unstable trans-trans conformer to a stable gauche-gauche conformer (21). Figure 4C shows a scatterplot of the single-cell Raman intensities at peak 1 and peak 2, indicating a synchronous effect of increased peak 1 and decreased peak 2 over the cultivation time and visualizing the dynamics of the carbon substitution in the H. lacustris cells with the single-cell resolution. Moreover, as shown in Fig. 4D, our analysis of the positions (Raman shifts) of the two peaks shows
that they shifted to lower frequencies in a synchronous manner after day 2. This suggests that the trans-gauche conformational change of astaxanthin occurred independently from the carbon substitution. It is one of the unique features of the Raman single-cell analysis (differ-ent from fluorescence-based analysis) that, with the different fea-tures of the Raman spectra such as peak intensity and peak position, two biological processes such as carbon assimilation and aggregation of astaxanthin can be differentiated effectively.
DISCUSSIONWe have demonstrated a platform for label-free flow cytometry, namely, the FT-CARS flow cytometer, that probes molecular finger-prints of single cells in a heterogeneous population at a throughput of ~2000 cells/s, which is three orders of magnitude higher than the prior art. As an example of its benefits, the FT-CARS flow cytom-eter has provided insight into cellular heterogeneity in the asta-xanthin productivity of H. lacustris cells, which is inaccessible with conventional fluorescence-based flow cytometers due to the un-availability of proper fluorescent probes. Furthermore, the FT-CARS flow cytometer, coupled with the stable isotope labeling technique, has been found effective for monitoring the synthesis of astaxanthin molecules in H. lacustris. By virtue of the rich informa-tion in the obtained broadband Raman spectra, both the amount and structure of the synthesized astaxanthin molecules have been simultaneously monitored from the peak intensities and positions
Fig. 3. High-throughput label-free single-cell analysis of the astaxanthin productivity of H. lacustris. (A) Raman spectra of three single H. lacustris cells under nitrogen deficiency on day 0 through day 5. (B) Averaged Raman spectra of H. lacustris cells (n = 8000 for days 0, 1, 4, and 5; n = 6000 for days 2 and 3) under nitrogen deficiency, showing their gradual production of astaxanthin over time. (C) Scatterplot of H. lacustris cells (n = 8000 for each condition) under nitrogen-sufficient (day 0) and nitrogen- deficient (day 5) conditions in 1155- and 750-cm−1 Raman intensities, showing their separation by the different cultural conditions and heterogeneity in the productivity of astaxanthin. (D) Contour plot of H. lacustris cells under nitrogen deficiency for 0 to 5 days, showing their 5-day evolution. (E) Evolution of H. lacustris cells (n = 20,020) in the production of astaxanthin.
on August 19, 2019
http://advances.sciencemag.org/
Dow
nloaded from
Hiramatsu et al., Sci. Adv. 2019; 5 : eaau0241 16 January 2019
S C I E N C E A D V A N C E S | R E S E A R C H A R T I C L E
5 of 8
of the spectra, respectively. This corroborates the value of broad-band detection in FT-CARS flow cytometry because single-color or narrowband SRS measurements are inherently insensitive to spec-tral shape changes.
The capabilities of the FT-CARS flow cytometer can further be extended in multiple directions. First, the throughput of the FT-CARS flow cytometer can further be increased by improving the design of the microfluidic chip to avoid clogging at higher cell concentrations and by using a faster resonant scanner for a higher flow rate (ideally for a few spectral points per cell in flow). Second, the sensitivity and bandwidth of the FT-CARS flow cytometer can be enhanced by fur-ther compression of the pulse width of the laser. With ultrashort pulses generated from a seeded photonic crystal fiber with pulse compression or an ultrashort pulse laser, ultra-broadband (400 to 3600 cm−1) FT-CARS flow cytometry can be realized with higher sen-sitivity (22). Third, it can be extended to high-throughput Raman- activated cell sorting (RACS) (23) when combined with high-speed computation and cell sorting. Although RACS has been shown to be promising for noninvasive and label-free cell sorting, its low through-put (7) has limited its use to biological applications. High-throughput RACS is expected to open a window into regenerative medicine for quality control of human stem cells via Raman spectroscopic mon-itoring of their differentiation (24). Fourth, when combined with the FT-CARS flow cytometer, line illumination or 1D scanning of
the focal spot orthogonal to the flow direction can realize Raman spectroscopic imaging of flowing cells, i.e., Raman spectroscopic imaging flow cytometry. It is expected to provide further insight into intracellular localization of lipids, proteins, and nucleic acids, which are correlated with cellular state and physiological function (25, 26). Last, the FT-CARS flow cytometer can be integrated with other label-free nonlinear spectroscopic methods such as second- harmonic generation, third-harmonic generation, and transient ab-sorption. Since multimodal detection with these methods has been used for studying atherosclerotic lesions, cancer, and tissue engi-neering (27), the increased specificity is expected to lead to higher cell classification accuracy with additional phenotyping ability. With these improvements, our method holds promise for further extend-ing its capabilities and covering a wider range of cell types for di-verse applications.
MATERIALS AND METHODSFemtosecond pulse laserThe optical source is a Ti:Sapphire femtosecond mode-locked laser with a center wavelength of 780 nm and a pulse repletion rate of 80 MHz (Vitara-T-HP, Coherent). The full width at half maximum of the emission is 80 nm (1300 cm−1), which gives a 10-fs pulse width at the transform limit.
Fig. 4. High-throughput label-free single-cell analysis of the photosynthetic dynamics of H. lacustris. (A) Procedure of preparing H. lacustris cells with different degrees of isotope substitution of carbon dioxide. (B) Averaged Raman spectra of H. lacustris cells (n = 3000 for each condition) 0 to 10 days after the isotope substitution. (C) Scatterplot of H. lacustris cells (n = 2592) in Raman intensities of the two peaks, showing their 10-day evolution. (D) Scatterplot of H. lacustris cells (n = 2592) in Raman shifts (positions) of the two peaks, showing their 10-day evolution. on A
ugust 19, 2019http://advances.sciencem
ag.org/D
ownloaded from
Hiramatsu et al., Sci. Adv. 2019; 5 : eaau0241 16 January 2019
S C I E N C E A D V A N C E S | R E S E A R C H A R T I C L E
6 of 8
Pulse-pair generatorThe pulse-pair generator consists of a Michelson interferometer with a resonant scanner that produces a rapid scanning delay. A series of ultrashort pulses emitted from the laser is converted into a series of orthogonally polarized pulse pairs by the pulse-pair gen-erator. When a single pulse enters the interferometer, it is split into two pulses by a polarizing beamsplitter (PBS). The pulse (pump pulse) that travels along the arm without the scanner is reflected back by a fixed mirror. The pulse (probe pulse) in the other arm with the scanner is reflected back with a time delay controlled by the delay scanner and spatially recombined with the pump pulse at the PBS. A quarter waveplate inserted in each arm rotates the polar-ization of the reflected pulses by 90° so that both the recombined pulses exit at the output port of the interferometer with orthogonal polarizations. This configuration enables us to efficiently use all the pulses for the CARS generation and also avoid disrupting the mode-locking state of the laser often caused by back-reflected pulses into the laser cavity.
Rapid delay scannerThe rapid delay scanner consists of a set of optics, including a reso-nant scanner (CRS 12 kHz, Cambridge Technology), a concave mir-ror, and a flat mirror, placed in a 4f geometry with a focal length of 50 mm. A rapid optical-beam-angle modulation with the resonant scanner at a rate of 12 kHz was translated to a rapid optical-path- length modulation. The delay length was determined by the scan angle of the resonant scanner and the beam position on the scanning mirror. In our system, an optical scan angle of 10° with the resonant scanner and a beam position of 2.8 mm away from the pivot provided the time delay of 0 to 1.7 ps, which corresponded to an optical path length of 0 to 0.5 mm. The maximum optical-path-length difference between the two arms determined the spectral resolution of the FT-CARS spectrometer, which is 20 cm−1 in our system.
Pulse optimizerThe pulses that exit the interferometer were tailored to satisfy the optimum conditions to maximize the CARS signal intensity. To op-timize the temporal pulse condition, the pulses were prechirped with a pair of dispersion-compensation mirrors (DCMP175, Thorlabs) so that they were compressed down to near-transform–limited pulses at cells in the microfluidic channel. In our system, the pulses were compressed down to 18 fs at cells in the microfluidic channel by adding a negative second-order dispersion of 2450 fs2 to the pulses. To optimize the spectral pulse condition, the pulses were filtered by a long-pass optical filter with a cutoff wavelength of 750 nm (FELH0750, Thorlabs). Suppressing the high-frequency edge of the spectrum of the pump and probe pulses ensures noise reduction for the CARS signal detection.
Detector, digitizer, and computerThe tailored pulses were focused into cells in the microfluidic channel by an achromatic lens (AC050-008-B, Thorlabs). The input power was in the range of 100 to 300 mW, depending on the sample. The pump pulse excited the molecular vibrations via impulsive SRS while the probe pulse generated anti-Stokes scattering. The blue-shifted scattered photons were filtered with an optical short-pass filter with a cutoff wavelength of 750 nm (FESH0750, Thorlabs) and detected by an avalanche photodetector (APD120A, Thorlabs). To minimize the influence of the pump pulse on the FT-CARS signal and hence
to reduce the noise level, a polarizer was placed in parallel to the polarization of the probe pulse before the avalanche photode-tector. The intensity-modulated CARS signal generated by a se-ries of pulse pairs with the sequentially scanned time delay was digitized by a high-speed digitizer (ATS9440, AlazarTech) at a rate of 100 megasamples/s. The digitized temporal waveform is segmented into a series of single-scan interferograms and digitally Fourier transformed via fast Fourier transformation. Resultant data are sequential broadband CARS spectra.
Forward scatteringThe laser pulses used for the FT-CARS detection were also used for detection of forward scattering from cells. The light reflected by the 750-nm short-pass filter was focused onto an Si photodiode (PDA10A, Thorlabs). Unscattered light was removed by a spatial mask (R1DF500, Thorlabs) placed in front of the detector.
High-speed imagingBright-field images of flowing cells were acquired simultaneously with their FT-CARS spectra (Fig. 2, A and B). A white light-emitting diode (LED) with a light guide (OptoSigma, SLA100A, MSL-500 L) was used as a light source. Light from the LED was collinearly directed to the cells using a short-pass filter (FESH0650, Thorlabs) with the laser pulses. The transmitted light was reflected by the long-pass filter used for spectral shaping of the laser pulses and focused onto a high-speed camera (Phantom Miro Ex4, Vision research). Bright-field images of the flowing beads and cells were acquired at a frame rate of 10,000 frames/s.
Signal acquisitionThe FT-CARS spectral acquisition was synchronized with recording of the bright-field images with the high-speed camera. The acquisition was manually triggered on the control software of the high-speed camera, whose ready port was connected to the external trigger port of the dig-itizer. The duration of the signal acquisition was limited by the mem-ory size of the digitizer, which is 2 gigasamples with 14-bit resolution in our case. At our sampling rate (100 megasamples/s), 20-s acquisition is possible. Continuous limitless samplings can be performed by using a field-programmable gate array to perform real- time signal acquisi-tion and digital signal processing. Discrete spectral acquisition can also be conducted by using the forward-scattered light as a trigger.
Correction for distortion-free CARS spectraTo acquire distortion-free CARS spectra, a time-grid correction of the interferograms is required. Since our rapid delay scanner generates nonlinearly increasing time delays, the sampled interferograms were systematically distorted. To correct the distortion, we corrected the time grid by using the constant optical-path-length difference. To produce a calibration signal for the correction, we collinearly intro-duced a continuous-wave laser beam at a wavelength of 1064 nm (QLD1061, QD Laser) in the interferometer to generate calibration interferograms. The calibration interferograms were detected with a photodetector and sampled with the digitizer. The zero crossings of the AC component of the interferograms provide a grid on the constant optical-path-length difference, with which the time grid of the measured CARS interferograms was calibrated. Although the calibration was made by post–signal processing in our system, it can be done in real time by external clocking of the digitizer as de-scribed in (13).
on August 19, 2019
http://advances.sciencemag.org/
Dow
nloaded from
Hiramatsu et al., Sci. Adv. 2019; 5 : eaau0241 16 January 2019
S C I E N C E A D V A N C E S | R E S E A R C H A R T I C L E
7 of 8
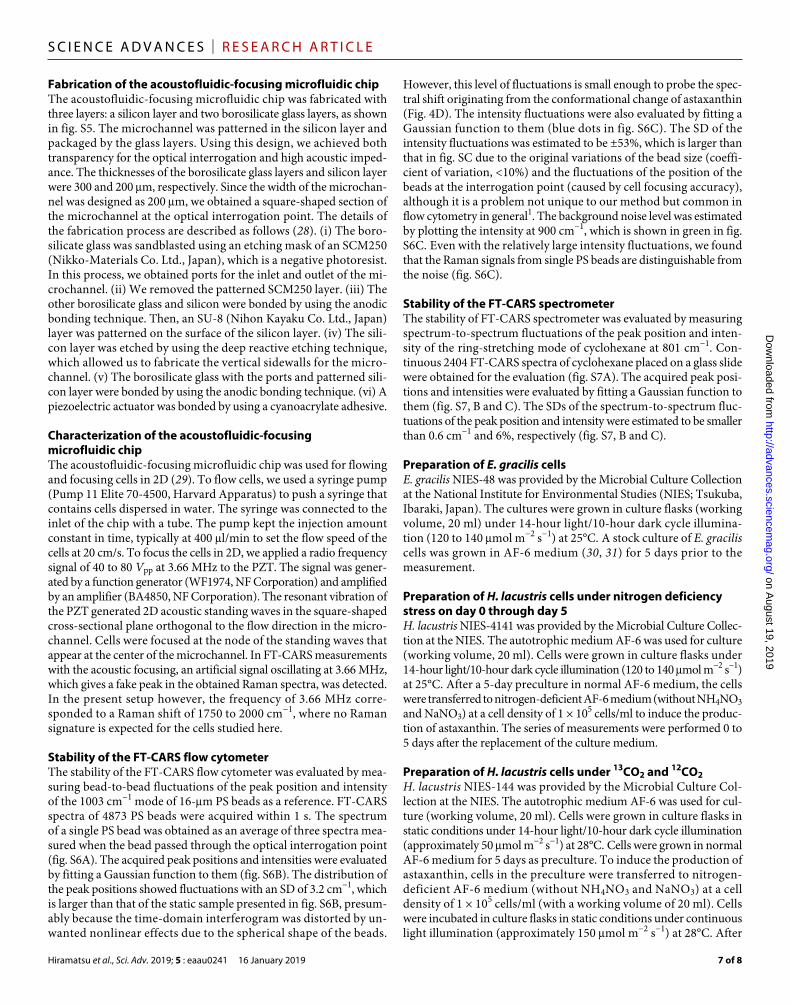
Fabrication of the acoustofluidic-focusing microfluidic chipThe acoustofluidic-focusing microfluidic chip was fabricated with three layers: a silicon layer and two borosilicate glass layers, as shown in fig. S5. The microchannel was patterned in the silicon layer and packaged by the glass layers. Using this design, we achieved both transparency for the optical interrogation and high acoustic imped-ance. The thicknesses of the borosilicate glass layers and silicon layer were 300 and 200 m, respectively. Since the width of the microchan-nel was designed as 200 m, we obtained a square-shaped section of the microchannel at the optical interrogation point. The details of the fabrication process are described as follows (28). (i) The boro-silicate glass was sandblasted using an etching mask of an SCM250 (Nikko-Materials Co. Ltd., Japan), which is a negative photoresist. In this process, we obtained ports for the inlet and outlet of the mi-crochannel. (ii) We removed the patterned SCM250 layer. (iii) The other borosilicate glass and silicon were bonded by using the anodic bonding technique. Then, an SU-8 (Nihon Kayaku Co. Ltd., Japan) layer was patterned on the surface of the silicon layer. (iv) The sili-con layer was etched by using the deep reactive etching technique, which allowed us to fabricate the vertical sidewalls for the micro-channel. (v) The borosilicate glass with the ports and patterned sili-con layer were bonded by using the anodic bonding technique. (vi) A piezoelectric actuator was bonded by using a cyanoacrylate adhesive.
Characterization of the acoustofluidic-focusing microfluidic chipThe acoustofluidic-focusing microfluidic chip was used for flowing and focusing cells in 2D (29). To flow cells, we used a syringe pump (Pump 11 Elite 70-4500, Harvard Apparatus) to push a syringe that contains cells dispersed in water. The syringe was connected to the inlet of the chip with a tube. The pump kept the injection amount constant in time, typically at 400 l/min to set the flow speed of the cells at 20 cm/s. To focus the cells in 2D, we applied a radio frequency signal of 40 to 80 Vpp at 3.66 MHz to the PZT. The signal was gener-ated by a function generator (WF1974, NF Corporation) and amplified by an amplifier (BA4850, NF Corporation). The resonant vibration of the PZT generated 2D acoustic standing waves in the square-shaped cross-sectional plane orthogonal to the flow direction in the micro-channel. Cells were focused at the node of the standing waves that appear at the center of the microchannel. In FT-CARS measurements with the acoustic focusing, an artificial signal oscillating at 3.66 MHz, which gives a fake peak in the obtained Raman spectra, was detected. In the present setup however, the frequency of 3.66 MHz corre-sponded to a Raman shift of 1750 to 2000 cm−1, where no Raman signature is expected for the cells studied here.
Stability of the FT-CARS flow cytometerThe stability of the FT-CARS flow cytometer was evaluated by mea-suring bead-to-bead fluctuations of the peak position and intensity of the 1003 cm−1 mode of 16-m PS beads as a reference. FT-CARS spectra of 4873 PS beads were acquired within 1 s. The spectrum of a single PS bead was obtained as an average of three spectra mea-sured when the bead passed through the optical interrogation point (fig. S6A). The acquired peak positions and intensities were evaluated by fitting a Gaussian function to them (fig. S6B). The distribution of the peak positions showed fluctuations with an SD of 3.2 cm−1, which is larger than that of the static sample presented in fig. S6B, presum-ably because the time-domain interferogram was distorted by un-wanted nonlinear effects due to the spherical shape of the beads.
However, this level of fluctuations is small enough to probe the spec-tral shift originating from the conformational change of astaxanthin (Fig. 4D). The intensity fluctuations were also evaluated by fitting a Gaussian function to them (blue dots in fig. S6C). The SD of the intensity fluctuations was estimated to be ±53%, which is larger than that in fig. SC due to the original variations of the bead size (coeffi-cient of variation, <10%) and the fluctuations of the position of the beads at the interrogation point (caused by cell focusing accuracy), although it is a problem not unique to our method but common in flow cytometry in general1. The background noise level was estimated by plotting the intensity at 900 cm−1, which is shown in green in fig. S6C. Even with the relatively large intensity fluctuations, we found that the Raman signals from single PS beads are distinguishable from the noise (fig. S6C).
Stability of the FT-CARS spectrometerThe stability of FT-CARS spectrometer was evaluated by measuring spectrum-to-spectrum fluctuations of the peak position and inten-sity of the ring-stretching mode of cyclohexane at 801 cm−1. Con-tinuous 2404 FT-CARS spectra of cyclohexane placed on a glass slide were obtained for the evaluation (fig. S7A). The acquired peak posi-tions and intensities were evaluated by fitting a Gaussian function to them (fig. S7, B and C). The SDs of the spectrum-to-spectrum fluc-tuations of the peak position and intensity were estimated to be smaller than 0.6 cm−1 and 6%, respectively (fig. S7, B and C).
Preparation of E. gracilis cellsE. gracilis NIES-48 was provided by the Microbial Culture Collection at the National Institute for Environmental Studies (NIES; Tsukuba, Ibaraki, Japan). The cultures were grown in culture flasks (working volume, 20 ml) under 14-hour light/10-hour dark cycle illumina-tion (120 to 140 mol m−2 s−1) at 25°C. A stock culture of E. gracilis cells was grown in AF-6 medium (30, 31) for 5 days prior to the measurement.
Preparation of H. lacustris cells under nitrogen deficiency stress on day 0 through day 5H. lacustris NIES-4141 was provided by the Microbial Culture Collec-tion at the NIES. The autotrophic medium AF-6 was used for culture (working volume, 20 ml). Cells were grown in culture flasks under 14-hour light/10-hour dark cycle illumination (120 to 140 mol m−2 s−1) at 25°C. After a 5-day preculture in normal AF-6 medium, the cells were transferred to nitrogen-deficient AF-6 medium (without NH4NO3 and NaNO3) at a cell density of 1 × 10⁵ cells/ml to induce the produc-tion of astaxanthin. The series of measurements were performed 0 to 5 days after the replacement of the culture medium.
Preparation of H. lacustris cells under 13CO2 and 12CO2H. lacustris NIES-144 was provided by the Microbial Culture Col-lection at the NIES. The autotrophic medium AF-6 was used for cul-ture (working volume, 20 ml). Cells were grown in culture flasks in static conditions under 14-hour light/10-hour dark cycle illumination (approximately 50 mol m−2 s−1) at 28°C. Cells were grown in normal AF-6 medium for 5 days as preculture. To induce the production of astaxanthin, cells in the preculture were transferred to nitrogen- deficient AF-6 medium (without NH4NO3 and NaNO3) at a cell density of 1 × 10⁵ cells/ml (with a working volume of 20 ml). Cells were incubated in culture flasks in static conditions under continuous light illumination (approximately 150 mol m−2 s−1) at 28°C. After
on August 19, 2019
http://advances.sciencemag.org/
Dow
nloaded from
Hiramatsu et al., Sci. Adv. 2019; 5 : eaau0241 16 January 2019
S C I E N C E A D V A N C E S | R E S E A R C H A R T I C L E
8 of 8
thorough purging with filtered nitrogen gas, 1 volume % 13CO2 fil-tered gas was passed through the culture medium (total, 500 ml) and enclosed in the culture flask. The 1 volume % 13CO2 gas was prepared by mixing 5 ml of 13CO2 (13C, 99%; chemical purity, >99.8%; Cambridge Isotope Laboratories Inc.) and 495 ml of air (atmospheric 12CO2 con-centration, approximately 0.04 volume %). After culturing the cells under 13CO2 for 2 days, the carbon source was switched from 13CO2 to 12CO2. The 1 volume % 12CO2 filtered gas was passed through the culture media (total, 500 ml) and enclosed in the culture flask after thorough purging of 13CO2 with filtered nitrogen gas. During the cell cultivation, the CO2 gas was supplied every 24 hours. The series of measurements were performed after 0, 2, 3, 4, 5, and 10 days after the switching of carbon dioxides from 13CO2 to 12CO2.
SUPPLEMENTARY MATERIALSSupplementary material for this article is available at http://advances.sciencemag.org/cgi/content/full/5/1/eaau0241/DC1Fig. S1. Figure of merit that compares our work and previous work by others.Fig. S2. Complete schematic of the FT-CARS flow cytometer.Fig. S3. Digital signal processing.Fig. S4. Structure of the acoustofluidic-focusing microfluidic chip.Fig. S5. Steps for fabricating the acoustofluidic-focusing microfluidic chip.Fig. S6. Stability of the FT-CARS flow cytometer.Fig. S7. Stability of the FT-CARS spectrometer.Fig. S8. Image of an E. gracilis cell under a conventional optical microscope.Fig. S9. Images of H. lacustris cells under the nitrogen deficiency stress obtained by a conventional optical microscope.Fig. S10. Raman spectra obtained by FT-CARS and conventional spontaneous Raman spectroscopy.Movie S1. High-speed imaging and FT-CARS flow cytometry of fast-flowing polymer beads of multiple species.Movie S2. High-speed imaging and FT-CARS flow cytometry of fast-flowing E. gracilis cells.
REFERENCES AND NOTES 1. H. M. Shapiro, Practical Flow Cytometry (John Wiley & Sons Inc., 2003). 2. A. Álvarez-Barrientos, J. Arroyo, R. Cantón, C. Nombela, M. Sánchez-Pérez, Applications of
flow cytometry to clinical microbiology. Clin. Microbiol. Rev. 13, 167–195 (2000). 3. Y. Saeys, S. V. Gassen, B. N. Lambrecht, Computational flow cytometry: Helping to make
sense of high-dimensional immunology data. Nat. Rev. Immunol. 16, 449–462 (2016). 4. P. S. Hoppe, D. L. Coutu, T. Schroeder, Single-cell technologies sharpen up mammalian
stem cell research. Nat. Cell Biol. 16, 919–927 (2014). 5. J. W. Lichtman, J.-A. Conchello, Fluorescence microscopy. Nat. Methods 2, 910–919
(2005). 6. A. D. Michelson, Flow cytometry: A clinical test of platelet function. Blood 87, 4925–4936
(1996). 7. Q. Zhang, P. Zhang, H. Gou, C. Mou, W. E. Huang, M. Yang, J. Xu, B. Ma, Towards
high-throughput microfluidic Raman-activated cell sorting. Analyst 140, 6163–6174 (2015).
8. M. Li, J. Xu, M. Romero-Gonzalez, S. A. Banwart, W. E. Huang, Single cell Raman spectroscopy for cell sorting and imaging. Curr. Opin. Biotechnol. 23, 56–63 (2012).
9. A. Y. Lau, L. P. Lee, J. W. Chan, An integrated optofluidic platform for Raman-activated cell sorting. Lab Chip 8, 1116–1120 (2008).
10. C. H. Camp Jr., S. Yegnanarayanan, A. A. Eftekhar, H. Sridhar, A. Adibi, Multiplex coherent anti-Stokes Raman scattering (MCARS) for chemically sensitive, label-free flow cytometry. Opt. Express 17, 22879–22889 (2009).
11. C. H. Camp Jr., S. Yegnanarayanan, A. A. Eftekhar, A. Adibi, Label-free flow cytometry using multiplex coherent anti-Stokes Raman scattering (MCARS) for the analysis of biological specimens. Opt. Lett. 36, 2309–2311 (2011).
12. C. Zhang, K.-C. Huang, B. Rajwa, J. Li, S. Yang, H. Lin, C.-S. Liao, G. Eakins, S. Kuang, V. Patsekin, J.-P. Robinson, J.-X. Cheng, Stimulated Raman scattering flow cytometry for label-free single-particle analysis. Optica 4, 103–109 (2017).
13. K. Hashimoto, M. Takahashi, T. Ideguchi, K. Goda, Broadband coherent Raman spectroscopy running at 24,000 spectra per second. Sci. Rep. 6, 21036 (2016).
14. M. Tamamitsu, Y. Sakaki, T. Nakamura, G. K. Podagatlapalli, T. Ideguchi, K. Goda, Ultrafast broadband Fourier-transform CARS spectroscopy at 50,000 spectra/s enabled by a scanning Fourier-domain delay line. Vib. Spectrosc. 91, 163–169 (2017).
15. K. Ekvall, P. van der Meulen, C. Dhollande, L.-E. Berg, S. Pommeret, R. Naskrecki, J.-C. Mialocq, Cross phase modulation artifact in liquid phase transient absorption spectroscopy. J. Appl. Phys. 87, 2340–2352 (2000).
16. M. Guerin, M. E. Huntley, M. Olaizola, Haematococcus astaxanthin: Applications for human health and nutrition. Trends Biotechnol. 21, 210–216 (2003).
17. A. J. Young, G. M. Lowe, Antioxidant and prooxidant properties of carotenoids. Arch. Biochem. Biophys. 385, 20–27 (2001).
18. J. Fábregas, A. Domínguez, D.-G. Álvarez, T. Lamela, A. Otero, Induction of astaxanthin accumulation by nitrogen and magnesium deficiencies in Haematococcus pluvialis. Biotechnol. Lett. 20, 623–626 (1998).
19. L. Wei, Y. Yu, Y. Shen, M. C. Wang, W. Min, Vibrational imaging of newly synthesized proteins in live cells by stimulated Raman scattering microscopy. Proc. Natl. Acad. Sci. U.S.A. 110, 11226–11231 (2013).
20. M. Li, P. C. Ashok, K. Dholakia, W. E. Huang, Raman-activated cell counting for profiling carbon dioxide fixing microorganisms. J. Phys. Chem. A 116, 6560–6563 (2012).
21. A. Kaczor, M. Baranska, Structural changes of carotenoid astaxanthin in a single algal cell monitored in situ by Raman spectroscopy. Anal. Chem. 83, 7763–7770 (2011).
22. K. Hashimoto, J. Omachi, T. Ideguchi, Ultra-broadband rapid-scan Fourier-transform CARS spectroscopy with sub-10-fs optical pulses. Opt. Express 26, 14307–14314 (2018).
23. D. McIlvenna, W. E. Huang, P. Davison, A. Glidle, J. Cooper, H. Yin, Continuous cell sorting in a flow based on single cell resonance Raman spectra. Lab Chip 16, 1420–1429 (2016).
24. J. W. Chan, D. K. Lieu, T. Huser, R. A. Li, Label-free separation of human embryonic stem cells and their cardiac derivatives using Raman spectroscopy. Anal. Chem. 81, 1324–1331 (2009).
25. M. Okada, N. I. Smith, A. F. Palonpon, H. Endo, S. Kawata, M. Sodeoka, K. Fujita, Label-free Raman observation of cytochrome c dynamics during apoptosis. Proc. Natl. Acad. Sci. U.S.A. 109, 28–32 (2012).
26. J. P. Pezacki, J. A. Blake, D. C. Danielson, D. C. Kennedy, R. K. Lyn, R. Singaravelu, Chemical contrast for imaging living systems: Molecular vibrations drive CARS microscopy. Nat. Chem. Biol. 7, 137–145 (2011).
27. S. Yue, M. N. Slipchenko, J.-X. Cheng, Multimodal nonlinear optical microscopy. Laser Photon. Rev. 5, 1–32 (2011).
28. S. Sakuma, Y. Kasai, T. Hayakawa, F. Arai, On-chip cell sorting by high-speed local-flow control using dual membrane pumps. Lab Chip 17, 2760–2767 (2017).
29. X. Xuan, J. Zhu, C. Church, Particle focusing in microfluidic devices. Microfluid. Nanofluid. 9, 1–16 (2010).
30. S. Kato, Laboratory culture and morphology of colacium vesiculosum euglenophyceae. Jpn. J. Phycol. 30, 63–67 (1982).
31. R. A. Andersen, Algal Culturing Techniques (Elsevier, 2005).
Acknowledgments Funding: This work was funded by the ImPACT Program of the CSTI (Cabinet Office, Government of Japan). Author contributions: K.G. conceived the idea of combining coherent Raman spectroscopy and flow cytometry. T. Ideguchi conceived the idea of using FT-CARS for Raman flow cytometry, while S.L. conceived the idea of using acoustofluidics for cell focusing. K.G., T. Ideguchi, and S.L. designed the FT-CARS flow cytometer. K. Hiramatsu, T. Ideguchi, Y.L., and K. Hashimoto developed the optical setup. K. Hiramatsu, T. Ideguchi, Y.Y., and Y.H. designed the experiments. K. Hiramatsu developed the acquisition software, performed the experiments, and analyzed the data. Y.Y., T. Ito, M.H., and Y.H. prepared the cell samples. S.L., J.-W.P., Y.K., T.H., S.S., and F.A. designed and fabricated the microfluidic chip. K. Hiramatsu, T. Ideguchi, and K.G. wrote the manuscript. K. Hiramatsu and T. Ideguchi led the construction of the FT-CARS flow cytometer. K.G. supervised the work. All authors discussed the results. Competing interests: T. Ideguchi, K. Hashimoto, and K.G. are inventors on a pending patent related to this work filed by the Japan Patent Office (nos. PCT/JP2016/089069 and WO2017119389A1, filed on 8 January 2016). K.G. is a shareholder of a cell analysis startup. The authors declare that they have no other competing interests. Data and materials availability: All data needed to evaluate the conclusions in the paper are present in the paper and/or the Supplementary Materials. Additional data related to this paper may be requested from the authors.
Submitted 29 April 2018Accepted 6 December 2018Published 16 January 201910.1126/sciadv.aau0241
Citation: K. Hiramatsu, T. Ideguchi, Y. Yonamine, S. Lee, Y. Luo, K. Hashimoto, T. Ito, M. Hase, J.-W. Park, Y. Kasai, S. Sakuma, T. Hayakawa, F. Arai, Y. Hoshino, K. Goda, High-throughput label-free molecular fingerprinting flow cytometry. Sci. Adv. 5, eaau0241 (2019).
on August 19, 2019
http://advances.sciencemag.org/
Dow
nloaded from
High-throughput label-free molecular fingerprinting flow cytometry
Jee-Woong Park, Yusuke Kasai, Shinya Sakuma, Takeshi Hayakawa, Fumihito Arai, Yu Hoshino and Keisuke GodaKotaro Hiramatsu, Takuro Ideguchi, Yusuke Yonamine, SangWook Lee, Yizhi Luo, Kazuki Hashimoto, Takuro Ito, Misa Hase,
DOI: 10.1126/sciadv.aau0241 (1), eaau0241.5Sci Adv
ARTICLE TOOLS http://advances.sciencemag.org/content/5/1/eaau0241
MATERIALSSUPPLEMENTARY http://advances.sciencemag.org/content/suppl/2019/01/14/5.1.eaau0241.DC1
REFERENCES
http://advances.sciencemag.org/content/5/1/eaau0241#BIBLThis article cites 29 articles, 4 of which you can access for free
PERMISSIONS http://www.sciencemag.org/help/reprints-and-permissions
Terms of ServiceUse of this article is subject to the
registered trademark of AAAS.is aScience Advances Association for the Advancement of Science. No claim to original U.S. Government Works. The title
York Avenue NW, Washington, DC 20005. 2017 © The Authors, some rights reserved; exclusive licensee American (ISSN 2375-2548) is published by the American Association for the Advancement of Science, 1200 NewScience Advances
on August 19, 2019
http://advances.sciencemag.org/
Dow
nloaded from