Embed Size (px)
DESCRIPTION
cell kalman
Citation preview

Journal of Microscopy, Vol. 241, Pt 3 2011, pp. 303–314 doi: 10.1111/j.1365-2818.2010.03441.x
Received 14 August 2009; accepted 7 July 2010
Cell counting tool parameters optimization approach forelectroporation efficiency determination of attached cells in phasecontrast images
M . U S A J ∗, D . T O R K A R†, M . K A N D U S E R ∗ & D . M I K L A V C I C ∗∗Faculty of Electrical Engineering, University of Ljubljana, Ljubljana, Slovenia
†Jozef Stefan Institute, Ljubljana, Slovenia
Key words. Artificial neural networks, backpropagation, biomedical imageprocessing, electroporation, microscopy, object detection, optimization, V79cell line.
Summary
In this paper a novel parameter optimization approach for celldetection tool and counting cells procedure in phase contrastimages are presented. Manual counting of the attached cellsin phase contrast images is time-consuming and subjective.For evaluation of electroporation efficiency of attached cells,we often perform manual counting of the cells which isneeded to determine the percentage of electroporated cellsunder different experimental conditions. Here we present anautomated cell counting procedure based on novel artificialneural network optimization of Image-based Tool for CountingNuclei algorithm parameters to fit the training image set basedon counts from an expert. Comparing the results of automatedcell counting to user manual counting a 90,31% averageagreement was achieved which is reasonably good especiallytaking into account inter-person error which can be up to 10%.Even more, our procedure can also be used for fluorescent cellimages with similar counting accuracy (>90%) enabling us todetermine electroporation efficiency. In our experiments, theelectroporation efficiency determined by manual cell countingwas virtually the same as the one obtained by the automatedprocedure.
Introduction
Electroporation (Weaver & Chizmadzhev, 1996), also termedelectropermeabilization (Rols & Teissie, 1992), is an efficientmethod for transient increase of cell membrane permeability,which is widely used for drug and gene delivery into the livingcells. The method is highly efficient and does not include theexposure of cells to chemical, viral or any kind of toxic additives
Correspondence to: D. Miklavcic, Faculty of Electrical Engineering, University
of Ljubljana, Trzaska 25, SI-1000, Ljubljana, Slovenia. Tel: +386-1-4768-456;
fax: +386-1-4264-658; e-mail: [email protected]
(Rols, 2006). Membrane permeabilization is obtained byapplication of strong external electric field to cells or tissues(Tsong, 1991; Teissie & Rols, 1993). With careful selection ofelectric pulse parameters such as pulse amplitude, durationand number, we can obtain transient permeabilization,which does not affect cells viability (Neumann et al., 1989;Canatella et al., 2001). Electroporation is used in manybiomedical applications; the most interesting at present areelectrochemotherapy of tumours (Gehl & Geertsen, 2006;Marty et al., 2006; Mir et al., 2006; Sersa et al., 2008), geneelectrotransfer (Neumann et al., 1999; Andre & Mir, 2004;Golzio et al., 2004; Pavselj & Preat, 2005), cell fusion (Hayashiet al., 2002; Trontelj et al., 2008; Yu et al., 2008; Gabrijel et al.,2009) and nonthermal irreversible electroporation (Rubinskyet al., 2007; Zupanic & Miklavcic, 2010).
For the study of basic mechanisms of electroporationand its biomedical applications, researchers often performexperiments on cell cultures in vitro. Even though cellmembrane permeabilization can be determined by differentalready established methods such as flow cytometry orspectrofluorimetry, those methods are only applicable whencells in suspension are used. In such experiments, all cells inthe population have roughly the same shape and are thereforeaffected in the same manner by the electric field. Nevertheless,in many cases experiments performed on adherent cellsare needed. Adherent cells maintain their shape and intactinternal structure (cytoskeleton) and the results obtained inthose cells are comparable better to real in vivo situation (atleast for a simple homogeneous tissue) than results fromcell suspensions (Kanduser & Miklavcic, 2009). Anotheradvantage of the experiments performed on attached cells isthe fact that they can be observed under inverted microscopefor longer time and cell responses to electric pulses can bedetected in situ. For any further studies of electroporation-based treatments, the first condition is determination of the
C© 2010 The AuthorsJournal of Microscopy C© 2010 The Royal Microscopical Society
3 0 4 M . U S A J E T A L .
percentage of permeabilized cells with different fluorescentdyes such as propidium iodide or lucifer yellow (Macek-Lebar &Miklavcic, 2001; Pucihar et al., 2002). This percentage is oftendetermined by manual counting of cells on phase contrastimages and corresponding number of permeabilized cells isdetected by fluorescence microscopy. Thus, both images,phase contrast and fluorescence ones, have to be countedseparately, which means that we cannot used establishedfluorescent immunehistochemical staining methods (Chenet al., 2006; Steenstrup et al., 2000;). Manual counting ofcells is time-consuming and subjective. Namely, intra-personvariation and inter-person variation of counted number ofobjects in such images are not negligible (Jacobs et al., 2001;Embleton et al., 2003).
Cell detection in phase contrast images for experimentalresults evaluation is a key problem. A typical phase contrastimages of adherent cells have the following characteristics:(1) noise and artefacts, (2) various cell shapes and cellintensity overlapping due to complexity of cellular topologies,(3) internal cell structures with a lower intensity, (4) cellsin close contacts, therefore cell boundaries are not seenclearly and (5) varying density of cell culture resulting fromnonuniform distribution of cells in the culture (Yongminget al., 1999; Li et al., 2006). All these characteristics lead to adecreased contrast between cells and background. In addition,equipment-related factors, which contribute to the qualityof the image, such as uneven illumination and electronicor optical noise, also play an important role in the effectivesegmentation of a digital image (Haralick & Shapiro, 1985). Allproblems mentioned earlier are also found in live cell imagingand can contribute to poor image quality for automatedimage processing, leading to image analysis problems thatremain inadequately solved. The segmentation approachadopted must be robust against possible problems relatedto phase contrast image to ensure that reliable informationabout cell number is obtained (Haralick & Shapiro,1985).
Several digital image segmentation techniques wereinvestigated for cell detection in phase contrast images,such as contour-based, region-based and mixed contour-based methods, histogram-based with minimum-error-threshold and watershed algorithm. For phase contrastimages, however, none of the above-mentioned methodscan be used directly. Effective detection by means ofdigital image segmentation techniques requires certain objectcharacteristics such as clear object borders, distinguishedtextures, colours or topologies that have to be present inall images used for automated cell counting (Haralick &Shapiro, 1985; Wu et al., 1995; Yongming et al., 1999; Debeiret al., 2005; Ambriz-Colin et al., 2006; Yang et al., 2006).Sometimes specific algorithms or method modifications areneeded for counting a particular cell lines, for example whiteblood cells (Theera-Umpon & Gader, 2002; Wang & Min,2006).
There are some commercial software products availableand they provide object-counting and feature detection[MetaMorph (Molecular Devices, Downingtown, PA, U.S.A.),Bioquant (Image Analysis Corporation, Nashville, TN, U.S.A.),Image-Pro (Media Cybernetics, Bethesda, MD, U.S.A.) andalso freeware ImageJ (U.S. National Institutes of Health,Bethesda, MD, U.S.A.), UTHSCSA ImageTool (University ofTexas Health Science Center, San Antorio, TX, U.S.A.)]. Allthese tools, however, often fail to provide reliable resultsin term of accurate cell detection and/or require intensiveuser interaction to obtain initialization or parameter settingsfor accurate results (Byun et al., 2006). Usual approachwithin these programs is to apply several global image-processing techniques (various image filtering and edgedetection algorithms) to create binary images where objectcounting is finally performed. For phase contrast imagewith very dissimilar objects (e.g. attached cells) global imageprocessing techniques are not sufficient. In our opinion, localimage-processing methods (e.g. template matching) could bemore suitable in such cases.
Image-processing techniques usually have a large amountof parameters, which have to be precisely tuned to get reliableresults. In phase contrast images, characteristic of individualadherent cells differ significantly one from another. Therefore,results can be heavily skewed by software tuning. Cells onphase contrast images due to all mentioned issues earlierusually do not have any characteristic dominating adherentshape and other optical properties, thus it is difficult to obtaingood parameter set.
However, some optimization strategies exist, which can beused to search for optimal parameters of given algorithm.The artificial neural network (ANN) represents a generalcomputing mechanism able to perform different tasks suchas classification, function approximation, prediction andoptimization. A widely used topology (ANN structure) indifferent domains is a multilayer perceptron. It consists ofneurons organized in layers. The inputs are grouped in aninput layer, outputs in an output layer and all the other unitsin so called hidden layers that ‘cannot be seen’ neither from theinput nor from the output of the network. All links are madeamong units in different layers from the input side towards theoutput side of the network. Connections within the same layeror backward connection from a layer closer to output to layersfurther from the output are forbidden. All links within thenetwork are weighted with weights usually residing between0 and 1.
ANN can be trained using the backpropagation trainingmethod that uses backpropagation of a network error tocompute the gradient of an error function with respect tothe network weights. The algorithm repeatedly adjusts theweights to minimize the mean square error between the actualoutput vector and the desired network output vector. Whenthe desired output vector is known, this method belongsto a family of supervised learning rules (with a ‘teacher’).
C© 2010 The AuthorsJournal of Microscopy C© 2010 The Royal Microscopical Society, 241, 303–314
C E L L C O U N T I N G T O O L P A R A M E T E R S O P T I M I Z A T I O N A P P R O A C H 3 0 5
The traditional backpropagation implies a deterministicoptimization algorithm called direct gradient descent, but canbe replaced with other, more advanced methods (Masters,1995). The weights are changed by an amount proportional toerror gradient. The proportional factor is denoted as a learningrate and the weight changes are corrected by a momentum(decay) factor to control the velocity of the point in the weightspace. Using this, the local minima in the error minimizationprocedure are more successfully avoided (Rumelhart et al.,1986). Although there exists a relationship between the gainof the activation function, learning rate and initial weights(Thimm et al., 1996), these factors and the net topology areusually chosen either experimentally or using some existingthumb rules. Recently, the genetic algorithm received muchattention in determination of the optimal network parameters.
The aim of this study was to develop technique for effectiveautomated counting of attached cells in phase contrast imagesthat could be used later on for live cell imaging. In suchcases, the analysis of large number of images obtainedby automatic image acquisition which are not all of thesame quality is required. We first identified the algorithm inITCN (Image-based Tool for Counting Nuclei, Centre for Bio-Image Informatics, University of California) for appropriatecells detection tool in phase contrast images (Usaj et al.,2007). The ITCN algorithm requires set up of three (optimal)parameters to effectively perform cell counting. Optimalalgorithm’s parameters are set up with minor initial expertinput followed by the optimization approach, which includesANN. We introduced a novel solution, where network inputis fed by normalized procedure error and network outputsare algorithm (ITCN) parameters. With this approach weshortened counting time (from 8 to 9 h to 18 min) and obtained90.31% accuracy from our phase contrast image database.Finally, we tested this procedure on real electroporationexperimental data and obtained good results.
Material and methods
Electroporation experiments
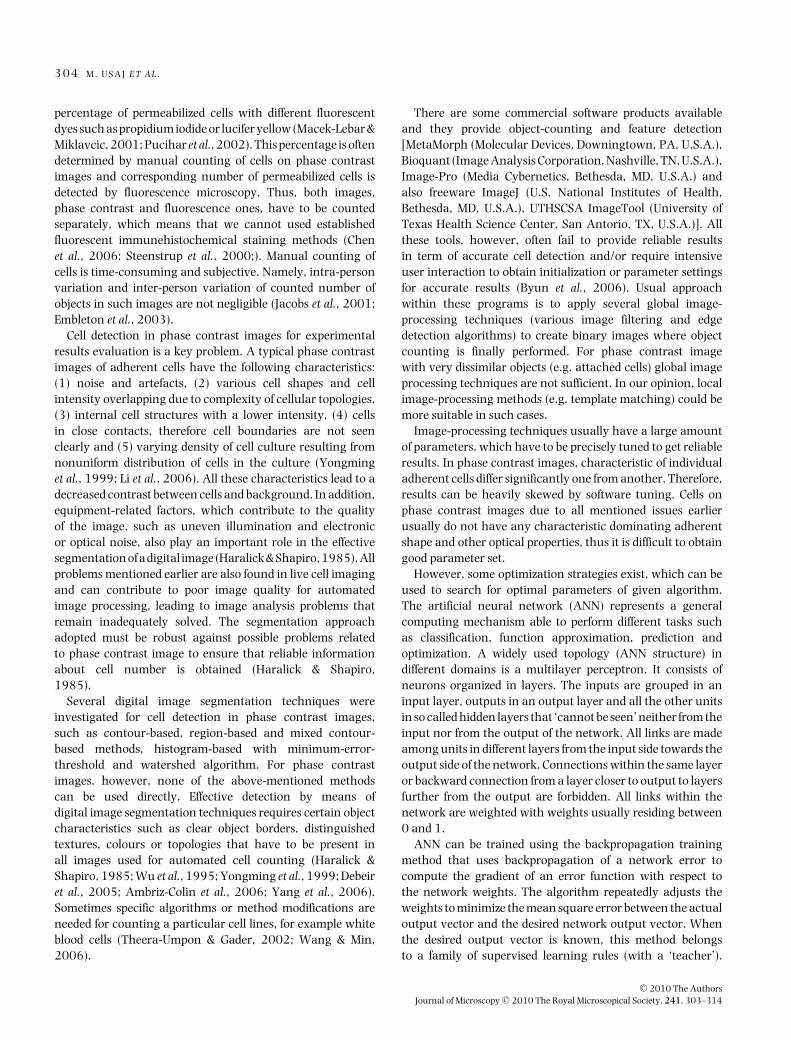
A cell line V-79 Chinese hamster lung fibroblasts (ECACC,Salisbury, U.K., EU) was used in experiments. Cells weregrown in an Eagle’s minimum essential medium supplementedwith 10% foetal bovine serum (Sigma, St. Louis, MO,U.S.A.) at 37◦C in a humidified 5% CO2 atmosphere in anincubator (Kambic, Semic, Slovenia) For experiments cellswere plated previous day in 24 multiwell microplate (TPP,Trasadingen, Switzerland) in concentration 4 × 10⁴ cells perwell. Immediately before electric pulse application, the growthmedium was replaced with phosphate buffer containing 0.15mM propidium iodide. Electric pulses were applied with electricpulse generator Cliniporator (Igea, Carpi, Italy) using wireelectrodes 5 mm apart (Fig. 1).
Electric pulse parameters were: 8 pulses, duration 100 µsand repetition frequency 1 Hz. The pulse amplitude was
Fig. 1. Experimental set up of platinum electrodes in 24-well microplatefor electroporation of attached cells. The distance between platinum (Pt/Ir= 90/10) wire electrodes is 5 mm.
increased from 0 V cm−1 for control treatment, and from200 to 800 V cm−1 in 100 V cm−1 steps. The phasecontrast and fluorescent images of the treated cells werecaptured using cooled CCD camera (Visicam 1280, Visitron,Puchheim, Germany) mounted on a fluorescence microscope(Zeiss AxioVert 200, objective 20×, Zeiss, Oberkochen,Germany) using MetaMorph 5.0 software (Molecular DevicesCorporation, PA, U.S.A.), exposure time 100 ms. For eachparameter, five phase contrast and corresponding fluorescentimages were acquired from three independent experimentsgiving final number of 120 phase contrast images. Forour procedure evaluation, we use additional phase contrastimages acquired from other four similar experiments at thesame conditions from which we formed original database of304 images. Then we discarded those with poor focus (96).We can avoid poor focus with proper microscopy set up andfor that reason we excluded those images from automatedcounting procedure. We performed this task manually becauseautomated exclusion of images with poor focus is not the aimof our paper. From all remaining phase contrast images (208),we created test image database as described in the next section.Evaluated algorithm was then applied to our electroporationexperiments on attached V-79 cells. The acquired images hadthe resolution of 640×512 pixels and 256 greyscale (8-BPP).
Creating phase contrast image database
From our initial database (208 images from seven independentexperiments), we discarded those with huge artefacts suchas rubbish or dirties (3), those with giant and/or fusedcells (35) and those with clustered remainders of cells (12).The remaining 158 (76%) phase contrast images – our testdata (examples of those images we can see in Fig. 2) –included images with similar cell area, but still with verydifferent cell shapes and density. Image files were then named
C© 2010 The AuthorsJournal of Microscopy C© 2010 The Royal Microscopical Society, 241, 303–314

3 0 6 M . U S A J E T A L .
Fig. 2. Examples of phase contrast images of attached cells with different cell density (126 cells/image – top right to 329 cells/image – bottom left) fromour image database. Images were captured under 20× objective magnification. Scale bar corresponds to 40 µm.
and preprocessed. Automatically counted cell numbers werecompared to manual counting obtained by average resultsof three experts – our ground truth. We have determinedinter-person error as average of relative standard deviations.Second inter-person error is determined also as average ofrelative standard deviation on ten manually counted imagesby eight people from our laboratory who work regularly withcells as researchers and are therefore used to count cells underphase contrast microscopy (in range: Ph.D. students, post docs,teaching assistants).
Image preprocessing
In our counting procedure, we integrated two preprocessingsteps: shading correction (to improve image quality) andhistogram equalization (to enhance contrast between cells andbackground).
Shading correction. Microscopic images exhibit significantintensity nonuniformity, often referred to as shading orintensity inhomogeneity (Russ, 1995; Tomazevic et al., 2002;Vovk et al., 2007). Among many shading correction methods,we have chosen retrospective shading correction based onentropy minimization to improve image quality (Likar et al.,2000). By contrast to other retrospective methods, theselected method deals successfully with both multiplicativeand additive shading components and in a great variety ofdifferently structured images. Briefly, linear image formation
model was created, which consists of an additive andmultiplicative parametric component. Shading correction wasthen performed by the inverse of the image formation model,which shading components were estimated retrospectively byminimizing the entropy of the acquired images.
Histogram equalization. On images with corrected intensityinhomogeneity histogram equalization was applied toenhance contrast between cells and background. Thispreprocessing step was integrated in our counting procedureas a consequence of thorough comparison of counting resultsusing histogram equalization to the ones not using it. Forcontrast enhancement we use MATLAB (MathWorks, Natick,MA, U.S.A.) function for contrast-limited adaptive histogramequalization (CLAHE), which enhances the contrast of thegreyscale image. CLAHE operates on small regions in theimage, called tiles, rather than the entire image. We specified15 tiles per each row and each column. Total number of tileswas thus 225. Each tile’s contrast was enhanced, so that thehistogram of the output region approximately matches thehistogram specified by the ‘Distribution’ parameter, in ourcase Bell-shaped histogram.
Automated cell detection
For automated cell detection, we used algorithm implementedwithin the ITCN tool. The algorithm is described in detailselsewhere (Byun et al., 2006). Briefly, the algorithm requires
C© 2010 The AuthorsJournal of Microscopy C© 2010 The Royal Microscopical Society, 241, 303–314
C E L L C O U N T I N G T O O L P A R A M E T E R S O P T I M I Z A T I O N A P P R O A C H 3 0 7
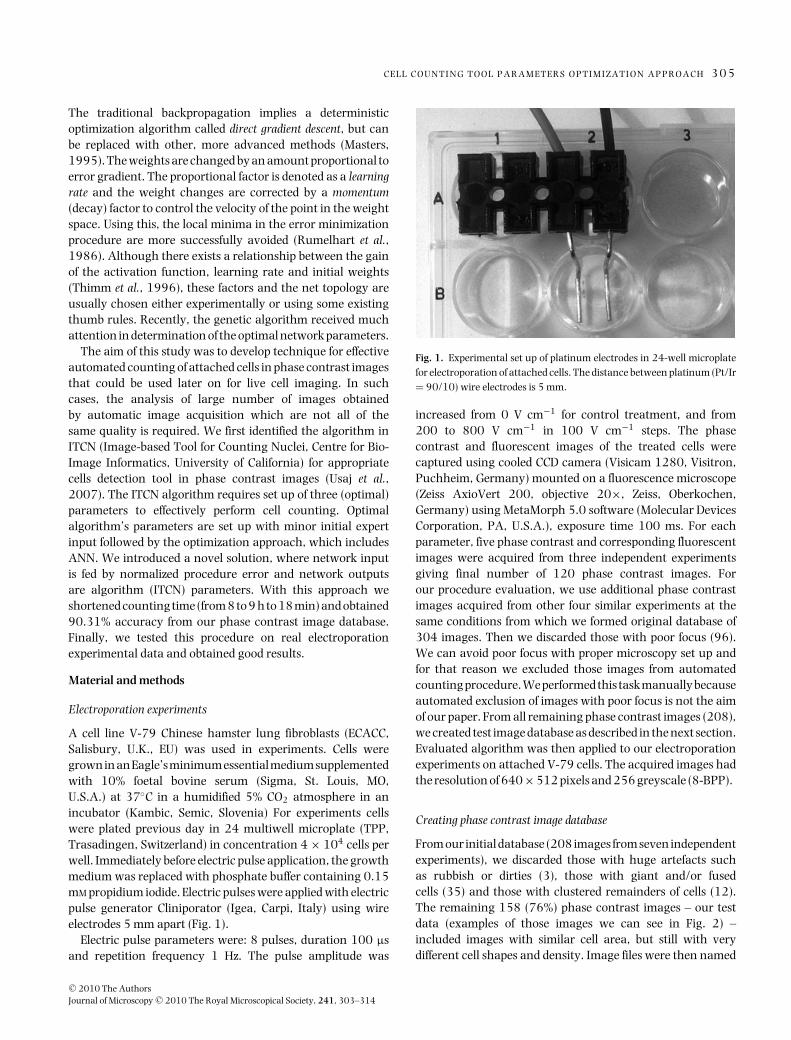
Fig. 3. Cells detection procedure realized in Image-based tool for counting nuclei (ITCN) algorithm: an input image is convoluted with Laplacian ofGaussian (LoG) then the convoluted image is thresholded, and finally a detection of local extremes is performed.
three parameters: (1) cell diameter, (2) minimal cell distanceand (3) filter threshold. Objects (cell nuclei originally, cellsin our study) in the image are detected using a templatematching approach where the object model is convolutedwith an image and in each position the correlation factor iscalculated. Within ITCN Laplacian of Gaussian (LoG) is usedas cell detector with the diameter proportional to mean cellsize. The result of the convolution is a smooth continuousimage where object centres are represented by local extremes.Afterwards, a threshold is applied to image to remove false localextremes occurring, for example from empty space surroundedby cells. Remaining extremes are detected using minimal cell-to-cell distance. The procedure is depicted in Fig. 3.
The ANN initialization
Among various ANN structures, we selected a multilayerperceptron. The topology of the created ANN consists of oneprocessing unit (neuron) in the input layer and is fed by thenormalized relative automated counting error. The outputlayer contains three neurons, one for each ITCN parameter.The number of neurons in the hidden layer was definedexperimentally and set to 10. ANN was trained using thebackpropagation training method. A ‘quickprop’ gradientsearch algorithm for ANN training was used mainly due to itsadvantages in speed. The proportional factor (learning rate)was set to 0.1 and the momentum (decay) was set to 0.5.
Smart parameter optimization procedure
We tested several optimization approaches to obtain optimalparameter. The parameters search space was reasonably
Table 1. Parameter search space boundaries.
Cell diameter (pixels) [25–35]; step 1Minimal distance (pixels) [15–25]; step 1Threshold [0.05–0.25]; step 0.01
constrained with respect to cells/images characteristic (celldiameter and minimal distance/threshold). The search spacewas equally discretized (Table 1), which gave a total of 2541sets of parameters. We tested different sampling procedures;in the first step we took every value of parameters. In the nextstep, we took only every second (third, fourth, fifth) value ofparameters (each time the border parameters values howeverwere included), which gave reduced sets of parameters’ values.Finally, we took only border values of parameter and themiddle one (three values of each parameter) which gave 27combinations (sets) of parameters’ values.
The whole optimization procedure consisted of the followingsteps. At the beginning, the training set was generatedusing only three images with known cell numbers randomlyselected out of 158 images (less than 2% of all images). Thethree parameters, required by ITCN algorithm, were variedwithin preselected boundaries and inner points determinedby sampling procedure. For each instance, the imageprocessing of the selected (training) images were performedand the number of cells determined. All combinations ofsets of parameters and numbers of counted cells (true andautomated) were randomized and then used to compose adifferent data for ANN training and validation. A trainingdata consisted of 60% of samples, a cross validation data of15% and a test data of 25%.
C© 2010 The AuthorsJournal of Microscopy C© 2010 The Royal Microscopical Society, 241, 303–314

3 0 8 M . U S A J E T A L .
Our novel idea was to train the network with the trainingdata values and then set the input (normalized relativeautomated counting error) to zero and the outputs shouldgive optimal values of the three ITCN algorithm’s parameters.If the ANN was chosen well (having good generalizationability) these values should be optimal for the whole testimages.
The procedure was tested on 10 different training sets ofimages (on PC Pentium(R) D CPU 3 GHz, 1 GB of RAM,Windows XP) and mean relative error as well as meanstandard deviation were determined. For each set, the ANNwas trained for 10 000 cycles (epochs) where in each epoch allthe samples from the training set was exposed to the networkinputs.
Procedure’s performance and accuracy
Exhaustive global optimization. To evaluate our optimizationapproach described in previous subsection, we performed aglobal parameters optimization that yielded global optimalparameter set (in our defined parameter space). In this case,training set was equal to data set that means all 158 imageswere included in optimization. The three parameters requiredby ITCN algorithm were varied within preselected boundarieswith all samples included. For each instance, the imageprocessing of all images was performed and the number of cellsdetermined. The parameter set, which minimized absoluterelative error, was chosen as global optimal parameter setand its error as global minimal error. The same computer asin previous section was used. The time needed for completingglobal optimization was 3 weeks.
Absolute relative error. The results of counting cell procedurewere presented by the error computed according to the Eq. (1)
E = 1N
∑
N
|ND − GT|GT
, (1)
where E is an average absolute relative number-of-cells error,N is the number of images in the set, ND and GT is the numberof cells detected by our automated procedure and by manualcounting, respectively.
Evaluation of procedure on our data obtained from electroporationexperiments
We finally applied our counting procedure to threeelectroporation experiments. From each experiment we got 40phase contrast and same number of corresponding fluorescentimages. The training sets consisting of three phase contrast orfluorescence images (7.5% of all images) per each individualexperiment. For automated cell counting procedure, weempirically set parameter borders as shown in Table 2. Withoptimal parameters obtained by our optimization approach,we performed cell counting on phase contrast and fluorescentimages. Automated counting of fluorescent cells was not the
Table 2. Parameter search space boundaries for electroporationexperiments.
Phase contrast images Fluorescent images
Cell diameter (pixels) [25–35]; step 5 [10–30]; step 5Minimal distance (pixels) [15–25]; step 5 [10–20]; step 5Threshold [0.1–0.2]; step 0.05 [0.1–0.2]; step 0.05
aim of this paper and we agree that other solutions exist forthis purpose. However, we perform automated counting offluorescent cells with our procedure just to show its flexibilityand robustness to different image types. For counting cells onfluorescence images, we have to assure that ITCN is properlyconfigured which means that we have to use inverted LoG (notoriginal as in case of phase contrast images). Preprocessingsteps for fluorescence images were similar as for phase contrastwith additional background subtraction. Fluorescent imageswere manually counted only by one expert.
Results
Smart parameter optimization
Our procedure for automated cell counting was testedon 10 different training sets, with different number ofparameter sets. As presented in Table 3, the average errorand average standard deviation did not significantly differbetween numbers of parameter set used for ANN optimization.Because of that, the option with only 27 parameter setswas finally selected as sampling procedure for the proposedoptimization approach. This procedure has demonstratedthe best performance which includes counting accuracy of90.31% and low computing time which was less than 18 min;6 min for parameter optimization (average 5.98 min ± 0.95min) and 4.3 s (±0.4 s) for processing each image.
Good ANN response is also shown in Fig. 4, where values ofthree parameters for each training set and different samplingprocedure as well as values of global optimal parametersare presented. It can be seen that parameter’s values areindependent of sampling procedure and they are close to globaloptimum.
Table 3. Mean error and standard deviation for different number ofparameter sets.
Number of Average Average standard Computingparameter sets error (%) deviation (%) time
2541 9.17 7.18 8 h 42 min396 9.17 7.18 1 h 42 min200 8.97 7.30 47 min96 8.97 7.18 30 min45 9.93 7.44 22 min27 9.69 7.34 <18 min
C© 2010 The AuthorsJournal of Microscopy C© 2010 The Royal Microscopical Society, 241, 303–314

C E L L C O U N T I N G T O O L P A R A M E T E R S O P T I M I Z A T I O N A P P R O A C H 3 0 9
29
29,5
30
30,5
31
1 2 3 4 5 6 7 8 9 10
29
29,5
30
30,5
31
1 2 3 4 5 7 8 9 10
cell
dia
met
er
[pix
els]
global optimum
all samples
every 2nd sample
every 3rd sample
every 4th sample
every 5thh sample
only border values
Cell size
trainig image set
6
17
18
19
20
21
22
1 2 3 4 5 6 7 8 9 10
training image set
minimal cell distance
global optimum
all samples
every 2nd sample
every 3rd sample
every 4th sample
every 5th sample
only border values
0,1
0,12
0,14
0,16
1 2 3 4 5 6 7 8 9 10
thre
sho
ld
Threshold
global optimum
all samples
every 2nd sample
every 3rd sample
every 4th sample
every 5th sample
only border values
min
ima
l ce
ll d
ista
nce
training image set
Fig. 4. The artificial neural network (ANN) optimized values for all three parameters of Image-based Tool for Counting Nuclei (ITCN) algorithm for 10image training set and sampling procedure: cell size, minimal cell distance and algorithm’s threshold.
Results of automated counting procedure for 10 differenttraining image set show reasonably good correlation withmanual counting as we see in Table 4 where absolute relativeerrors with SD for all 10 training image sets are presented(number of parameter sets are 27). If we performed automated
counting on images without contrast enhancement using thesame 10 training image set the average absolute relative error(13.02%) and SD (9.68%) are considerably higher than in thecase where contrast enhancement was used (average absoluterelative error 9.69% and SD 7.34%).
C© 2010 The AuthorsJournal of Microscopy C© 2010 The Royal Microscopical Society, 241, 303–314

3 1 0 M . U S A J E T A L .
Table 4. Trend equitation, correlation coefficient and error betweenmanual counting and automated counting (number of parameter setsare 27) for 10 training image sets.
Correlation Absolute relativeTraining set Trend equation coefficient R2 error (%)
1 y = 0,9017x 0.8687 10.72 ± 9.032 y = 0,9017x 0.8687 10.72 ± 9.033 y = 1,0262x 0.9117 10.15 ± 7.184 y = 0,9842x 0.8983 9.22 ± 6.705 y = 0,9694x 0.8974 8.82 ± 6.596 y = 0,9842x 0.8983 9.22 ± 6.707 y = 0,9546x 0.8999 8.63 ± 6.758 y = 0,9842x 0.8983 9.22 ± 6.709 y = 1,0345x 0.8957 10.95 ± 8.0110 y = 0,9842x 0.8983 9.22 ± 6.70Average y = 0,9736x 0.8935 9.69 ± 7.34
For illustration, the results of automated procedure runningwith optimal parameter’s set obtained from one imagetraining set (number four) are presented in Fig. 5. We canobserve that there is somewhat better performance in imageswith fewer cells, while with increasing cells number theerror becomes higher. Overall, trend equitation coefficient(0.9892) and correlation coefficient (0.8983) as well as error(9.22 ± 6.70%) still demonstrate good correlation withmanual counting.
Exhaustive global optimization
We searched for global optimum parameter set to obtain globalminimum error of the ITCN algorithm. Global minimum erroris 7.99 ± 6.37% what is acceptable and is within the rangeof inter-person error. The reason for this still rather high error
y = 0,98 x
0
50
100
150
200
250
300
350
0 50 100 150 200 250 300 350
auto
mat
ic c
ell
coun
ting
manual cell counting
Fig. 5. Evaluation of the algorithm in all 158 images of our database.Correlation between manual and automated cell counting. Automatedcell counting was performed using optimized parameters obtained fromartificial neural network (ANN) optimization using data of the imagetraining set four.
lies probably in large cell shape variations throughout thewhole data set processed using the same parameters set ofITCN algorithm. We can also see that our procedure’s averageerror 9.69 ± 7.34% is in the same order as global minimumerror. Furthermore, it has been achieved within much shortercomputer time (less than 18 min) compared to global optimumresult (3 weeks).
Inter-person error
For an additional evaluation of counting procedure, wedetermined an inter-person error among users who performedmanual counting of cells. First inter-person error is an averageof relative standard deviations of three manual countingof cells in all (158) images and its value (with its SD) is6.55 ± 3.67%. Second inter-person error is an average ofrelative standard deviations based on manual counting of cellsfrom eight people in Laboratory of Biocybernetics on 10 imagesfrom our test images. Its value with SD is 10.57 ± 3.25%,which slightly surpasses the first estimation of inter-personerror. Both inter-person error are quite similar to the error ofour counting procedure and clearly demonstrate difficulty toobtain real number of cells even for expert users.
In Table 5, we present the results of evaluation of ourprocedure: inter person errors, automatic versus manualcounting, computer/human counting time.
Evaluation of procedure on our data obtained from electroporationexperiments
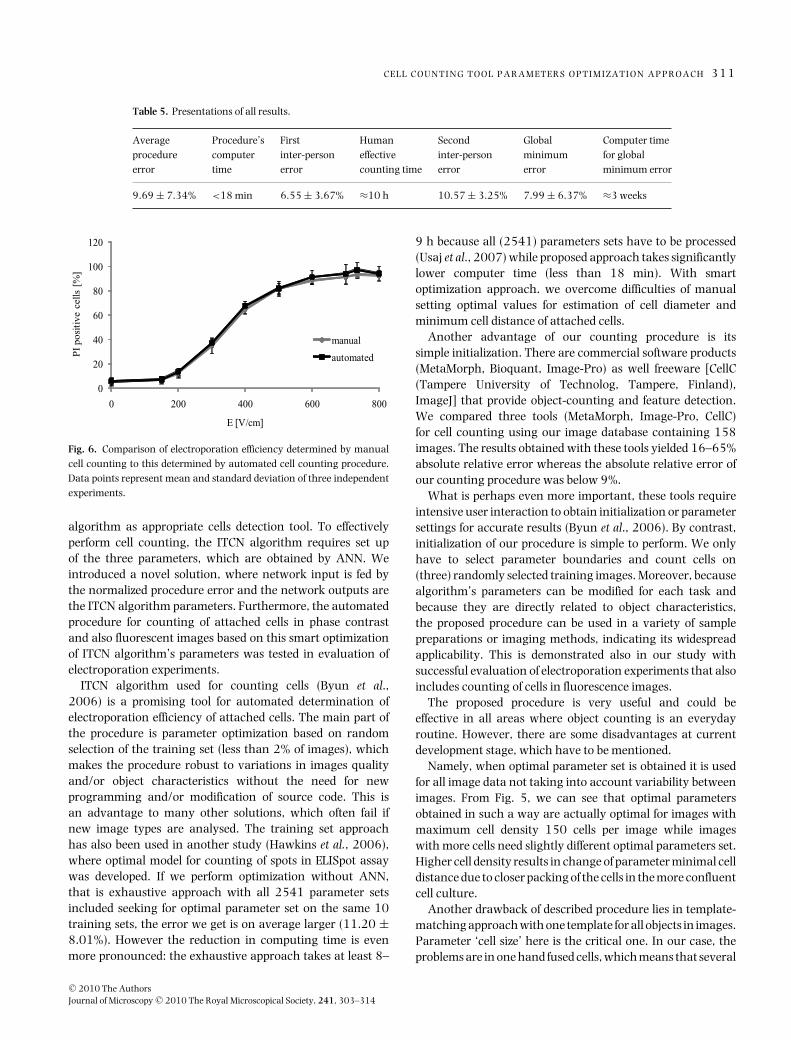
Figure 6 depicts final demonstration of our procedureon the data from electroporation experiments of attachedcells. Electroporation efficiency is represented as a ratiobetween number of fluorescent cells and the total numberof cells counted on the phase contrast images. Weobserve increase in the number of fluorescence cellswith increasing field amplitude. If we compare manuallydetermined electroporation efficiency with electroporationefficiency determined by our automated cell counting weobserve excellent agreement of corresponding curves. Thisclearly demonstrates applicability of our automated countingprocedure. The relative error of automated cell counting ofthose three experiments was, however, on average 8.53% forphase contrast images (what is in the range of interpersonalerror 7.40%) and 7.64% for fluorescence images.
Discussion
In this paper, we present a technique for effective automatedcounting of attached and nonuniformly distributed cellsin phase contrast images. This novel technique is robustenough against changes in cell shape and other opticalcharacteristics and could thus be also used for live cellimaging and analysis of large number of images obtainedby automatic image acquisition. We identified the ITCN
C© 2010 The AuthorsJournal of Microscopy C© 2010 The Royal Microscopical Society, 241, 303–314
C E L L C O U N T I N G T O O L P A R A M E T E R S O P T I M I Z A T I O N A P P R O A C H 3 1 1
Table 5. Presentations of all results.
Average Procedure’s First Human Second Global Computer timeprocedure computer inter-person effective inter-person minimum for globalerror time error counting time error error minimum error
9.69 ± 7.34% <18 min 6.55 ± 3.67% ≈10 h 10.57 ± 3.25% 7.99 ± 6.37% ≈3 weeks
0
20
40
60
80
100
120
0 200 400 600 800
PI
posi
tive
cel
ls[%
]
E [V/cm]
manual
automated
Fig. 6. Comparison of electroporation efficiency determined by manualcell counting to this determined by automated cell counting procedure.Data points represent mean and standard deviation of three independentexperiments.
algorithm as appropriate cells detection tool. To effectivelyperform cell counting, the ITCN algorithm requires set upof the three parameters, which are obtained by ANN. Weintroduced a novel solution, where network input is fed bythe normalized procedure error and the network outputs arethe ITCN algorithm parameters. Furthermore, the automatedprocedure for counting of attached cells in phase contrastand also fluorescent images based on this smart optimizationof ITCN algorithm’s parameters was tested in evaluation ofelectroporation experiments.
ITCN algorithm used for counting cells (Byun et al.,2006) is a promising tool for automated determination ofelectroporation efficiency of attached cells. The main part ofthe procedure is parameter optimization based on randomselection of the training set (less than 2% of images), whichmakes the procedure robust to variations in images qualityand/or object characteristics without the need for newprogramming and/or modification of source code. This isan advantage to many other solutions, which often fail ifnew image types are analysed. The training set approachhas also been used in another study (Hawkins et al., 2006),where optimal model for counting of spots in ELISpot assaywas developed. If we perform optimization without ANN,that is exhaustive approach with all 2541 parameter setsincluded seeking for optimal parameter set on the same 10training sets, the error we get is on average larger (11.20 ±8.01%). However the reduction in computing time is evenmore pronounced: the exhaustive approach takes at least 8–
9 h because all (2541) parameters sets have to be processed(Usaj et al., 2007) while proposed approach takes significantlylower computer time (less than 18 min). With smartoptimization approach. we overcome difficulties of manualsetting optimal values for estimation of cell diameter andminimum cell distance of attached cells.
Another advantage of our counting procedure is itssimple initialization. There are commercial software products(MetaMorph, Bioquant, Image-Pro) as well freeware [CellC(Tampere University of Technolog, Tampere, Finland),ImageJ] that provide object-counting and feature detection.We compared three tools (MetaMorph, Image-Pro, CellC)for cell counting using our image database containing 158images. The results obtained with these tools yielded 16–65%absolute relative error whereas the absolute relative error ofour counting procedure was below 9%.
What is perhaps even more important, these tools requireintensive user interaction to obtain initialization or parametersettings for accurate results (Byun et al., 2006). By contrast,initialization of our procedure is simple to perform. We onlyhave to select parameter boundaries and count cells on(three) randomly selected training images. Moreover, becausealgorithm’s parameters can be modified for each task andbecause they are directly related to object characteristics,the proposed procedure can be used in a variety of samplepreparations or imaging methods, indicating its widespreadapplicability. This is demonstrated also in our study withsuccessful evaluation of electroporation experiments that alsoincludes counting of cells in fluorescence images.
The proposed procedure is very useful and could beeffective in all areas where object counting is an everydayroutine. However, there are some disadvantages at currentdevelopment stage, which have to be mentioned.
Namely, when optimal parameter set is obtained it is usedfor all image data not taking into account variability betweenimages. From Fig. 5, we can see that optimal parametersobtained in such a way are actually optimal for images withmaximum cell density 150 cells per image while imageswith more cells need slightly different optimal parameters set.Higher cell density results in change of parameter minimal celldistance due to closer packing of the cells in the more confluentcell culture.
Another drawback of described procedure lies in template-matching approach with one template for all objects in images.Parameter ‘cell size’ here is the critical one. In our case, theproblems are in one hand fused cells, which means that several
C© 2010 The AuthorsJournal of Microscopy C© 2010 The Royal Microscopical Society, 241, 303–314

3 1 2 M . U S A J E T A L .
individual cells have fused into one giant cell (because ofthis reason extremely large, i.e. giant cells have been alreadyexcluded from test images). These giant cells are in principleover-counted. By contrast, there was also an undercountingproblems found in confluent cell culture, due to high densityof cells in images. It need to be stressed, however, that inconfluent cell culture it is difficult to obtain exact number ofcells even by manual counting performed by experienced user.In confluent cell culture, cells have consecutively the smallestsize/area. Fused cells and confluent cell culture are found inimages with high number of cells, therefore the counting errorincreases with number of cells, as we can observe in Fig. 5.
Our goal is to further improved method that will not onlydistinguish between images with small and high numberof cells, but each image will be processed with its ownoptimal parameter set and template that will take care ofboth problems mentioned earlier. We are planning to engagemore sophisticated heuristic optimization approach, such asgenetic algorithm and ant-colony optimization to ignore localoptimum trap, but consequently they will take more computertime. The challenge lies, however, also in the increasingprocessing speed towards the real-time.
When we want to asses and justify the accuracy of ourautomated procedure, we have to stress that there is nostandard method of cell counting in phase contrast images towhich automated methods could be compared. In the absenceof such a standard evaluation, an expert opinion (with all ofits associated subjectivity) represents the standard to whichautomated methods are evaluated (Hawkins et al., 2006).The accuracy of automated counting method refers to howfaithfully the method replicates the count from the expert.Image processing techniques usually have large amount ofparameters, which have to be precisely tuned to get reliableresults. Therefore direct comparison of global image analysissoftware is difficult because results from image analysiscan be heavily skewed by how software is tuned. Besides,commercial software package are numerous and expensive.The algorithms in commercial software are also proprietaryand protected so we cannot know how actually they work.For that reason they cannot be directly compared apartfrom the entire software package. The best evaluation of anynew algorithm is, therefore, comparison with so-called goldstandard such as manual counting, visual inspection andCoulter particle counters (Carpenter et al., 2006).
We thus created our own image database with definedinter-person error and global minimum error to objectivelyassess our counting procedure. The average relative errorbetween average cell numbers of three manual counting andour procedure (9.69%) is comparable to variation of manualcounting as inter-person error is up to 10%. The advantageof automatic counting is the fact that it substantially reduceshuman counting time. Experimentally, we estimated averagetime for manual counting to be four minutes per image whichgives approximately 10 h for 158 images. With the described
method, manual counting time is reduced to 12 min. Theerror of automated counting can be significantly decreased(to 4%) if one training set per each experiment is chosenand if the illumination, the focus, the cell density (not toodense) and cell morphology (not too large) are taking care ofduring acquisition of images. In addition, taking into accountglobal optimum error (7.99%) and procedure’s systematicerror (9.69%) and time needed to achieve global optimum (3weeks), the performances of our optimization approach as wellof described counting procedure are acceptable. Finally, weshould mention that the procedure was quickly initialized andsuccessfully used also for fluorescence image counting. Thismakes possible automated determination of electroporationefficiency as can be seen in Fig. 6, where good agreementwith manual counting was obtained. Our image database isavailable as a supplemental material that other researchers inthis field could compare their counting tools with.
Conclusions
Automated measurement from microscopy images is animportant tool in biotechnology and biomedicine. Theprocedure we describe here for automated cell counting inphase contrast images is especially useful on large numbers ofimages. The presented procedure at its current developmentproduces reasonably good and acceptable results. Averageprocedure’s systematic error is 9.69%, which is comparableto manual counting inter-person error. With our smartparameter optimization approach, the need of humanintervention (counting time and ITCN algorithm initialization)is reduced considerably nevertheless comparable resultsare achieved. The procedure can be successfully used alsofor fluorescence image counting and thus for automateddetermination of electroporation efficiency.
Acknowledgements
This research was supported by the Slovenian ResearchAgency (ARRS). Authors thank to Jiyun Byun, Center forBioImage Informatics, University of California, for providing uswith MATLAB source code and her help in tuning algorithm’sparameters. The authors also thank students and employeesin Laboratory of Biocybernetics for manual counting of cellsand especially to Alenka Macek-Lebar, Ph.D., for helpful andfruitful discussions during the preparation of this work. Theauthors also thank Prof. Bostjan Likar, Ph.D., for helpfuldiscussion and providing an application for retrospectiveshading correction.
References
Ambriz-Colin, F., Torres-Cisneros, M., Avina-Cervantes, J.G., Saavedra-Martinez, J.E., Debeir, O. & Sanchez-Mondragon, J.J. (2006) Detection
C© 2010 The AuthorsJournal of Microscopy C© 2010 The Royal Microscopical Society, 241, 303–314

C E L L C O U N T I N G T O O L P A R A M E T E R S O P T I M I Z A T I O N A P P R O A C H 3 1 3
of biological cells in phase-contrast microscopy images. In: Proceedingsof the IEEE MICAI. IEEE Computer Society, Washington.
Andre, F. & Mir, L.M. (2004) DNA electrotransfer: its principles and anupdated review of its therapeutic applications. Gene Ther. 11, S33–S42.
Byun, J.Y., Verardo, M.R., Sumengen, B., Lewis, G.P., Manjunath, B.S. &Fisher, S.K. (2006) Automated tool for the detection of cell nuclei indigital microscopic images: application to retinal images. Mol. Vis. 12,949–960.
Canatella, P.J., Karr, J.F., Petros, J.A. & Prausnitz, M.R. (2001)Quantitative study of electroporation-mediated molecular uptake andcell viability. Biophys. J. 80, 755–764.
Carpenter, A., Jones, T., Lamprecht, M., et al. (2006) CellProfiler: imageanalysis software for identifying and quantifying cell phenotypes.Genome Biol. 7, R100–R100.10.
Chen, X.W., Zhou, X.B. & Wong, S.T.C. (2006) Automated segmentation,classification, and tracking of cancer cell nuclei in time-lapsemicroscopy. IEEE Trans. Biomed. Eng. 53, 762–766.
Debeir, O., Van Ham, P., Kiss, R. & Decaestecker, C. (2005) Tracking ofmigrating cells under phase-contrast video microscopy with combinedmean-shift processes. IEEE Trans. Med. Image. 24, 697–711.
Embleton, K.V., Gibson, C.E. & Heaney, S.I. (2003) Automated countingof phytoplankton by pattern recognition: a comparison with a manualcounting method. J. Plankton Res. 25, 669–681.
Gabrijel, M., Bergant, M., Kreft, M., Jeras, M. & Zorec, R. (2009) Fusedlate endocytic compartments and immunostimulatory capacity ofdendritic—tumor cell hybridomas. J. Membr. Biol. 229, 11–18.
Gehl, J. & Geertsen, P.F. (2006) Palliation of haemorrhaging and ulceratedcutaneous tumours using electrochemotherapy. Eur. J. Cancer. Suppl.4, 35–37.
Golzio, M., Rols, M.P., Gabriel, B. & Teissie, J. (2004) Optical imaging ofin vivo gene expression: a critical assessment of the methodology andassociated technologies. Gene Ther. 11, S85–S91.
Haralick, R.M. & Shapiro, L.G. (1985) Image segmentation techniques.Comput. Vis. Graph Image Process. 29, 100–132.
Hawkins, N., Self, S. & Wakefield, J. (2006) The automated counting ofspots for the ELISpot assay. J. Immunol. Methods 316, 52–58.
Hayashi, T., Tanaka, H., Tanaka, J., Wang, R., Averbook, B.J., Cohen, P.A.& Shu, S. (2002) Immunogenicity and therapeutic efficacy of dendritic-tumor hybrid cells generated by electrofusion. Clin. Immunol. 104, 14–20.
Jacobs, J.J.L., Lehe, C., Cammans, K.D.A., Yoneda, K., Das, P.K. &Elliott, G.R. (2001) An automated method for the quantification ofimmunostained human Langerhans cells. J. Immunol. Methods 247,73–82.
Kanduser, M. & Miklavcic, D. (2008) Electroporation in biological cell andtissue: an overview. Electrotechnologies for Extraction from Food Plantsand Biomaterials (ed. by E. Vorobiev & N. Lebovka). Springer Science,New York.
Li, K., Miller, E.D., Weiss, L.E., Campbell, P.G. & Kanade, T. (2006)Online tracking of migrating and proliferating cells imaged with phase-contrast microscopy. In Proceedings of the IEEE Conference ComputerVision and Pattern Recognition Workshop. IEEE Computer Society Press,Los Alamitos.
Likar, B., Maintz, J.B.A., Viergever, M.A. & Pernus, F. (2000) Retrospectiveshading correction based on entropy minimization. J. Microsc. 197,285–295.
Macek-Lebar, A. & Miklavcic, D. (2001) Cell electropermeabilization tosmall molecules in vitro: control by pulse parameters. Radiol. Oncol. 35,193–202.
Marty, M., Sersa, G., Garbay, J.R., et al. (2006) Electrochemotherapy – aneasy, highly effective and safe treatment of cutaneous and subcutaneousmetastases: results of ESOPE (European Standard Operating Proceduresof Electrochemotherapy) study. Eur. J. Cancer Suppl. 4, 3–13.
Masters, T. (1995) Advanced Algorithms for Neural Networks: A C++Sourcebook. John Wiley & Sons Inc., New York.
Mir, L.M., Gehl, J., Sersa, G., et al. (2006) Standard operating proceduresof the electrochemotherapy: instructions for the use of bleomycin orcisplatin administered either systemically or locally and electric pulsesdelivered by the Cliniporator (TM) by means of invasive or non-invasiveelectrodes. Eur. J. Cancer Suppl. 4, 14–25.
Neumann, E., Kakorin, S. & Toensing, K. (1999) Fundamentals ofelectroporative delivery of drugs and genes. Bioelectrochem. Bioenerg.48, 3–16.
Neumann, E., Sowers, A.E. & Jordan, C.A. (1989) Electroporation andElectrofusion in Cell Biology. Springer-Verlag, New York.
Pavselj, N. & Preat, V. (2005) DNA electrotransfer into the skin using acombination of one high- and one low-voltage pulse. J. Control. Release106, 407–415.
Pucihar, G., Mir, L.M. & Miklavcic, D. (2002) The effect of pulse repetitionfrequency on the uptake into electropermeabilized cells in vitro withpossible applications in electrochemotherapy. Bioelectrochemistry 57,167–172.
Rols, M.P. (2006) Electropermeabilization, a physical method for thedelivery of therapeutic molecules into cells. Biochim. Biophys. ActaBiomembr. 1758, 423–428.
Rols, M.P. & Teissie, J. (1992) Experimental-evidence for the involvementof the cytoskeleton in mammalian-cell electropermeabilization.Biochim. Biophys. Acta 1111, 45–50.
Rubinsky, B., Onik, G. & Mikus, P. (2007) Irreversible electroporation: anew ablation modality-clinical implications. Technol. Cancer Res. Treat.6, 37–48.
Rumelhart, D.E., Hinton, G.E. & Williams, R.J. (1986) Learning internalrepresentations by error propagation. Parallel Distributed Processing:Explorations in the Microstructure of Cognition, vol. 1 (ed. by D.E.Rumelhart & J.L. McClelland). MIT Press, Cambridge, MA.
Russ, J.C. (1995) The Image Processing Handbook, 2nd edn. IEEE Press, BocaRaton, FL.
Sersa, G., Miklavcic, D., Cemazar, M., Rudolf, Z., Pucihar, G. & Snoj, M.(2008) Electrochemotherapy in treatment of tumours. Eur. J. Surg.Oncol. 34, 232–240.
Steenstrup, T., Clase, K.L. & Hannon, K.M. (2000) Rapid quantification ofcell numbers using computer images. Biotechniques 28, 624–626.
Teissie, J. & Rols, M.P. (1993) An experimental evaluation of the criticalpotential difference inducing cell-membrane electropermeabilization.Biophys. J. 65, 409–413.
Theera-Umpon, N. & Gader, P.D. (2002) System-level training of neuralnetworks for counting white blood cells. IEEE Trans. Syst., Man, Cybern.C, Appl. Rev. 32, 48–53.
Thimm, G., Moerland, P. & Fiesler, E. (1996) The interchangeability oflearning rate and gain in backpropagation neural networks. NeuralComput. 8, 451–460.
Tomazevic, D., Likar, B. & Pernus, F. (2002) Comparative evaluationof retrospective shading correction methods. J. Microsc. 208, 212–223.
Trontelj, K., Rebersek, M., Kanduser, M., Serbec, V.C., Sprohar, M.& Miklavcic, D. (2008) Optimization of bulk cell electrofusionin vitro for production of human-mouse heterohybridoma cells.Bioelectrochemistry, 74, 124–129.
C© 2010 The AuthorsJournal of Microscopy C© 2010 The Royal Microscopical Society, 241, 303–314
3 1 4 M . U S A J E T A L .
Tsong, T.Y. (1991) Electroporation of cell-membranes. Biophys. J., 60,297–306.
Usaj, M., Torkar, D. & Miklavcic, D. (2007) Automatic cell detection inphase-contrast images for evaluation of electroporation efficiency invitro. IFMBE Proceedings (ed. by T. Jarm, P. Kramar & A. Zupanic).Springer, Berlin, Heidelberg.
Vovk, U., Pernus, F. & Likar, B. (2007) A review of methods for correctionof intensity inhomogeneity in MRI. IEEE Trans. Med. Imaging 26, 405–421.
Wang, S.T. & Min, W. (2006) A new detection algorithm (NDA) basedon fuzzy cellular neural networks for white blood cell detection. IEEETrans. Inf. Technol. Biomed. 10, 5–10.
Weaver, J.C. & Chizmadzhev, Y.A. (1996) Theory of electroporation: areview. Bioelectrochem. Bioenerg. 41, 135–160.
Wu, K.N., Gauthier, D. & Levine, M.D. (1995) Live cell imagesegmentation. IEEE Trans. Biomed. Eng. 42, 1–12.
Yang, X.D., Li, H.Q. & Zhou, X.B. (2006) Nuclei segmentation usingmarker-controlled watershed, tracking using mean-shift, and Kalmanfilter in time-lapse microscopy. IEEE Trans. Circuits Syst. Regul. Paper53, 2405–2414.
Yongming, C., Biddell, K., Aiying, S., Relue, P.A. & Johnson, J.D. (1999)An automatic cell counting method for optical images. In Proceedings ofthe IEEE of the First Joint BMES/EMBS Conference, Atlanta, U.S.A.
Yu, X., McGraw, P.A., House, F.S. & Crowe, J.E., Jr. (2008) Anoptimized electrofusion-based protocol for generating virus-specifichuman monoclonal antibodies. J. Immunol. Methods. 336, 142–151.
Zupanic, A. & Miklavcic, D. (2010) Optimization and numericalmodeling in irreversible electroporation treatment planning. IrreversibleElectroporation (ed. by B. Rubinsky). Springer-Verlag, Berlin,Heidelberg.
Appendix
Short ITCN protocol for microscope user:1. From images acquired during each experiment select the
training set (recommended at least three images); try toacquire as much quality images as possible, at least avoidpoor focus, dirties, cell remainders and fused cells.
2. Perform manual cell counting on images in training set.3. Set the minimum and maximum value of ITCN tools
parameters (cell size, minimal cell distance, threshold).4. Run optimization with appropriate input data (real cell
numbers from training image set and parameters borders).5. Perform automated cell counting of the rest of the images
using ITCN tools with obtained optimal parameters.
C© 2010 The AuthorsJournal of Microscopy C© 2010 The Royal Microscopical Society, 241, 303–314