Embed Size (px)
Citation preview
Cell Line qualifying attributes for prediction of good producers Alessandro Mora
UMAss Lowell, Biopharmaceutical Summit
Lowell May 28, 2014
Biopharmaceutical Summit - UMass Lowell, May 28, 2014 2
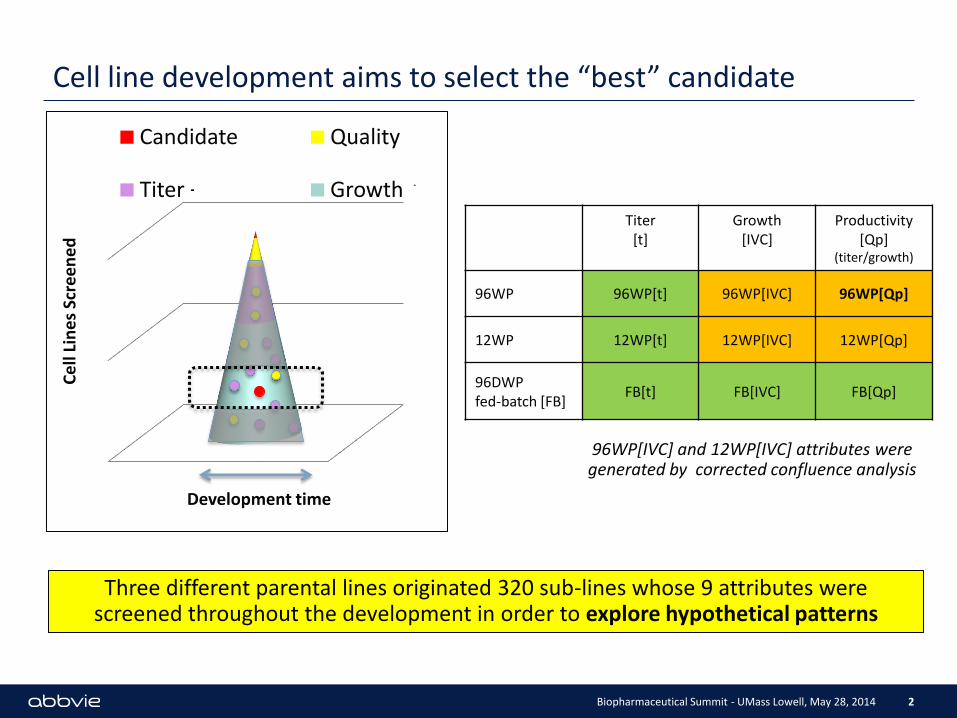
Cell line development aims to select the “best” candidate C
ell
Lin
es
Scre
en
ed
Development time
Candidate Quality +
Titer + Growth + Titer
[t] Growth
[IVC] Productivity
[Qp] (titer/growth)
96WP 96WP[t] 96WP[IVC] 96WP[Qp]
12WP 12WP[t] 12WP[IVC] 12WP[Qp]
96DWP fed-batch [FB]
FB[t] FB[IVC] FB[Qp]
Three different parental lines originated 320 sub-lines whose 9 attributes were screened throughout the development in order to explore hypothetical patterns
96WP[IVC] and 12WP[IVC] attributes were generated by corrected confluence analysis
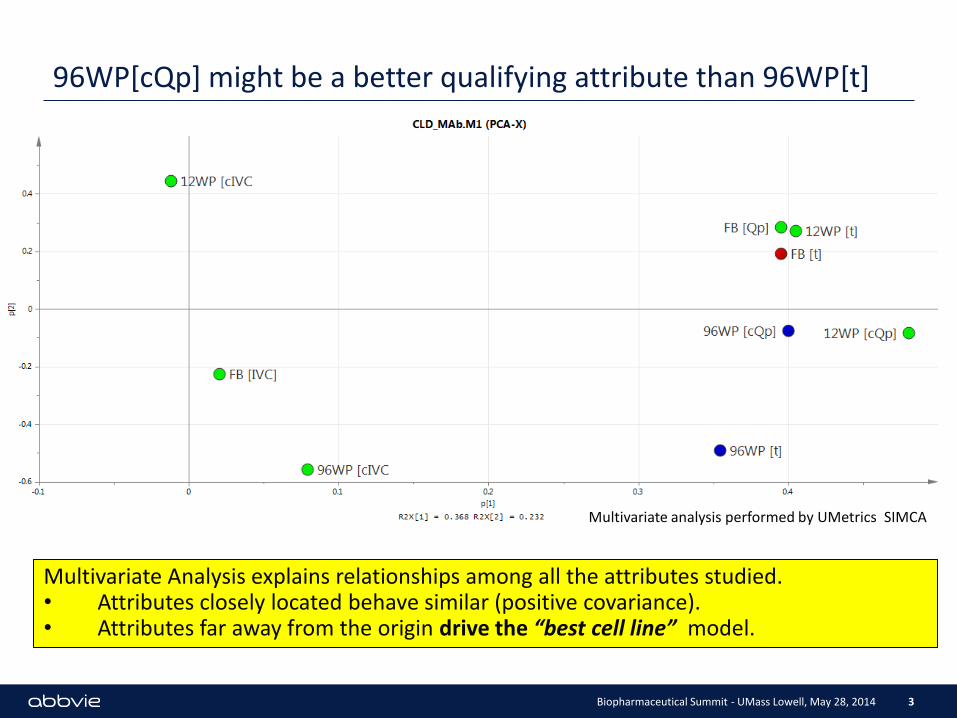
96WP[cQp] might be a better qualifying attribute than 96WP[t]
Biopharmaceutical Summit - UMass Lowell, May 28, 2014 3
Multivariate Analysis explains relationships among all the attributes studied. • Attributes closely located behave similar (positive covariance). • Attributes far away from the origin drive the “best cell line” model.
Multivariate analysis performed by UMetrics SIMCA
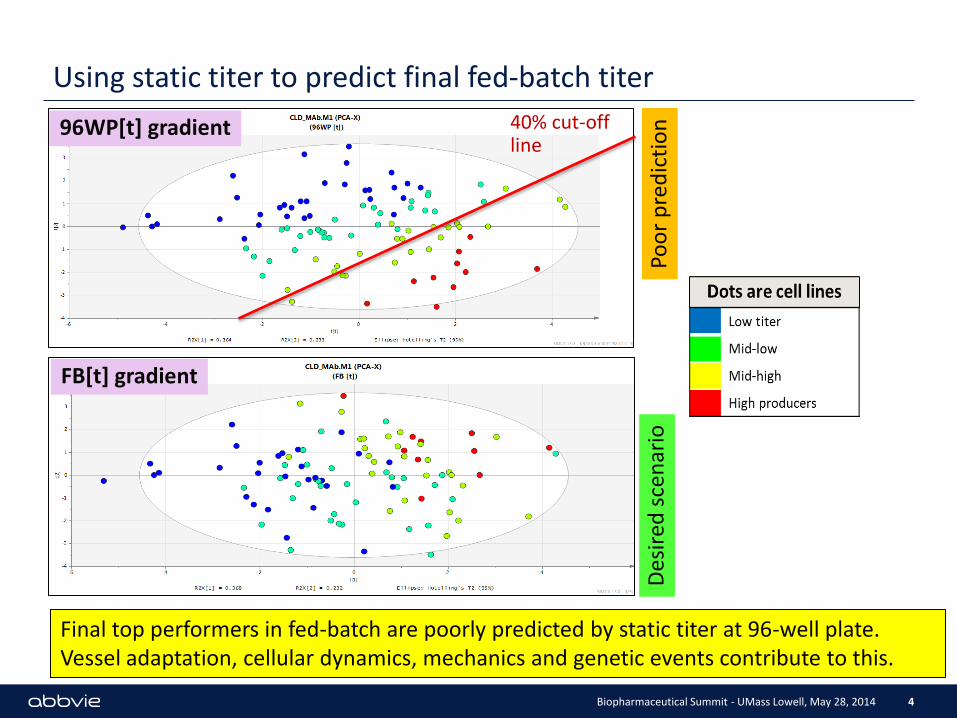
Using static titer to predict final fed-batch titer
Biopharmaceutical Summit - UMass Lowell, May 28, 2014 4
96WP[t] gradient
FB[t] gradient
Final top performers in fed-batch are poorly predicted by static titer at 96-well plate. Vessel adaptation, cellular dynamics, mechanics and genetic events contribute to this.
Des
ired
sce
nar
io
Poo
r p
red
icti
on
40% cut-off line
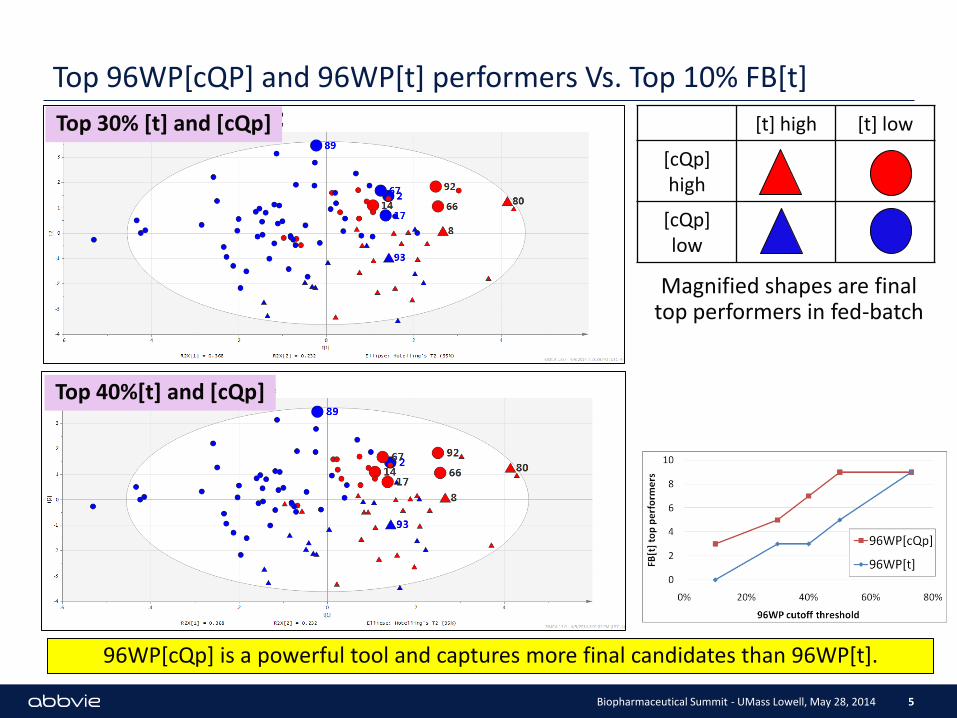
Top 96WP[cQP] and 96WP[t] performers Vs. Top 10% FB[t]
5
[t] high [t] low
[cQp] high
[cQp] low
96WP[cQp] is a powerful tool and captures more final candidates than 96WP[t].
Top 30% [t] and [cQp]
Top 40%[t] and [cQp]
Magnified shapes are final top performers in fed-batch
Biopharmaceutical Summit - UMass Lowell, May 28, 2014
Conclusions
• Early stage titer in 96WP doesn’t predict top FB producers.
• Productivity in 96WP shows a good predictive power combining existing 96WP[t] with new developed 96WP[IVC] attribute.
• 96WP[cQp] acts like an enhanced prediction tool and it might save about 20-40% initial workload in cell line development.
Biopharmaceutical Summit - UMass Lowell, May 28, 2014 6
Metabolomics for CHO-Cell
Production Seo-Young Park
Ph.D student,
Chemical Engineering, Umass Lowell
05/30/2014
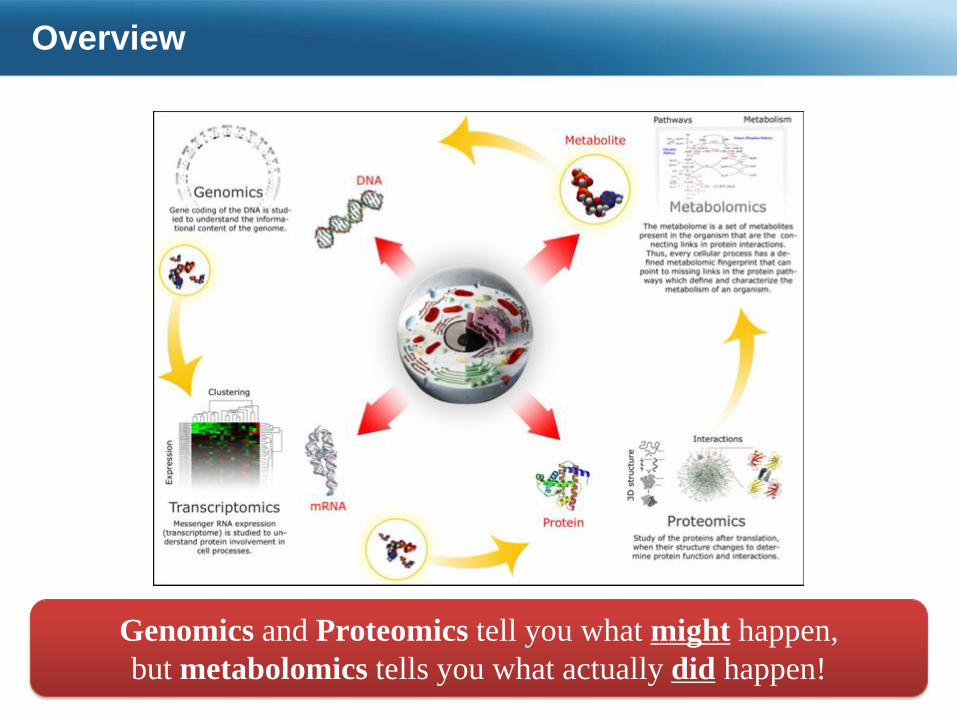
Overview
Genomics and Proteomics tell you what might happen,
but metabolomics tells you what actually did happen!
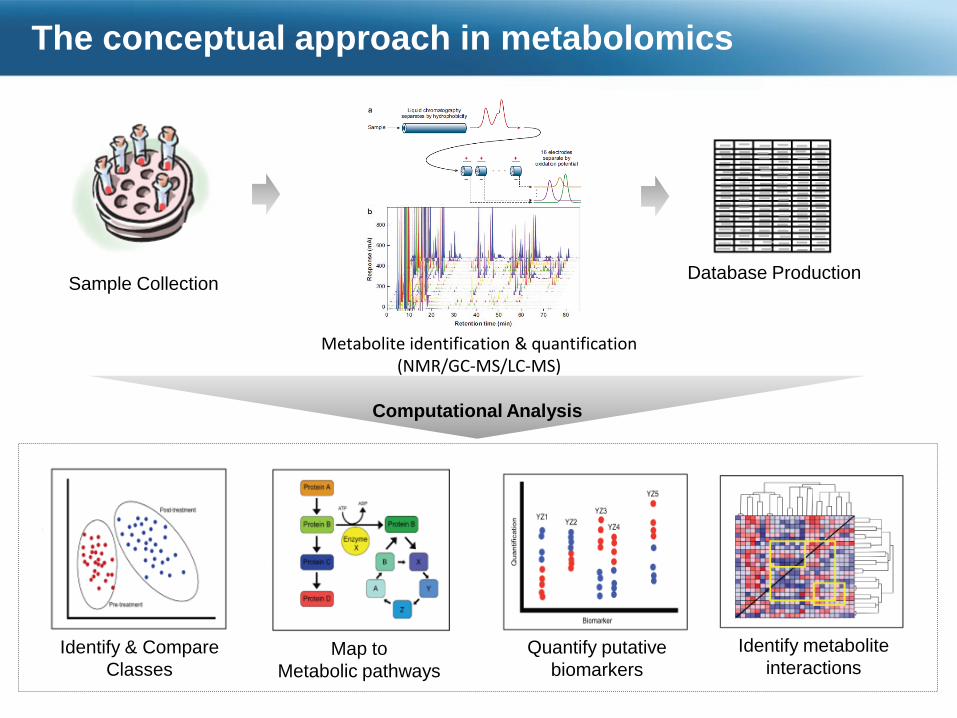
The conceptual approach in metabolomics
Metabolite identification & quantification (NMR/GC-MS/LC-MS)
Map to
Metabolic pathways
Identify & Compare
Classes
Quantify putative
biomarkers
Identify metabolite
interactions
Sample Collection Database Production
Computational Analysis
Conclusion and Future Directions
The metabolomics enables the identification of the metabolome while revealing tremendous information about cellular function and the metabolic pathways of a cell. It is increasingly used in investigations of more subtle effects, such as the indication of pharmaceutical efficacy, and the probing of life-style changes, nutrition and the complex interconnection of metabolic processes.
Challenges in Metabolomics: (1) metabolites have a wide range of molecular weights and large variations in concentration, (2) the metabolome is much more dynamic than proteome and genome, which makes the
metabolome more time sensitive, (3) metabolites can be either polar or nonpolar, as well as organic or inorganic molecules. This
makes the chemical separation a key step in metabolomics, (4) metabolites have chemical structures, which makes the identification using MS an extreme
challenge.
Future work we will explore: (1) development of metabolite identification and Standardization of culture conditions, (2) standardization of sample preparation protocols will ensure reproducibility and reliability, (3) development of new sample preparation methods will increase metabolite coverage in
future manufacturing cell metabolomics studies.
Biochemical Reaction Network Modelling for Glycosylation
Sha Sha
Biomedical engineering and biotechnology (BMEBT), UMass Lowell
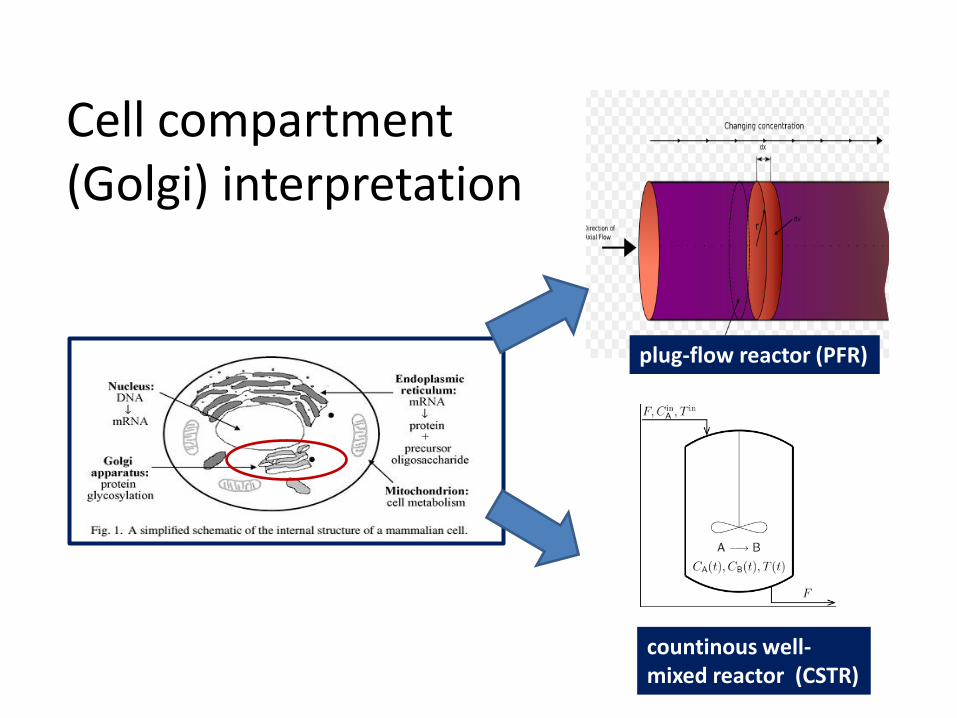
countinous well- mixed reactor (CSTR)
plug-flow reactor (PFR)
Cell compartment (Golgi) interpretation
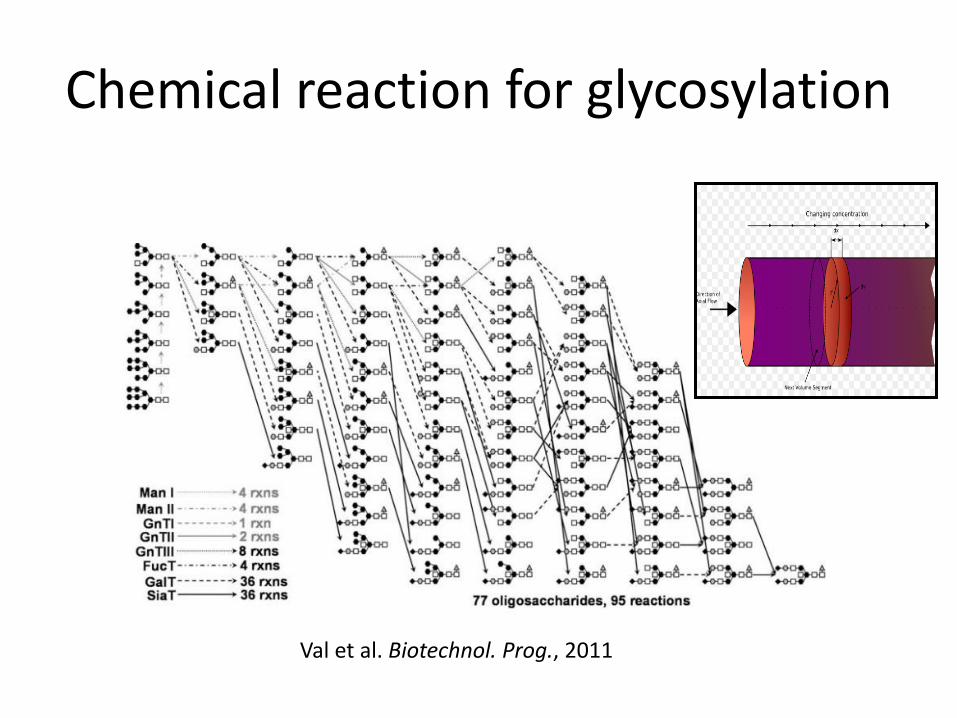
Chemical reaction for glycosylation
Val et al. Biotechnol. Prog., 2011
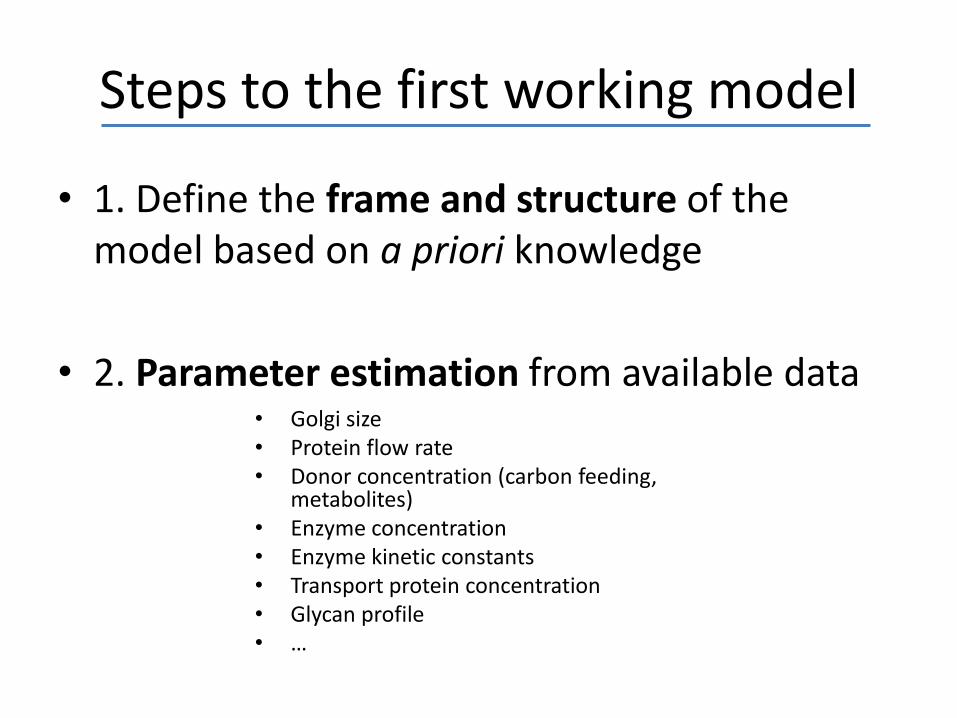
Steps to the first working model
• 1. Define the frame and structure of the model based on a priori knowledge
• 2. Parameter estimation from available data
• Golgi size • Protein flow rate • Donor concentration (carbon feeding,
metabolites) • Enzyme concentration • Enzyme kinetic constants • Transport protein concentration • Glycan profile • …
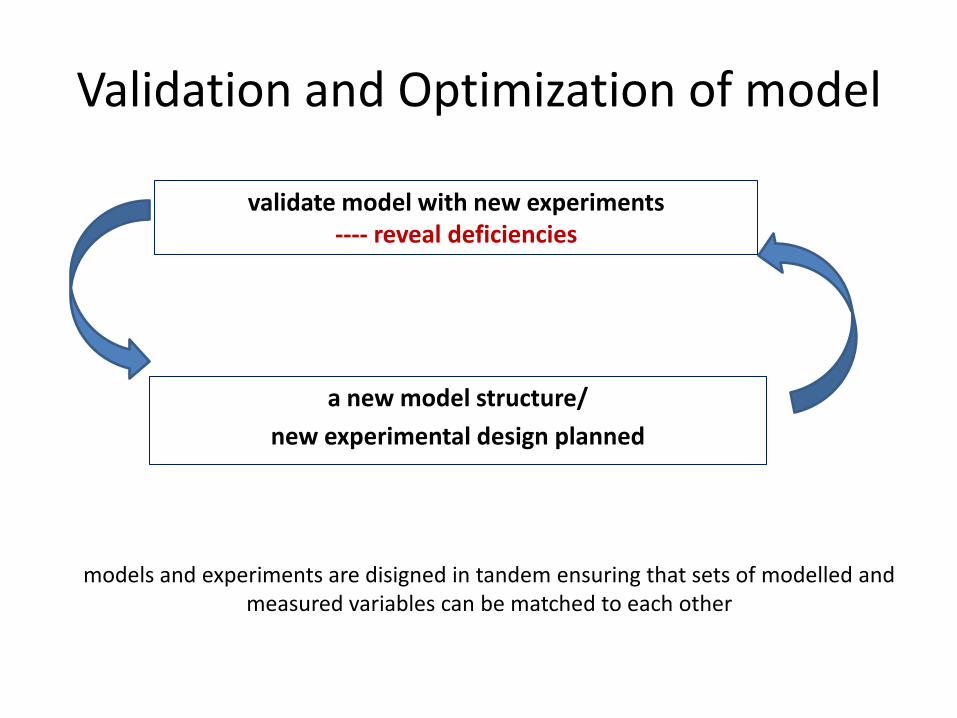
Validation and Optimization of model
a new model structure/
new experimental design planned
validate model with new experiments ---- reveal deficiencies
models and experiments are disigned in tandem ensuring that sets of modelled and measured variables can be matched to each other
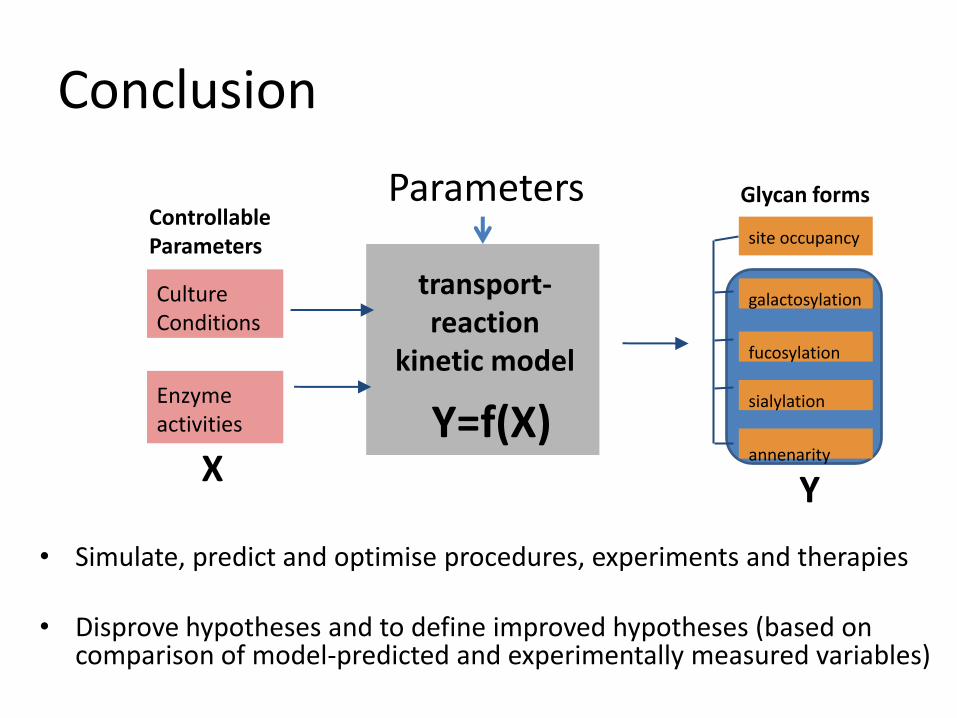
Conclusion
Parameters
Culture Conditions
Enzyme activities
transport-reaction
kinetic model
site occupancy
galactosylation
fucosylation
sialylation
annenarity
Glycan forms Controllable Parameters
X Y
Y=f(X)
• Simulate, predict and optimise procedures, experiments and therapies
• Disprove hypotheses and to define improved hypotheses (based on comparison of model-predicted and experimentally measured variables)
Protein A Column: Modeling, Simulation & Multi-Variate Analysis
Ketki Behere PhD in Chemical Engineering
Umass Lowell, MA
Advisor: Prof Seongkyu Yoon
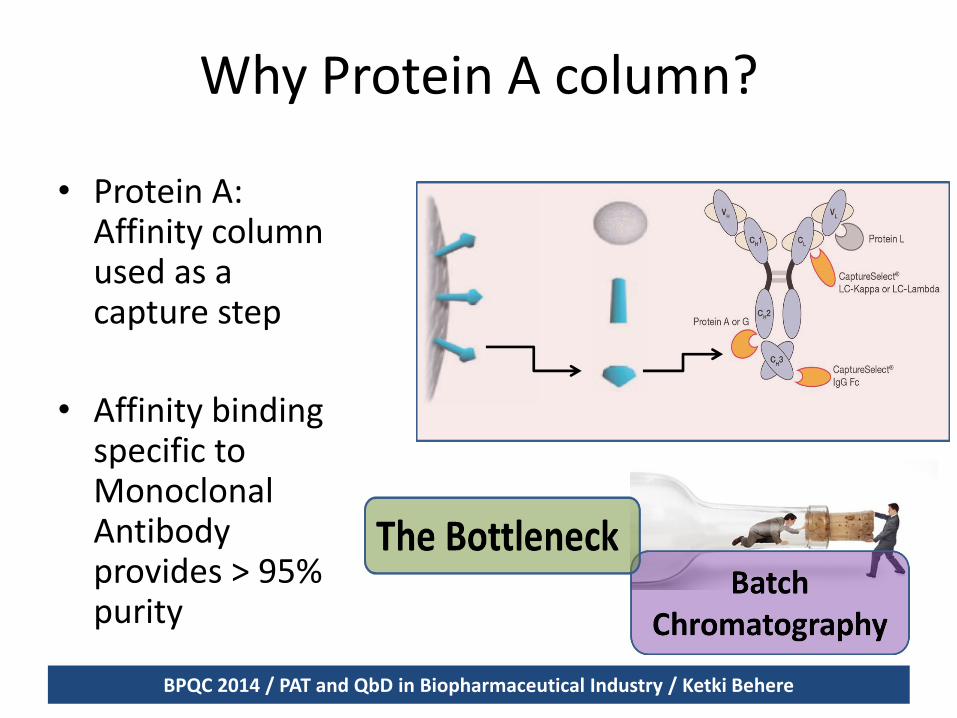
Why Protein A column?
• Protein A: Affinity column used as a capture step
• Affinity binding specific to Monoclonal Antibody provides > 95% purity
BPQC 2014: Ketki Behere BPQC 2014 / PAT and QbD in Biopharmaceutical Industry / Ketki Behere
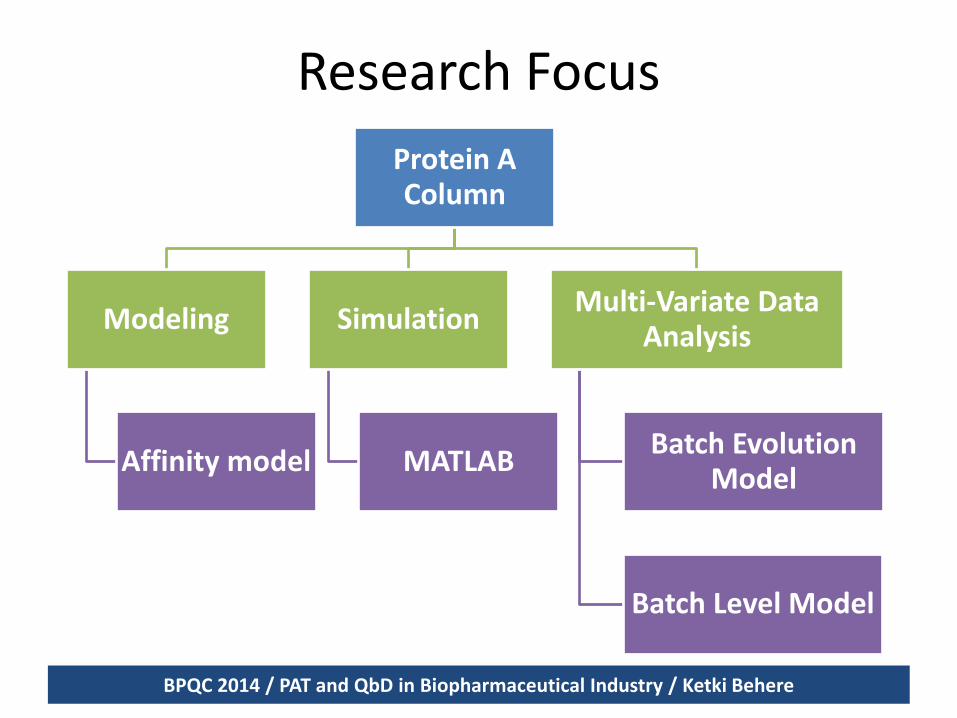
Research Focus
Protein A Column
Modeling
Affinity model
Simulation
MATLAB
Multi-Variate Data Analysis
Batch Evolution Model
Batch Level Model
BPQC 2014 / PAT and QbD in Biopharmaceutical Industry / Ketki Behere
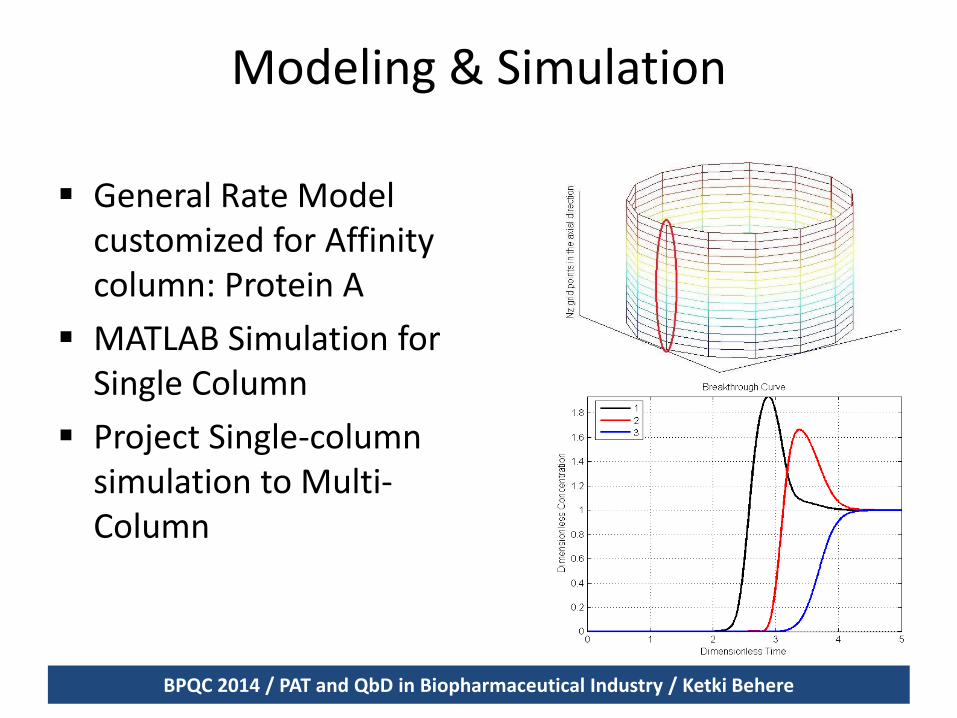
Modeling & Simulation
General Rate Model customized for Affinity column: Protein A
MATLAB Simulation for Single Column
Project Single-column simulation to Multi-Column
BPQC 2014 / PAT and QbD in Biopharmaceutical Industry / Ketki Behere
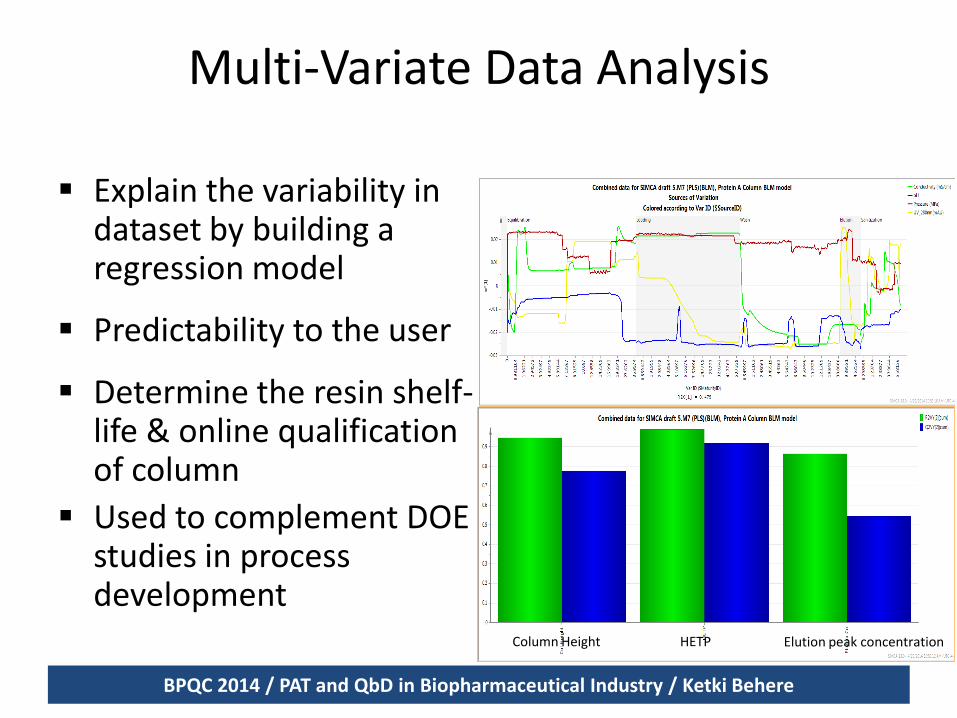
Multi-Variate Data Analysis
Explain the variability in dataset by building a regression model
Predictability to the user
Determine the resin shelf-life & online qualification of column
Used to complement DOE studies in process development
BPQC 2014 / PAT and QbD in Biopharmaceutical Industry / Ketki Behere
Column Height HETP Elution peak concentration
Conclusion
• Mechanistic model to better explain, simulate, control and analyze the chromatography process.
• The purification process will become robust improving the process economics and increase the productivity.
• A Continuous Downstream Process (CDP) with Model & Simulation will demonstrate the Next Generation Bioprocess.
BPQC 2014: Ketki Behere BPQC 2014 / PAT and QbD in Biopharmaceutical Industry / Ketki Behere