Embed Size (px)
Citation preview
Supplementary Information
S1
Cell Nucleus-Targeting Zwitterionic Carbon Dots
Yun Kyung Jung1, Eeseul Shin1, and Byeong-Su Kim1,2,*
1Department of Chemistry and 2Department of Energy Engineering, Ulsan National Institute
of Science and Technology (UNIST), UNIST-gil 50, Ulsan 689-798, Republic of Korea
E-mail: [email protected]
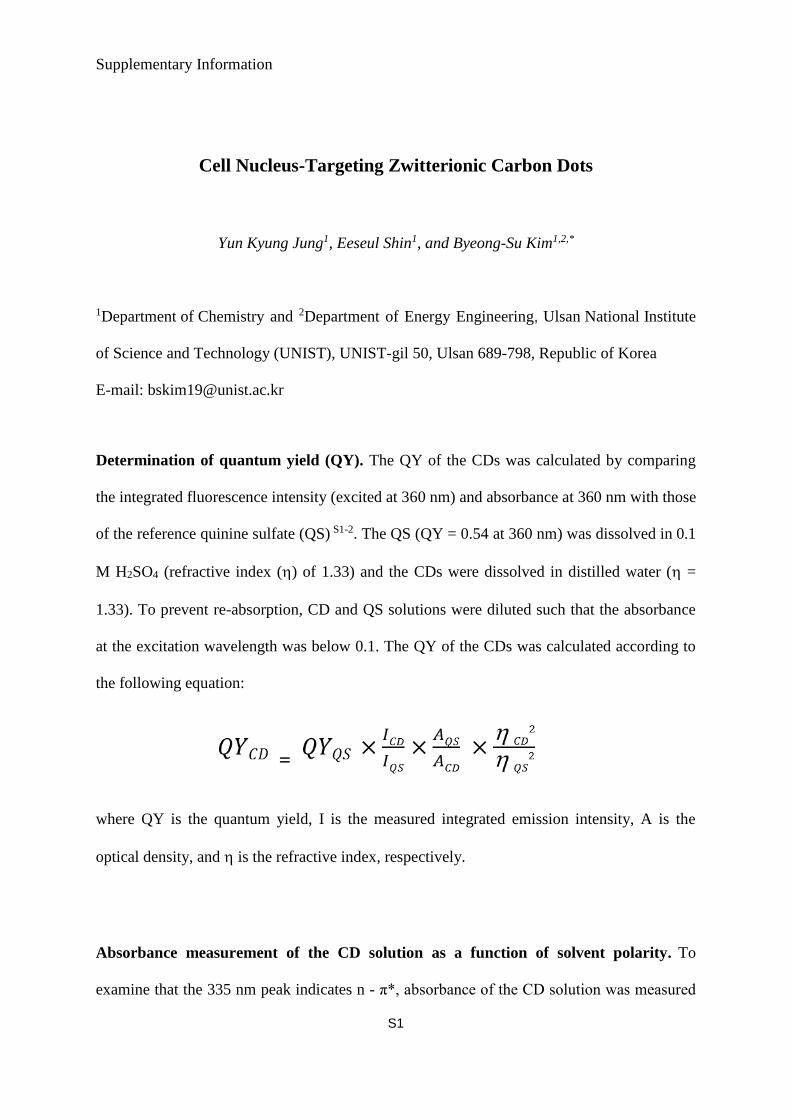
Determination of quantum yield (QY). The QY of the CDs was calculated by comparing
the integrated fluorescence intensity (excited at 360 nm) and absorbance at 360 nm with those
of the reference quinine sulfate (QS) S1-2. The QS (QY = 0.54 at 360 nm) was dissolved in 0.1
M H2SO4 (refractive index () of 1.33) and the CDs were dissolved in distilled water ( =
1.33). To prevent re-absorption, CD and QS solutions were diluted such that the absorbance
at the excitation wavelength was below 0.1. The QY of the CDs was calculated according to
the following equation:
where QY is the quantum yield, I is the measured integrated emission intensity, A is the
optical density, and is the refractive index, respectively.
Absorbance measurement of the CD solution as a function of solvent polarity. To
examine that the 335 nm peak indicates n - π*, absorbance of the CD solution was measured
Supplementary Information
S2
depending on polarity. Four different solvents (ethanol (EtOH), dimethyl sulfoxide (DMSO),
dimethylformamide (DMF), and tetrahydrofuran (THF)) were mixed with distilled water and
the CDs, producing their final concentration of 50%, 83%, and 91% (vol/vol).
Photoluminescence lifetime measurement. The exciton lifetime was determined by the
time-correlated single photon counting (TCSPC) technique. The computer controlled diode
laser with 375 nm wavelength, 54 ps pulse width and 40 MHz repetition rate was used as an
excitation source. The PL emission was spectrally resolved by using some collection optics
and a monochromator (PicoQuant). The TCSPC module (PicoHarp 300E, PicoQuant) with a
MCP-PMT (R3809U-5x series, Hamamatsu) was used for ultrafast detection. The total
instrument response function (IRF) for PL decay was less than 30 ps, and the temporal time
resolution was less than 10 ps. The deconvolution of actual fluorescence decay and IRF was
performed by using a fitting software (FlouFit, PicoQuant) to deduce the time constant
associated with each exponential decay.
Cell culture. HeLa cells, derived from human epithelial carcinoma cells, were incubated with
Dulbecco’s Modified Eagle’s Medium (DMEM, Life technologies) with 10% fetal bovine
serum and 1% penicillin-streptomycin. WI-38 cells, derived from human diploid cells, were
incubated with Roswell Park Memorial Institute (RPMI) 1640 media (Life Technologies)
with 10% fetal bovine serum, 25 mM sodium bicarbonate and 1% penicillin-streptomycin.
Bio-TEM. The HeLa cells were incubated with 500 g/mL of CDs for 24 h. Then, the cells
were washed twice with 1 PBS. The HeLa cells were fixed by glutaraldehyde at room
temperature, then rinsed with PB and dehydrated through a graded ethanol series, finally
Supplementary Information
S3
cleared with propylene oxide. Then, the cell sample was embedded in EPOM812 and
polymerized in the oven at 37 °C for 12 h, at 45 °C for 12 h and at 60 °C for 48 h. Ultrathin
sections of approximately 70 nm thick were cut with a diamond knife on a Leica UC6
ultramicrotome and transferred to the copper grid. The sample was stained with uranyl
acetate for 10 min and with lead citrate for 5 min. The images were viewed on JEM-1230
electron microscopy.
Co-incubation of the CDs with histones or DNA polymerase in HeLa cells. HeLa cell was
seeded into each well of an eight-chamber slide at a density of 2 × 10⁴ cells per well and
incubated for 24 h in 5% CO2 at 37 °C. After removing the culture medium, the wells were
washed with 1 PBS. Each well was then replaced with 175 μL of fresh medium, 20 μL of
CDs solution, and 5 μL of histone H2A (1.0 mg/mL, New England BioLabs® Inc., UK) or 5
μL of DNA polymerase (5 units/µL, Bioneer, Korea). After 24 h incubation, blue, green, and
red fluorescence signals of CDs were observed with a confocal laser scanning microscope
(Zeiss LSM 510 META, Jena, Germany) under ultraviolet (405 nm), blue (473 nm), and
green (559 nm) laser excitation with 1000× magnification, respectively.
Cytotoxicity test of CDs, Dox, and Dox/CD conjugates. HeLa and WI-38 (human diploid
cells) were purchased from the Korean Cell Line Bank (Seoul, Korea). Cell viability was
assessed by the MTT assay (Sigma-Aldrich). Cells were seeded in 96-well plates at a density
of 1 104 cells per well and incubated for 24 h in 5% CO2 at 37 °C. After removing the
culture medium, the wells were washed with 1 PBS. Each well was then replaced with 90
L of fresh medium and 10 L of 10 CDs solution. After 24 h in 5% CO2 at 37 °C, MTT
agent was added to each well of cells (final concentration: 0.50 mg/mL) and incubated for 4 h
Supplementary Information
S4
in an incubator. 100 L of DMSO was added to solubilize the MTT-formazan product and
the sample was incubated for further 15 min at room temperature. Absorbance of the solution
was read at a test wavelength of 540 nm.
References
S1. Zhu, H. et al. Microwave synthesis of fluorescent carbon nanoparticles with
electrochemiluminescence properties. Chem. Commun. 5118-5120 (2009).
S2. Zhu, L. et al. Fluorescence immunoassay based on carbon dots as labels for the
detection of human immunoglobulin G. Anal. Methods 6, 4430-4436 (2014).
S3. Hu, M., Tian, F., Zhao, Z., Huang, Q., Xu, B., Wang, L.-M., Wang, H.-T., Tian, Y., He,
J. Exotic Cubic Carbon Allotropes. J. Phys. Chem. C 116, 24233-24238 (2012).
Supplementary Information
S5
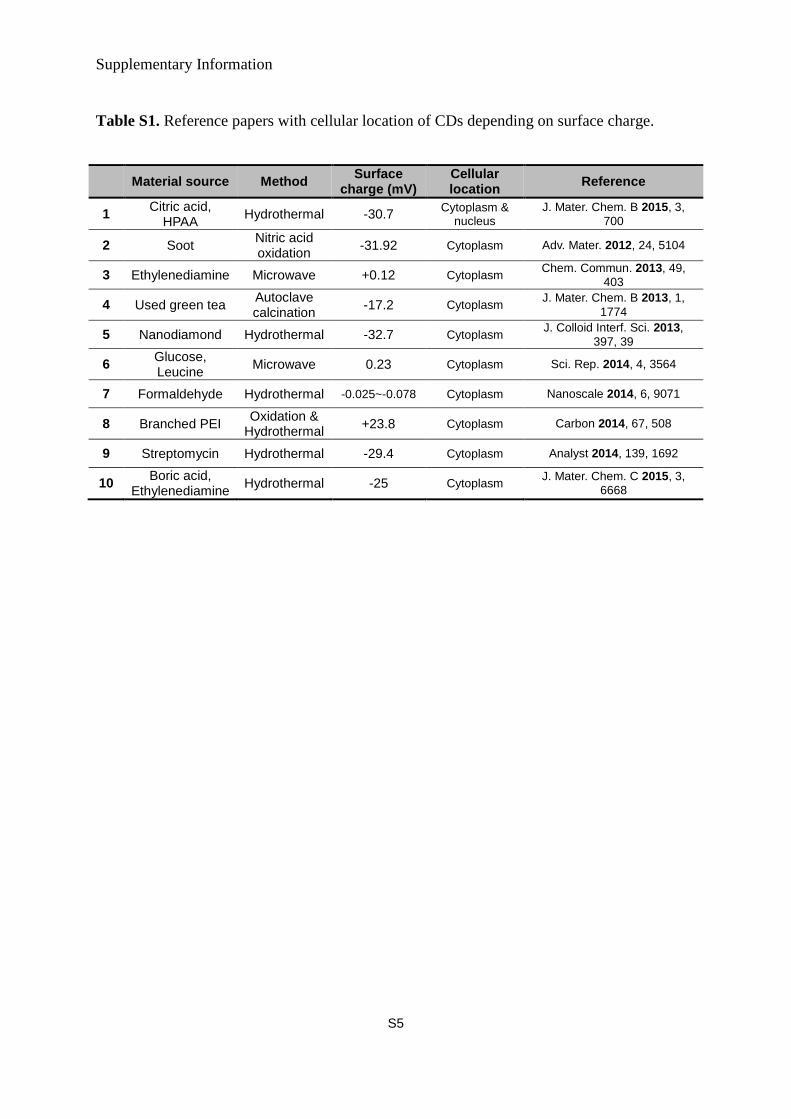
Table S1. Reference papers with cellular location of CDs depending on surface charge.
Material source Method Surface
charge (mV) Cellular location
Reference
1 Citric acid,
HPAA Hydrothermal -30.7
Cytoplasm & nucleus
J. Mater. Chem. B 2015, 3,
700
2 Soot Nitric acid oxidation
-31.92 Cytoplasm Adv. Mater. 2012, 24, 5104
3 Ethylenediamine Microwave +0.12 Cytoplasm Chem. Commun. 2013, 49,
403
4 Used green tea Autoclave calcination
-17.2 Cytoplasm J. Mater. Chem. B 2013, 1,
1774
5 Nanodiamond Hydrothermal -32.7 Cytoplasm J. Colloid Interf. Sci. 2013,
397, 39
6 Glucose, Leucine
Microwave 0.23 Cytoplasm Sci. Rep. 2014, 4, 3564
7 Formaldehyde Hydrothermal -0.025~-0.078 Cytoplasm Nanoscale 2014, 6, 9071
8 Branched PEI Oxidation &
Hydrothermal +23.8 Cytoplasm Carbon 2014, 67, 508
9 Streptomycin Hydrothermal -29.4 Cytoplasm Analyst 2014, 139, 1692
10 Boric acid,
Ethylenediamine Hydrothermal -25 Cytoplasm
J. Mater. Chem. C 2015, 3,
6668
Supplementary Information
S6
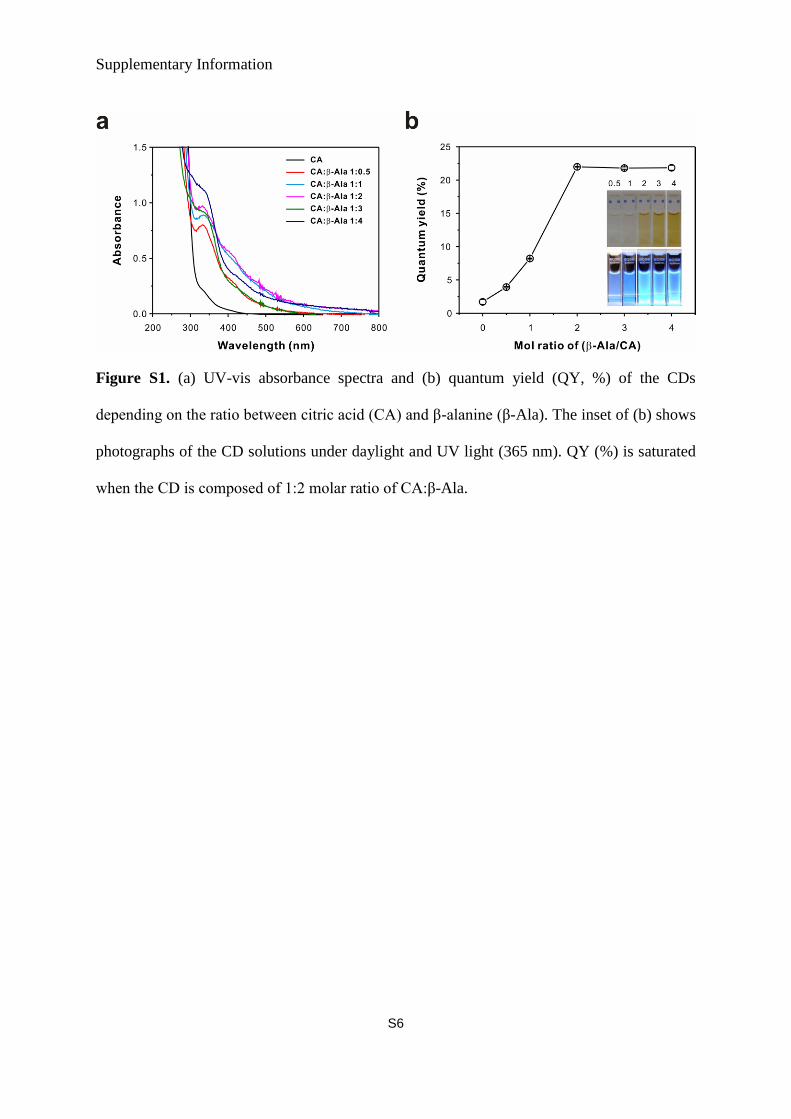
Figure S1. (a) UV-vis absorbance spectra and (b) quantum yield (QY, %) of the CDs
depending on the ratio between citric acid (CA) and β-alanine (β-Ala). The inset of (b) shows
photographs of the CD solutions under daylight and UV light (365 nm). QY (%) is saturated
when the CD is composed of 1:2 molar ratio of CA:β-Ala.
Supplementary Information
S7
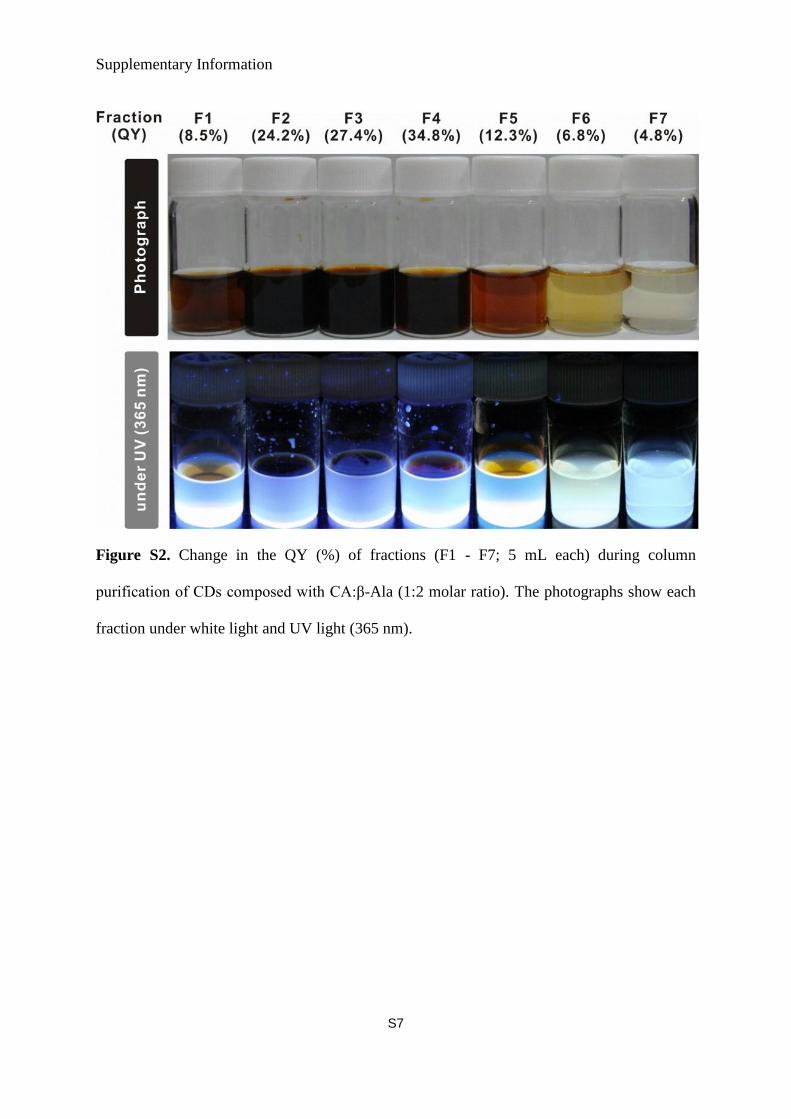
Figure S2. Change in the QY (%) of fractions (F1 - F7; 5 mL each) during column
purification of CDs composed with CA:β-Ala (1:2 molar ratio). The photographs show each
fraction under white light and UV light (365 nm).
Supplementary Information
S8
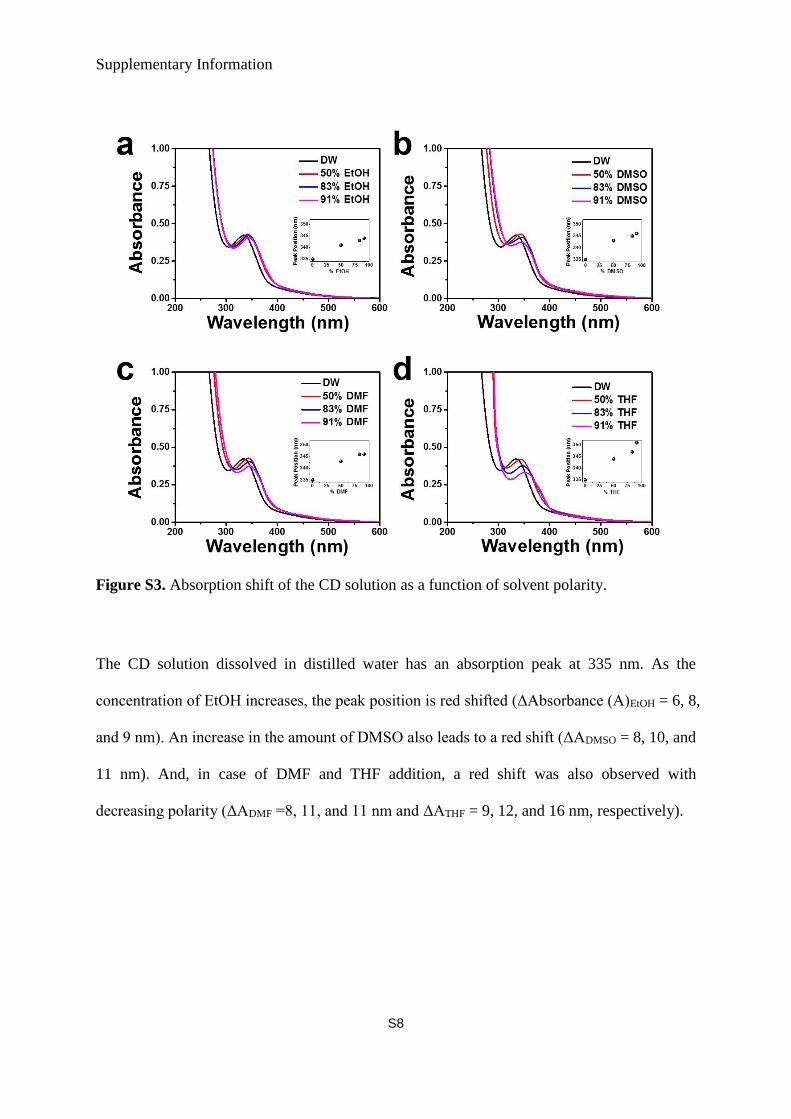
Figure S3. Absorption shift of the CD solution as a function of solvent polarity.
The CD solution dissolved in distilled water has an absorption peak at 335 nm. As the
concentration of EtOH increases, the peak position is red shifted (ΔAbsorbance (A)EtOH = 6, 8,
and 9 nm). An increase in the amount of DMSO also leads to a red shift (ΔADMSO = 8, 10, and
11 nm). And, in case of DMF and THF addition, a red shift was also observed with
decreasing polarity (ΔADMF =8, 11, and 11 nm and ΔATHF = 9, 12, and 16 nm, respectively).
Supplementary Information
S9
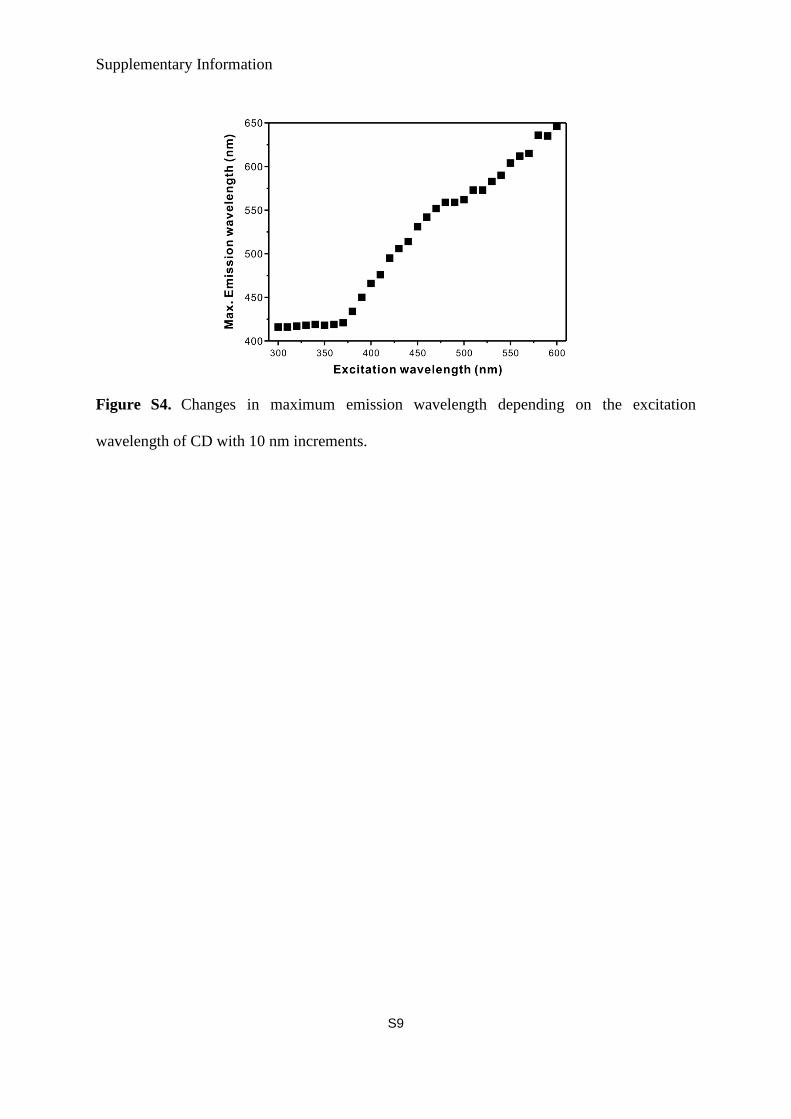
Figure S4. Changes in maximum emission wavelength depending on the excitation
wavelength of CD with 10 nm increments.
Supplementary Information
S10
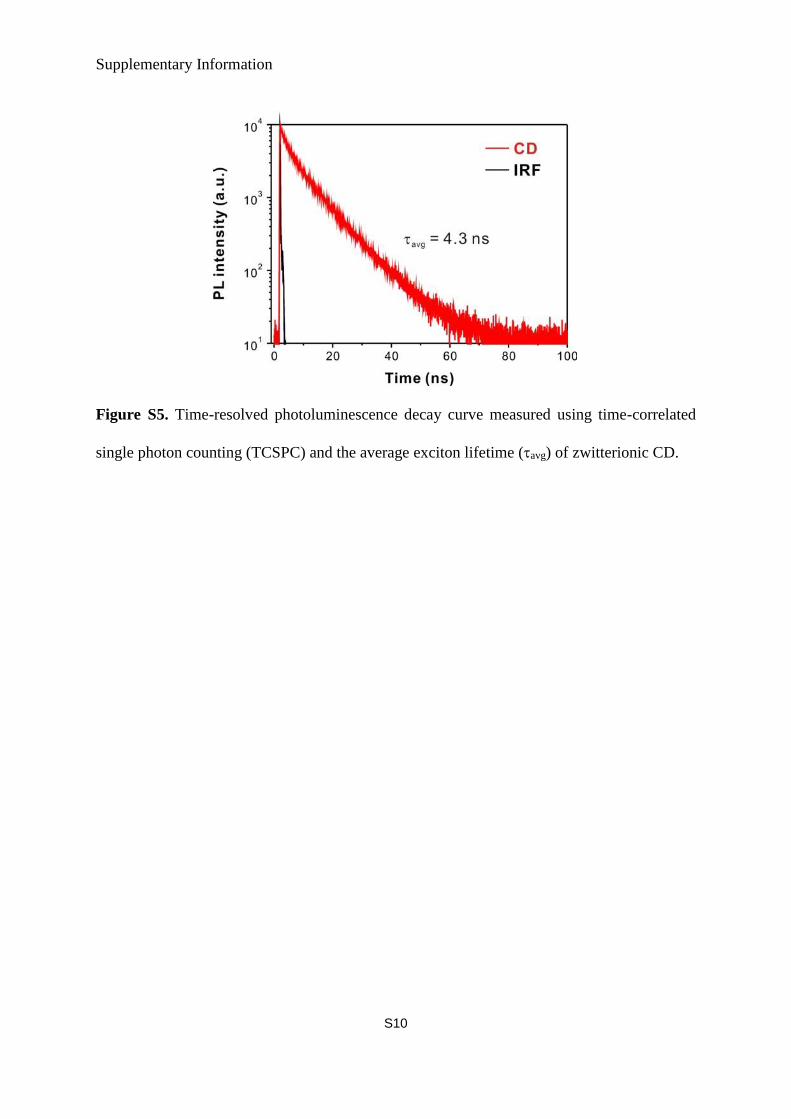
Figure S5. Time-resolved photoluminescence decay curve measured using time-correlated
single photon counting (TCSPC) and the average exciton lifetime (avg) of zwitterionic CD.
Supplementary Information
S11
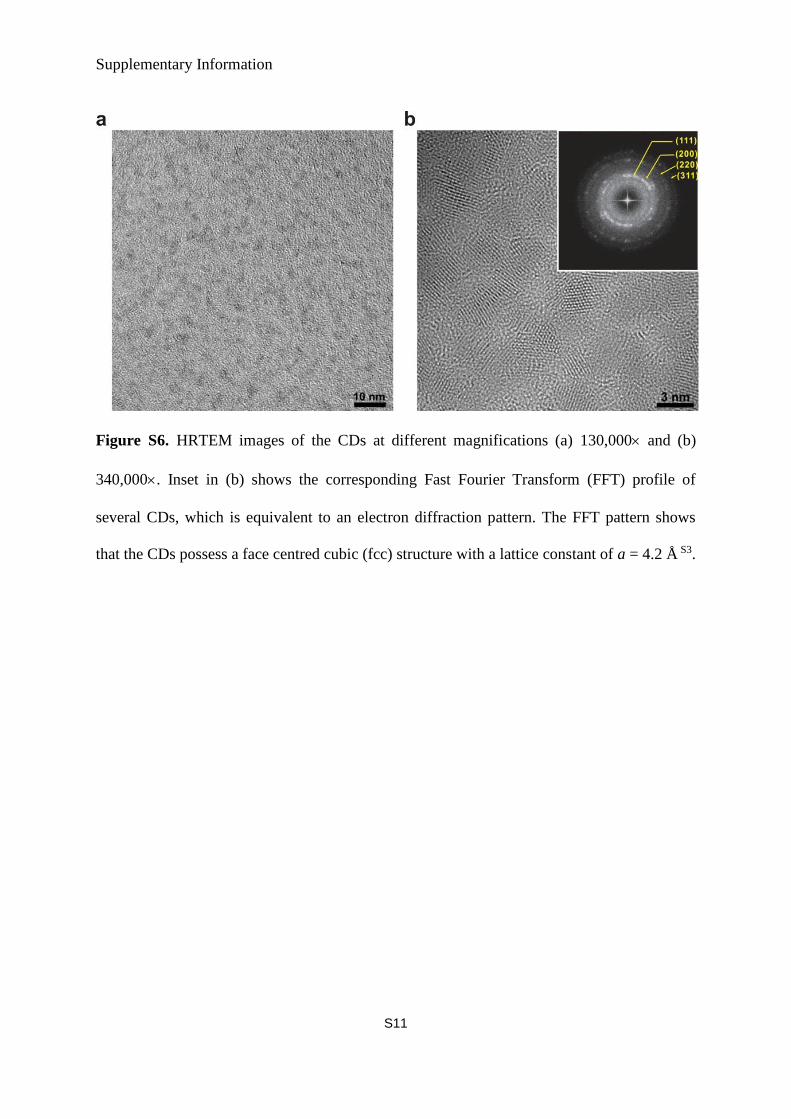
Figure S6. HRTEM images of the CDs at different magnifications (a) 130,000 and (b)
340,000. Inset in (b) shows the corresponding Fast Fourier Transform (FFT) profile of
several CDs, which is equivalent to an electron diffraction pattern. The FFT pattern shows
that the CDs possess a face centred cubic (fcc) structure with a lattice constant of a = 4.2 Å S3.
Supplementary Information
S12
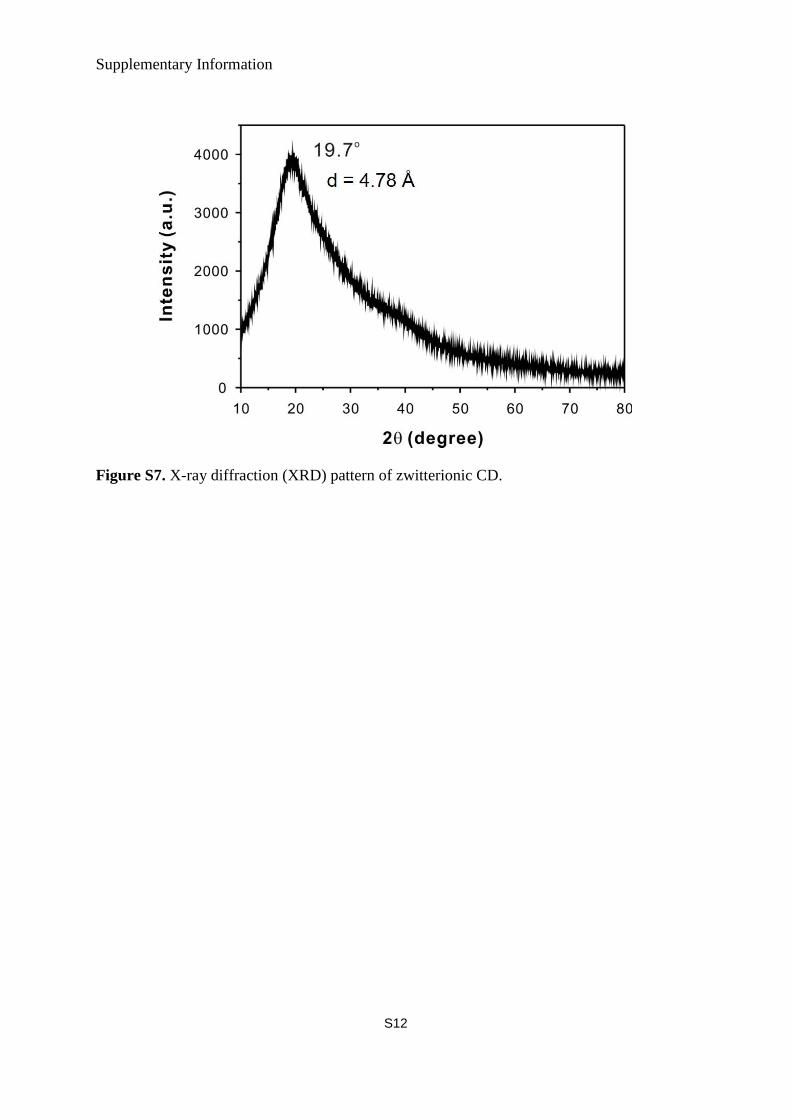
Figure S7. X-ray diffraction (XRD) pattern of zwitterionic CD.
Supplementary Information
S13
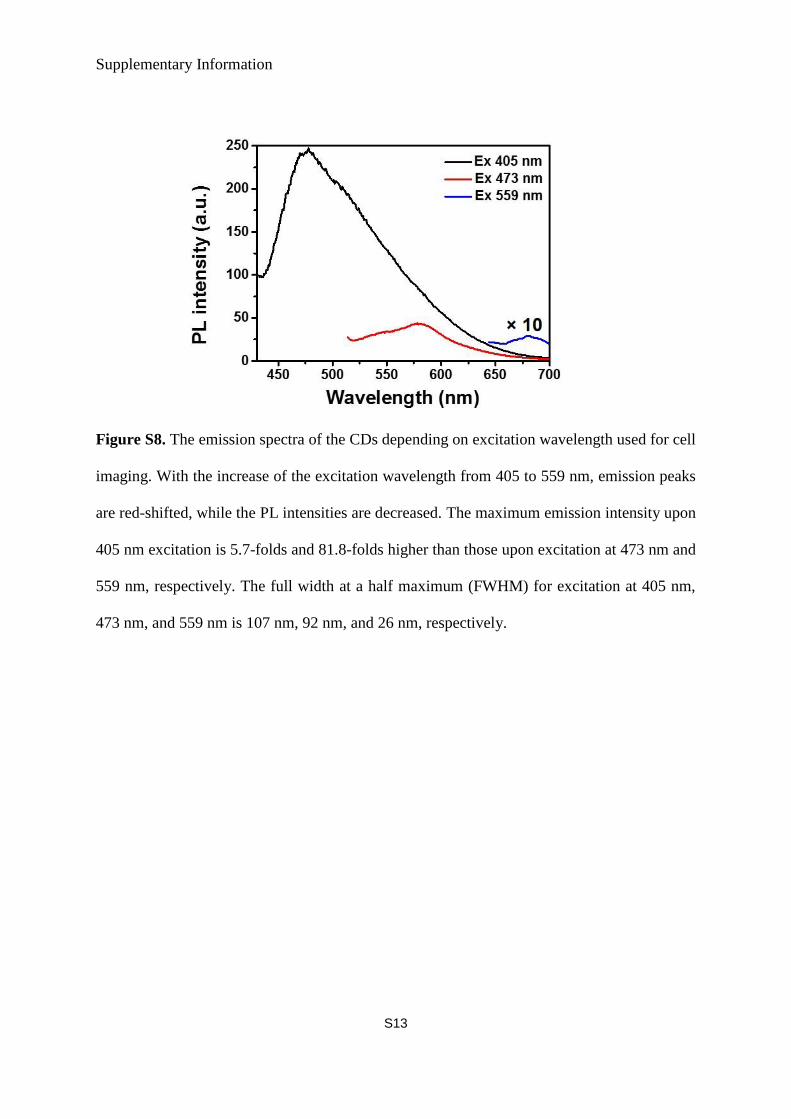
Figure S8. The emission spectra of the CDs depending on excitation wavelength used for cell
imaging. With the increase of the excitation wavelength from 405 to 559 nm, emission peaks
are red-shifted, while the PL intensities are decreased. The maximum emission intensity upon
405 nm excitation is 5.7-folds and 81.8-folds higher than those upon excitation at 473 nm and
559 nm, respectively. The full width at a half maximum (FWHM) for excitation at 405 nm,
473 nm, and 559 nm is 107 nm, 92 nm, and 26 nm, respectively.
Supplementary Information
S14
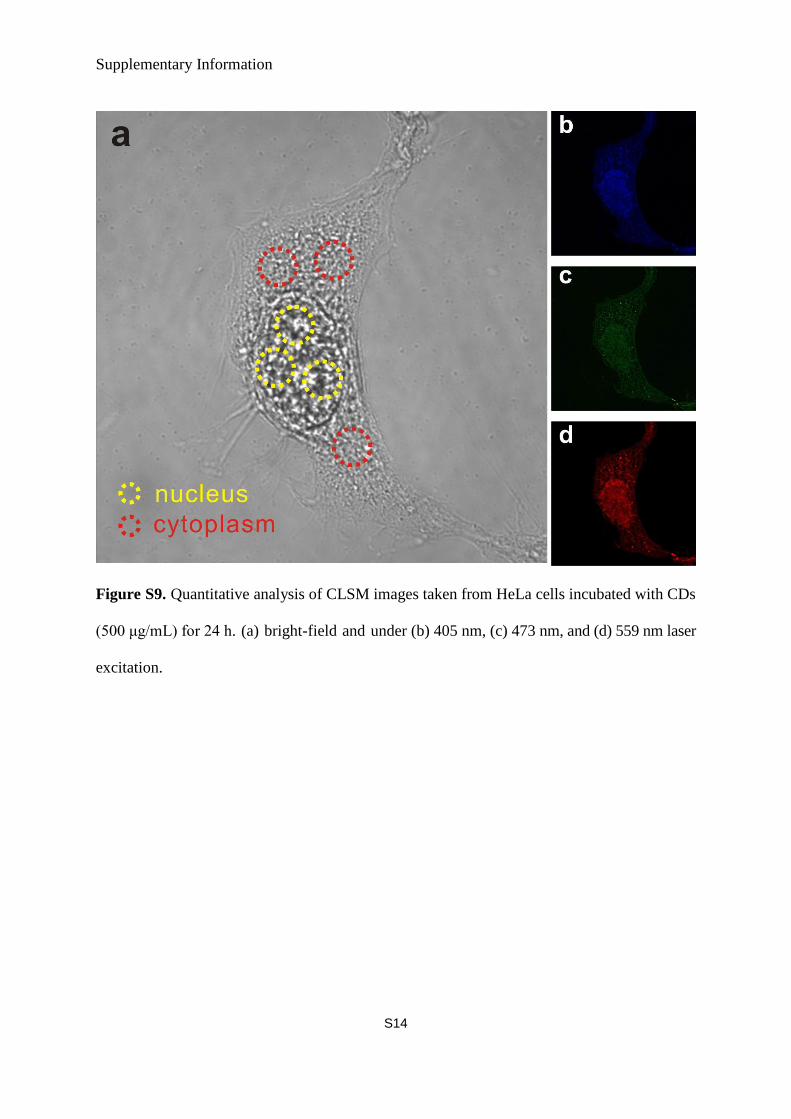
Figure S9. Quantitative analysis of CLSM images taken from HeLa cells incubated with CDs
(500 μg/mL) for 24 h. (a) bright-field and under (b) 405 nm, (c) 473 nm, and (d) 559 nm laser
excitation.
Supplementary Information
S15
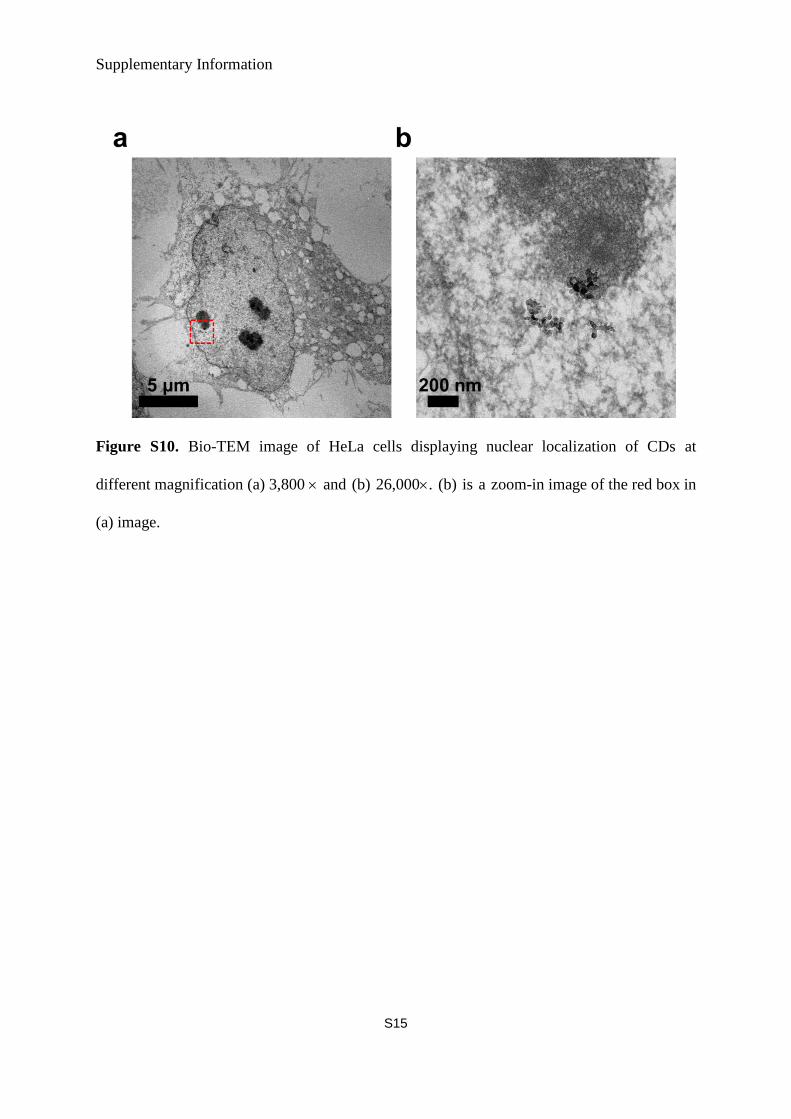
Figure S10. Bio-TEM image of HeLa cells displaying nuclear localization of CDs at
different magnification (a) 3,800 and (b) 26,000. (b) is a zoom-in image of the red box in
(a) image.
Supplementary Information
S16
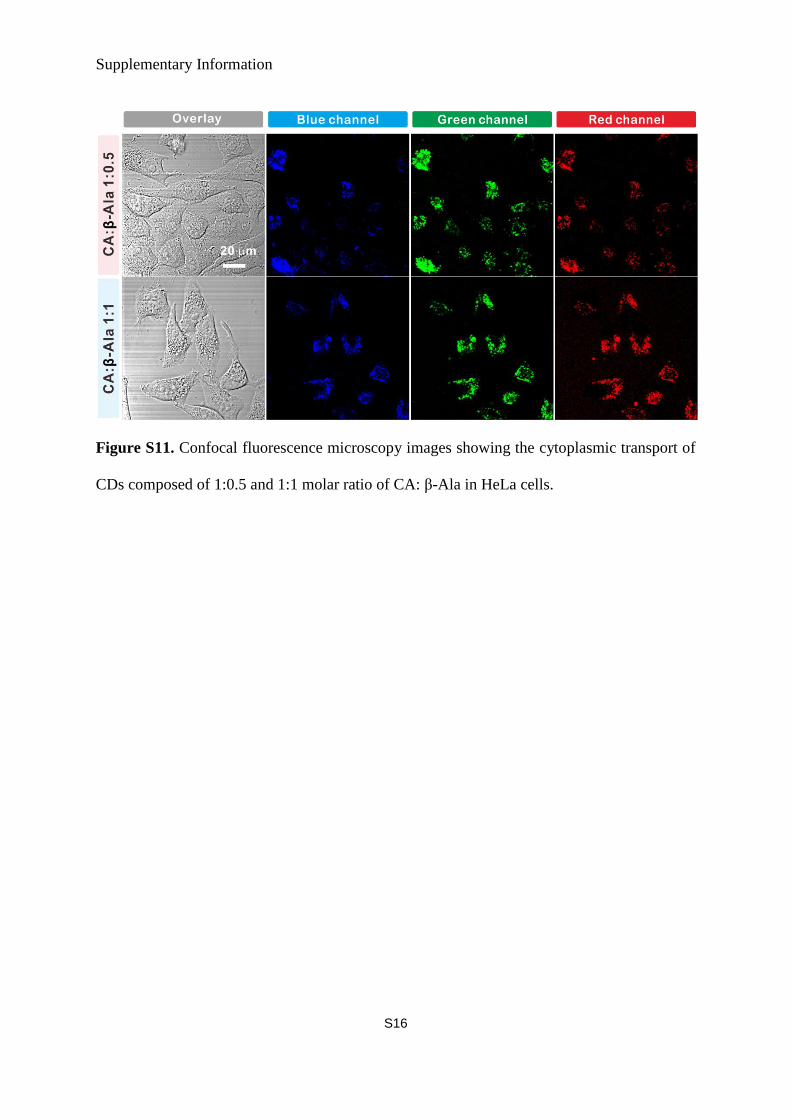
Figure S11. Confocal fluorescence microscopy images showing the cytoplasmic transport of
CDs composed of 1:0.5 and 1:1 molar ratio of CA: β-Ala in HeLa cells.
Supplementary Information
S17
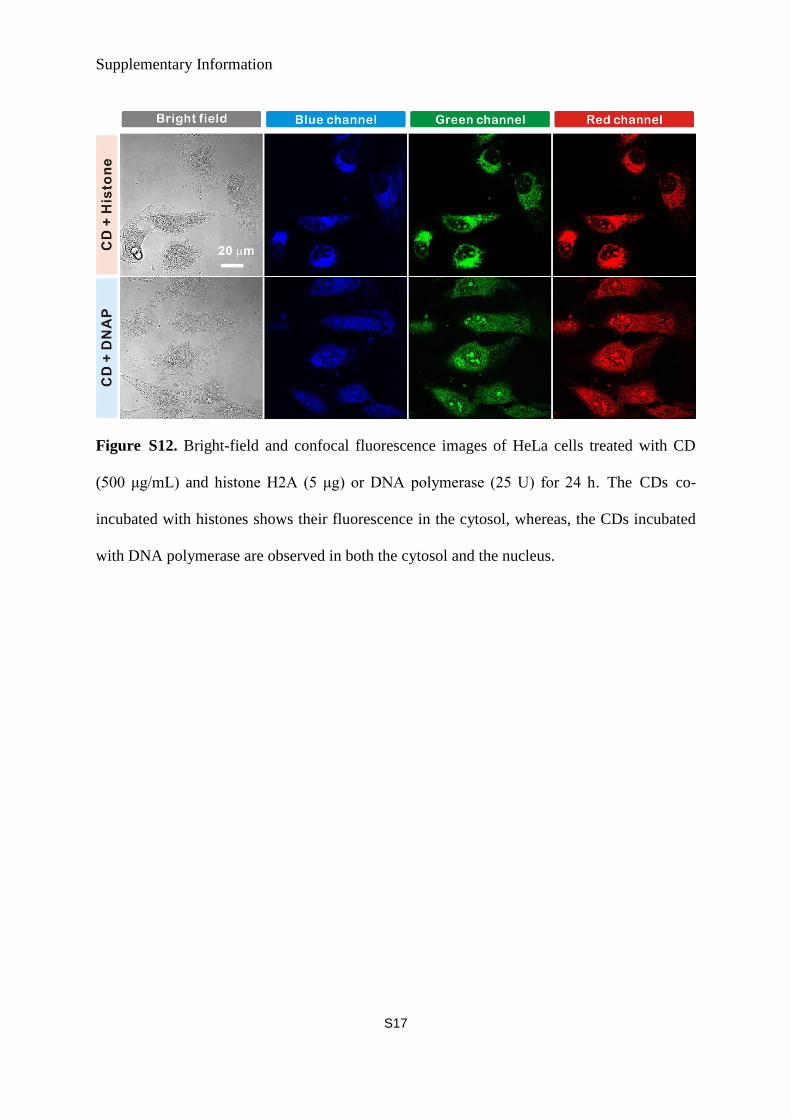
Figure S12. Bright-field and confocal fluorescence images of HeLa cells treated with CD
(500 μg/mL) and histone H2A (5 μg) or DNA polymerase (25 U) for 24 h. The CDs co-
incubated with histones shows their fluorescence in the cytosol, whereas, the CDs incubated
with DNA polymerase are observed in both the cytosol and the nucleus.
Supplementary Information
S18
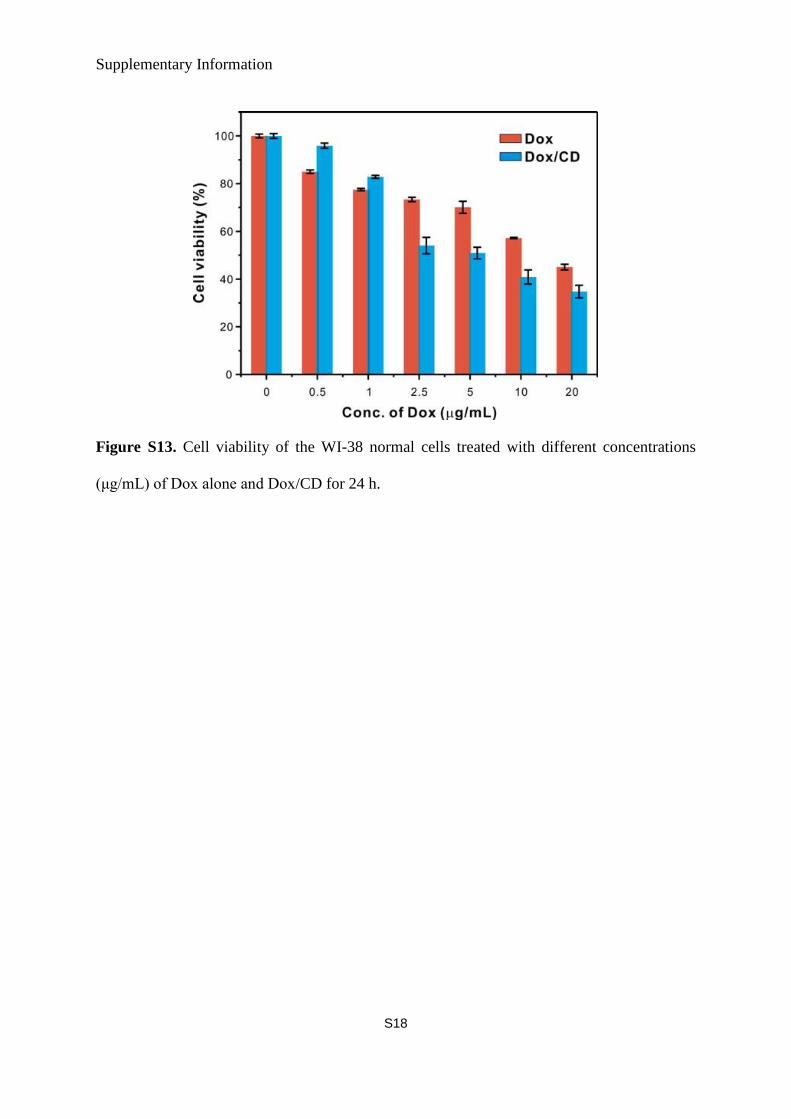
Figure S13. Cell viability of the WI-38 normal cells treated with different concentrations
(μg/mL) of Dox alone and Dox/CD for 24 h.