Embed Size (px)
Citation preview

A b s t r a c t. The present study reviews results of research on
the quantitative determination of cell structural parameters such as:
surface area, perimeter, Ferret's diameters, elongation, compac-
tion, for the parenchyma of potato tuber, taking into consideration
inner and outer core tissues. Tissue images were obtained for the
samples in their natural state without any preparation using an optic
confocal microscope. The quantitative analysis of the microscopic
image of the cross-sections of the cell's structure, was carried out
according to the method worked out by the present authors earlier.
Four potato varieties were chosen for the present experiment
(Danusia, Kuba, Mila, Triada), in three consecutive crop years in
the conditions selected (1999, 2000, 2001) and with a controlled
storage system. Our studies showed that the quantitative structure
described by means of cell size and shape parameters is a charac-
teristic feature of potato tuber tissues, outer and inner core, for a
given variety and harvest date. The size of cells changes, whereas
their shape is similar in each variety, type of core and harvest date.
K e y w o r d s: cell structural parameters, image analysis,
potato-tuber tissue, inner and outer core of potato-tuber paren-
chyma
INTRODUCTION
One of the basic physical properties characterising
study material is its structure which exerts a decisive in-
fluence on the remaining properties, i.e., physical, chemical
and biological. In the case of materials with high water
content, it is a cell structure with a high degree of com-
plexity. It shows features of a discreet medium with a
relatively high degree of discontinuity, stochastic and meta-
morphic (Fornal, 1998; Haman and Konstankiewicz, 2000;
Jackman and Stanley, 1995; Khan and Vincent, 1993). Such
materials are especially susceptible to various kinds of im-
pacts, e.g., mechanical, thermal, etc., and changes in its stru-
cture can cause a series of processes that may result in inner
damage and as a result in the lowering of its quality or
rotting. The above is true for various agricultural materials
(fruit, vegetables) as these are common phenomena well
known and described in literature presenting empirical
research (Brook, 1996; Dean, 1996; Hallett et al., 1992;
Harker and Hallett, 1994; Sanz et al., 1998).
Physical processes such as cracking on mechanical
impact or shrinking as a result of drying are all initiated at
cell level. They require in-depth knowledge of the structure
of plant tissue, i.e., location, shape and size of cells. Earlier
studies showed that, among other things, cell size influenced
tensile stress in their walls and cracking processes in the
whole structure. Larger cells are the first to be damaged and
the development of the cracking process depends on the
probability distribution of their sizes (Haman et al., 2000;
Konstankiewicz et al., 2001b; Konstankiewicz and Zdunek,
2000, 2001). A quantitative description of the cell structure
parameters becomes indispensable for the interpretation of
experimental data and also for working out theoretical
models of destruction in such media (Czachor and GóŸdŸ,
2001; Endy and Brent, 2001; Gao and Pitt, 1998; GóŸdŸ and
Pietrow, 1999; Haman and Konstankiewicz, 2000; Tomita,
2001).
The problem of a quantitative description of cell struc-
ture parameters is related to the choice of a suitable method
of obtaining structure image, preferably in a natural state
without preparation and registering and analysing the image
adjusted to the object analysed (Petran et al., 1995;
Konstankiewicz et al., 2001a).
In the present studies, a potato (Solanum tuberosum L.)
was selected as a master object as, on the one hand it has
relatively big cells with weak membranes so it is susceptible
to damage, and on the other hand, there was a need to solve
the practical problem of losses caused by decreasing
Int. Agrophysics, 2002, 16, 119-127
Cell structural parameters of potato tuber tissue**
K. Konstankiewicz*, H. Czachor, M. Gancarz, A. Król, K. Pawlak, and A. Zdunek
Institute of Agrophysics, Polish Academy of Sciences, Doœwiadczalna 4, P.O. Box 201, 20-290 Lublin 27, Poland
Received February 22, 2002; accepted March 25, 2002
© 2002 Institute of Agrophysics, Polish Academy of Sciences
*Corresponding author’s e-mail: [email protected]
**This work is supported by the State Committee for Scientific
Research, Poland under the Grant No. 5 P06F 01317.
IIINNNTTTEEERRRNNNAAATTTIIIOOONNNAAALLL
AAAgggrrroooppphhhyyysssiiicccsss
wwwwwwwww...iiipppaaannn...llluuubbbllliiinnn...ppplll///iiinnnttt---aaagggrrroooppphhhyyysssiiicccsss
production. Due to losses resulting from outer and inner
damage a considerable part of potato crops cannot be used
for industrial processing. It should be stressed that Poland
occupies one of the top positions in world potato production.
The potato is a popular component of our diet widely used as
fodder but it is not sufficiently utilised as a raw material for
industry (~1%). Modern processing requires raw materials
of high quality, homogeneity and a stable characteristics
fulfilling specified conditions for directed usage (Brook,
1996; Dean, 1996; Peters, 1996; Zgórska 1989; Zgórska et
al., 2000).
The aim of the present research was the description of
the plant tissue cell structure on the basis of its parameters
determined. In this study, results of research on the quanti-
tative determination of cell structure parameters such as:
surface area, perimeter, Ferret's diameters, elongation, com-
paction for the potato tuber parenchyma tissue taking into
consideration outer and inner core tissues are present. Stu-
dies were carried out on samples in a natural state without
any prior preparation using an optic confocal microscope. A
quantitative analysis of microscopic images of the flat
cross-sections of the cell structure was carried out according
to the method worked out earlier (Konstankiewicz et al.,
2001a). Four potato varieties in three consecutive years of
breeding in pre-determined conditions and controlled stora-
ge systems were chosen for the present experiment. The
present results are part of a wider programme on the mecha-
nical properties of the parenchyma tissue of the potato tuber,
and especially in conditions for the occurrence, detection
and recording of its inner cracking.
MATERIALS AND METHODS
Potato tuber samples
The materials studied were potato tubers (Solanum
tuberosum L.), of the Polish varieties selected: Danusia,
Kuba, Mila, and Triada, from three consecutive harvest
years: 1999, 2000, 2001 bred in the Department of Potato
Proces- sing and Storage of the Institute of Plant Breeding
and Acclimatisation in Jadwisin. All varieties with various
designations were bred in the same soil with identical fer-
tilisation and harvested at full crop maturity. On the basis of
detailed examinations of the yield obtained, it was found that
the highest content of dry mass and starch was observed in
var. Kuba, and the lowest in the tubers of var. Danusia,
whereas varieties Mila and Triada showed similar values of
both components both in the outer and inner core. The va-
rieties selected differed mainly in their susceptibility to da-
mage determined on the basis of an impact test: Mila and
Triada (edible) with a higher susceptibility to damage and
Danusia (edible) and Kuba (starch) with lower susceptibility
to damage, (Zgórska et al., 2000; Czerko, 2001).
Immediately after harvesting, the material studied was
stored in a controlled temperature (6°C) and a relative air
humidity (90-95%). Each of the varieties was represented by
tubers of a medium size without any visible outer damage.
Laboratory studies were carried out at a stable room tem-
perature (~ 20°C) and a relative air humidity (50-60%).
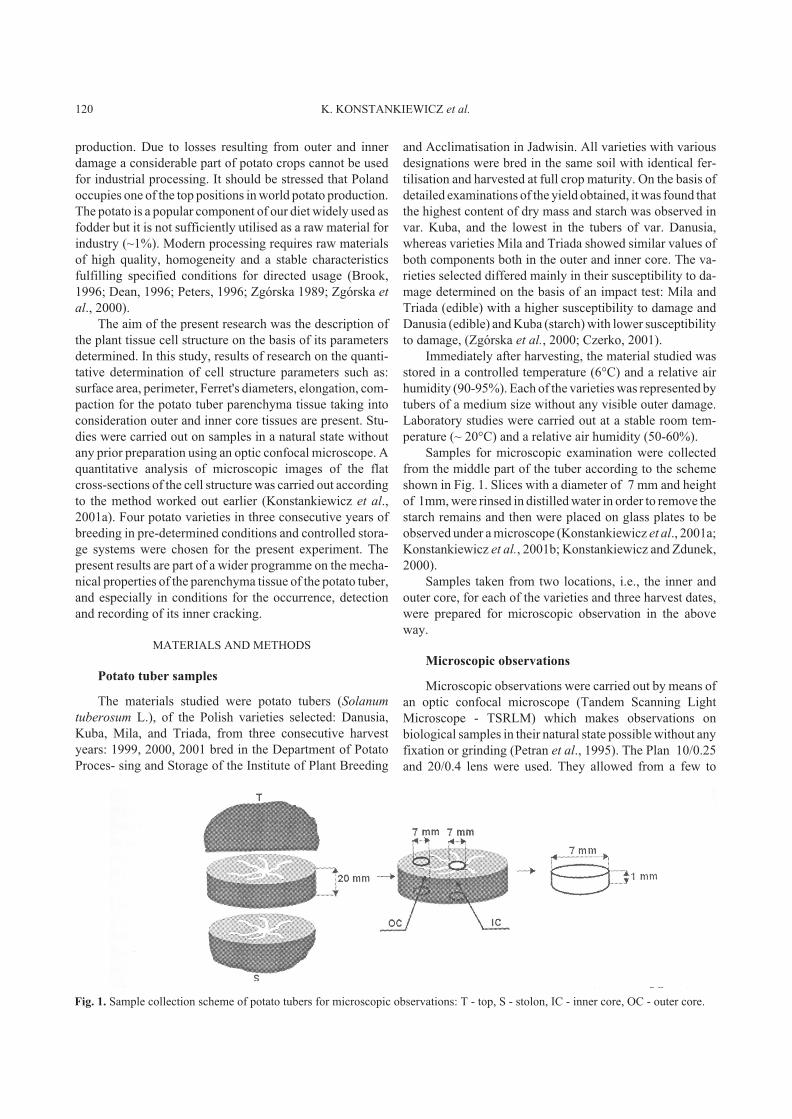
Samples for microscopic examination were collected
from the middle part of the tuber according to the scheme
shown in Fig. 1. Slices with a diameter of 7 mm and height
of 1mm, were rinsed in distilled water in order to remove the
starch remains and then were placed on glass plates to be
observed under a microscope (Konstankiewicz et al., 2001a;
Konstankiewicz et al., 2001b; Konstankiewicz and Zdunek,
2000).
Samples taken from two locations, i.e., the inner and
outer core, for each of the varieties and three harvest dates,
were prepared for microscopic observation in the above
way.
Microscopic observations
Microscopic observations were carried out by means of
an optic confocal microscope (Tandem Scanning Light
Microscope - TSRLM) which makes observations on
biological samples in their natural state possible without any
fixation or grinding (Petran et al., 1995). The Plan 10/0.25
and 20/0.4 lens were used. They allowed from a few to
120 K. KONSTANKIEWICZ et al.
Fig. 1. Sample collection scheme of potato tubers for microscopic observations: T - top, S - stolon, IC - inner core, OC - outer core.

several cross-sections of full cells in one image to be
obtained.
A precision continuous shift of the object in the x-y
plane made possible a full observation (~20 images) of one
sample in a few minutes, which in a stable ambient
temperature (~20°C ) and relative air humidity (50-60%) did
not cause it to dry. In each measuring series, for each sample,
a few non-overlapping images were chosen to obtain several
tens of full cells in one repletion.
Examples of the images of the parenchyma cell struc-
ture of potato tubers subjected to analysis were shown in
Figs 2 and 3, for the inner and outer core, respectively. The
images show clear contours of cell walls. However, there are
also regions visible as light spots coming from the surface of
cell membranes or the remnants of liquids in the bottom of
the cell. Hence, the images obtained cannot be subjected to
direct automatic computer analysis.
Image analysis
The quantitative analysis of the microscopic image of
the cross-sections of the cell's structure, was carried out
according to the method worked out by the present authors
earlier (Konstankiewicz et al., 2001a). The analysis of
microscopic images is time consuming but it allows the
unique separation of the cell walls. Each image was manual-
ly prepared by the outlining of the visible cell walls. A few
observers carried out independent parallel outlining which
allowed the elimination of subjective mistakes and obtained
repeatedly good results. A structural skeleton in the form of
a net of polygons formed from the sections joining the
visible knots of the cell walls was viewed on the background
of a microscopic image. A knot was identified as the con-
necting point for at least three cell walls (Figs 4 and 5). The
binary skeletons of the microscopic images thus obtained
were then subjected to computer analysis in order to deter-
mine their structural parameters.
Image analysis determined the parameters related to the
size of each cell, i.e., surface area - A, perimeter - P, Ferret's
diameters, maximum - Fmax and minimum - Fmin , and cell
shape, i.e., ratio of Ferret's diameters - Fmin / Fmax, elonga-
tion - E (ratio between the difference of the maximum and
minimum ellipse diameter inscribed into a cell up to the sum
of these diameters), compaction - C (ratio between 16 � the
surface and the square of cell elongation), (Konstankiewicz
et al., 2001) possible.
Calculation of results - surface areas, perimeter and
diameters - obtained in pixels for the units of their lengths
was immediately done on the basis of a scale obtained by the
carrying out of an analogue analysis of an object with known
flat dimensions. The statistical analysis and distribution of
the measured values was carried out with Excel software.
RESULTS AND DISCUSSION
Microscopic observations and image analysis was
carried out for the parenchyma tissue of the potato tuber:
four varieties - Danusia, Kuba, Mila, and Triada, inner and
out core and three consecutive years of crop: 1999, 2001,
2002. Five repetitions were made for each measuring series.
In total, 1553 photos of microscopic images of cross-section
of the potato tuber cell structure in a natural state were
obtained. Examples of microscopic images of the structures
studied were shown in Figs 2 and 3.
A skeleton of a cell structure on the background of a
microscopic image prepared for the quantitative parameter
analysis has been shown in Figs 4 and 5. The images are
adjoining polygons most often hexagon and pentagon and
various sizes. Structural parameters such as: surface area A,
perimeter P, Ferret's diameters Fmax and Fmin , elongation E
and compaction C were determined for each of the cells se-
parated. The amount of cells in individual varieties, types of
core and years has been shown in Table 1. In the first year of
CELL STRUCTURE OF POTATO TUBER TISSUE 121
Fig. 2. Microscopic image of potato tuber tissue var. Kuba (2001) -
outer core - lens Plan 20/0.4).
Fig. 3. Microscopic image of potato tuber tissue var. Kuba (2001) -
inner core - lens Plan 20/0.4).

study, the above numbers were the highest due to the confir-
mation of the repetitiveness of the results obtained by a few
researchers. The repetitiveness obtained was high and hen-
ce, in the following years, the number of cells subjected to
measurements decreased. At such a high number of trials it
was possible to compare the mean values of parameters
measured which together with standard deviation were
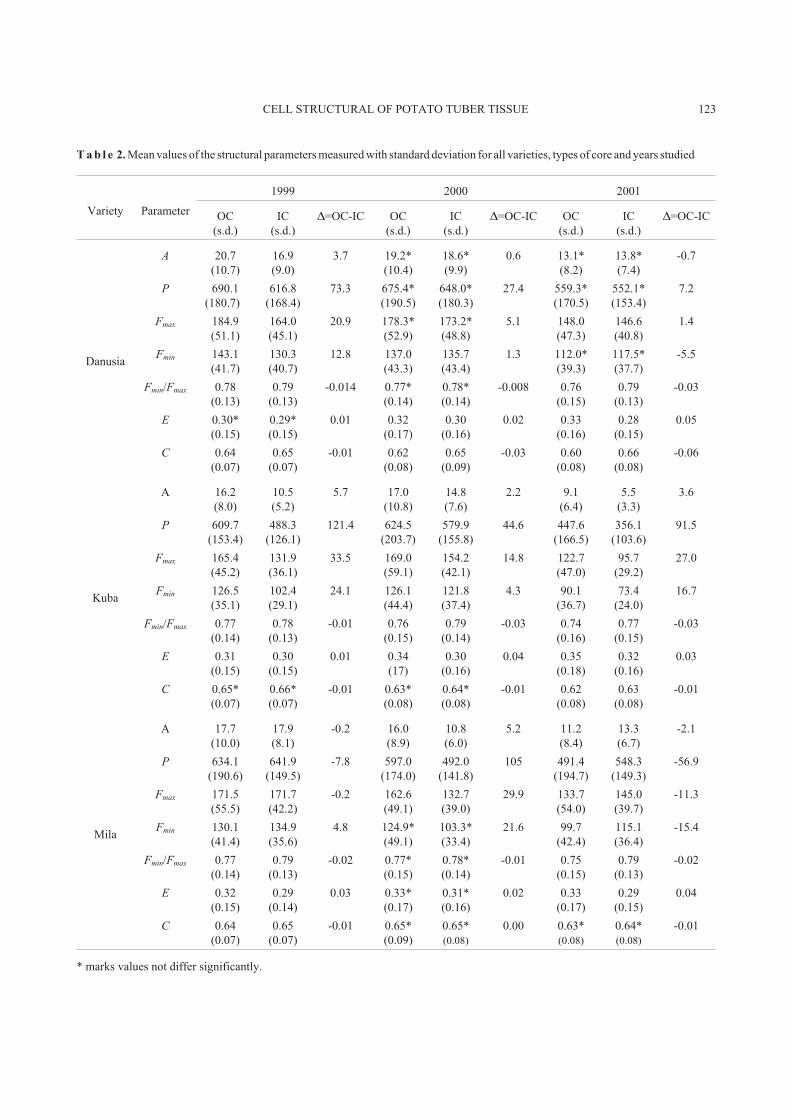
given in Table 2. For all the results obtained, a � compa-
tibility Ko³mogorow - Smirnow's test was carried out at the
significance level � = 0.05 and the cases for which the values
determined are not differ significantly were marked in the
table.
The results obtained showed that the cell structure of the
parenchyma of potato varieties studied is not homogenous.
There were differences in the structure parameters for the
inner and outer core of each variety studied and for all three
harvest years. Generally speaking the inner core is made of
smaller cells than is the outer core. Cells with the highest
surface area, i.e., 20.7 � 103
�m2
(1999) and 19.2 � 103
�m2
(2000), and the perimeter of 690.1 �m (1999) and 675.4 �m
(2000) were found in the outer core of var. Danusia, whereas
the lowest values of the surface area, i.e., 10.5 � 103
�m2
(1999) and 5.5 � 103
�m2
(2001), and perimeter of 488.3 �m
(1999) and 447.6 �m (2001) were observed in the inner core
of var. Kuba. Only for var. Mila were there cases in which
their outer core was made of cells with smaller surface areas,
i.e., 17.7 � 103
�m2
(1999) and 11.2 � 103
�m2
(2001), and
the perimeter of 634.1 �m (1999) and 491.4 �m (2001) than
the cells of the outer core, i.e.: 17.9 � 103
�m2
(1999) and
13.3 � 103
�m2
(2001) and 641.9 �m (1999) and 548.3 �m
(2001), respectively. On the other hand in tubers of var.
Danusia from the 2000 and 2001 harvests, no significant
differences in the size distribution of the inner and outer core
were observed.
The structure parameters: ratio between Ferret's diame-
ters, elongation and compaction, showed that no matter what
the size was, all cells were of a similar shape. Elongation
parameters - E, were ranged from 0.30 to 0.35 for the outer
core and from 0.27 to 0.33 for the inner core for all varieties
and harvest years studied. On the other hand, the C content
for all cell measured ranges from 0.62 to 0.66. All cells were
of a similar shape intermediating between a circle and a
flattened ellipse with a similar ratio of Ferret's diameters
Fmin / Fmax, which changed from 0.74 to 0.80.
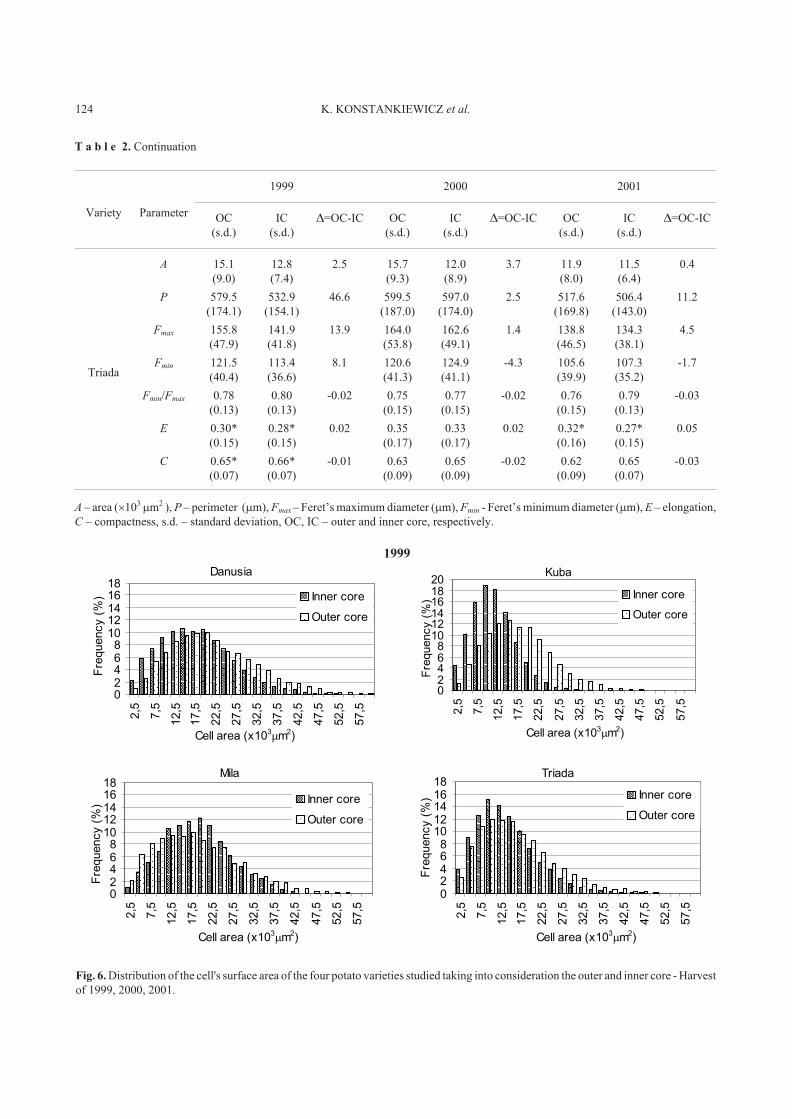
The greatest changes were observed in the structure
parameters related to the cell size, i.e.: surface area - A and
perimeter - P. Further images (Fig. 6) show surface area
122 K. KONSTANKIEWICZ et al.
Fig. 4. Microscopic image of potato tuber tissue with the skeleton
of the cell structure marked, var. Kuba (2001) - inner core - lens
Plan 20/0.4).
Fig. 5. Images with cells for the quantitative analysis of structure
parameters separated.
Variety
Year
1999 2000 2001
NIC NOC NIC NOC NIC NOC
Danusia 3718 4553 475 414 452 483
Kuba 4438 4911 707 602 1375 741
Mila 3676 3348 902 574 527 598
Triada 8069 5509 933 533 500 563
NOC - number of cells of the outer core, NIC - number of cells of the inner core.
T a b l e 1. Number of cells collected for quantitative analysis from individual varieties, type of core and years
CELL STRUCTURAL OF POTATO TUBER TISSUE 123
Variety Parameter
1999 2000 2001
OC
(s.d.)
IC
(s.d.)
�=OC-IC OC
(s.d.)
IC
(s.d.)
�=OC-IC OC
(s.d.)
IC
(s.d.)
�=OC-IC
Danusia
A
P
Fmax
Fmin
Fmin/Fmax
E
C
20.7
(10.7)
690.1
(180.7)
184.9
(51.1)
143.1
(41.7)
0.78
(0.13)
0.30*
(0.15)
0.64
(0.07)
16.9
(9.0)
616.8
(168.4)
164.0
(45.1)
130.3
(40.7)
0.79
(0.13)
0.29*
(0.15)
0.65
(0.07)
3.7
73.3
20.9
12.8
-0.014
0.01
-0.01
19.2*
(10.4)
675.4*
(190.5)
178.3*
(52.9)
137.0
(43.3)
0.77*
(0.14)
0.32
(0.17)
0.62
(0.08)
18.6*
(9.9)
648.0*
(180.3)
173.2*
(48.8)
135.7
(43.4)
0.78*
(0.14)
0.30
(0.16)
0.65
(0.09)
0.6
27.4
5.1
1.3
-0.008
0.02
-0.03
13.1*
(8.2)
559.3*
(170.5)
148.0
(47.3)
112.0*
(39.3)
0.76
(0.15)
0.33
(0.16)
0.60
(0.08)
13.8*
(7.4)
552.1*
(153.4)
146.6
(40.8)
117.5*
(37.7)
0.79
(0.13)
0.28
(0.15)
0.66
(0.08)
-0.7
7.2
1.4
-5.5
-0.03
0.05
-0.06
Kuba
A
P
Fmax
Fmin
Fmin/Fmax
E
C
16.2
(8.0)
609.7
(153.4)
165.4
(45.2)
126.5
(35.1)
0.77
(0.14)
0.31
(0.15)
0.65*
(0.07)
10.5
(5.2)
488.3
(126.1)
131.9
(36.1)
102.4
(29.1)
0.78
(0.13)
0.30
(0.15)
0.66*
(0.07)
5.7
121.4
33.5
24.1
-0.01
0.01
-0.01
17.0
(10.8)
624.5
(203.7)
169.0
(59.1)
126.1
(44.4)
0.76
(0.15)
0.34
(17)
0.63*
(0.08)
14.8
(7.6)
579.9
(155.8)
154.2
(42.1)
121.8
(37.4)
0.79
(0.14)
0.30
(0.16)
0.64*
(0.08)
2.2
44.6
14.8
4.3
-0.03
0.04
-0.01
9.1
(6.4)
447.6
(166.5)
122.7
(47.0)
90.1
(36.7)
0.74
(0.16)
0.35
(0.18)
0.62
(0.08)
5.5
(3.3)
356.1
(103.6)
95.7
(29.2)
73.4
(24.0)
0.77
(0.15)
0.32
(0.16)
0.63
(0.08)
3.6
91.5
27.0
16.7
-0.03
0.03
-0.01
Mila
A
P
Fmax
Fmin
Fmin/Fmax
E
C
17.7
(10.0)
634.1
(190.6)
171.5
(55.5)
130.1
(41.4)
0.77
(0.14)
0.32
(0.15)
0.64
(0.07)
17.9
(8.1)
641.9
(149.5)
171.7
(42.2)
134.9
(35.6)
0.79
(0.13)
0.29
(0.14)
0.65
(0.07)
-0.2
-7.8
-0.2
4.8
-0.02
0.03
-0.01
16.0
(8.9)
597.0
(174.0)
162.6
(49.1)
124.9*
(49.1)
0.77*
(0.15)
0.33*
(0.17)
0.65*
(0.09)
10.8
(6.0)
492.0
(141.8)
132.7
(39.0)
103.3*
(33.4)
0.78*
(0.14)
0.31*
(0.16)
0.65*
(0.08)
5.2
105
29.9
21.6
-0.01
0.02
0.00
11.2
(8.4)
491.4
(194.7)
133.7
(54.0)
99.7
(42.4)
0.75
(0.15)
0.33
(0.17)
0.63*
(0.08)
13.3
(6.7)
548.3
(149.3)
145.0
(39.7)
115.1
(36.4)
0.79
(0.13)
0.29
(0.15)
0.64*
(0.08)
-2.1
-56.9
-11.3
-15.4
-0.02
0.04
-0.01
* marks values not differ significantly.
T a b l e 2. Mean values of the structural parameters measured with standard deviation for all varieties, types of core and years studied
124 K. KONSTANKIEWICZ et al.
Variety Parameter
1999 2000 2001
OC
(s.d.)
IC
(s.d.)
�=OC-IC OC
(s.d.)
IC
(s.d.)
�=OC-IC OC
(s.d.)
IC
(s.d.)
�=OC-IC
Triada
A
P
Fmax
Fmin
Fmin/Fmax
E
C
15.1
(9.0)
579.5
(174.1)
155.8
(47.9)
121.5
(40.4)
0.78
(0.13)
0.30*
(0.15)
0.65*
(0.07)
12.8
(7.4)
532.9
(154.1)
141.9
(41.8)
113.4
(36.6)
0.80
(0.13)
0.28*
(0.15)
0.66*
(0.07)
2.5
46.6
13.9
8.1
-0.02
0.02
-0.01
15.7
(9.3)
599.5
(187.0)
164.0
(53.8)
120.6
(41.3)
0.75
(0.15)
0.35
(0.17)
0.63
(0.09)
12.0
(8.9)
597.0
(174.0)
162.6
(49.1)
124.9
(41.1)
0.77
(0.15)
0.33
(0.17)
0.65
(0.09)
3.7
2.5
1.4
-4.3
-0.02
0.02
-0.02
11.9
(8.0)
517.6
(169.8)
138.8
(46.5)
105.6
(39.9)
0.76
(0.15)
0.32*
(0.16)
0.62
(0.09)
11.5
(6.4)
506.4
(143.0)
134.3
(38.1)
107.3
(35.2)
0.79
(0.13)
0.27*
(0.15)
0.65
(0.07)
0.4
11.2
4.5
-1.7
-0.03
0.05
-0.03
A – area (�103�m2 ), P – perimeter (�m), Fmax – Feret’s maximum diameter (�m), Fmin - Feret’s minimum diameter (�m), E – elongation,
C – compactness, s.d. – standard deviation, OC, IC – outer and inner core, respectively.
T a b l e 2. Continuation
Danusia
02468
1012141618
2,5
7,5
12,5
17,5
22,5
27,5
32,5
37,5
42,5
47,5
52,5
57,5
Cell area (x103�m2)
Fre
quency
(%) Inner core
Outer core
Kuba
02468
101214161820
2,5
7,5
12,5
17,5
22,5
27,5
32,5
37,5
42,5
47,5
52,5
57,5
Cell area (x103�m2)
Fre
quency
(%) Inner core
Outer core
Mila
02468
1012141618
2,5
7,5
12,5
17,5
22,5
27,5
32,5
37,5
42,5
47,5
52,5
57,5
Cell area (x103�m2)
Fre
quency
(%) Inner core
Outer core
Triada
02468
1012141618
2,5
7,5
12,5
17,5
22,5
27,5
32,5
37,5
42,5
47,5
52,5
57,5
Cell area (x103�m2)
Fre
quency
(%) Inner core
Outer core
1999
Fig. 6. Distribution of the cell's surface area of the four potato varieties studied taking into consideration the outer and inner core - Harvest
of 1999, 2000, 2001.
CELL STRUCTURAL OF POTATO TUBER TISSUE 125
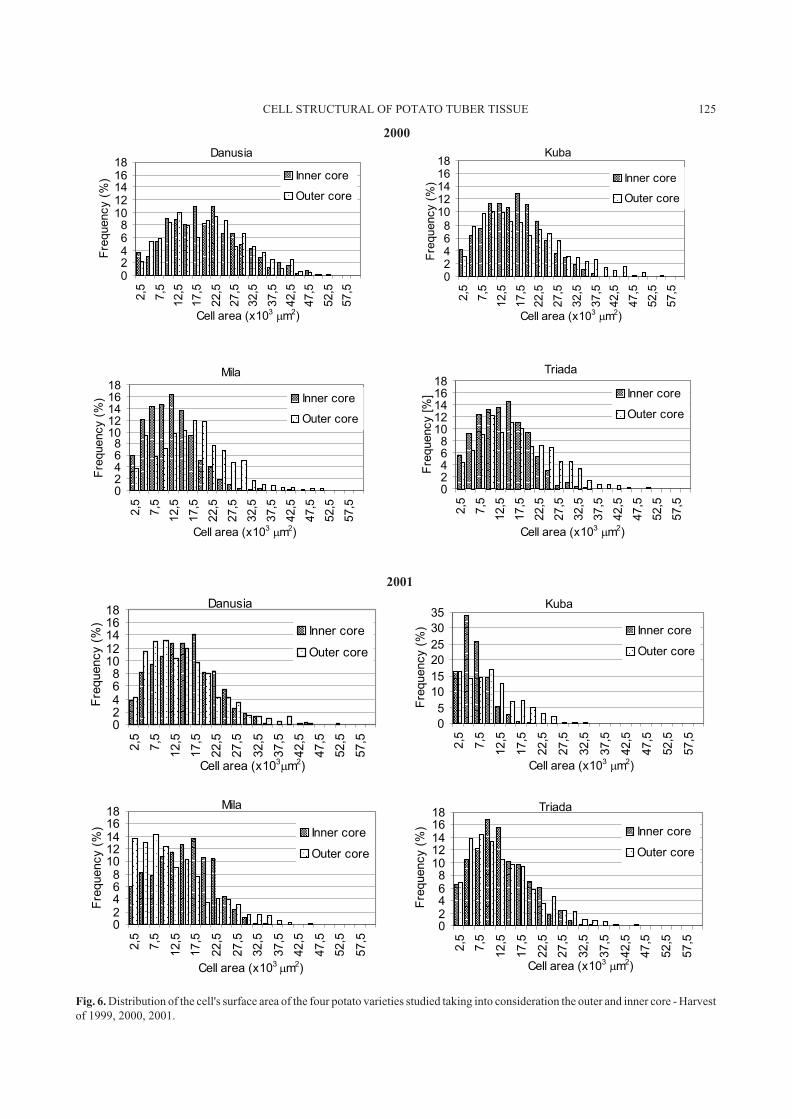
Fig. 6. Distribution of the cell's surface area of the four potato varieties studied taking into consideration the outer and inner core - Harvest
of 1999, 2000, 2001.
Danusia
02468
1012141618
2,5
7,5
12,5
17,5
22,5
27,5
32,5
37,5
42,5
47,5
52,5
57,5
Cell area (x103�m2)
Fre
quency
(%) Inner core
Outer core
Kuba
02468
1012141618
2,5
7,5
12,5
17,5
22,5
27,5
32,5
37,5
42,5
47,5
52,5
57,5
Cell area (x103�m2)
Fre
quency
(%) Inner core
Outer core
Mila
02468
1012141618
2,5
7,5
12,5
17,5
22,5
27,5
32,5
37,5
42,5
47,5
52,5
57,5
Cell area (x103�m2)
Fre
quency
(%) Inner core
Outer core
Triada
02468
1012141618
2,5
7,5
12,5
17,5
22,5
27,5
32,5
37,5
42,5
47,5
52,5
57,5
Cell area (x103�m2)
Fre
quency
[%] Inner core
Outer core
Danusia
02468
1012141618
2,5
7,5
12,5
17,5
22,5
27,5
32,5
37,5
42,5
47,5
52,5
57,5
Cell area (x103�m2)
Fre
quency
(%)
Inner core
Outer core
Kuba
0
5
10
15
20
25
30
35
2,5
7,5
12,5
17,5
22,5
27,5
32,5
37,5
42,5
47,5
52,5
57,5
Cell area (x103�m2)
Fre
quency
(%) Inner core
Outer core
Mila
02468
1012141618
2,5
7,5
12,5
17,5
22,5
27,5
32,5
37,5
42,5
47,5
52,5
57,5
Cell area (x103�m2)
Fre
quency
(%) Inner core
Outer core
Triada
02468
1012141618
2,5
7,5
12,5
17,5
22,5
27,5
32,5
37,5
42,5
47,5
52,5
57,5
Cell area (x103�m2)
Fre
quency
(%) Inner core
Outer core
2000
2001

distribution for all four varieties and three harvest years with
values for the inner and outer core marked. The widest
distribution range covering most intervals of size classes
was observed for var. Danusia (1999), and var. Kuba (2001)
showed the highest homogeneity of the structure even
though for the small size intervals (5-7.5) � 103
�m2
and
(7.5-10) � 103
�m2
a significant increase in the number of
cells in the area of the inner core. All diagrams show a higher
contribution of the outer core cells in intervals with higher
values. Whereas for the inner core there were more cells in
intervals with lower values. The numerical values of cell
contributions in individual classes were not stable either for
individual varieties or harvest years. The lack of structural
homogeneity occurs in the area of both types of tissue
studied and cells with similar sizes occurred in both areas,
there was no sharp border between them.
CONCLUSIONS
The studies on the quantitative determination of struc-
tural parameters of the parenchyma tissues of potato tubers:
four varieties, two types of core and three harvest years,
showed that:
1. The quantitative structure described by means of size
and shape parameters is a characteristic feature for inner and
outer tissue of the potato tubers studied in a given variety and
harvest date.
2. Structural parameters related to cell size change for
each variety and type of parenchyma of potato tubers, i.e.,
outer or inner core, and harvest date.
3. Structural parameters related to the cell shape pre-
serve similar and constant values for all varieties, types of
core and harvest dates.
4. Size distribution of cell surface areas show individual
features in the varieties studied, type of core and harvest
dates considered.
The results obtained for potato tubers despite identical
breeding and storage conditions, showed that the structure
of parenchyma tissue, both in the outer and inner cores, is
neither homogenous nor stable. To characterise it and use it
correctly in other research programmes, requires the quanti-
tative determination of its structural parameters, especially
those related to cell size in each individual case.
ACKNOWLEDGMENTS
The authors are indebted to Prof. Kazimiera Zgórska,
Dr. Zbigniew Czerko and Dr. Anna Frydecka-Mazurczyk
from the Institute of Plant Breeding and Acclimatisation,
Department of Potato Storage and Processing in Jadwisin
for supplying the potatoes.
REFERENCES
Czachor H. M. and GóŸdŸ A., 2001. Modelling of granular
and cellular materials. Transaction of the ASAE., 44(2),
439- 445.
Dean B., 1996. The chemical nature of blackspot bruising.
Potato Bruising; How and Why; Emphasizing Blackspot
Bruise. Ed. R.C. Brook, Haslett, MI: Running Water
Publishing.
Endy D. and Brent R., 2001. Modelling cellular behaviour.
Nature, 409, 391-395.
Fornal J., 1998. The changes in plant material microstructure
during processing. Pol. J. Food Nutr. Sci., 7/48, 3(S),
9-23.
Gao Q. and Pitt R.E., 1991. Mechanics of parenchyma tissue ba-
sed on cell orientation and microstructure. Transaction of the
ASAE, 34(1), 232-238.
GóŸdŸ A. and Pietrow M., 1999. A ‘quantum mechanics’ ap-
proach to the granular and cellular media. Int. Agrophysics,
13, 185-190.
Hallett I.C., Mac Rae E.A., and Wêgrzyn T.F., 1992. Changes in
kiwi-fruit cell wall ultra structure and cell packing during
post harvest ripening. Int. J. Plant Sci., 153, 49-62.
Haman J. and Konstankiewicz K., 2000. Destruction processes
in the cellular medium of a plant-theoretical approach. Int.
Agrophysics, 14, 37-42.
Haman J., Konstankiewicz K., and Zdunek A., 2000. Influence
of water potential on the failure of potato tissue. Int.
Agrophysics, 14, 181-186.
Harker F.R. and Hallett I.C., 1994. Physiological and mecha-
nical properties of kiwi-fruit tissue associated with
change during cool storage. J. Am. Soc. Hortic. Sci., 119,
987-993.
Jackman R.L. and Stanley D.W., 1995. Perspectives in the tex-
tural evaluation of plant foods. Trends in Food Science and
Technology, 6, 187-195.
Khan A.A. and Vincent J.F.F., 1993. Compressive rigidity and
fracture properties of apple and potato parenchyma. J.
Texture Studies, 24(4), 423-435.
Konstankiewicz K., Pawlak K., and Zdunek A., 2001a. Quanti-
tative method for determining cell structural parameters of
plant tissue. Int. Agrophysics, 15, 161-164.
Konstankiewicz K., Pawlak K., and Zdunek A., 2001b. Influen-
ce of structural parameters of potato tuber cells on their me-
chanical properties. Int. Agrophysics, 15, 243-246.
Konstankiewicz K. and Zdunek A., 2000. Method of acoustic
emission in the studies of cracking processes in plant tissues.
Electronic Journal of Polish Agricultural Universities,
http://www.ejpau.media.pl/series/volume3/issue2/engineer
ing/art-01.html.
Konstankiewicz K. and Zdunek A., 2001. Influence of turgor and
cell size on the cracking of potato tissue. Int. Agrophysics,
15, 27-30.
Petran M., Hadravsky M., and Boyde A., 1995. The tandem
scanning reflected light microscope. Int. Agrophysics, 9,
275-286.
126 K. KONSTANKIEWICZ et al.

Pitt R.E. and Chen H.L., 1983. Time-dependent aspects of the
strength and rheology of vegetative tissue. Transaction of
the ASAE, 26 (4), 1275-1280.
Sanz P.D., Solas M., Otero L., de Elvira J.A., Carrasco J.A.,
and Molina-Garcia A.D., 1998. Microstructure of frozen
large fruits. Pol. J. Food Nutri. Sci., 7/48, 3(S),65-68.
Tomita M., 2001. Whole-cell simulation: A Grant Challenge of
the 21st Century. Trends in Biotechnology, 19, 6, 205-210.
CELL STRUCTURE OF POTATO TUBER TISSUE 127