Embed Size (px)
Citation preview
Journal of Experimental Botany, Vol. 48, No. 306, pp. 45-58, January 1997Journal ofExperimentalBotany
Cell turgor, osmotic pressure and water potential in theupper epidermis of barley leaves in relation to celllocation and in response to NaCI and air humidity
Wieland Fricke1
The Swedish University of Agricultural Sciences, Department for Production Ecology, PO Box 7042,S-75007 Uppsala, Sweden
Received 26 February 1996; Accepted 22 July 1996
Abstract
Previous single-cell studies on the upper epidermis ofbarley leaves have shown that cells differ systematic-ally in their solute concentrations depending on theirlocation relative to stomatal pores and veins and thatduring NaCI stress, gradients in osmotic pressure (n)develop (Fricke et al., 1995, 1996; Hinde, 1994). Theobjective of the present study was to address thequestion to which degree these intercellular differ-ences in solute concentrations and n are associatedwith intercellular differences in turgor or water poten-tial [i//). Epidermal cells analysed were located at vari-ous positions within the ridge regions overlying largelateral or intermediate veins, in the trough regionsbetween those veins or in between stomata (i.e. inter-stomatal cells). Turgor pressure of cells was measuredusing a cell pressure probe, and n of extracted cellsap was determined by picolitre osmometry. For bothlarge and intermediate lateral veins, there were nosystematic differences in turgor between cells locatedat the base, mid or top of ridges, regardless of whetherplants were analysed at low or high PAR ( <10 or300-400 /imol photons m 2 s~1). However, turgorwithin a ridge region was not necessarily uniform, butcould vary by up to 0.14 MPa (1.4 bar) between adja-cent cells. In 60 out of 63 plants, turgor of ridge cellswas either slightly or significantly higher than turgorof trough (lowest turgor) or interstomatal cells (inter-mediate turgor). The significance and magnitude ofturgor differences was higher in plants analysed underhigh PAR or local air flow than in plants analysed underlow PAR. The largest (up to 0.41 MPa) and consistentlysignificant differences in turgor were found in plantstreated for 3-9 d prior to analysis with 100 mM NaCI.For both NaCI-treated and non-treated (control) plants,differences in turgor between cell types were mainlydue to differences in n since differences in <p were
negligible (0.01-0.04 MPa). Epidermal cell \fi in NaCI-treated plants was about 0.38 MPa more negative thanin control plants due to higher n. Turgor pressureswere similar. Following a sudden change in rooting-medium \f/ or air humidity, turgor of both ridge andtrough cells responded within seconds and followedthe same time-course of relaxation. The half time (T1/2)of turgor relaxation was not limited by the cell's T1/2
for water exchange.
Key words: Barley leaf epidermis, cell turgor, heterogen-eity, NaCI stress, osmotic pressure, water potential.
Introduction
Differences in turgor pressure between different leaf tissues(e.g. mesophyll and epidermis in Tradescantia, Frenschand Schulze, 1988; Nonami et al, 1990) or root tissues(cortex and stele in maize roots, Pritchard et al., 1989)might be explained by differences in the water relationsof these tissues or the existence of turgor-dependentprocesses that are associated with differences in tissuephysiology. The question arises whether systematicdifferences in turgor may also exist between cells thatbelong to the same (non-growing) tissue and which areapparently uniform in structure and function.
Some pressure-probe studies on roots have shownradial turgor gradients between cortical cells (Rygol et al.,1993; Zimmermann et al., 1992), whereas others have not(Jones et al, 1983; Steudle and Jeschke, 1983; Pritchardet al, 1989). Differences in results may have been due todifferences in the species analysed or differences in meas-urement conditions. For example, intercellular gradientsin turgor were only observed under considerable transpir-ation. Turgor (and osmotic) pressures increased from theoutermost layers of the cortex towards the xylem whichwas explained by a transpiration stream-dependent
1 Fax: +46 18 673037. E-mail: Wieland.Fncke©emc.s/u.se
© Oxford University Press 1997
Dow
nloaded from https://academ
ic.oup.com/jxb/article/48/1/45/578134 by guest on 28 N
ovember 2021
46 Fncke
solvent drag effect on solutes (Zimmermann et al., 1992).An alternative explanation for the direction of gradientshas been provided by the results of Meshcheryakov et al.(1992) which suggest that in the mature region of thehypocotyl of Ricinus communis, gradients in turgor (and77) are related to the proximity of cells to the phloemrepresenting the major source of organic osmotica. Asimilar explanation has been given by Frensch and Hsiao(1994) for the observation that cells located in the innercortex of osmotically-stressed maize roots recovered fasterin turgor than cells located in the outer cortex.
Pressure-probe studies on leaves (mature tissue of theleaf epidermis of Tradescantia virginiana, Tomos et al.,1981; Shackel and Brinckmann, 1985; mesophyll ofKalanchoS daigremontiana, Steudle et al., 1980), suggestthat there are no gradients in turgor or n between cellsbelonging to the same tissue. However, recent single-cellsampling and solute-analysing studies of the upper epi-dermis of barley leaves have shown that cells located atvarious positions relative to the vascular bundles andstomatal pores differ systematically in their vacuolarsolute concentrations (Hinde, 1994; Fricke et al., 1995)and that during NaCl stress, intercellular differences in ncan develop (Fricke et al., 1996). This indicates thatintercellular differences in turgor or </> also exist. If so,this would add another level of complexity to our under-standing of leaf water and solute relations (Leigh andTomos, 1993) and its response to changes in nutrientsupply, water supply or evaporative demand.
In the present study on the upper epidermis of barleyleaves, this possibility was investigated by analysing cellslocated at various well-defined positions relative to (i)stomatal pores and (ii) large lateral veins (LV) andintermediate veins (IV) for turgor pressure, n and ifi.Large and intermediate lateral veins were compared sincethese veins can differ in their solute concentrations (par-ticularly for NO3", Fricke et al., 1995) and may differ intheir capacities for water transport (Altus et al., 1985).To cover a range of measurement environments, leaveswere analysed under low or high PAR, or under low orhigh local illumination and air flow. In some experiments,plants were treated for 3-9 d before analysis with 100 mMNaCl to see to which degree the differential accumulationof Na + and Cl~ in epidermal cell types (Fricke et al.,1996) affects their turgor and if> relations. To characterizethe water relations under a fluctuating (/(-environment,plants were subjected to short-term changes in external </>and the response (relaxation) of epidermal cell turgorfollowed with time. The TU2 of turgor relaxation wascompared with the cell's Ti/2 for water flux equilibrium.
Materials and methods
Plant material
Seeds of barley (Hordeum vulgare L. cv. Golf) were imbibedovernight in water and germinated for 4-5 d on aerated 0.5 mM
CaSO4. Eight seedlings were then transferred to 5 1 of aerated,modified Hoagland solution containing 1 mM NaCl (Frickeet al., 1994) and grown at a PAR of 300-400 jumol photons m~2
s~' and a 16 h day/8 h dark period. Plants were grown in thesame room where measurements were carried out. Plants wereanalysed when they were 12-22-d-old. Second, third or fourthleaves were analysed at the time they represented the youngest,fully-, or nearly fully-expanded leaf. Leaves were analysed half-way along the expanded blade at the adaxial (upper) epidermis,within a small region covering the first large lateral vein (LV),counted from the midrib, the adjacent (outward) intermediatevein (IV) and the second large lateral vein. For details of theNaCl treatments see Figure legends and Tables.
Location of epidermal cells
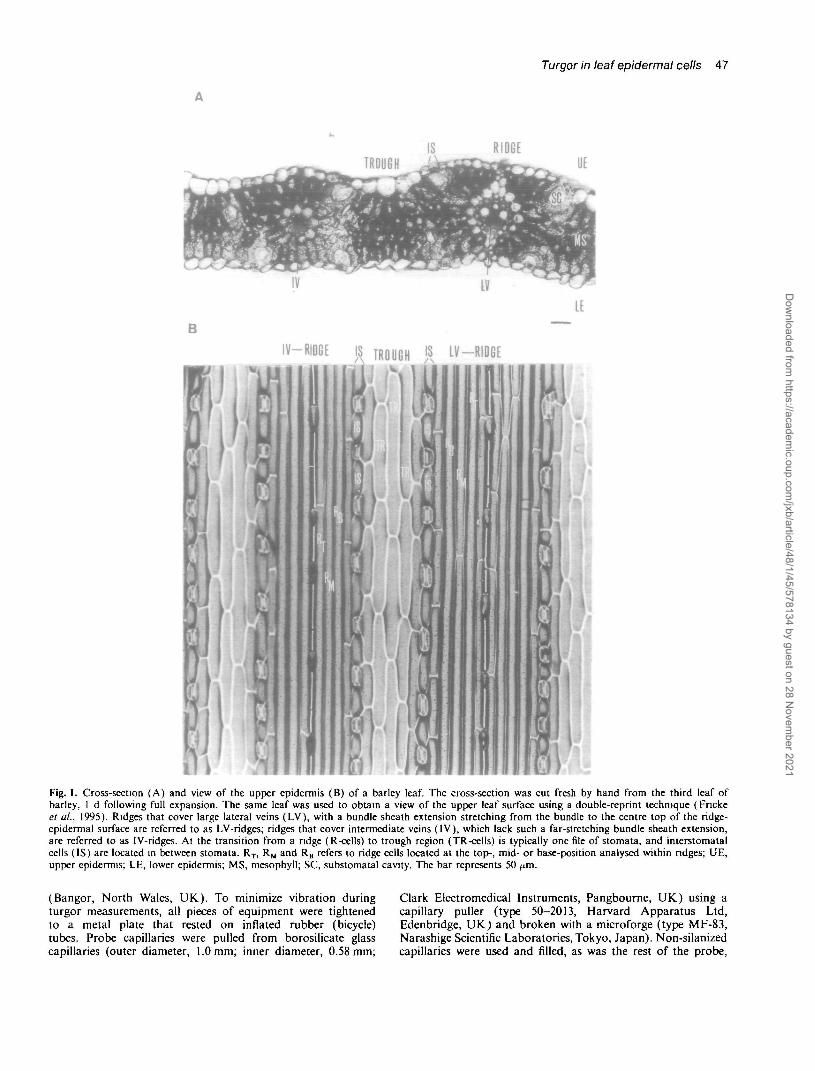
The location of epidermal cells analysed is illustrated andspecified in Fig. 1 which gives a cross-sectional view of a barleyleaf (A) and a view of the surface of the upper epidermis (B).The ridge regions consisted typically of a total of six cells to beanalysed; those cells that were located at the very top of aLV-ridge were not analysed since these cells were considerablysmaller (shorter and narrower) than the other ridge cells andcapilllaries became quite often clogged during turgor measure-ments (IV-ridges generally did not show those small cells at thevery top); those cells that were located at the very base of aIV- or LV-ridge, at the transition from the ridge to the stomatalcell files, were not included in the analyses either. These cellsare likely to be exposed at their leaf-inner surface to thesubstomatal cavity and might therefore be more comparablewith interstomatal cells (see also Fricke et al., 1995).
Measurement environment
Plants were transferred from their growth site to the measure-ment site. After 15-20 min analyses were started. Throughoutthe analyses, the leaf area to be analysed was illuminated witha cold light. Cells were viewed through a zoom stereomicroscope(type Wild MZ8, Leica AG, Heerburg, Switzerland), atmagnifications ranging from x 128 to x 200. Leaves wereviewed either horizontally or vertically and four differentmeasurement set-ups were used. (lst + 2nd set-up) When cellswere analysed only for turgor, leaves were viewed horizontally.The illumination of plants was reduced to dim room light (<; 10fimol photons m" 2 s"1 at plant level: 'low PAR' set-up) orcomparable to that at the growth site (illumination of 300-400fimol photons m~2 s"1 at plant level: 'high PAR' set-up). (3rdset-up) When cells were analysed only for 77, the leaf (verticalviewing) was kept near to the stage on which the picolitreosmometer was mounted. The overall illumination of the plantwas dim and the illumination with the cold light source waskept at a minimum. This set-up was chosen to compare the -rrdata with the turgor data obtained under low PAR. (4th set-up) When cells were analysed for turgor and -n, to derive </i freeof errors introduced by calculating tf> from turgor and TT dataobtained from different plants and cells, the leaf area to beanalysed was exposed to a continuously by-passing stream ofdry air and illuminated brightly with the cold light source(vertical viewing and dim overall illumination; the stream of airwas pointing towards the part of the picolitre osmometer wheresamples were placed under liquid paraffin).
Details of the experiments where plants were subjected tosudden changes in external (root medium or atmospheric) </i aregiven in the Results section and Figure legends.
Turgor and osmolality measurements
Turgor measurements (Husken et al., 1978) were performedwith a pressure probe obtained from Bangor University
Dow
nloaded from https://academ
ic.oup.com/jxb/article/48/1/45/578134 by guest on 28 N
ovember 2021
Turgor in leaf epidermal cells 47
RIDGE
LEB
IV-RIDGE IS T R o U 6 H IS LV—RIDGEVI *•*
\
Fig. 1. Cross-section (A) and view of the upper epidermis (B) of a barley leaf. The cross-section was cut fresh by hand from the third leaf ofbarley, 1 d following full expansion. The same leaf was used to obtain a view of the upper leaf surface using a double-reprint technique (Fnckeel al., 1995). Ridges that cover large lateral veins (LV), with a bundle sheath extension stretching from the bundle to the centre top of the ridge-epidermal surface are referred to as LV-ridges; ridges that cover intermediate veins (IV), which lack such a far-stretching bundle sheath extension,are referred to as IV-ridges. At the transition from a ndge (R-cells) to trough region (TR-cells) is typically one file of stomata, and interstomatalcells (IS) are located in between stomata. RT, RM and RB refers to ridge cells located at the top-, mid- or base-position analysed within ndges; UE,upper epidermis; LE, lower epidermis; MS, mesophyll; SC, substomatal cavity. The bar represents 50 ^m.
(Bangor, North Wales, UK). To minimize vibration duringturgor measurements, all pieces of equipment were tightenedto a metal plate that rested on inflated rubber (bicycle)tubes. Probe capillaries were pulled from borosilicate glasscapillaries (outer diameter, 1.0 mm; inner diameter, 0.58 mm;
Clark Electromedical Instruments, Pangbourne, UK) using acapillary puller (type 50-2013, Harvard Apparatus Ltd,Edenbridge, UK) and broken with a microforge (type MF-83,Narashige Scientific Laboratories, Tokyo, Japan). Non-silanizedcapillaries were used and filled, as was the rest of the probe,
Dow
nloaded from https://academ
ic.oup.com/jxb/article/48/1/45/578134 by guest on 28 N
ovember 2021
48 Fricke
with silicone oil (type AS4, Wacker Chemie, MOnchen,Germany). The underestimation of cell turgor caused by thevolume of cell solution outside the cell (in the capillary) duringturgor measurements should be highest for the smallest cells,i.e. here interstomatal cells (Fig. IB). The volume of inter-stomatal cells was generally between 31-50 pi (calculated fromleaf cross-sections and reprints of the epidermal surface; trough-cell volume generally between 400-520 pi and ridge-cell volumebetween 750-980 pi). The volume of cell solution outside thecell was less than 0.078 pi, i.e. less than 0.16-0.25% of theinterstomatal cell volume. Assuming a volumetric elasticmodulus of 5 MPa (see Malone and Tomos [1990] for leafepidermal cells of wheat) this would result in an underestimationof interstomatal cell turgor of 0.008-0.013 MPa. This is aboutan order of magnitude smaller than the differences in turgorfound here between cell types and, therefore, does not interferewith the interpretation of results.
Osmolalities of extracted cell sap were determined witha picolitre osmometer (Bangor, North Wales, UK.) asdescribed by Malone et al. (1989) and Tomos et al. (1994).Osmolalities were converted into -n assuming that 0.1 MPacorresponds to c. 40.75 mOsmolkg"1 at 22°C (Nobel, 1991).The accuracy of turgor and n determination was0.002-0.003 MPa.
When cells were analysed for -n and turgor, the turgor of acell was measured immediately before cell sap was extractedinstantaneously using a rapid-sampling device on the probe
(Malone et al., 1989). The extracted sap was transferred withinseconds under liquid paraffin placed on to the osmometer stageand analysed for osmolality within the following 70 min.
Results
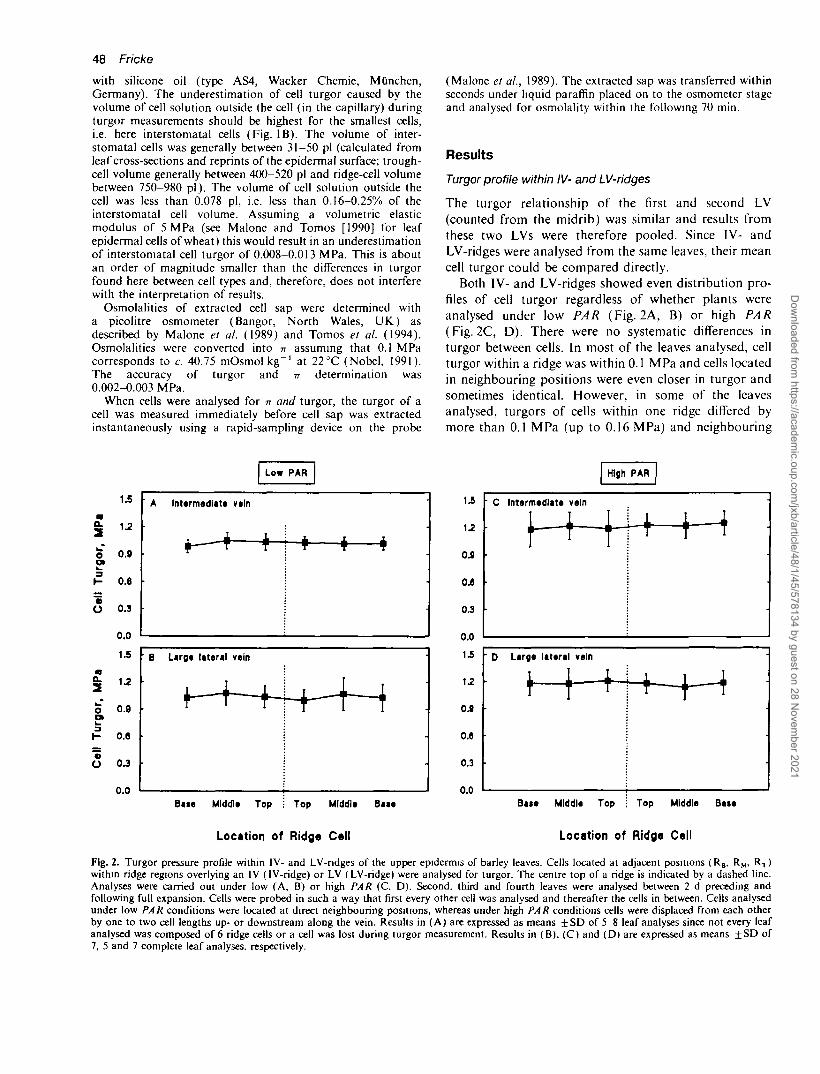
Turgor profile within IV- and LV-ridges
The turgor relationship of the first and second LV(counted from the midrib) was similar and results fromthese two LVs were therefore pooled. Since IV- andLV-ridges were analysed from the same leaves, their meancell turgor could be compared directly.
Both IV- and LV-ridges showed even distribution pro-files of cell turgor regardless of whether plants wereanalysed under low PAR (Fig. 2A, B) or high PAR(Fig. 2C, D). There were no systematic differences inturgor between cells. In most of the leaves analysed, cellturgor within a ridge was within 0.1 MPa and cells locatedin neighbouring positions were even closer in turgor andsometimes identical. However, in some of the leavesanalysed, turgors of cells within one ridge differed bymore than 0.1 MPa (up to 0.16 MPa) and neighbouring
Low PAR High PAR
5.
o
o
iso.
o
15
1.2
0.9
0.6
0 J
0.0
15
1.2
0.9
0.6
OJ
0.0
A Intarmedlata vain
B Large
1
r
Bate
i -• T
lateral vein
1•— T ~~
Middle
IT
1
Top
; f
I
Top
•
Middle Bate
1J
1.2
OJ
OJ
OJ
0.0
1 ?
OJ
o.e
0.0
C Intermediate
T
vein
D Large latara vein
Bate Middle
|
T
4T
Top
'• 1i I
Top
_i 1T r
-+—t
Middle Bate
Location of Ridge Cell Location of Ridge Cell
Fig. 2. Turgor pressure profile within IV- and LV-ndges of the upper epidermis of barley leaves. Cells located at adjacent positions (RB, RM> ^ T )within ridge regions overlying an IV (IV-ridge) or LV (LV-ridge) were analysed for turgor. The centre top of a ridge is indicated by a dashed line.Analyses were carried out under low (A, B) or high PAR (C, D). Second, third and fourth leaves were analysed between 2 d preceding andfollowing full expansion. Cells were probed in such a way that first every other cell was analysed and thereafter the cells in between. Cells analysedunder low PAR conditions were located at direct neighbouring positions, whereas under high PAR conditions cells were displaced from each otherby one to two cell lengths up- or downstream along the vein. Results in (A) are expressed as means ±SD of 5-8 leaf analyses since not every leafanalysed was composed of 6 ridge cells or a cell was lost during turgor measurement. Results in (B). (C) and (D) are expressed as means ±SD of7, 5 and 7 complete leaf analyses, respectively.
Dow
nloaded from https://academ
ic.oup.com/jxb/article/48/1/45/578134 by guest on 28 N
ovember 2021
cells had turgors that were different by up to 0.15 MPa(not shown). The latter was not an artefact caused by theprobing of neighbouring cells, i.e. there was no suchtendency that the turgor of a cell probed second waslower than the turgor of its neighbour cell probed first.The mean (±SD) ridge-cell turgor, calculated fromthe values shown in Fig. 2, for IV and LV-ridges were:low PAR: IV-ridge 1.03 ±0.02 MPa, LV-ridge1.04±0.03MPa; high PAR: IV-ridge 1.21 +0.03 MPa,LV-ridge 1.19 ±0.03 MPa. Thus, under both measurementconditions, IV- and LV-ridge cell turgor was almostidentical.
Turgor, n and i|/ in ridge, trough and interstomatal cells
To give an idea of the cell-to-cell variation in turgor, nand <j> observed for each cell type during a leaf analysis,one set of data is presented in its original form (Table 1).The remaining data are presented as average of the meansof the individual leaf analyses together with the respectiveaverage of individual standard deviations (= error barsin Figs 3-5). There was no obvious effect of leaf numberor leaf-developmental stage on the results.
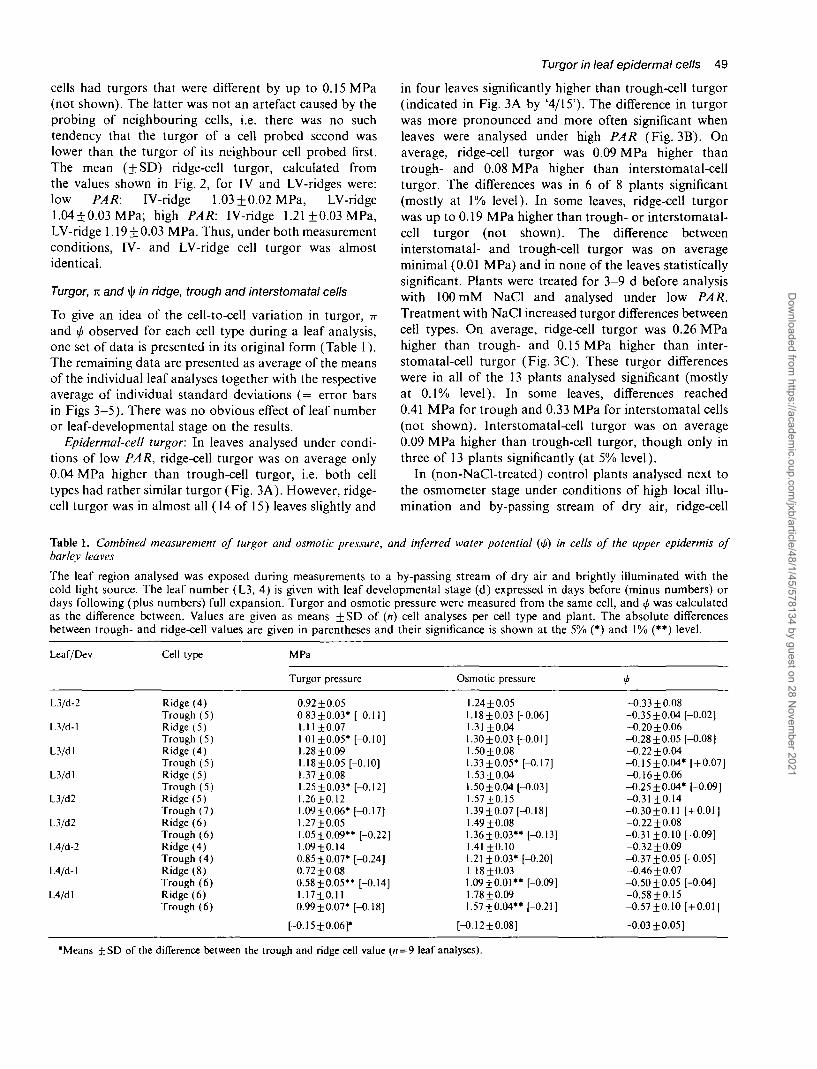
Epidermal-cell turgor: In leaves analysed under condi-tions of low PAR, ridge-cell turgor was on average only0.04 MPa higher than trough-cell turgor, i.e. both celltypes had rather similar turgor (Fig. 3A). However, ridge-cell turgor was in almost all (14 of 15) leaves slightly and
Turgor in leaf epidermal cells 49
in four leaves significantly higher than trough-cell turgor(indicated in Fig. 3A by '4/15'). The difference in turgorwas more pronounced and more often significant whenleaves were analysed under high PAR (Fig. 3B). Onaverage, ridge-cell turgor was 0.09 MPa higher thantrough- and 0.08 MPa higher than interstomatal-cellturgor. The differences was in 6 of 8 plants significant(mostly at 1% level). In some leaves, ridge-cell turgorwas up to 0.19 MPa higher than trough- or interstomatal-cell turgor (not shown). The difference betweeninterstomatal- and trough-cell turgor was on averageminimal (0.01 MPa) and in none of the leaves statisticallysignificant. Plants were treated for 3-9 d before analysiswith 100 mM NaCl and analysed under low PAR.Treatment with NaCl increased turgor differences betweencell types. On average, ridge-cell turgor was 0.26 MPahigher than trough- and 0.15 MPa higher than inter-stomatal-cell turgor (Fig. 3C). These turgor differenceswere in all of the 13 plants analysed significant (mostlyat 0.1% level). In some leaves, differences reached0.41 MPa for trough and 0.33 MPa for interstomatal cells(not shown). Interstomatal-cell turgor was on average0.09 MPa higher than trough-cell turgor, though only inthree of 13 plants significantly (at 5% level).
In (non-NaCl-treated) control plants analysed next tothe osmometer stage under conditions of high local illu-mination and by-passing stream of dry air, ridge-cell
Table 1. Combined measurement of turgor and osmotic pressure, and inferred water potential (t/i) in cells of the upper epidermis ofbarley leaves
The leaf region analysed was exposed during measurements to a by-passing stream of dry air and brightly illuminated with thecold light source. The leaf number (L3, 4) is given with leaf developmental stage (d) expressed in days before (minus numbers) ordays following (plus numbers) full expansion. Turgor and osmotic pressure were measured from the same cell, and <p was calculatedas the difference between. Values are given as means ±SD of (n) cell analyses per cell type and plant. The absolute differencesbetween trough- and ridge-cell values are given in parentheses and their significance is shown at the 5% (*) and 1% (**) level.
Leaf/Dev
L3/d-2
L3/d-l
L3/dl
L3/dl
L3/d2
L3/d2
L4/d-2
L4/d-l
L4/dl
Cell type
Ridge (4)Trough (5)Ridge (5)Trough (5)Ridge (4)Trough (5)Ridge (5)Trough (5)Ridge (5)Trough (7)Ridge (6)Trough (6)Ridge (4)Trough (4)Ridge (8)Trough (6)Ridge (6)Trough (6)
MPa
Turgor pressure
0.92±0.050 83 ±0.03* [-0.11]
.11+0.0701 ±0.05* [-0.10].28 ±0.09.18±0.05 [-0.10].37 ±0.08.25 ±0.03* [-0.12].26±0.12.09±0.06* [-0.17].27 ±0.05.05±0.09" [-0.22].09±0.14
0.85±0.07* [-0.24]0.72 ±0.080.58±0.05" [-0.14]1.17±0.110.99±0.07* [-0.18]
[-O.15±O.O6f
Osmotic pressure
1.24±0.051.18±O.O3 [-0.06]1.31 ±0.041.30 ±0.03 [-0.01]1.50 ±0.081.33±0.05* [-0.17]1.53 ±0.041.50±0.04[-0.03]1.57±0.151.39±0.07 [-0.18]1.49 ±0.081.36±0.03" [-0.13]1.41 ±0.101.21 ±0.03* [-0.20]1 18±O.O31.09±0.01" [-0.09]1.78 ±0.091.57 ±0.04** [-0.21]
[-0.12±0.08]
•A
-0.33 ±0.08-0.35±0.04 [-0.02]-0.20 ±0.06-0.28 ±0.05 [-0.08]-0.22±0.04-0.15±0.04* [+0.07]-0.16 ±0.06-0.25±0.04* [-0.09]-0.31 ±0.14-0.30±0.11 [+0.01]-0.22 ±0.08-0.31 ±0.10 [-0.09]-0.32 ±0.09-0.37 ±0.05 [-0.05]-0.46 ±0.07-0.50 ±0.05 [-0.04]-0.58 ±0.15-0.57±0.10 [+0.01]
-0.03 ±0.05]
'Means ±SD of the difference between the trough and ridge cell value (n = 9 leaf analyses).
Dow
nloaded from https://academ
ic.oup.com/jxb/article/48/1/45/578134 by guest on 28 N
ovember 2021
50 Fricke
Horizontal viewing of plants
IV
O
Vertical viewing of plants(high local illumination and air stream)
QL
'go
r,
a
1.8
1.5
1.2
0.9
0.6
03
0.0
Control
TR TR IS
Cell Type
Fig. 3. Turgor pressure in leaf epidermal cells of barley. Plants were analysed while being viewed horizontally, either under low (A, C) or highPAR (B), or while being viewed vertically, with the leaf area analysed exposed to high local illumination and stream of dry air (D, E). In controlplants (A, B, D), second, third and fourth leaves were analysed between 1 d preceding and 4 d following full expansion. NaCl-treated plants (C,E) were treated for 3-9 d prior to analysis with 100 mM NaCl and third and fourth leaves were analysed between 2 d preceding and following fullexpansion. NaCl-treatments were started at the time the third leaf emerged from the surrounding second-leaf sheath by two daily additions of50 mM NaC1. Results are presented as means of 15 (A), 8 (B), 13 (C), 9 (D), and 5 (E) leaf analyses, with 4-11 cells analysed per cell type andleaf. The error bars shown do nol represent the SD of the means of the n leaf analyses This would represent the leaf-to-leaf variation in cell turgor.Instead, the error bars represent the mean cell-to-cell variation in turgor for a particular cell type ( = means of the SDs of the individual leafanalyses). The number of leaves where turgor differences between ndge and trough, and between ridge and interstomatal cells were significant isgiven in relation to the total number of leaves analysed fa/b').
turgor was on average 0.15 MPa higher than trough-cellturgor (Fig. 3D). The difference was in 8 out of 9 plantssignificant (mostly at 1% level). In NaCl-treatedplants analysed under the same conditions, ridge-cellturgor was on average 0.28 MPa higher than trough- and0.17 MPa higher than interstomatal-cell turgor (Fig. 3E).Differences were in 4, and in 5 out of 5 plants significant(1% level), respectively. Interstomatal-cell turgor was onaverage 0.11 MPa higher than trough-cell turgor. Thisdifference was in 4 out of 5 leaves significant (1% level).
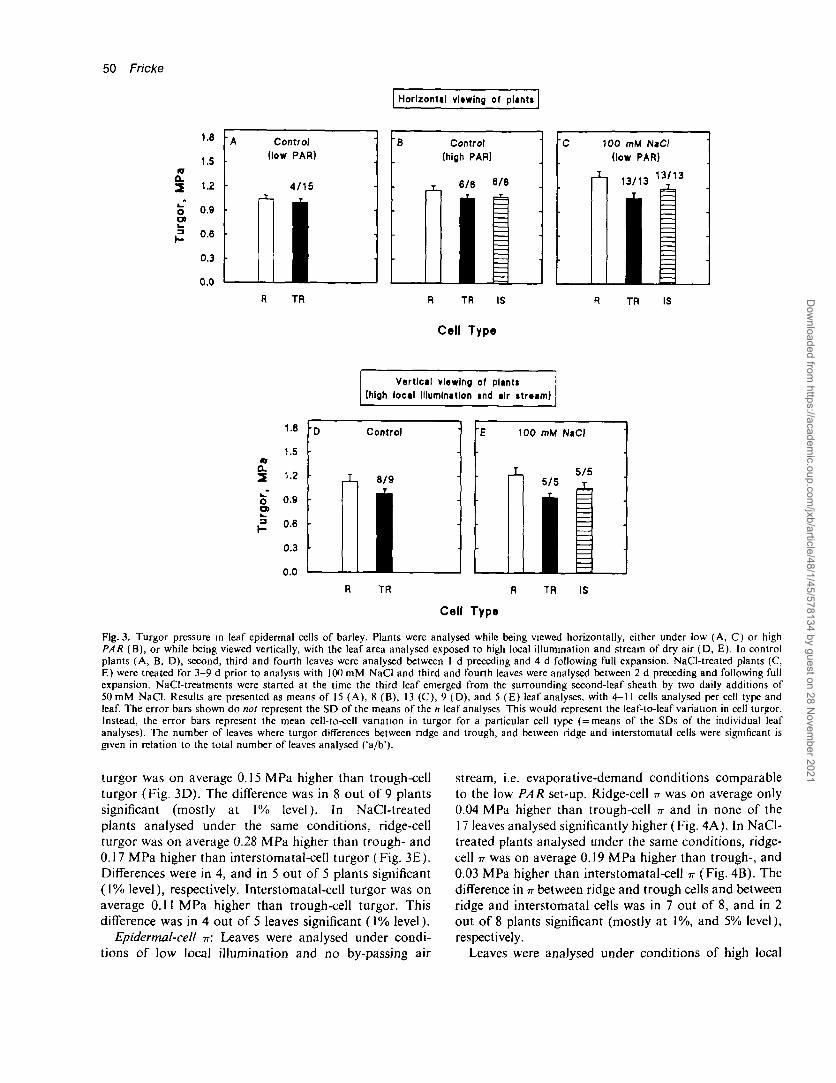
Epidermal-cell -n: Leaves were analysed under condi-tions of low local illumination and no by-passing air
stream, i.e. evaporative-demand conditions comparableto the low PAR set-up. Ridge-cell n was on average only0.04 MPa higher than trough-cell n and in none of the17 leaves analysed significantly higher (Fig. 4A). In NaCl-treated plants analysed under the same conditions, ridge-cell 7T was on average 0.19 MPa higher than trough-, and0.03 MPa higher than interstomatal-cell -n (Fig. 4B). Thedifference in n between ridge and trough cells and betweenridge and interstomatal cells was in 7 out of 8, and in 2out of 8 plants significant (mostly at 1%, and 5% level),respectively.
Leaves were analysed under conditions of high local
Dow
nloaded from https://academ
ic.oup.com/jxb/article/48/1/45/578134 by guest on 28 N
ovember 2021
Turgor in leaf epidermal cells 51
| Low local illumination and no ilr itraim| High local Illumination and air itream
Q.
O
a.o
o
Control
0/17
B 100 mM NaCI
2/8
c
_ I _
Control
s/g
D 100 mM NaCI
R TR R TR IS TR TR IS
Call Type
Fig. 4. Osmotic pressure (n) in leaf epidermal cells of barley. Plants were viewed vertically and the leaf area analysed was exposed to low localillumination and no air stream (A, B) or high local illumination and dry-air stream (C, D) In control plants (A, C), second, third and fourthleaves were analysed between 2 d preceding and 3 d following full expansion. NaCl-treated plants (B, D) were treated for 3-8 d prior to analysiswith 100 mM NaCI and third and fourth leaves were analysed between 1 d preceding and 4 d following fulJ expansion NaCl-treatments werestarted at the time the third leaf emerged from the surrounding second-leaf sheath, by two daily additions of 50 mM NaCI. Results are presentedas means of 17 (A), 8 (B), 9 (C), and 5 (D) leaf analyses, with 4-8 cells analysed per cell type and leaf. The error bars represent the mean cell-to-cell variation in -n for a particular cell type ( = means of the SDs of the individual leaf analyses). The number of leaves where TT differences betweenridge and trough, and between ridge and interstomatal cells were significant is given in relation to the total number of leaves analysed ('a/b').
illumination and by-passing stream of dry air. Ridge-cellTT was on average 0.12 MPa higher than trough-cell n(Fig. 4C) and in 5 out of 9 leaves significantly higher(mostly at 1% level). In NaCl-treated plants analysedunder the same conditions, ridge-cell n was on average0.24 MPa higher than trough- and 0.16 MPa higher thaninterstomatal-cell n (Fig. 4D). The difference in TT betweenridge and troughs cells, and between ridge and inter-stomatal cells was in 5 out of 5, and in 4 out of 5 plantssignificant (mostly at 1% level), respectively.
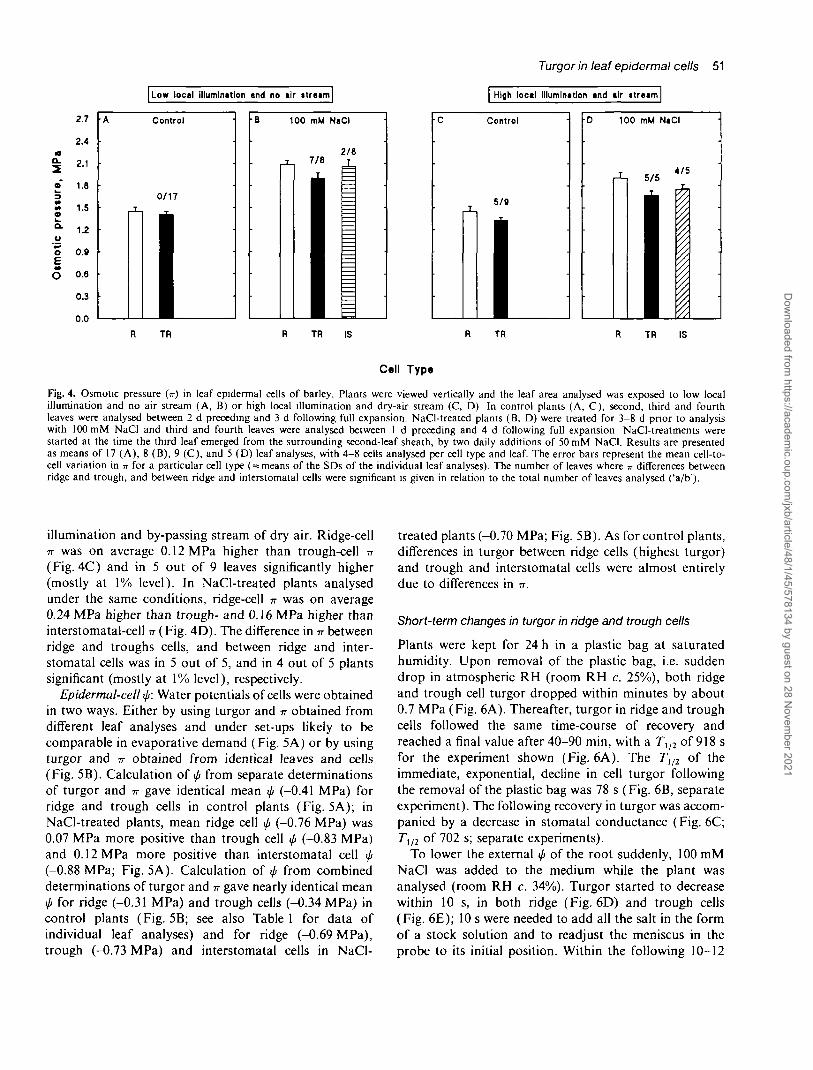
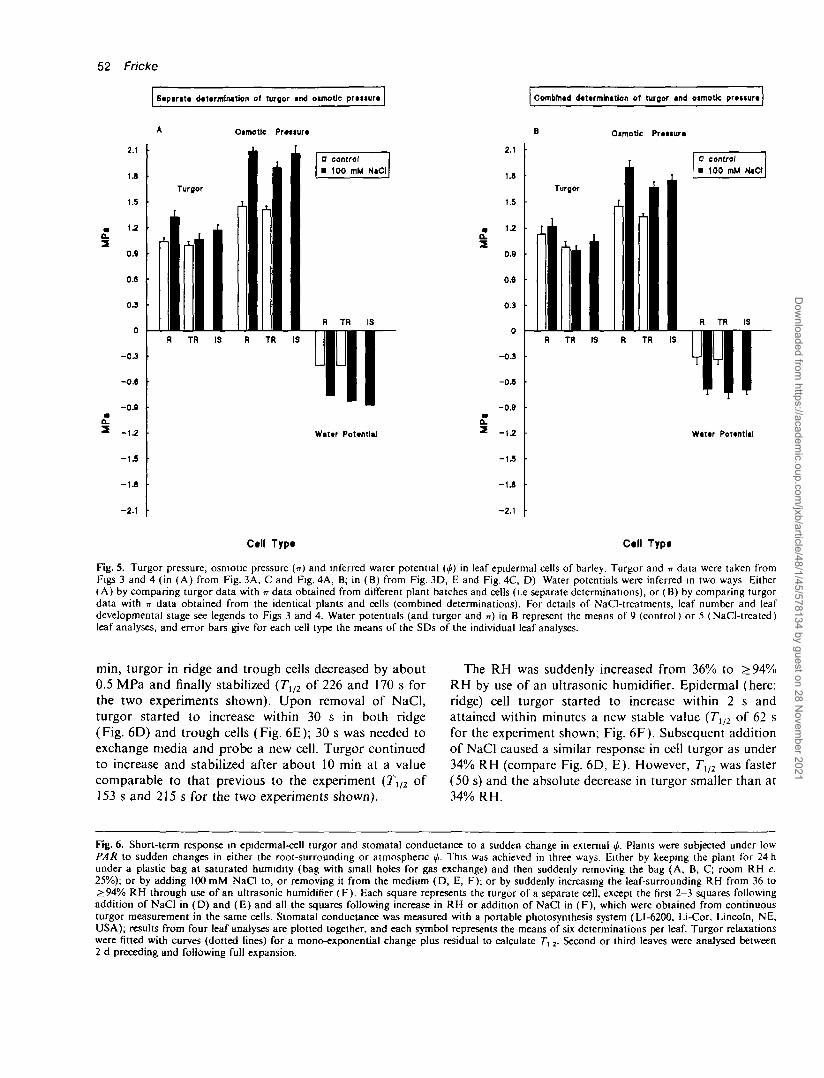
Epidermal-cell ip: Water potentials of cells were obtainedin two ways. Either by using turgor and n obtained fromdifferent leaf analyses and under set-ups likely to becomparable in evaporative demand (Fig. 5A) or by usingturgor and -n obtained from identical leaves and cells(Fig. 5B). Calculation of </r from separate determinationsof turgor and TT gave identical mean tfi (-0.41 MPa) forridge and trough cells in control plants (Fig. 5A); inNaCl-treated plants, mean ridge cell ifi (-0.76 MPa) was0.07 MPa more positive than trough cell </. (-0.83 MPa)and 0.12 MPa more positive than interstomatal cell </«(-0.88 MPa; Fig. 5A). Calculation of 0 from combineddeterminations of turgor and TT gave nearly identical meanip for ridge (-0.31 MPa) and trough cells (-0.34 MPa) incontrol plants (Fig. 5B; see also Table 1 for data ofindividual leaf analyses) and for ridge (-0.69 MPa),trough (-0.73 MPa) and interstomatal cells in NaCl-
treated plants (-0.70 MPa; Fig. 5B). As for control plants,differences in turgor between ridge cells (highest turgor)and trough and interstomatal cells were almost entirelydue to differences in TT.
Short-term changes in turgor in ridge and trough cells
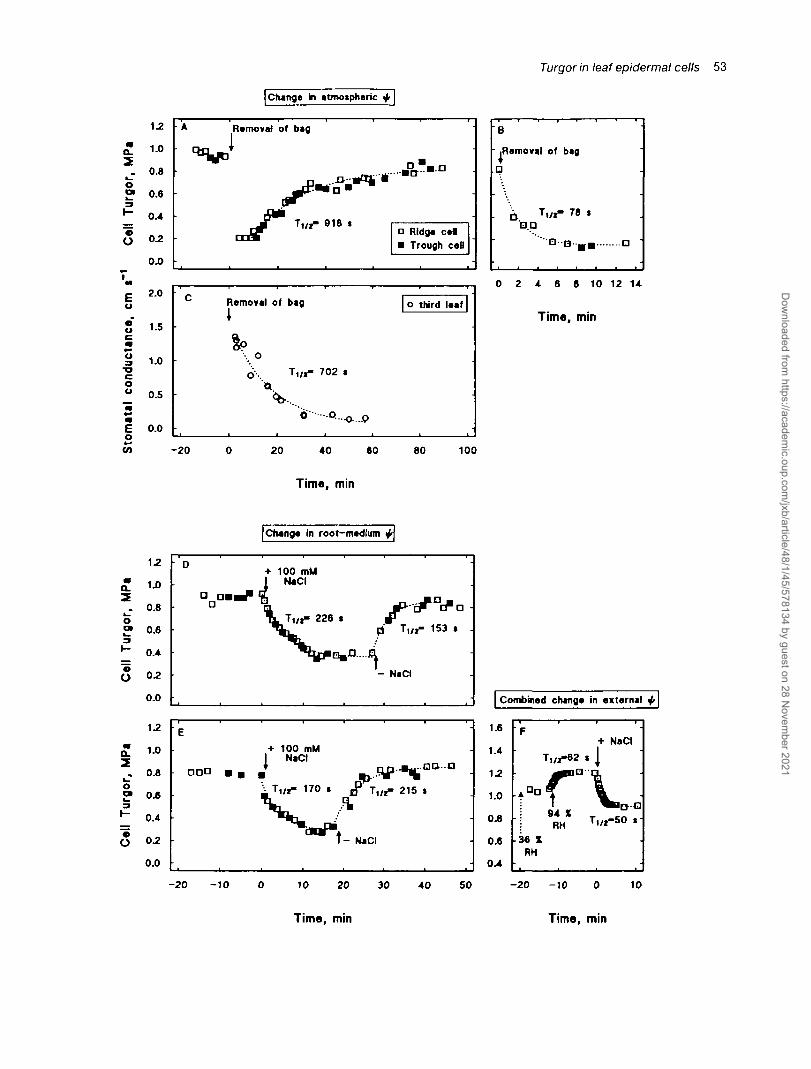
Plants were kept for 24 h in a plastic bag at saturatedhumidity. Upon removal of the plastic bag, i.e. suddendrop in atmospheric RH (room RH c. 25%), both ridgeand trough cell turgor dropped within minutes by about0.7 MPa (Fig. 6A). Thereafter, turgor in ridge and troughcells followed the same time-course of recovery andreached a final value after 40-90 min, with a Tlj2 of 918 sfor the experiment shown (Fig. 6A). The T1/2 of theimmediate, exponential, decline in cell turgor followingthe removal of the plastic bag was 78 s (Fig. 6B, separateexperiment). The following recovery in turgor was accom-panied by a decrease in stomatal conductance (Fig. 6C;TU2 of 702 s; separate experiments).
To lower the external </i of the root suddenly, 100 mMNaCI was added to the medium while the plant wasanalysed (room RH c. 34%). Turgor started to decreasewithin 10 s, in both ridge (Fig. 6D) and trough cells(Fig. 6E); 10 s were needed to add all the salt in the formof a stock solution and to readjust the meniscus in theprobe to its initial position. Within the following 10-12
Dow
nloaded from https://academ
ic.oup.com/jxb/article/48/1/45/578134 by guest on 28 N
ovember 2021
52 Fricke
Saparat* d*ttrmtnatk>n of turgor and otmotlc pr tuur* Combined dtUrminttton of turgor and oimotk praitur*
2.1
1.8
1.8
\2
0.9
0.6
0 J
0
- 0 J
-0.6
- 0 J
-1.2
-1.5
-1.8
-2.1
A O«motie
Turgor
I
1|11
M| |MII
Pr*»ura
• control• 100 mM N*CI
R TR IS
R TR IS R TR IS I H I I I 1
III•II1 •Wattr Potential
Oimotic Praiiur*
2.1
U
1.5
1.2
0.9
0.6
0.3
0
-OJ
-0.6
-0.9
-1.2
-13
-1.8
-2.1
Turgor
0 control
• 100 mM NaCt
R TR IS
R TR IS R TR IS
Wattr PountlaJ
Ctll Typ« Cell Typ*
Fig. 5. Turgor pressure, osmotic pressure (IT) and inferred water potential (<j>) in leaf epidermal cells of barley. Turgor and n data were taken fromFigs 3 and 4 (in (A) from Fig. 3A, C and Fig. 4A, B; in (B) from Fig. 3D, E and Fig. 4C, D) Water potentials were inferred in two ways Either(A) by comparing turgor data with n data obtained from different plant batches and cells (i.e separate determinations), or (B) by comparing turgordata with n data obtained from the identical plants and cells (combined determinations). For details of NaCl-treatments, leaf number and leafdevelopmental stage see legends to Figs 3 and 4. Water potentials (and turgor and n) in B represent the means of 9 (control) or 5 (NaCl-treated)leaf analyses, and error bars give for each cell type the means of the SDs of the individual leaf analyses.
min, turgor in ridge and trough cells decreased by about0.5 MPa and finally stabilized (Tm of 226 and 170 s forthe two experiments shown). Upon removal of NaCl,turgor started to increase within 30 s in both ridge(Fig. 6D) and trough cells (Fig. 6E); 30 s was needed toexchange media and probe a new cell. Turgor continuedto increase and stabilized after about 10 min at a valuecomparable to that previous to the experiment (T1/2 of153 s and 215 s for the two experiments shown).
The RH was suddenly increased from 36% to >94%RH by use of an ultrasonic humidifier. Epidermal (here:ridge) cell turgor started to increase within 2 s andattained within minutes a new stable value (Tl/2 of 62 sfor the experiment shown; Fig. 6F). Subsequent additionof NaCl caused a similar response in cell turgor as under34% RH (compare Fig. 6D, E). However, T{/2 was faster(50 s) and the absolute decrease in turgor smaller than at34% RH.
Fig. 6. Short-term response in epidermal-cell turgor and stomatal conductance to a sudden change in external ui. Plants were subjected under lowPAR to sudden changes in either the root-surrounding or atmospheric ip. This was achieved in three ways. Either by keeping the plant for 24 hunder a plastic bag at saturated humidity (bag with small holes for gas exchange) and then suddenly removing the bag (A, B, C; room RH c.25%); or by adding 100 mM NaCl to, or removing it from the medium (D, E, F); or by suddenly increasing the leaf-surrounding RH from 36 to^94% RH through use of an ultrasonic humidifier (F) . Each square represents the turgor of a separate cell, except the first 2-3 squares followingaddition of NaCl in (D) and (E) and all the squares following increase in RH or addition of NaCl in (F), which were obtained from continuousturgor measurement in the same cells. Stomatal conductance was measured with a portable photosynthesis system (LI-6200, Li-Cor, Lincoln, ME,USA); results from four leaf analyses are plotted together, and each symbol represents the means of six determinations per leaf. Turgor relaxationswere fitted with curves (dotted lines) for a mono-exponential change plus residual to calculate 7", 2. Second or third leaves were analysed between2 d preceding and following full expansion.
Dow
nloaded from https://academ
ic.oup.com/jxb/article/48/1/45/578134 by guest on 28 N
ovember 2021
1.2
a.2
jrg
or
i -
o
•
«•
Eo
inc
e,
du
cti
al
con
<o
ma
t
1.0
0.8
0.6
0.4
0.2
0.0
2.0
1.5
1.0
0.5
0.0
CO -20
Change in atmospheric
Removal of bag
T t / I - 918 .• Ridge eel• Trough ceB
Removal of
I
6\o.
bag
Ti/i-
b-
702
• -Q.
*
•o- ...<P
| o third leaf |
Turgor in leaf epidermal cells 53
B
Removal of bag
ri Tt/i~Q.p
20 40 60 80
Time, min
0 2 4 6 6 10 12 14
Time, min
100
| Change in root-medium 4>\
oat3
o
1.0
0.8
0.6
0.4
0J)
1.2
a.2
o
\-
Cel
l
1.0
0.8
0.6
0.4
0.2
0.0
D + 100 mMI NaCI
^ T 1 / t " 226 i
• iNaa
-
153 t .
-
+ 100 mMI
O D D
\ ,T1 r t - 170 t 215 t
t-
-20 -10 10 20 30 40 50
Time, min
| Combined change in axtarnal <f>\
1.6
1.4
1.2
1.0
0.8
0.6
0.4
' F
36 1RH
T1/I-82
r94 XRH
•I
T,/
' •
NaCI
• i f j Q
2-50 t-
-
-20 -10 0 10
Time, min
Dow
nloaded from https://academ
ic.oup.com/jxb/article/48/1/45/578134 by guest on 28 N
ovember 2021
54 Fricke
Discussion
Intercellular differences in n, turgor and \J* within the upperepidermis of barley leaves
Epidermal-cell n: A previous study on the upper epidermisof barley leaves showed that, as the leaf aged, ridge-cell77 increased more than trough- and interstomatal-cell n.This was generally accompanied by a particular highaccumulation of K + and Cl~ in ridge cells (Fricke et al.,1995). Differences in n between cell types appeared to benon-significant. This is consistent with the present resultsobtained for (control) plants analysed under low localillumination and no air flow (Fig. 4A). However, itcontrasts with the results obtained under conditions ofhigh local illumination and by-passing stream of dry air(Fig. 4C) where 5 out of 9 plants showed a significantlyhigher ridge- than trough-cell -n. This might indicate thata change in the (local) evaporative demand or lightintensity affects solute ( K + and Cl~) export/import inridge and trough cells differentially and would imply thatosmotically-significant solute movement across epidermalcell membranes is much faster than generally assumed(here: within 20-90 min following transfer of plants tothe measurement site).
NaCl-treatment increased differences in n between ridge(higher n) and trough cells. This is consistent with previ-ous results on NaCl-treated barley which showed that, asNaCl-treatment continued, ridge-cell n increased pro-gressively more than trough-cell n, leading to n differencesof 0.2-0.45 MPa. Most likely, this resulted from higherconcentrations of Cl" and Na + in ridge compared totrough cells (Fricke et al., 1996). The difference betweenridge- (higher n) and interstomatal-cell n was less pro-nounced and less often significant than the differencesbetween ridge- and trough-cell -n. This is in line withprevious results (Fricke et al., 1996). However, in theprevious study, ridge-cell -n was mostly slightly lower thaninterstomatal-cell TT, whereas in the present study it wasmostly higher. This may indicate that, during NaCltreatment, the barley cultivar 'Golf studied here has ahigher capacity for accumulation of Cl~ and Na+ inridge cells or a lower capacity for accumulation of C\~and Na + , or maintenance of NO3~ in interstomatal cellsthan the previously studied cultivar 'Klaxon'.
Epidermal-cell turgor: Nonami et al. (1990), studyingthe water relations of Tradescantia leaves, found consist-ent, though non-significant differences in turgor betweensubsidiary cells and other (unspecified) epidermal cells.Shackei and Brinckmann (1985) reported for the samespecies that there were no consistent differences in turgorbetween ridge and trough cells and between cells locatedat contrasting distances from stomata. This is in sharpcontrast to the present findings on barley and points toa basic difference in the epidermal water and soluterelations between the two species.
The magnitude and significance of turgor differencesbetween cells was higher in (control) plants analysedunder high PAR than in plants analysed under low PAR,and was highest in plants analysed under high localillumination and by-passing stream of dry air (Fig. 3).For each cell type, there were no statistically significantdifferences in turgor between these three measurementconditions (not shown). This indicates that turgor differ-ences between cell types changed with measurement condi-tions since each cell type responded with (slightly)different turgor. To what degree this was due to a directlight effect on turgor or a changed transpiration rate, cannot be said. (Plants were not protected during analysisfrom CO2 from the investigators breath.)
The turgor difference between ridge and trough cells incontrol plants analysed for turgor and -n was, on average,attributable by 80% to a difference in n and attributableby 20% to a difference in </. (Fig. 5B; Table 1). For NaCl-treated plants, the values were 82% and 18%, respectively,for the turgor difference between ridge and trough cells,and 87% and 13%, respectively, for the turgor differencebetween ridge and interstomatal cells (Fig. 5B). Similarvalues for the contribution of n- and i/i-differences toturgor differences between ridge and trough cells wereobtained using turgor and n measured separately indifferent plants (Fig. 5A); however, only 20% of theturgor difference between ridge and interstomatal cellscould be accounted for by their difference in n. The latterunderlines the potential 'weakness' of determining turgorand n in separate plants and cells to derive i/i.
Together, the results show that the differences in turgorbetween cell types are accompanied by only very smalldifferences (0.01-0.04 MPa) in </.. Instead, they reflectmainly differences in n and, therefore, ultimately, differ-ences in the cell's solute supply or ability to accumulateand maintain Cl~ and K + (control plants) or Cl~, Na +
and NO3" (NaCl-treatment). Intercellular differences inapoplastic transpiration tension or solute potential seemto be far less important. (It is assumed that reflectioncoefficients for osmolytes are close to one and comparablebetween cell types.) The results are in line with the findingsof two other studies where intercellular gradients in turgorand similar-sized gradients in n reflected the proximity ofcells to the source of solutes (Meshcheryakov et al., 1992)or the site where water was ultrafiltrated into the xylem(Zimmermann et al., 1992). In contrast, Nonami et al.(1990) studying Tradescantia leaves observed that turgordifferences between subsidiary and other epidermal cellswere accompanied by differences in </i in the range of0.1-0.2 MPa.
The type of turgor variation observed within ridgeregions where cells differed in turgor occasionally by0.1-0.16 MPa, even in neighbouring positions, seems tobe random and comparable to the kind of turgor variationnoted for cells of other tissues (Steudle et al., 1980; Tomos
Dow
nloaded from https://academ
ic.oup.com/jxb/article/48/1/45/578134 by guest on 28 N
ovember 2021
Q.
Q.
O
a.
1.0
0.S
0.6
0.4
0.2
0.0
02
0.4
0.6
0 J
c
o, • rldga calla, • trough call
1
A rldga call* trough call
NaCI
(T,/i- 109 . ©-•
•
*
\ T U 1 - 107 • ^ ^ A
Turgor in leaf epidermal cells 55
1.0
0-8 S „
£ I0.6 a
- "^S •.
0.4 E —M
o0^
-20 -10 10 20 30 40 50
Time, min
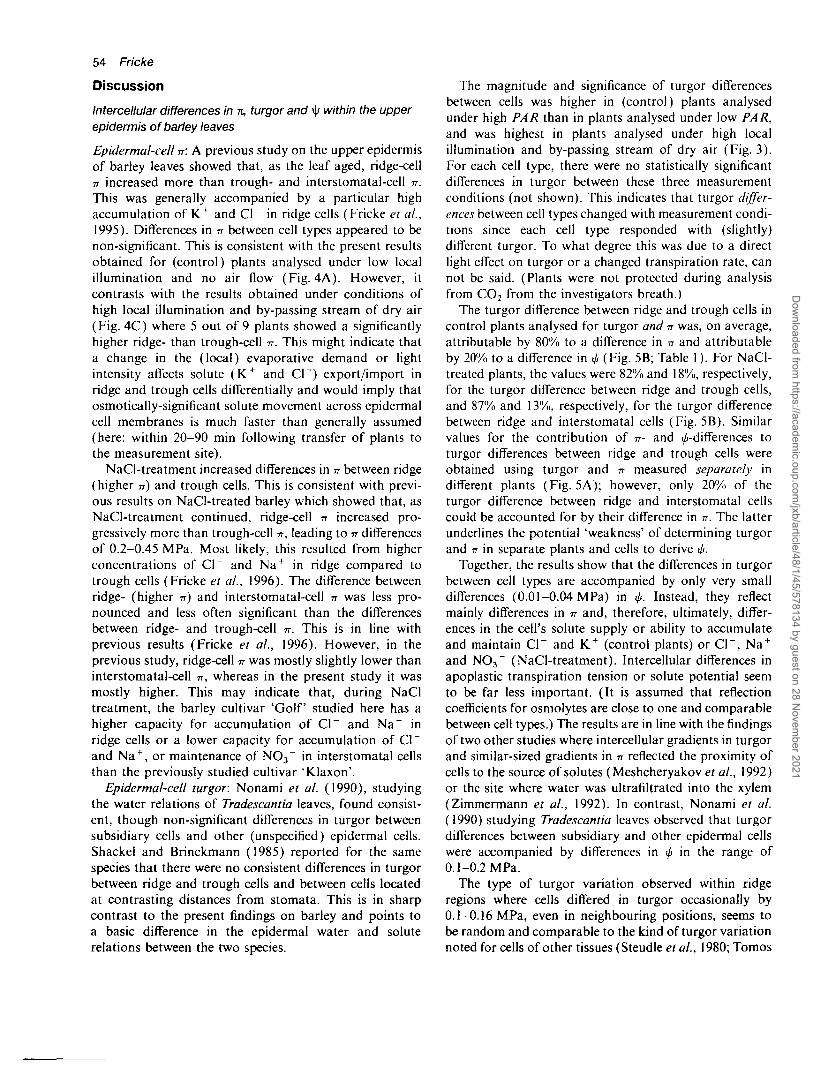
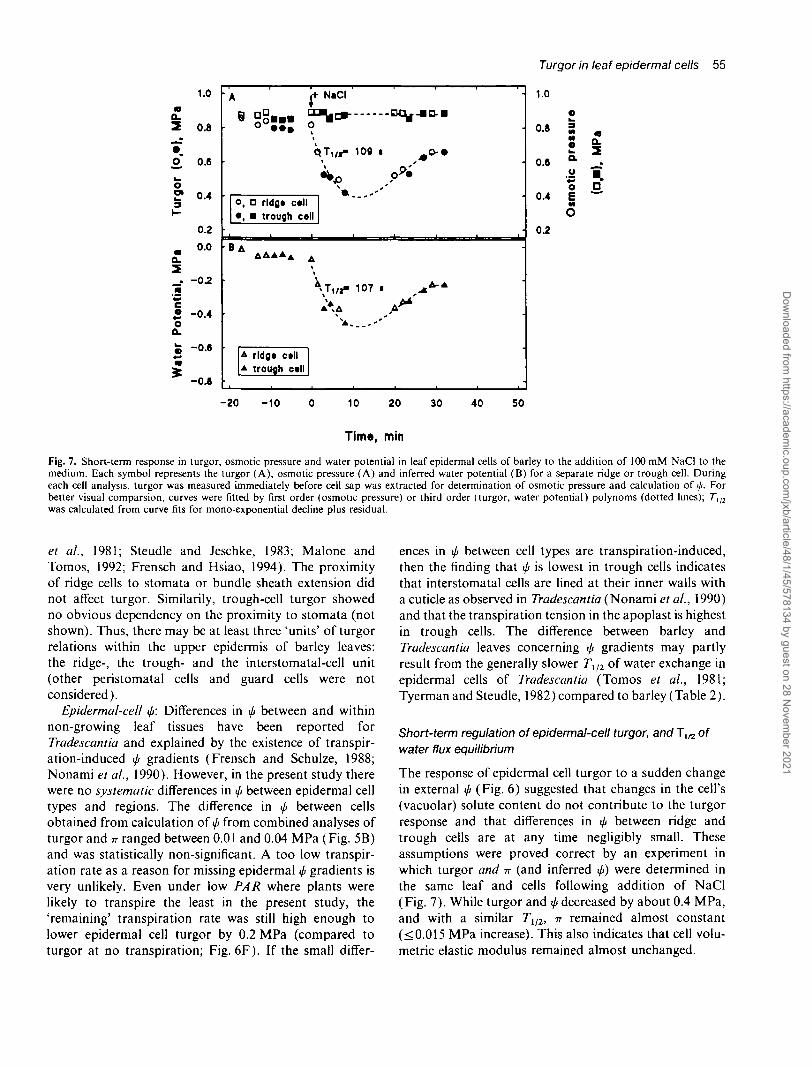
Fig. 7. Short-term response in turgor, osmotic pressure and water potential in leaf epidermal cells of barley to the addition of 100 mM NaCI to themedium. Each symbol represents the turgor (A), osmotic pressure (A) and inferred water potential (B) for a separate ridge or trough cell. Duringeach cell analysis, turgor was measured immediately before cell sap was extracted for determination of osmotic pressure and calculation of i/>. Forbetter visual comparsion, curves were fitted by first order (osmotic pressure) or third order (turgor, water potential) polynoms (dotted lines); 7*1/2
was calculated from curve fits for mono-exponential decline plus residual.
et al., 1981; Steudle and Jeschke, 1983; Malone andTomos, 1992; Frensch and Hsiao, 1994). The proximityof ridge cells to stomata or bundle sheath extension didnot affect turgor. Similarity, trough-cell turgor showedno obvious dependency on the proximity to stomata (notshown). Thus, there may be at least three 'units' of turgorrelations within the upper epidermis of barley leaves:the ridge-, the trough- and the interstomatal-cell unit(other peristomatal cells and guard cells were notconsidered).
Epidermal-cell i/i: Differences in if> between and withinnon-growing leaf tissues have been reported forTradescantia and explained by the existence of transpir-ation-induced </r gradients (Frensch and Schulze, 1988;Nonami et al., 1990). However, in the present study therewere no systematic differences in 0 between epidermal celltypes and regions. The difference in i/> between cellsobtained from calculation of I/I from combined analyses ofturgor and n ranged between 0.01 and 0.04 MPa (Fig. 5B)and was statistically non-significant. A too low transpir-ation rate as a reason for missing epidermal <p gradients isvery unlikely. Even under low PAR where plants werelikely to transpire the least in the present study, the'remaining' transpiration rate was still high enough tolower epidermal cell turgor by 0.2 MPa (compared toturgor at no transpiration; Fig. 6F). If the small differ-
ences in </i between cell types are transpiration-induced,then the finding that >p is lowest in trough cells indicatesthat interstomatal cells are lined at their inner walls witha cuticle as observed in Tradescantia (Nonami et al., 1990)and that the transpiration tension in the apoplast is highestin trough cells. The difference between barley andTradescantia leaves concerning </< gradients may partlyresult from the generally slower Tl/2 of water exchange inepidermal cells of Tradescantia (Tomos et al., 1981;Tyerman and Steudle, 1982) compared to barley (Table 2).
Short-term regulation of epidermal-cell turgor, and T1/2 ofwater flux equilibrium
The response of epidermal cell turgor to a sudden changein external </r (Fig. 6) suggested that changes in the cell's(vacuolar) solute content do not contribute to the turgorresponse and that differences in I/I between ridge andtrough cells are at any time negligibly small. Theseassumptions were proved correct by an experiment inwhich turgor and -n (and inferred </«) were determined inthe same leaf and cells following addition of NaCI(Fig. 7). While turgor and </> decreased by about 0.4 MPa,and with a similar TU2, -n remained almost constant(<0.015 MPa increase). This also indicates that cell volu-metric elastic modulus remained almost unchanged.
Dow
nloaded from https://academ
ic.oup.com/jxb/article/48/1/45/578134 by guest on 28 N
ovember 2021
56 Fricke
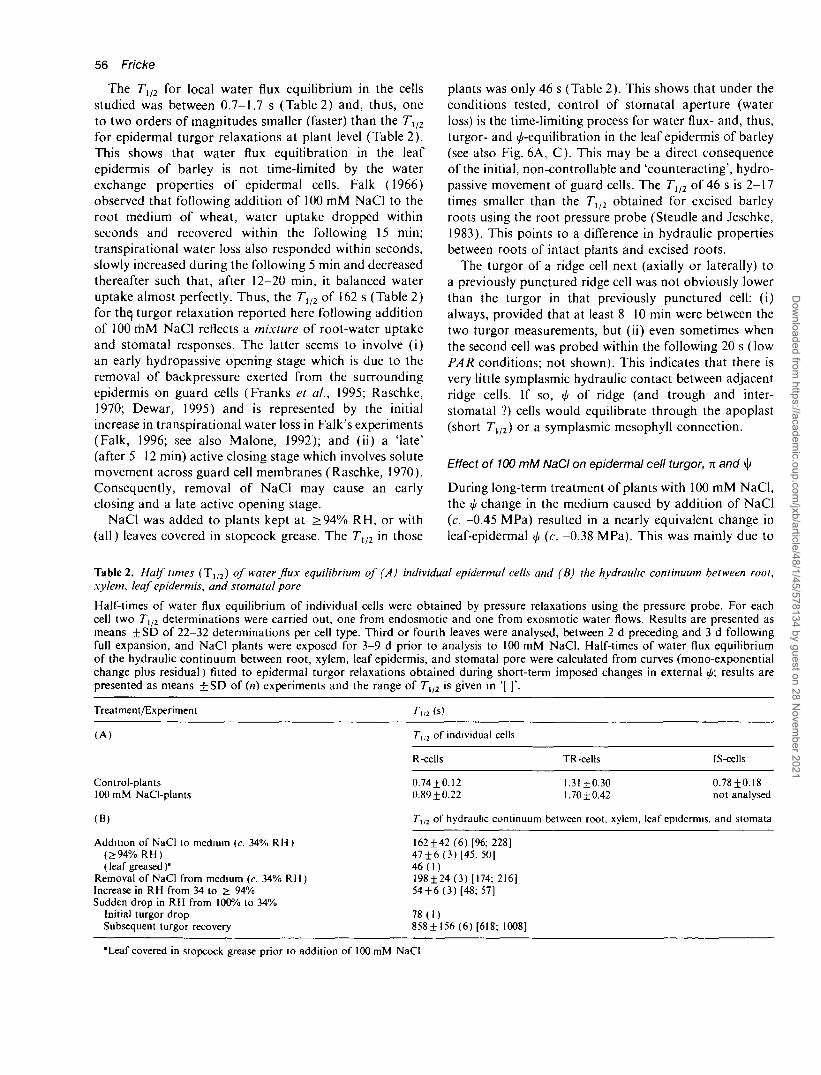
The Tl/2 for local water flux equilibrium in the cellsstudied was between 0.7-1.7 s (Table 2) and, thus, oneto two orders of magnitudes smaller (faster) than the T1/2
for epidermal turgor relaxations at plant level (Table 2).This shows that water flux equilibration in the leafepidermis of barley is not time-limited by the waterexchange properties of epidermal cells. Falk (1966)observed that following addition of 100 mM NaCl to theroot medium of wheat, water uptake dropped withinseconds and recovered within the following 15 min;transpirational water loss also responded within seconds,slowly increased during the following 5 min and decreasedthereafter such that, after 12-20 min, it balanced wateruptake almost perfectly. Thus, the T1/2 of 162 s (Table 2)for thej turgor relaxation reported here following additionof 100 mM NaCl reflects a mixture of root-water uptakeand stomatal responses. The latter seems to involve (i)an early hydropassive opening stage which is due to theremoval of backpressure exerted from the surroundingepidermis on guard cells (Franks et ai, 1995; Raschke,1970; Dewar, 1995) and is represented by the initialincrease in transpirational water loss in Falk's experiments(Falk, 1996; see also Malone, 1992); and (ii) a Mate'(after 5-12 min) active closing stage which involves solutemovement across guard cell membranes (Raschke, 1970).Consequently, removal of NaCl may cause an earlyclosing and a late active opening stage.
NaCl was added to plants kept at >94% RH, or with(all) leaves covered in stopcock grease. The Tl/2 in those
plants was only 46 s (Table 2). This shows that under theconditions tested, control of stomatal aperture (waterloss) is the time-limiting process for water flux- and, thus,turgor- and i/i-equilibration in the leaf epidermis of barley(see also Fig. 6A, C). This may be a direct consequenceof the initial, non-controllable and 'counteracting', hydro-passive movement of guard cells. The Tl/2 of 46 s is 2-17times smaller than the Tl/2 obtained for excised barleyroots using the root pressure probe (Steudle and Jeschke,1983). This points to a difference in hydraulic propertiesbetween roots of intact plants and excised roots.
The turgor of a ridge cell next (axially or laterally) toa previously punctured ridge cell was not obviously lowerthan the turgor in that previously punctured cell: (i)always, provided that at least 8-10 min were between thetwo turgor measurements, but (ii) even sometimes whenthe second cell was probed within the following 20 s (lowPAR conditions; not shown). This indicates that there isvery little symplasmic hydraulic contact between adjacentridge cells. If so, \\> of ridge (and trough and inter-stomatal ?) cells would equilibrate through the apoplast(short Ti/2) or a symplasmic mesophyll connection.
Effect of 100 mM NaCl on epidermal cell turgor, n and v|/
During long-term treatment of plants with 100 mM NaCl,the ifi change in the medium caused by addition of NaCl(c. -0.45 MPa) resulted in a nearly equivalent change inleaf-epidermal tp (c. -0.38 MPa). This was mainly due to
Table 2. Half times (T1/2) of water flux equilibrium of (A) individual epidermal cells and (B) the hydraulic continuum between root,xylem, leaf epidermis, and stomatal pore
Half-times of water flux equilibrium of individual cells were obtained by pressure relaxations using the pressure probe. For eachcell two Tl/2 determinations were carried out, one from endosmotic and one from exosmotic water flows. Results are presented asmeans ±SD of 22-32 determinations per cell type. Third or fourth leaves were analysed, between 2 d preceding and 3 d followingfull expansion, and NaCl plants were exposed for 3-9 d prior to analysis to 100 mM NaCl. Half-times of water flux equilibriumof the hydraulic continuum between root, xylem, leaf epidermis, and stomatal pore were calculated from curves (mono-exponentialchange plus residual) fitted to epidermal turgor relaxations obtained during short-term imposed changes in external 0; results arepresented as means ±SD of (n) experiments and the range of Tl/2 is given in '[ ]'.
Treatment/Experiment TUi
(A)
Control-plantslOOmM NaCl-plants
(B)
Addition of NaCl to medium (c. 34% RH)(£94% RH)(leaf greased)'
Removal of NaCl from medium (c. 34% RH)Increase in RH from 34 to 2: 94%Sudden drop in RH from 100% to 34%
Initial turgor dropSubsequent turgor recovery
TV2 of individual cells
R-cells TR-cells IS-cells
0.74 ±0.120.89±0.22
1.31 ±0.301.70 ±0.42
0.78±0.18not analysed
Tu2 of hydraulic continuum between root, xylem, leaf epidermis, and stomata
162 ±42 (6) [96; 228]47±6(3) [45. 50]46(1)198±24 (3) [174; 216]54±6(3) [48; 57]
78(1)858±156(6) [618; 1008]
'Leaf covered in stopcock grease prior to addition of 100 mM NaCl
Dow
nloaded from https://academ
ic.oup.com/jxb/article/48/1/45/578134 by guest on 28 N
ovember 2021
an increase in epidermal -n since turgor was generally atthe control level (Fig. 5B; no significant difference inturgor between control and NaCl treatment). The lattermight be indicative of turgor regulation in NaCl-treatedbarley (osmotic adjustment). During short-term exposureto 100 mM NaCl, changes in epidermal turgor seemedalso to be equivalent to changes in external </f (Fig. 6D,E). However, this was rather coincidental since the recov-ery decreased with increasing RH to 48+17% (means±SD of eight experiments at 94% RH; see also Fig. 6F,and Thiel et al., 1988). Assuming that the pressure changein root-xylem transmitted quantitatively into a change inepidermal I/I, then the results give a radial root reflectioncoefficient for NaCl of 0.48. This value is very similar tovalues obtained with the root pressure probe on excisedroots (Steudle and Jeschke, 1983; Steudle 1993) and thexylem pressure probe on intact plants (Zhu et al., 1995).
In conclusion, the present study on the upper epidermisof barley leaves shows that the previously reported sys-tematic heterogeneity in solute concentrations (Frickeet al., 1995, 1996; Hinde, 1994) between ridge, troughand interstomatal cells (and regions) is accompanied bya systematic heterogeneity in turgor. In addition, n candiffer systematically between cells. However, </r of cells issimilar. Within ridge regions, where cells do not differsystematically in solute concentrations (Fricke et al.,1995), there is no systematic difference in cell turgoreither. Turgor differences between cell types increase withNaCl-treatment. Following a sudden change in externaltp, water flux equilibration in epidermal cells is not limitedby their hydraulic properties or water supply via rootsbut by the control of stomatal aperture. The elevatedturgor in ridge regions may well have a biomechanicalfunction since ridge regions are suited best as load-bearingcarriers. Some observations indicate that epidermal cellsare hydraulically isolated via their symplasts, though thisrequires further experimental support.
Acknowledgements
This work was supported by a guest-researcher grant from theSwedish Forest and Agricultural Reseach Council (SJFR).Wieland Fricke would like to thank Jeremy Pritchard(Birmingham, UK), Paul Richardson and Peter Hinde (Bangor,UK) for teaching him the use of the pressure probe andpicolitre osmometer. Particular thanks go to Jurgen Frensch(Bayreuth, Germany) and Deri Tomos (Bangor, UK) for theirvery helpful comments on an earlier version of the manuscript.
References
Altus DP, Canny MJ, Blackmann DR. 1985. Water pathwaysin wheat leaves. II. Water-conducting capacities and vesseldiameters of different vein types, and the behaviour of theintegrated vein network. Australian Journal of PlantPhysiology 12, 183-99.
Turgor in leaf epidermal cells 57
Dewar RC. 1995. Interpretation of an empirical model forstomatal conductance in terms of guard cell function. Plant.Cell and Environment 18, 365-72.
Falk SO. 1966. Effect on transpiration and water uptake byrapid changes in the osmotic potential of the nutrientsolution. Plivsiologia Plantarum 19, 602-17.
Franks PJ, Cowan IR, Tyerman SD, Cleary AL, Lloyd J,Farquhar GD. 1995. Guard cell pressure/aperture character-istics measured with the pressure probe. Plant, Cell andEnvironment 18, 795-800.
Frensch J, Hsiao TC. 1994. Transient responses of cell turgorand growth of maize roots affected by changes in waterpotential. Plant Physiology 104, 246-54.
Frensch J, Schulze E-D. 1988. The effect of humidity and lighton cellular water relations and diffusion conductance ofleaves of Tradescantia virginiana L. Planta 173, 554-62.
Fricke W, Hinde PS, Leigh RA, Tomos AD. 1995. Vacuolarsolutes in the upper epidermis of barley leaves. Intercellulardifferences follow patterns. Planta 196, 40—9.
Fricke W, Leigh RA, Tomos AD. 1994. Concentrations ofinorganic and organic solutes in extracts from individualepidermal, mesophyll and bundle-sheath cells of barley leaves.Planta 192, 310-16.
Fricke W, Leigh RA, Tomos AD. 1996. The intercellulardistribution of vacuolar solutes in the epidermis and meso-phyll of barley leaves changes in response to NaCl. Journalof Experimental Botany 47', 1413-26.
Hinde PS. 1994. The role of potassium as an osmoticum inbarley leaf cells. PhD thesis, University of Wales, UK.
Husken D, Steudle E, Zimmennann U. 1978. Pressure probetechnique for measuring water relations of cells in higherplants. Plant Physiology 61, 158-63.
Jones H, Tomos AD, Leigh RA, Wyn Jones RG. 1983. Water-relation parameters of epidermal and cortical cells in theprimary root of Triticum aestivum L. Planta 158, 230-6.
Leigh RA, Tomos AD. 1993. Ion distribution in cereal leaves:pathways and mechanisms. Philosophical Transactions of theRoyal Society of London, Series B 341, 75-86.
Malone M. 1992. Kinetics of wound-induced hydraulic signalsand variation potentials in wheat seedlings. Planta 187,505-10.
Malone M, Leigh RA, Tomos AD. 1989. Extraction and analysisof sap from individual wheat leaf cells: the effect of samplingspeed on the osmotic pressure of extracted sap. Plant, Celland Environment 12, 919-26.
Malone M, Tomos AD. 1990. A simple pressure-probe methodfor the determination of volume in higher-plant cells. Planta182, 199-203.
Malone M, Tomos AD. 1992. Measurement of gradients ofwater potential in elongating pea stem by pressure probe andpicolitre osmometry. Journal of Experimental Botany 255,1325-31.
Meshcheryakov A, Steudle E, Komor E. 1992. Gradients ofturgor, osmotic pressure, and water potential in the cortex ofthe hypocotyl of growing Ricinus seedlings. Plant Physiology98, 840-52.
Nobel PS. 1991. Physicochemical and environmental plantphysiology. San Diego: Academic Press, 545.
Nonami H, Schulze E-D, Ziegler H. 1990. Mechanisms ofstomatal movement in response to air humidity, irradianceand xylem water potential. Planta 183, 57-64.
Pritchard J, Williams G, Wyn Jones RG, Tomos AD. 1989.Radial turgor pressure profiles in growing and mature zonesof wheat roots—a modification of the pressure probe. Journalof Experimental Botany 214, 567-71.
Raschke K. 1970. Stomatal responses to pressure changes and
Dow
nloaded from https://academ
ic.oup.com/jxb/article/48/1/45/578134 by guest on 28 N
ovember 2021
58 Fricke
interruptions in the water supply of detached leaves of Zeamays L. Plant Physiology 45, 415-23.
Rygol J, Pritchard J, Zhu JJ, Tomos AD, Zimmcrmann U.1993. Transpiration induces radial turgor pressure gradientsin wheat and maize roots. Plant Physiology 103, 493-500.
Shackel KA, BriiKkmann B. 1985. In situ measurements ofepidermal cell turgor, leaf water potential, and gas exchangein Tradescantia virginiana L. Plant Physiology 78, 66-70.
Steudle E. 1993. Pressure probe techniques: basic principles andapplication to studies of water and solute relations at thecell, tissue, and organ level. In: Smith JAC, Griffith H, eds.Water deficits: plant responses from cell to community. Oxford;Bios Scientific Publishers, 5-36.
Steudle E, Jeschke WD. 1983. Water transport in barley roots.Planta 158, 237-48.
Steudle E, Smith J A, LOttge U. 1980. Water-relation parametersof individual mesophyll cells of the crassulacean acidmetabolism plant Kalanchoe' daigremontiana. Plant Physiology66,1155-63.
Thiel G, Lynch J, Lauchli A. 1988. Short-term effects of salinitystress on the turgor and elongation of growing barley leaves.Journal of Plant Physiology 132, 38-44.
Tomos AD, Hinde PS, Richardson P, Pritchard J, Fricke W.1994. Microsampling and measurements of solutes in singlecells. In: Harris N, Oparka KJ, eds. Plant cell biology. Apractical approach. Oxford: 1RL Press, 297-314.
Tomos AD, Steudle E, Zimmermaiiii U, Schulze E-D. 1981.Water relations of leaf epidermal cells of Tradescantiavirginiana. Plant Physiology 68, 1135-43.
Tyerman SD, Steudle E. 1982. Comparison between osmoticand hydrostatic water flows in a higher plant cell: determina-tion of hydraulic conductivities and reflection coefficients inisolated epidermis of Tradescantia virginiana. AustralianJournal of Plant Physiology 9, 461-79.
Zhu JJ, Zimmermann U, ThOrmer F, Haase A. 1995. Xylempressure response in maize roots subjected to osmotic stress:determination of radial reflection coefficients by use of thexylem pressure probe. Plant, Cell and Environment 18, 906-12.
Zimmermann U, Rygol J, Balling A, Kldck G, Metzler A, HaaseA. 1992. Radial turgor and osmotic pressure profiles in intactand excised roots of Aster tripolium. Plant Physiology99, 186-96.
Dow
nloaded from https://academ
ic.oup.com/jxb/article/48/1/45/578134 by guest on 28 N
ovember 2021