Embed Size (px)
Citation preview
CELL TYPE SPECIFIC CONNECTIONS FROM PRIMARY MOTOR TO PRIMARY SOMATOSENSORY CORTEX
by
Amanda K. Kinnischtzke
B.S. in Neuroscience, University of Minnesota, 2007
Submitted to the Graduate Faculty of
School of Medicine in partial fulfillment
of the requirements for the degree of
Doctor of Philosophy
University of Pittsburgh
2013

ii
UNIVERSITY OF PITTSBURGH
SCHOOL OF MEDICINE
This dissertation was presented
by
Amanda K. Kinnischtzke
It was defended on
July 8, 2013
and approved by
Elias Aizenman, Ph.D., Professor, Neurobiology
Brent Doiron, Ph.D., Assistant Professor, Mathematics
Anne-Marie Oswald, Ph.D., Assistant Professor, Neuroscience
Erika E. Fanselow, Ph.D., Special Faculty, Department of Biological Sciences
Asaf Keller, Ph.D., Anatomy and Neurobiology, University of Maryland
Dissertation Advisor: Daniel J. Simons, Ph.D., Professor, Neurobiology

iii
Copyright © by Amanda K. Kinnischtzke
2013

iv
Anatomical studies have shown that primary somatosensory (S1) and primary motor
(M1) cortices are reciprocally connected. The pathway from primary motor cortex (M1) to
primary somatosensory cortex (S1) is thought to influence activity in S1 by conveying a general
modulatory signal and/or a copy of the motor command. In these studies, we investigated M1
synaptic inputs to S1 by injecting an AAV virus containing channelrhodopsin-2 and a fluorescent
tag into M1. Consistent with previous results, we found labeling of M1 axons within S1 that was
most robust in the deep layers and in L1. We recorded in vitro from excitatory neurons and two
classes of inhibitory interneurons, fast-spiking and somatostatin-expressing inhibitory
interneurons. All three cell types had a high probability of receiving direct excitatory M1 input,
with both excitatory and inhibitory cells in L4 being the least likely to receive input from M1.
Disynaptic inhibition was observed frequently, indicating that M1 recruits substantial inhibition
within S1.
A subpopulation of pyramidal neurons in layers 5 and 6 received especially strong input
from M1, suggesting M1 differentially contacts classes of pyramidal neurons, such as those
projecting to different sensorimotor centers at cortical and subcortical levels. We tested this
hypothesis by combining optogenetic techniques to specifically label M1 synaptic inputs to S1
and retrograde tracing to identify specific populations of projection neurons in infragranular
layers of S1. We determined that both the intrinsic properties and the magnitude of M1 input to
an S1 pyramidal neuron is highly dependent on its projection target.
CELL TYPE SPECIFIC CONNECTIONS FROM PRIMARY MOTOR TO PRIMARY
SOMATOSENSORY CORTEX
Amanda K. Kinnischtzke, B.S.
University of Pittsburgh, 2013
v
Overall, our results suggest that activation of M1 evokes within S1 a general increase in
excitatory and inhibitory synaptic activity that could contribute in a layer-specific manner to
state-dependent changes in S1. Our results further indicate that M1 may specifically engage sub-
circuits within S1 in order to differentially regulate particular downstream cortical and
subcortical processing centers.
vi
TABLE OF CONTENTS
PREFACE .................................................................................................................................. XII
1.0 INTRODUCTION ............................................................................................................... 1
1.1 SOMATOSENSORY SYSTEM IN RODENTS: THE WHISKER-BARREL
SYSTEM ................................................................................................................................ 2
1.1.1 Lemniscal pathway .......................................................................................... 2
1.1.2 Paralemniscal pathway .................................................................................... 5
1.1.3 Cortical feedback ............................................................................................. 6
1.2 LAMINAR AND CELLULAR PROPERTIES OF PRIMARY
SOMATOSENSORY CORTEX ......................................................................................... 8
1.2.1 Basic laminar organization ............................................................................. 9
1.2.2 Cellular organization within S1 .................................................................... 10
1.3 INTEGRATION OF SENSORY AND MOTOR PATHWAYS IN THE
RODENT VIBRISSAL SYSTEM ..................................................................................... 13
1.3.1 Structure and function of the rodent vibrissal motor system and the
control of whisking behavior ..................................................................................... 13
1.3.2 Anatomical connections between vibrissal motor and sensory systems .... 16
1.3.3 Influence of whisker movements on sensory processing ............................ 18
1.4 OVERVIEW .............................................................................................................. 20
vii
2.0 MOTOR CORTEX BROADLY ENGAGES EXCITATORY AND INHIBITORY
NEURONS IN SOMATOSENSORY BARREL CORTEX .................................................... 21
2.1 ABSTRACT ............................................................................................................... 21
2.2 INTRODUCTION ..................................................................................................... 22
2.3 METHODS ................................................................................................................. 24
2.4 RESULTS ................................................................................................................... 31
2.5 DISCUSSION ............................................................................................................. 45
3.0 DISTINCT INTRINSIC PROPERTIES AND M1 INPUT TO INFRAGRANULAR S1
PYRAMIDAL NEURONS PROJECTING TO DIFFERENT TARGETS ........................... 56
3.1 ABSTRACT ............................................................................................................... 56
3.2 INTRODUCTION ..................................................................................................... 57
3.3 METHODS ................................................................................................................. 58
3.4 RESULTS ................................................................................................................... 63
3.5 DISCUSSION ............................................................................................................. 79
4.0 GENERAL DISCUSSION ................................................................................................ 86
4.1 SUMMARY OF FINDINGS ..................................................................................... 86
4.2 EFFECTS OF M1 ACTIVATION ON S1 CIRCUITS .......................................... 87
4.2.1 Differential contributions of FS and SOM inhibitory interneurons ......... 87
4.2.2 M1 contribution to state-dependent changes in S1 neurons ...................... 88
4.3 M1 REGULATION OF CORTICAL AND SUBCORTICAL S1 PROJECTIONS
89
4.3.1 M1-S1 reciprocal circuitry ............................................................................ 89
4.3.2 M1 influence on cortical feedback to VPM ................................................. 92

viii
4.3.3 Cortical regulation of PoM and Sp5 circuits ............................................... 93
4.4 GENERAL IMPLICATIONS .................................................................................. 94
APPENDIX A .............................................................................................................................. 96
BIBLIOGRAPHY ..................................................................................................................... 127

ix
LIST OF TABLES
Table 1. Intrinsic properties of S1 pyramidal neurons .................................................................. 71
Table 2. Summary of cell counts ................................................................................................ 108
Table 3. Cell properties at P11 and P32+ ................................................................................... 109

x
LIST OF FIGURES
Figure 1.1 Sensory pathways of the whisker-barrel system ........................................................... 4
Figure 1.2 Motor and sensorimotor pathways of the whisker-barrel system. ............................... 15
Figure 2.1 Injection of ChR2-mCherry viral vector produces extensive labeling of M1 axons
within S1. ...................................................................................................................................... 32
Figure 2.2 Optical stimulation of ChR2-expressing M1 axon terminals (ChR2-M1) results in
time-locked excitatory responses in S1 neurons. .......................................................................... 34
Figure 2.3 M1 contacts three major cell types in S1. .................................................................... 36
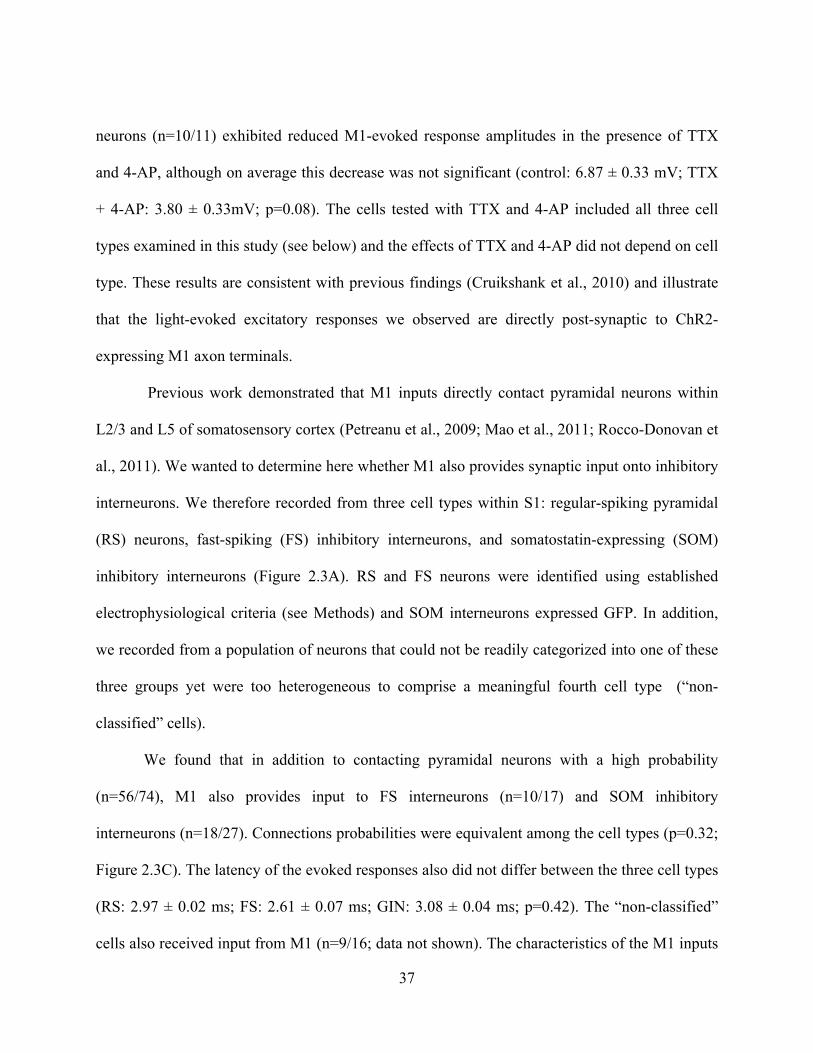
Figure 2.4 Responses to ChR2-M1 optical stimulation exhibit cell type dependent short-term
synaptic dynamics. ........................................................................................................................ 39
Figure 2.5 Optical stimulation of ChR2-M1 terminals evokes widespread disynaptic inhibition in
RS cells, FS cells, and SOM cells within S1 ................................................................................ 41
Figure 2.6 M1 inputs to excitatory and inhibitory neurons in S1 exhibit similar laminar
distributions. ................................................................................................................................. 43
Figure 2.7 Optical stimulation of ChR2-expressing M1 terminals within S1 evokes stronger
responses in L6 cells than in L5 cells. .......................................................................................... 46
Figure 3.1 Laminar position of S1 pyramidal neurons in L5 and L6 is organized by projection
target ............................................................................................................................................. 65
Figure 3.2 Examples of firing properties for S1 pyramidal neuron populations. ......................... 67

xi
Figure 3.3 Comparison of intrinsic properties between S1 pyramidal neurons populations.. ...... 69
Figure 3.4 M1 input to L5A M1-, Sp5-, and PoM-projecting neurons is equivalent. .................. 73
Figure 3.5 M1 provides strong input to L5/6 M1-projecting neurons and weak input to VPM-
projecting neurons.. ....................................................................................................................... 75
Figure 3.6 Optical stimulation of ChR2-M1 terminals evoked suprathreshold responses in
multiple types of S1 pyramidal neurons. ...................................................................................... 77
Figure 3.7 Activation of M1 primarily modulates L5B and upper L6 of S1. ............................... 80
Figure 4.1 Schematic illustrating M1-S1 circuit interactions. ...................................................... 91

xii
PREFACE
The reason I decided to come to the University of Pittsburgh for graduate school was
simple: I wanted to learn how to become a scientist. I am very grateful to the Center for
Neuroscience and the Neurobiology department for creating a wonderful environment to help
their students to learn and grow into neuroscientists.
The people I would like to thank first are my advisors, Dr. Erika Fanselow and Dr. Dan
Simons. I am so grateful that Dr. Fanselow took me on as a graduate student, the dedication of
her time and energy to my scientific career has meant so much to me. Her encouragement and
support allowed me to continue to grow and pursue new things in the lab. To Dr. Simons, I feel
privileged to have the opportunity to learn from such an amazing scientist. Perhaps even more
importantly, Dr. Simons is a wonderful teacher and I have learned many things from him that I
plan to take with me as I move forward.
I would like to next thank the rest of my thesis committee for all of your help the last few
years. Dr. Elias Aizenman, my committee chair, for always being interested in helping me and
making sure to keep things on track and moving forward. Dr. Brent Doiron, I thank you for being
a wonderful source of insight and support over the last several years. Dr. Anne-Marie Oswald
has been great help regarding experiments and data, even before officially joining my thesis
committee. Finally, thank you to Dr. Asaf Keller for traveling to serve as my external examiner;
it is an honor to have you serve on my committee.

xiii
I would like to thank my parents, Joan and Dennis, and my sister, Laura, for their pride
and support in me. I thank my friends, Caitlin Moyer and Erin Kirschmann, who have helped
make these years enjoyable. Lastly, I thank my boyfriend, Sashi Marella, for his constant love,
support, and understanding over the last several years.
1
1.0 INTRODUCTION
During exploration, rats and mice use their whiskers to investigate novel objects and
environments, in much the same way primates use their fingertips to discern the size, texture, and
shape of objects (Carvell and Simons, 1990). This behavior requires the integration of sensory
and motor information, as rodents actively sweep their whiskers back and forth in a motor
behavior known as ‘whisking’ in order to touch and palpate objects. How this behavior is
governed by sensory and motor systems within the central nervous system is a matter of active
research.
A detailed understanding of the underlying structure between the sensory and motor
pathways is not well understood, making it difficult to determine how these two systems interact
dynamically with one another during active touch. In this thesis we focus on the projection from
primary motor cortex (M1) to primary somatosensory cortex (S1), examining M1 synapses onto
specific cell types in S1. The first part of this introduction will focus primarily on the rodent
vibrissal sensory systems and sensory processing within S1, whereas the second part will
incorporate information about the motor system and its connections with the sensory pathways to
provide an overall picture of how sensorimotor integration is organized within the rodent
somatosensory system.

2
1.1 SOMATOSENSORY SYSTEM IN RODENTS: THE WHISKER-BARREL
SYSTEM
Whisker-related sensory information ascends through several stages in the brain,
beginning with peripheral innervation of the whisker pad, through the brainstem and thalamus,
before finally reaching the cortex. Although the fundamental sensory processing seems to occur
as information passes from peripheral to central centers, additional structures are interconnected
with these sensory pathways, resulting in a series of converging and diverging pathways that can
form direct and indirect ‘loops’ between and among areas. The whisker-barrel system as a whole
is comprised of multiple, parallel pathways that have distinct input-output organization and
likely serve different roles in processing of whisker-related sensory input. Much progress has
been made in deciphering the contribution of each structure to sensory processing, although an
overall understanding remains elusive in large part because we have yet to elucidate critically
important details of the circuitry.
1.1.1 Lemniscal pathway
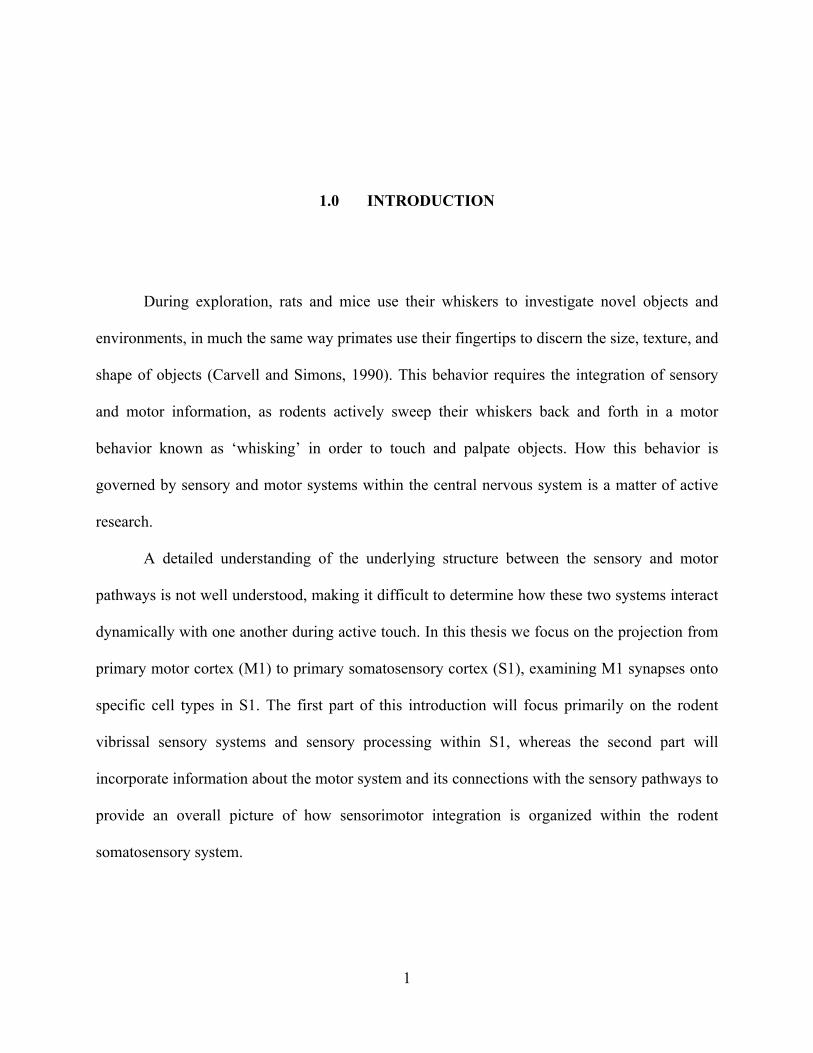
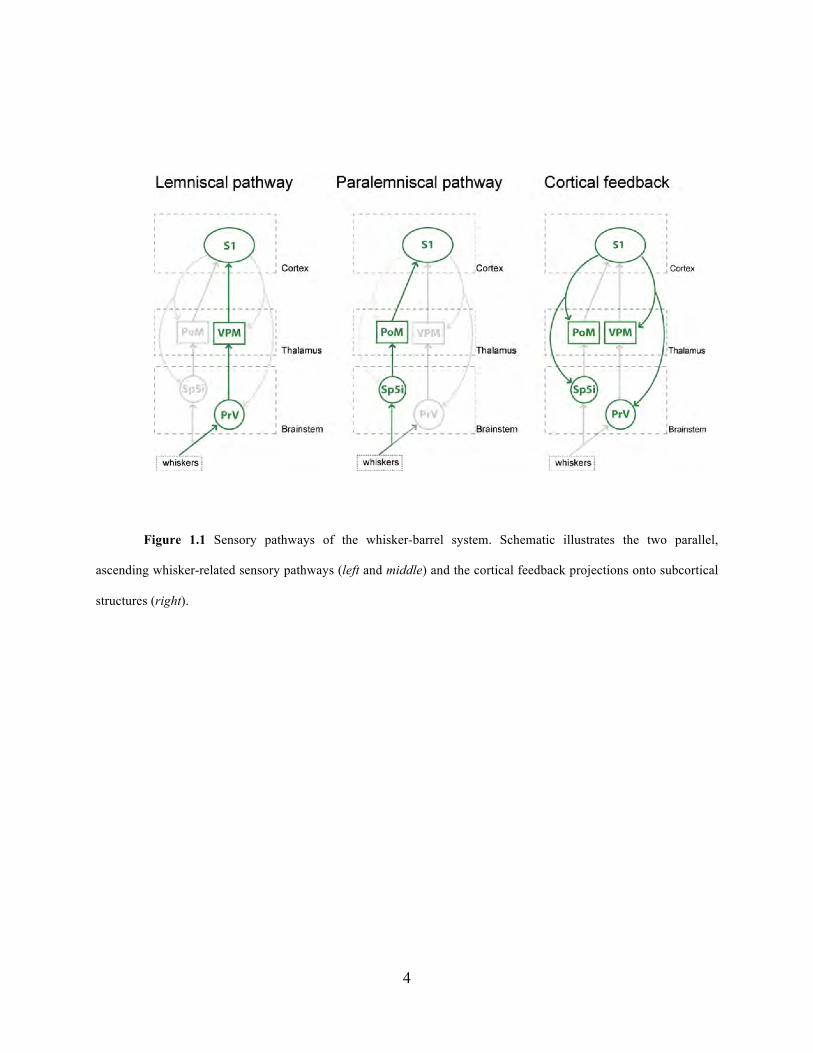
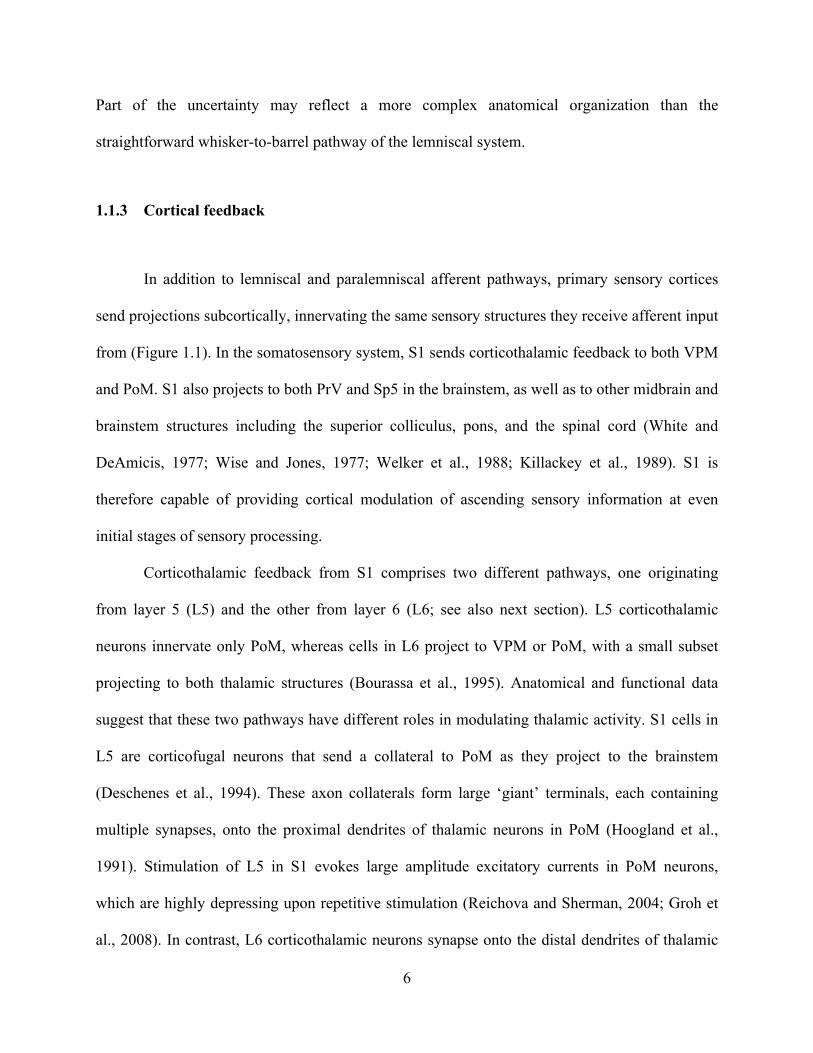
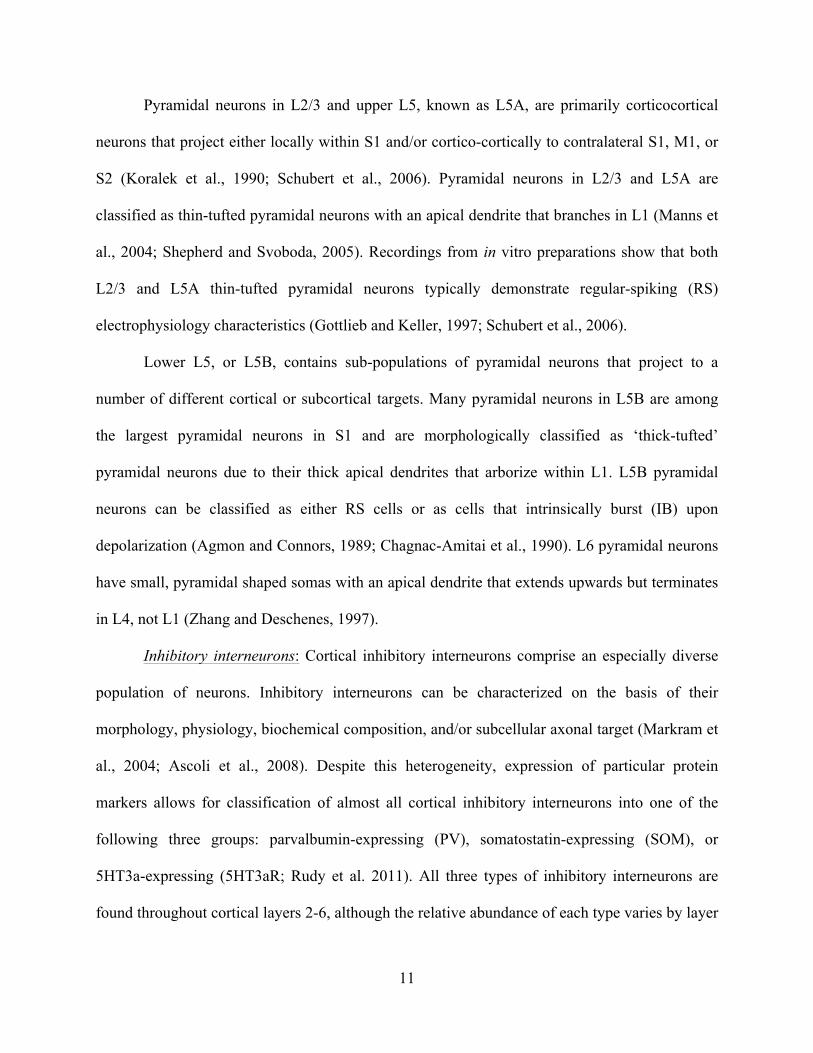
The primary whisker-related sensory pathway, known as the lemniscal system (Figure
1.1), begins at the whisker follicle, which is directly innervated via the infraorbital nerve by
primary afferent neurons residing in the trigeminal ganglion. The trigeminal ganglion cells carry
information to the brainstem, where they synapse onto neurons in the principal nucleus of the
trigeminal nuclei (PrV). From PrV, signals are transmitted to the ventral posterior medial (VPM)
thalamic nucleus. Finally, VPM axons innervate the primary somatosensory cortex (S1).
3
Topographic representations of the whisker pad that are anatomically well defined (e.g. cortical
‘barrels’) are found at each stage in the lemniscal pathway.
Because of this topography, neurons throughout the lemniscal pathway respond robustly
when a sensory stimulus is applied to individual whiskers. Primary afferent trigeminal neurons
respond at a short-latency to deflection of a single whisker and have a strong preference for the
direction, amplitude, and velocity of the whisker deflection, indicating the ability of the system
to reliably encode the mechanical details of sensory stimuli applied to the animal’s face (Zucker
and Welker, 1969; Jones et al., 2004; Kwegyir-Afful et al., 2008). Neurons in PrV that project to
VPM also exhibit robust whisker responses and directional tuning, but compared with trigeminal
neurons they have larger receptive fields although they still respond most robustly to a principal
whisker (Minnery and Simons, 2003). The response properties of VPM neurons are similar to
those of PrV neurons, the main source of afferent drive to VPM, except that VPM neurons have
lower response magnitude to whisker deflections (Minnery et al., 2003). Sensory responses
undergo a substantial transformation from VPM to S1, as layer 4 excitatory neurons in S1 barrels
have less robust whisker-evoked sensory responses, smaller receptive fields, and considerably
less or no amplitude sensitivity compared to VPM neurons (Simons and Carvell, 1989; Bruno
and Simons, 2002; Pinto et al., 2003).
Throughout the lemniscal system, information from whiskers is relayed in a spatially and
temporally precise manner, with response transformations occurring at each processing center.
Although we have learned much about the anatomy and response properties of each structure,
understanding the overall function of the system and its regulation by connections with other
pathways (see next section) is still incomplete.
4
Figure 1.1 Sensory pathways of the whisker-barrel system. Schematic illustrates the two parallel,
ascending whisker-related sensory pathways (left and middle) and the cortical feedback projections onto subcortical
structures (right).
5
1.1.2 Paralemniscal pathway
A second system involved in whisker processing, known as the paralemniscal system,
also travels via the brainstem, thalamus, and cortex (Figure 1.1). Axons from trigeminal ganglion
neurons synapse in another trigeminal nucleus in addition to PrV, the interpolaris division of the
spinal trigeminal nucleus (Sp5i). Sp5i projects to the posteromedial (PoM) thalamic nucleus, and
PoM neurons project to S1 as well as to primary motor cortex (M1; see later section).
In contrast to the lemniscal pathway, neurons in the paralemniscal system do not
faithfully encode details of sensory stimuli applied to the whisker pad. Neurons in Sp5i that
project to the thalamus have large, multi-whisker receptive fields (Jacquin et al., 1986; Furuta et
al., 2010). In PoM, despite receiving substantial input from Sp5i, thalamic neurons respond
weakly to whisker deflection and at long latencies (Diamond et al., 1992a; Masri et al., 2008). In
fact, in contrast to neurons in VPM, which derive most of their sensory properties from
ascending brainstem input, sensory responses of PoM neurons instead are thought to depend on
cortical input from S1 (Diamond et al., 1992b).
Due to these unusual features, the role of the paralemniscal pathway in sensory
processing has remained largely unclear. Activity of neurons in Sp5i and PoM is highly state
dependent, through mechanisms that involve cholinergic modulation (Timofeeva et al., 2005;
Masri et al., 2006), inhibitory projections via the zona incerta (Trageser and Keller, 2004;
Lavallee et al., 2005; Trageser et al., 2006), and cortical feedback (Guillery and Sherman 2011;
see next sections). The pathway has also been implicated to play an important role in processing
high intensity or pain information in models of central pain syndrome (Masri et al., 2009). The
function of the paralemniscal pathway may therefore depend on the behavior state of the animal.
6
Part of the uncertainty may reflect a more complex anatomical organization than the
straightforward whisker-to-barrel pathway of the lemniscal system.
1.1.3 Cortical feedback
In addition to lemniscal and paralemniscal afferent pathways, primary sensory cortices
send projections subcortically, innervating the same sensory structures they receive afferent input
from (Figure 1.1). In the somatosensory system, S1 sends corticothalamic feedback to both VPM
and PoM. S1 also projects to both PrV and Sp5 in the brainstem, as well as to other midbrain and
brainstem structures including the superior colliculus, pons, and the spinal cord (White and
DeAmicis, 1977; Wise and Jones, 1977; Welker et al., 1988; Killackey et al., 1989). S1 is
therefore capable of providing cortical modulation of ascending sensory information at even
initial stages of sensory processing.
Corticothalamic feedback from S1 comprises two different pathways, one originating
from layer 5 (L5) and the other from layer 6 (L6; see also next section). L5 corticothalamic
neurons innervate only PoM, whereas cells in L6 project to VPM or PoM, with a small subset
projecting to both thalamic structures (Bourassa et al., 1995). Anatomical and functional data
suggest that these two pathways have different roles in modulating thalamic activity. S1 cells in
L5 are corticofugal neurons that send a collateral to PoM as they project to the brainstem
(Deschenes et al., 1994). These axon collaterals form large ‘giant’ terminals, each containing
multiple synapses, onto the proximal dendrites of thalamic neurons in PoM (Hoogland et al.,
1991). Stimulation of L5 in S1 evokes large amplitude excitatory currents in PoM neurons,
which are highly depressing upon repetitive stimulation (Reichova and Sherman, 2004; Groh et
al., 2008). In contrast, L6 corticothalamic neurons synapse onto the distal dendrites of thalamic
7
neurons in VPM and PoM (Hoogland et al., 1991). These synapses are small, and the excitatory
responses in VPM and PoM neurons are weak but facilitating (Reichova and Sherman, 2004;
Landisman and Connors, 2007).
These results in the somatosensory system are consistent across primary and higher-order
thalamic nuclei in other sensory systems and may reflect two different functions for L5 versus
L6 corticothalamic projections It has been proposed that corticothalamic inputs from L5 act as
‘driver’ and L6 corticothalamic input as ‘modulator’ inputs (reviewed in Sherman 2005). When
viewed from a hierarchical perspective, the L5 corticothalamic pathway may be considered as a
“feedforward” pathway, and L6 corticothalamic inputs to be a “feedback” system (Hoogland et
al., 1991).
Despite growing evidence regarding the anatomy and synaptic organization of
corticothalamic feedback, the contribution of each corticothalamic pathway in sensory
processing is unclear. When S1 is inactivated the sensory responses of PoM neurons are largely
eliminated; in contrast, the fundamental response properties of VPM neurons remain largely
unaffected when S1 is inactivated (Diamond et al., 1992b; Ghazanfar et al., 2001). Interestingly,
the majority of L6 corticothalamic neurons that project to VPM are silent in vivo, exhibiting no
spontaneous or whisker-evoked responses (Swadlow, 1989; Swadlow and Hicks, 1996), although
they do possess subthreshold whisker-related receptive fields (Kwegyir-Afful and Simons,
2009). Pharmacologically increasing the activity of neurons in L6 of S1 results in enhanced
sensory responses in aligned barreloids and suppression of activity in non-aligned barreloids
(Temereanca and Simons, 2004). This suggests that when engaged, cortical feedback to VPM
does modify ascending sensory inputs in thalamocortical circuits. L6 corticothalamic neurons
may be activated by long-range cortical inputs that target the deep layers, such as M1 (Lee et al.,
8
2008), although the exact circuit mechanisms are still unknown. This is one of the issues we will
address in this thesis.
Corticofugal neurons in S1 send projections to both Sp5i and PrV in the brainstem (Wise
and Jones, 1977; Welker et al., 1988). Little is known about the anatomy or function of the
projection from S1 to PrV. The projection from S1 to Sp5i is topographically organized, and S1
corticotrigeminal neurons specifically contact multi-whisker neurons in the corresponding
barrelette within Sp5i (Welker et al., 1988; Furuta et al., 2010). S1 is therefore situated to
modulate the earliest stages of afferent sensory processing in both the paralemniscal and
lemniscal pathways via its projections to Sp5i and PrV, respectively.
1.2 LAMINAR AND CELLULAR PROPERTIES OF PRIMARY SOMATOSENSORY
CORTEX
Primary sensory cortices, including S1, share a common, ‘canonical’ columnar
organization (reviewed in Douglas and Martin 2004). In whisker-barrel cortex, a cortical column
is defined morphologically as the ‘barrel’ structure within L4 as well as the supragranular layers
above the barrel and the infragranular layers below. Functionally, neurons within a barrel-related
column respond maximally or only to the same principal whisker, which corresponds
anatomically to the layer 4 barrel (Simons, 1978). Processing of complex information from the
whisker array is accomplished by interactions within and among these columnar entities.
9
1.2.1 Basic laminar organization
As discussed above, S1 receives thalamocortical input via the lemniscal pathway from
VPM. Thalamocortical terminals from VPM heavily innervate S1 within layer 4 (L4) where they
terminate densely within the topographically aligned barrel (Bernardo and Woolsey, 1987;
Jensen and Killackey, 1987; Land et al., 1995). Neurons in L4 project to the superficial laminae,
layers 2 and 3 (L2/3), above the barrel. Pyramidal neurons in L2/3 are primarily corticocortical,
and have an axon that either projects horizontally to superficial layers of other cortical areas,
and/or descends into L5 within the same barrel-related column (Feldmeyer et al., 2006). L5
contains a diversity of pyramidal neurons, the majority of which project out of the cortex to the
striatum, thalamus, and/or brainstem, among other targets (Wise and Jones, 1977; Killackey et
al., 1989). Finally, L6 receives some excitatory input from L4 and L5 within the same column,
but most local excitatory inputs are from other L6 neurons (Zarrinpar and Callaway, 2006; Llano
and Sherman, 2009; Tanaka et al., 2011). Approximately half of L6 neurons project to either
VPM or PoM, as discussed above, and the other half project to other cortical areas, such as M1
or S2.
In addition to thalamocortical input from VPM, S1 is the recipient of many other
extrinsic sources of excitatory input from both subcortical and cortical sources. Input from non-
VPM external sources (e.g. PoM) largely avoids barrel centers, and instead targets either
superficial and/or deep layers in S1 or the inter-barrel septa in layer 4. Thalamocortical axons
from PoM neurons heavily target L5A and L1 (Koralek et al., 1988; Wimmer et al., 2010). S1 is
reciprocally connected with other cortical areas, in particular secondary somatosensory cortex
(Carvell and Simons, 1987) and primary motor cortex (M1; see next section), that in turn send
strong projections to L5 and L6 in S1 (Zhang and Deschenes, 1998).

10
1.2.2 Cellular organization within S1
Each cortical layer is populated by a diversity of cell types. The intrinsic and network
properties of these neurons form the basis for the sensory transformations that occur within each
layer. Cortical neurons can be broadly classified as either excitatory or inhibitory neurons, with
approximately 80% of cortical cells being excitatory and the remaining 20% inhibitory.
Excitatory neurons are the main projection neurons of the cortex and are responsible for
transmitting information locally, intracortically, and subcortically. Cortical inhibitory neurons
usually project locally, either within or across layers in S1. The role of each specific cell type in
cortical processing is still unclear, however a wealth of information exists describing the
morphology, physiology, and synaptic properties of the different types of cortical neurons.
Excitatory neurons: Each cortical layer in S1 contains a different composition of
excitatory neurons (Lefort et al. 2009; reviewed in Feldmeyer 2012). Excitatory neurons in L4
are unique as they are primarily spiny stellate neurons, having a round soma and radially
extending dendritic processes (Lubke et al., 2000). These cells receive primarily thalamocortical
input from VPM and recurrent excitatory inputs from other L4 neurons (Petersen and Sakmann,
2000); most L4 spiny stellate cells then project to superficial layers. In contrast, the majority of
excitatory neurons in cortical layers 2/3, 5, and 6 exhibit pyramidal neuron morphology, with a
triangular-shaped soma and prominent apical dendrite that extends upwards toward superficial
layers. Pyramidal neurons in each layer have a rich diversity of features that are often dependent
on the projection target of the neuron. The axonal target of a pyramidal neuron is, arguably, its
defining characteristic as the morphology, physiology, and circuit behavior all depend on the
cell’s projection target (reviewed in Brown and Hestrin 2009).
11
Pyramidal neurons in L2/3 and upper L5, known as L5A, are primarily corticocortical
neurons that project either locally within S1 and/or cortico-cortically to contralateral S1, M1, or
S2 (Koralek et al., 1990; Schubert et al., 2006). Pyramidal neurons in L2/3 and L5A are
classified as thin-tufted pyramidal neurons with an apical dendrite that branches in L1 (Manns et
al., 2004; Shepherd and Svoboda, 2005). Recordings from in vitro preparations show that both
L2/3 and L5A thin-tufted pyramidal neurons typically demonstrate regular-spiking (RS)
electrophysiology characteristics (Gottlieb and Keller, 1997; Schubert et al., 2006).
Lower L5, or L5B, contains sub-populations of pyramidal neurons that project to a
number of different cortical or subcortical targets. Many pyramidal neurons in L5B are among
the largest pyramidal neurons in S1 and are morphologically classified as ‘thick-tufted’
pyramidal neurons due to their thick apical dendrites that arborize within L1. L5B pyramidal
neurons can be classified as either RS cells or as cells that intrinsically burst (IB) upon
depolarization (Agmon and Connors, 1989; Chagnac-Amitai et al., 1990). L6 pyramidal neurons
have small, pyramidal shaped somas with an apical dendrite that extends upwards but terminates
in L4, not L1 (Zhang and Deschenes, 1997).
Inhibitory interneurons: Cortical inhibitory interneurons comprise an especially diverse
population of neurons. Inhibitory interneurons can be characterized on the basis of their
morphology, physiology, biochemical composition, and/or subcellular axonal target (Markram et
al., 2004; Ascoli et al., 2008). Despite this heterogeneity, expression of particular protein
markers allows for classification of almost all cortical inhibitory interneurons into one of the
following three groups: parvalbumin-expressing (PV), somatostatin-expressing (SOM), or
5HT3a-expressing (5HT3aR; Rudy et al. 2011). All three types of inhibitory interneurons are
found throughout cortical layers 2-6, although the relative abundance of each type varies by layer

12
(Lee et al., 2010). Of these three groups, PV and SOM interneurons have been most extensively
described; our understanding of 5HTaR neurons is more limited, and they will not be further
discussed here.
PV and SOM inhibitory interneurons have many differences, but one of the most
functionally relevant may be the differential subcellular location of their inhibitory inputs onto
pyramidal neurons. PV interneurons have basket cell morphology, with multipolar dendritic trees
and an axon that ramifies extensively within the same layer (Kawaguchi, 1993). Their axon
innervates the soma and proximal dendrite of nearby pyramidal neurons (Somogyi et al., 1983;
Wang et al., 2002). On the other hand, though SOM interneurons are also multipolar and have
locally arborizing dendrites, their axons travel vertically and synapse within L1 on the distal
apical dendrites of pyramidal neurons (Kawaguchi and Kubota, 1996; Wang et al., 2004).
Therefore, within a cortical column PV and SOM cells constitute primary sources of somatic and
dendritic inhibition, respectively, onto pyramidal neurons.
PV and SOM inhibitory interneurons have unique cellular and synaptic properties that are
likely related to their function in vivo. PV cells (hereafter referred to as ‘fast-spiking’ or FS cells)
can be distinguished on the basis of their narrow, or ‘fast-spiking’, action potential waveform. FS
cells are less excitable than SOM interneurons based on their intrinsic properties as they have
lower input resistance, more hyperpolarized resting membrane potentials, and higher voltage
thresholds for action potential initiation (Beierlein et al., 2003; Fanselow et al., 2008). FS cells
also receive larger unitary inputs than SOM cells from thalamocortical axons and local
corticocortical neurons (Bartley et al., 2008). However, upon repetitive stimulation, excitatory
synapses onto FS cells exhibit strong synaptic depression, whereas excitatory synapses onto
SOM interneurons show synaptic facilitation (Reyes et al., 1998; Beierlein et al., 2003; Fanselow
13
et al., 2008). An issue that we address in this thesis is whether these cell types differ similarly
with respect to their M1 synaptic inputs.
While extensive work has characterized the local connectivity patterns of FS and SOM
interneurons (for review see Thomson and Lamy 2007), much less is known about the extrinsic
sources of excitatory input to inhibitory interneurons, with the exception of thalamocortical input
from VPM. For example, do inhibitory interneurons receive direct, long-range excitatory
corticocortical inputs? If so, do the same synaptic properties apply to these inputs as with local
excitatory and thalamocortical inputs? Here, we have addressed these questions with regard to
one source of long-range cortical input, that from M1.
1.3 INTEGRATION OF SENSORY AND MOTOR PATHWAYS IN THE RODENT
VIBRISSAL SYSTEM
1.3.1 Structure and function of the rodent vibrissal motor system and the control of
whisking behavior
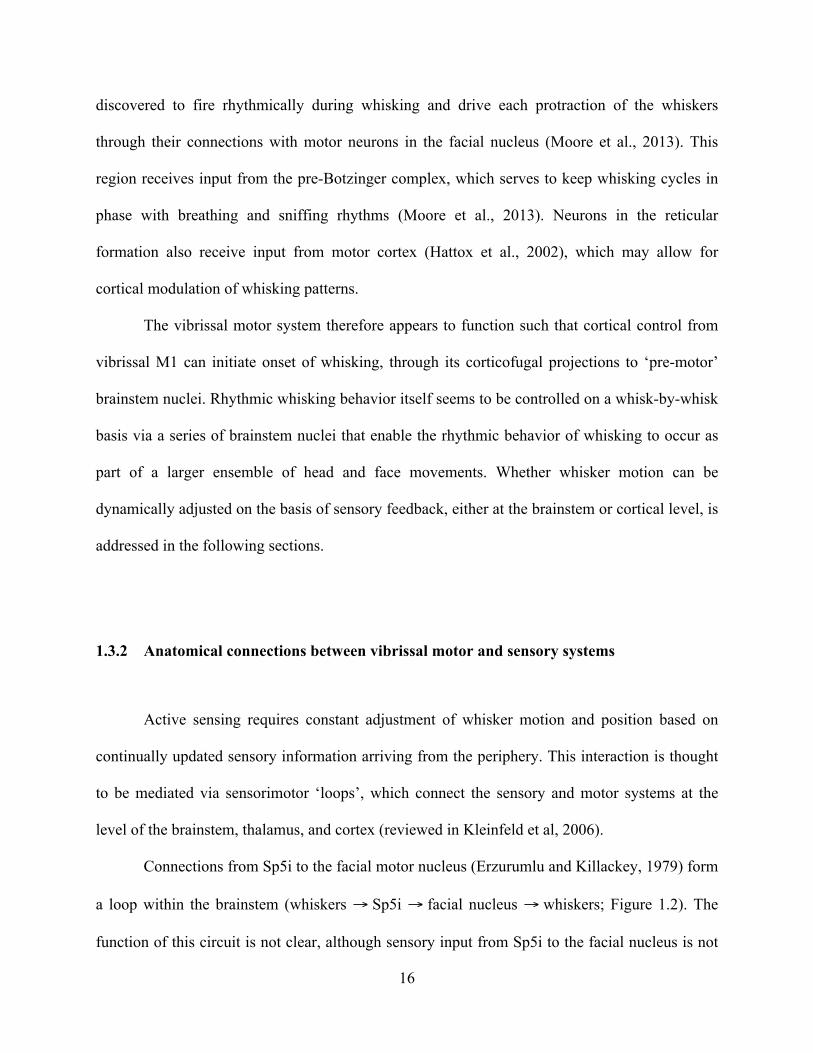
The motor cortex of the rodent contains a disproportionately large region representing the
face and whiskers, illustrating the importance of whisker movements in behavior. Electrical
stimulation of vibrissal M1 can evoke whisker movements, even upon activation of only a single
M1 neuron (Brecht et al., 2004). Anatomical tracing has revealed connections between vibrissal
M1 and several subcortical structures implicated in the generation and maintenance of motor
behavior (Figure 1.2), including the ventral lateral thalamus, superior colliculus, caudate and
14
putatmen, pons, and multiple brainstem nuclei (Porter and White, 1983; Miyashita et al., 1994;
Hattox et al., 2002).
Physiological evidence indicates that activity in vibrissal M1 is correlated with whisker
movement, as the firing rate of M1 neurons increases during whisking bouts. Activity in M1
actually increases just prior to whisking onset, indicating a possible role of M1 in the generation,
or initiation, of whisking (Carvell et al., 1996; Friedman et al., 2006). Activity in vibrissal M1
neurons, however, does not obviously correlate with parameters of whisker motion on a cycle-
by-cycle basis (Carvell et al. 1996; Friedman et al. 2012; but see also Hill et al. 2011); this could
depend on both the area within M1 (Smith and Alloway, 2013) and the types of pyramidal
neurons being recorded (Beloozerova et al., 2003). This raises the question of whether vibrissal
M1 directly controls individual whisker movements. Rhythmic whisking persists after
inactivation of vibrissal M1, although whisking kinetics are altered (Semba and Komisaruk,
1984; Gao et al., 2003). This suggests that rhythmic whisker movements are not directly under
control of M1 and are instead generated subcortically by a central pattern generator (CPG) in the
brainstem (Gao et al., 2001; Cramer and Keller, 2006; Cramer et al., 2007).
Muscle contractions producing whisker movement are under the control of motor neurons
in the facial motor nucleus. Direct M1 projections to motor neurons in the facial nucleus exist,
but are sparse (Grinevich et al., 2005). Most M1 corticofugal axons instead innervate other
brainstem nuclei, such as the reticular nucleus, that in turn innervate the facial motor nucleus
(Miyashita et al., 1994; Hattox et al., 2002). Recent attempts to identify a brainstem CPG
network for whisking has focused on the interactions of whisking and other head and neck
motions, such as breathing, sniffing, and licking (reviewed in Deschenes et al, 2012). Neurons in
a small region of the brainstem, the intermediate band of the reticular formation, were recently

15
Figure 1.2 Motor and sensorimotor pathways of the whisker-barrel system. Schematic illustrating descending
projections of the vibrissal motor system (left) and interconnections between the sensory and motor pathways
(right). Dashed line indicates sparse anatomical connections.
16
discovered to fire rhythmically during whisking and drive each protraction of the whiskers
through their connections with motor neurons in the facial nucleus (Moore et al., 2013). This
region receives input from the pre-Botzinger complex, which serves to keep whisking cycles in
phase with breathing and sniffing rhythms (Moore et al., 2013). Neurons in the reticular
formation also receive input from motor cortex (Hattox et al., 2002), which may allow for
cortical modulation of whisking patterns.
The vibrissal motor system therefore appears to function such that cortical control from
vibrissal M1 can initiate onset of whisking, through its corticofugal projections to ‘pre-motor’
brainstem nuclei. Rhythmic whisking behavior itself seems to be controlled on a whisk-by-whisk
basis via a series of brainstem nuclei that enable the rhythmic behavior of whisking to occur as
part of a larger ensemble of head and face movements. Whether whisker motion can be
dynamically adjusted on the basis of sensory feedback, either at the brainstem or cortical level, is
addressed in the following sections.
1.3.2 Anatomical connections between vibrissal motor and sensory systems
Active sensing requires constant adjustment of whisker motion and position based on
continually updated sensory information arriving from the periphery. This interaction is thought
to be mediated via sensorimotor ‘loops’, which connect the sensory and motor systems at the
level of the brainstem, thalamus, and cortex (reviewed in Kleinfeld et al, 2006).
Connections from Sp5i to the facial motor nucleus (Erzurumlu and Killackey, 1979) form
a loop within the brainstem (whiskers → Sp5i → facial nucleus → whiskers; Figure 1.2). The
function of this circuit is not clear, although sensory input from Sp5i to the facial nucleus is not
17
required to activate the brainstem CPG network, as severing the trigeminal nerve does not affect
the generation or patterning of whisking (Gao et al., 2001).
M1 and S1 are connected directly via reciprocal corticocortical connections and
indirectly via their reciprocal connections with the thalamic nucleus PoM (Figure 1.2).
Corticothalamic inputs to PoM are branches of axons traveling to subcortical centers, as
mentioned earlier, suggesting that the indirect transthalamic pathway via PoM may integrate
information from M1 and S1 regarding subcortical commands (Sherman and Guillery, 2011).
Reciprocal corticocortical connections between M1 and S1 follow a pattern seen
commonly throughout the cerebral cortex. That is, S1 innervates primarily the middle layers of
M1, L2/3 and L5A (Aronoff et al., 2010), whereas M1 input to S1 avoids the middle layers,
instead terminating in L5/6 and L1 (Veinante and Deschenes, 2003). It has been suggested that
pathways targeting middle layers are the stronger ‘feedforward’ inputs, and those avoiding
middle layers represent a ‘feedback’ projection (Felleman and Van Essen, 1991). According to
this hierarchical cortical model, information should flow primarily from S1 to M1, with the M1
to S1 projection being weaker and modulatory. Evidence supporting this model in the barrel
system shows that sensory activity in the cortex is propagated from S1 to M1 (Ferezou et al.,
2007). S1 may therefore help regulate whisking behavior via its projection to M1. The function
of the feedback pathway from M1 to S1 is less clear, and will be further discussed below.
Recent advances in optogenetics technology have allowed for the selective activation of
specific populations of synaptic input. This approach has yielded important findings regarding
the excitatory circuits that connect S1 and M1. A recent study combined optogenetics with
retrograde tracers and found that S1 inputs to M1 are most prevalent in the superficial layers of

18
M1 (Aronoff et al., 2010; Mao et al., 2011), providing especially strong input to S1-projecting
neurons in L2/3 and L5A (Mao et al., 2011).
Both callosal and corticofugal neurons in the infragranular layers of M1 project to S1
(Veinante and Deschenes, 2003). Callosal fibers terminate within L5/6 and L1 of S1, whereas
corticofugal neurons only terminate within L1. Individual pyramidal neurons in L2/3 and L5
receive input from M1 on both the basal dendrites, near the soma, and the apical dendrite in L1
(Petreanu et al., 2009). Here, using similar optogenetic techniques, we determine the laminar
dependence of M1 input to S1 neurons, and also investigate the differential input from M1 onto
several types of excitatory and inhibitory interneurons within S1.
1.3.3 Influence of whisker movements on sensory processing
The animal gathers sensory information either passively, when whiskers incidentally
contact an object, or actively when whiskers are motorically brought into contact with an object.
The first behavior, passive touch, is a purely sensory process whereas the latter, active touch,
requires the integration of motor and sensory systems. Investigators have compared activity in
sensory structures during passive versus active touch to try to understand differences in sensory
processing that occurs in the two states and hence infer the role(s) of internally generated motor
commands to perception. Comparisons have yielded information about how sensory processing
is transformed when information is received passively versus accompanied by movement.
Furthermore, activity in M1 is state-dependent, as M1 neurons increase their firing prior to and
during whisking. However, given that sensory and motor systems interact at multiple levels, the
contribution of peripheral versus central mechanisms is not always clear. In addition, transitions
to whisking states also change the attentiveness of the animal, indicating a role for
19
neuromodulator systems in state-dependent changes in sensory processing (Castro-Alamancos,
2004).
One of the most common findings across species is that sensory responses are reduced
during the course of movement, a phenomenon known as ‘motor-gating’ (Chapin and
Woodward, 1982; Chapman, 1994). In the whisker system, sensory-evoked activity in VPM and
S1 is reduced during whisking (Fanselow and Nicolelis, 1999; Ferezou et al., 2006; Lee et al.,
2008). Recent work has demonstrated a role for Sp5i in gating sensory responses in PrV, as
inactivation of Sp5i abolishes the whisking-related reductions in VPM activity (Lee et al., 2008).
This suggests that whisking-related sensory activity may be suppressed within the brainstem and
this reduction is reflected in VPM and S1. How whisking modulates activity levels in Sp5i,
however, is not clear. Sp5i receives input from neuromodulator centers within the brainstem
(Timofeeva et al., 2005), as well as top-down cortical input from S1 and S2 (see previous
section), either of which could drive state-dependent changes in Sp5i neurons.
Besides reduced activity during whisking, S1 shows other state-dependent changes that
appear to originate centrally (Poulet and Petersen, 2008). Recordings from L2/3 pyramidal
neurons in S1 in vivo demonstrate striking changes in the dynamics of the subthreshold
membrane potential. Awake states wherein the animal is alert but not whisking are characterized
by low frequency, large amplitude fluctuations that occur synchronously in nearby pyramidal
neurons; upon start of whisking membrane potential dynamics de-correlate and transition to
higher frequency and lower amplitude fluctuations (Crochet and Petersen, 2006; Poulet and
Petersen, 2008). Activity of cortical inhibitory interneurons is also state-dependent, with FS and
SOM interneurons exhibiting decreased activity in whisking versus non-whisking states (Gentet

20
et al., 2010; Gentet et al., 2012). Other inhibitory interneurons, presumably 5HT3aR-expressing
interneurons, have increased activity during whisking (Gentet et al., 2010).
The mechanisms governing state-dependent changes in S1 are unknown, but could
involve effects of neuromodulator systems (Constantinople and Bruno, 2011), and/or changes in
thalamocortical or corticocortical inputs. Of those possibilities, the effects of state-dependent
changes in corticocortical activity remain the least understood. This is in part due to a lack of
knowledge regarding the detailed microcircuits involved in such connections. Here, we have
examined the cell type specific connections of one important cortical input to S1, that coming
from M1.
1.4 OVERVIEW
In this thesis, we investigate connections from M1 onto specific cell types in S1. The
study described in Chapter 2 tests the hypothesis that inhibitory interneurons are involved in
mediating M1 inputs to S1 and, additionally, examines the relative amount of M1 input to
different layers in S1. Appendix A contains a previous study by Dr. Fanselow and I on the
development of SOM-expressing inhibitory interneurons, which could serve as useful
background regarding SOM interneurons. The third chapter builds on findings from Chapter 2,
examining whether M1 inputs differentially target S1 pyramidal neurons on the basis of their
projection target. Overall, our findings demonstrate M1 inputs synapse broadly with many types
of S1 neurons, but that specific sub-circuits exist as a result of greater M1 input to certain types
of pyramidal neurons.

21
2.0 MOTOR CORTEX BROADLY ENGAGES EXCITATORY AND INHIBITORY
NEURONS IN SOMATOSENSORY BARREL CORTEX
2.1 ABSTRACT
Anatomical studies have shown that primary somatosensory (S1) and primary motor
(M1) cortices are reciprocally connected. The M1 to S1 projection is thought to represent a
modulatory signal that conveys motor-related information to S1. Here, we investigated M1
synaptic inputs to S1 by injecting an AAV virus containing channelrhodopsin-2 and a fluorescent
tag into M1. Consistent with previous results, we found labeling of M1 axons within S1 that was
most robust in the deep layers and in L1. Labeling was sparse in L4 and was concentrated in the
inter-barrel septa, largely avoiding barrel centers. In S1, we recorded in vitro from regular-
spiking excitatory neurons and fast-spiking and somatostatin-expressing inhibitory interneurons.
All three cell types had a high probability of receiving direct excitatory M1 input. Both
excitatory and inhibitory cells within L4 were the least likely to receive such input from M1.
Disynaptic inhibition was observed frequently, indicating that M1 recruits substantial inhibition
within S1. Additionally, a subpopulation of L6 regular-spiking excitatory neurons received
exceptionally strong M1 input. Overall, our results suggest that activation of M1 evokes within
S1 a bombardment of excitatory and inhibitory synaptic activity that could contribute in a layer-
specific manner to state-dependent changes in S1.

22
2.2 INTRODUCTION
During active touch sensory and motor-related signals are thought to interact in a fashion
that regulates on-going exploration and stimulus discriminability. In the rodent whisker system
the motor and somatosensory systems are intricately linked at the level of brainstem, thalamus,
and cortex (Kleinfeld et al., 2006), providing multiple mechanisms for sensorimotor integration.
At the cortical level, primary motor (M1) and primary somatosensory (S1) cortices are
reciprocally connected (White and DeAmicis, 1977; Porter and White, 1983), with the S1 to M1
connection thought to represent the “forward” pathway and M1 to S1 to represent the
“backward” pathway (Felleman and Van Essen, 1991; Cauller et al., 1998). In keeping with this
view, recent studies have demonstrated that the synaptic inputs from S1 to M1 are stronger than
those from M1 to S1 (Rocco-Donovan et al., 2011). In addition, sensory-evoked activity is first
present in S1 and subsequently propagated to M1 (Ferezou et al., 2007).
Functionally, the role of M1 inputs is hypothesized to play a ‘modulatory’ role within S1
by sending a copy of motor-related information that could alter processing of whisking-related
sensory information in S1 (Fee et al., 1997; Kleinfeld et al., 2006; Hill et al., 2011; Friedman et
al., 2012). Neurons in M1 are active prior to and during whisking (Carvell et al., 1996; Friedman
et al., 2006), at which time S1 neurons exhibit smaller responses to whisker deflection (Chapin
and Woodward, 1982; Fanselow and Nicolelis, 1999; Ferezou et al., 2007). In addition, pairs of
S1 neurons exhibit a reduction in membrane potential correlation relative to non-whisking states
(Poulet and Petersen, 2008). The peripheral and/or central origin of many of these state-
dependent changes in S1 is unclear; however, given the extensive reciprocal connectivity
between M1 and S1, whisking-associated changes in S1 firing could reflect direct M1 to S1
projections.

23
An understanding of M1-S1 interactions has been hindered by the inability to activate
selectively motor cortex inputs to S1. In reciprocally connected neural systems, commonly used
techniques involving electrical stimulation may be confounded by inadvertent antidromic
activation of cells in the target population via their locally recurrent axons. The recent
development of optogenetic tools allows for selective activation of neuronal populations that
project to a distant location, permitting investigation of the properties of their synaptic
connections. In addition, mapping of connectivity between M1 and S1 has so far focused solely
on inputs to excitatory neurons (Petreanu et al., 2009; Mao et al., 2011; Rocco-Donovan et al.,
2011). However, inhibitory interneurons can regulate the impact of excitatory inputs between
brain areas, such as thalamus to cortex, through feedforward inhibition (Simons and Carvell,
1989; Pouille and Scanziani, 2001; Swadlow, 2003; Gabernet et al., 2005). Inhibitory
interneurons comprise a diverse group (Markram et al., 2004; Ascoli et al., 2008), and the effect
of inhibition on sensory processing is dependent on the types of inhibitory interneurons involved
(Porter et al., 2001; Pouille and Scanziani, 2004; Lee et al., 2012; Wilson et al., 2012).
Here, we utilized an optogenetic approach combined with in vitro whole-cell recordings
to examine synaptic inputs from M1 onto specific classes of excitatory and inhibitory cells in S1.
We focused on three identified types of neurons in S1: regular-spiking (RS) pyramidal neurons,
fast-spiking (FS) inhibitory interneurons, and somatostatin-expressing (SOM) inhibitory
interneurons. We recorded responses in vitro from each of these cell types in S1 evoked by
photic activation of M1 terminals expressing channelrhodopsin-2 (ChR2). Our findings indicate
a high probability of M1 input to all three cell types. The nature of the inputs is laminar and cell-
type specific. Results demonstrate that both inhibitory and excitatory neurons are strongly and
24
widely recruited by M1, providing circuit-level mechanisms for the regulation of S1 activity
during movement-associated activity in M1.
2.3 METHODS
All experiments were carried out in compliance with the University of Pittsburgh School
of Medicine animal use policies and were approved by the University of Pittsburgh Institutional
Animal Care and Use Committee.
Virus injections
Experiments were conducted using a transgenic mouse line that contains GFP in a subset
of somatostatin-expressing GABAergic neurons (“GIN” mice; Oliva et al., 2000). Mice were
first anesthetized using isoflurane (1-2%/oxygen), a small craniotomy was performed over
primary motor cortex (1.0 mm anterior to and 0.8 mm lateral from bregma), and the adeno-assoc-
iated virus AAV2/5.CamKIIα.hChR2(H134R)-mCherry.WPRE.SV40 (University of
Pennsylvania Vector Core; permission from Dr. Karl Deisseroth) was unilaterally pressure
injected into primary motor cortex (M1) using a picospritzer. In a single penetration we injected
the virus separately into both deep and superficial layers of M1 (0.8 mm and 0.4 mm depth,
respectively). A volume of 0.1-0.2 µl was injected at each depth. At the time of injection the
mice were 10-15 postnatal days of age (P10-15).
Verification of M1-to-S1 labeling
At the outset we examined the nature of the ChR2 labeling. Injected animals were
25
perfused transcardially using 0.1M PBS followed by 4% paraformaldehyde. The brain was then
placed in 30% sucrose for 48-72 hours. Next, the brain was frozen and sectioned in either the
coronal or tangential plane at 40 µm using a cryostat.
Initial experiments were done using the AAV2/1.CAG.hChR2(H134R)-
mCherry.WPRE.SV40 viral vector. When the tissue was examined we consistently observed
ChR2-mCherry labeled cells within S1, suggesting a small percentage of neurons were
retrogradely transporting the virus from M1, the injection site, back to S1 (data not shown).
Because we wished to examine only M1 inputs to S1 and not possible recurrent collaterals of
retrogradely labeled S1 cells, we decided to use AAV2/5.CamKIIα.hChR2(H134R)-
mCherry.WPRE.SV40 for all of our experiments, which we thought may result in little or no
retrograde transport while still producing strong ChR2-expression in M1 neurons. To confirm
this, in a subset of animals injected with this viral vector we stained tissue for NeuN as a marker
for cell bodies. Free-floating coronal sections were rinsed using 0.1M PBS, incubated in
blocking solution (containing 10% donkey serum and 0.3% Triton-X in 0.1M PBS), and then
incubated in primary antibody for 18-24 hours (1:1000 anti-NeuN; Chemicon). The tissue was
rinsed in 0.1M PBS and subsequently incubated for 2-3 hours in secondary antibody (1:500
donkey anti-mouse Alexa 647; Jackson Immunoresearch). The tissue was placed on slides,
coverslipped (Vector Laboratories, Vectashield), and examined using a confocal microscope.
For sections within M1, we determined that about 71% of NeuN+ neurons near the
injection site (range 52-85%; n=3 animals) were also positive for ChR2, indicating that they
expressed the virus. This included neurons in layers 2-6. This percent decreased with distance
from the center of injection site. The promoter we used to drive viral expression, CaMKIIα, is
largely specific for excitatory neurons (Dittgen et al., 2004; Nathanson et al., 2009). It is not
26
known whether CaMKIIα is preferentially expressed in subpopulations of pyramidal neurons.
However, ChR2 was present in the majority of neurons near the injection site, consistent with the
assumption that the virus is being expressed non-selectively in M1 pyramidal neurons.
We examined S1 labeling in 8 slices from 3 animals for co-expression of NeuN and
ChR2-mCherry. In a count of 4007 NeuN-positive cells distributed across cortical layers, we
found 4 that also labeled with mCherry. Interestingly, the 4 retrogradely-labeled neurons were
found in layers 2/3. Due to the sparse nature of the retrograde labeling (~1/1000 neurons), we
concluded that any such labeling with this viral construct would be unlikely to affect our results.
All of the data presented in this manuscript were therefore collected from animals injected with
the AAV2/5.CamKIIα.hChR2(H134R)-mCherry.WPRE.SV40 virus construct.
Preparation of in vitro S1 slices
Electrophysiological experiments began a minimum of 3 weeks following virus injection
to allow for transport and full expression of the virus. At the time of experiments the animals
were 32-51 days of age. Mice were anesthetized with isoflurane, then the brain was removed and
placed in ice-cold artificial cerebrospinal fluid (ACSF) containing (in mM): 126 NaCl, 3 KCl,
1.25 NaH2PO4, 2 MgSO4, 26 NaHCO3, 10 dextrose, and 2 CaCl2, saturated with 95% O2-5%
CO2. The tissue was then sliced at 400 µm in the coronal plane using a vibratome. Slices were
incubated at 32° C for 30-45 minutes and then maintained at room temperature until used for
recording. Slices containing S1 barrel cortex were identified by the presence of layer IV barrels
and a patchy barrel-related pattern of mCherry fluorescence (Figure 2.1B&2A). We recorded
primarily from the larger, more medially situated barrels (rows D-E), as this is where
fluorescence was typically strongest. We recorded from one to three adjacent barrels per slice.

27
Recording procedures
Whole cell recordings were performed using glass micropipettes (4–10 MΩ) filled with
internal solution containing (in mM): 135 K-gluconate, 4 KCl, 2 NaCl, 10 HEPES, 0.2 EGTA, 4
ATP-Mg, 0.3 GTP-Tris, and 14 phosphocreatine-Tris (pH 7.25, 280-290 mOsm). Biocytin
(0.5%) was added to the internal solution in a subset of experiments. Membrane potentials
reported here were not corrected for the liquid junction potential. Recordings were conducted at
32°C. When patching, cell-attached seal resistances were 1 GΩ or greater and series resistance
after achieving whole cell configuration was 5-20 MΩ. After establishing whole cell
configuration, a series of current steps was presented in current-clamp for use in characterization
of cell type (see below). Current steps were presented in 20 pA steps, ranging from -100 to 300
pA. Steps were presented 5 seconds apart. In voltage-clamp experiments, series resistances
ranged from 10-40 MΩ and were compensated for up to 80%. For EPSC measurements all cells
were held at a potential of -80 mV. Data were collected using a Multiclamp 700B amplifier and
pClamp10 software (Molecular Devices). Data were collected at a sampling rate of 20 kHz.
Cell type identification
Cells were viewed under infrared-differential interference contrast illumination using a
Nikon FN-1 microscope and a Dage IR-1000 CCD camera. In “GIN” mice all of the GFP-
expressing cells are inhibitory interneurons that express the neuropeptide somatostatin (SOM),
although not all SOM+ interneurons are labeled with GFP (Oliva et al., 2000; Ma et al., 2006).
Most or all of the GFP-expressing cells in this mouse line are morphologically consistent with
Martinotti interneurons (Ma et al., 2006). GFP-expressing neurons are found in layers 2-5 but

28
not in layer 6 (Ma et al., 2006), preventing us from positively identifying L6 SOM interneurons.
All GFP-expressing interneurons were identified by visualization of GFP under epifluorescence
illumination (Nikon Intensilight). All neurons identified in this study as “SOM” were labeled
with GFP.
Fast-spiking (FS) inhibitory interneurons do not express GFP in this mouse line.
Therefore cells with an oval-shaped soma were targeted as putative FS cells and their identity
was confirmed based on electrophysiological characteristics (Beierlein et al., 2003; Fanselow et
al., 2008). FS cells can exhibit different axonal projection patterns (Helmstaedter et al., 2009);
therefore our results may encompass FS cells with different morphologies. Nevertheless, a
wealth of both in vitro and in vivo literature exists regarding the role of inhibitory interneurons
identified as “fast-spiking” in cortical circuits. Our goal was to place our results regarding the
role of FS inhibitory neurons in meditating M1-S1 interactions within the context of these
findings.
Regular-spiking (RS) pyramidal cells were targeted for recording based on a triangular-
shaped soma. During recording, RS pyramidal cells were similarly characterized based on
established electrophysiological criteria (Porter et al., 2001; Beierlein et al., 2003; Hattox and
Nelson, 2007). We also recorded from a few pyramidal neurons in L5 that were not regular-
spiking, but instead displayed ‘intrinsically bursting’ properties (n=3). These cells showed
similar results as the L5 RS cells, and were therefore pooled with the regular-spiking pyramidal
neurons.
Laminar definitions
29
Layer 1 was identified by a low density of cell bodies, and the top of layer 2/3 was
defined by the abrupt increase in cell density. The boundary between the bottom of L3 and the
top of L4 was identified by the presence of barrels in L4, and the bottom of L4 was indicated by
the loss of barrel structure as well as a more diffuse labeling pattern of fluorescent M1 axons.
The boundary between layers 5 and 6 was approximated as being roughly half way between the
top of L5 and the white matter. In a subset of our data we measured the distance from the pia to
the cell body of the recorded cell (see Figure 2.6A). Based on these measurements, our laminar
boundaries were very similar to previously published laminar definitions for S1 in the mouse
(Hooks et al., 2011).
Optical stimulation procedures
To test for M1 input using optical stimulation, the recorded cell was centered in the field
of view. Full-field blue light was delivered through a 40X objective using a 470 nm LED
(OptoLED; Cairn Research). Light intensity at the surface of the slice was ~20mW/mm2; light
intensity was held constant across all experiments to minimize variability. This intensity is
higher than the threshold for channelrhodopsin activation, which in our experiments as well as in
previous studies is approximately 8-12mW/mm2 (Boyden et al., 2005). Keeping the light
intensity stronger than the threshold for ChR2 activation allowed for reliable detection of
synaptic connections within our experiments. Light intensity was measured using an optical
power meter to measure the overall power and then dividing by the surface area of the light spot
(to give mW/mm2). We measured the spatial diameter of the light spot to be ~250 µm with some
scattering of light beyond that. Consistent with this measurement, light evoked responses were
about 50% of the maximal response when stimulated 250 µm from the neuron’s somata. This

30
indicates the activation range probably extends approximately one barrel-related column in
width, or perhaps slightly more. Light stimulation was delivered via TTL pulses using the
pCLAMP software. A single stimulation trial consisted of trains of 8-10 pulses (each pulse was
1.0 ms duration) at 1, 10, 20, and 40Hz, with trains separated by >8 seconds to minimize
adaptation effects. For each cell 10-30 trials were recorded.
We took multiple steps to limit experimental variability arising from variation in the
amount of virus taken up and/or expressed across animals. First, we only recorded from slices
exhibiting strong ChR2-mCherry expression that was easily visible under 4X magnification (e.g.
Figure 2.2A). Second, we limited recordings to the area in barrel cortex having the highest
ChR2-mCherry expression; this was typically one to three medially situated adjacent barrels.
Third, we included data only from animals in which at least one significant excitatory response
was identified. Fourth, we attempted to sample multiple cells within each slice such that the
sample contained a variety of cell types from different layers.
Data analysis
Data were analyzed using in-house programs written in Matlab (The MathWorks, Natick,
MA; A. Kinnischtzke). Trials were averaged together, and analyses were performed on averaged
voltage traces. Response onset and peak were calculated within a 15ms window following the
offset of the light pulse. Response onset was taken as the first of 20 consecutive data points that
exceeded a threshold of 1 s.d. above the resting membrane potential. A cell was considered to
have received an input if the peak response was greater than 5 times the standard deviation of the
resting membrane potential. Excitatory post-synaptic potential (EPSP) and current (EPSC)
amplitudes were calculated as the difference between the response onset and the peak response.

31
In cases where a cell spiked in current-clamp mode, the peak response was taken to be the action
potential voltage threshold. For analysis of synaptic dynamics, response amplitudes were
calculated using EPSCs, and we used only cells that had a significant response to the first pulse
in the train. Response amplitudes were calculated for each pulse then normalized to the first
value. To calculate the change in spike probability across a train, we used only cells that spiked
at least once across all trials to any pulse in the train.
For comparison of input probabilities between cell types or layers we used a chi-squared
test. For all other statistical comparisons, an ANOVA was performed for each data set and t-tests
were used for post hoc pairwise comparisons. Results are reported as mean ± SEM.
2.4 RESULTS
Anatomy of the M1-S1 projection
To study synaptic inputs from M1 to identified S1 neurons, we injected an AAV virus
containing the channelrhodopsin-2 (ChR2) gene into primary motor cortex (see Methods; Figure
2.1A, left). Experiments were performed a minimum of three weeks following the injection, at
which time pyramidal neurons in M1 showed strong expression of ChR2 (Figure 2.1A, right).
Viral

32
Figure 2.1 Injection of ChR2-mCherry viral vector produces extensive labeling of M1 axons within S1. (A) Left:
Injection of the ChR2-mCherry viral vector produced robust fluorescent labeling around the injection site, shown
here in the coronal plane. Projections from the injection site can be seen in contralateral M1 as well as the striatum.
Str=striatum; CC=corpus callosum. Right: High power magnification (60x) shows individual neurons, labeled with
NeuN (green), co-expressing the ChR2-mCherry virus (red). (B) Left: ChR2-mCherry labeling of M1 axons within
S1. Labeling pattern is typical of the termination pattern of M1 axons within S1. Arrows indicate septal columns of
M1 fibers. Right: High power magnification (60x) demonstrates that the ChR2-mCherry virus is only expressed in
axons and axon terminals in S1, as no neurons in S1 (labeled with NeuN; green) are co-labeled with ChR2-mCherry
(red). (C) S1 section cut in a plane tangential to the pial surface at depths corresponding to L4 (left) and L5 (right).
33
expression was primarily located in M1 neurons within the agranular medial field (vibrissal
motor cortex) with some in the agranular lateral cortex (Brecht et al., 2006). This produced a
stereotypical pattern of axonal labeling within S1 (Figure 2.1B) that was consistent with known
patterning of M1 axons (Veinante and Deschenes, 2003; Petreanu et al., 2009). This pattern of
labeling was consistent across animals; however we observed some variability between animals
in the amount of ChR2 labeling that was present (see Methods). Layers 5 and 6 (L5&6) were
characterized by diffuse labeling. At the L4/L5 boundary labeling become concentrated within
vertical bands that coursed through L4 and L2/3. Labeling broadened somewhat before
becoming extensive and widespread in L1 (Figure 2.1B). The vertical bands of M1 fibers
appeared to be concentrated between barrel centers, which were largely devoid of M1 axons. To
explore this further we sliced through the S1 barrel field in the tangential plane to highlight
barrel versus septal areas. We found that in L4, M1 labeling was concentrated primarily between
the barrels, within the septa (Figure 2.1C, left). In deeper layers, as was observed in the coronal
slice, M1 axons became more diffuse, however they remained more concentrated under the septa
all the way through L5 and L6 (Figure 2.1C, right).
M1 provides input to excitatory and inhibitory neurons in S1

34
Figure 2.2 Optical stimulation of ChR2-expressing M1 axon terminals (ChR2-M1) results in time-locked
excitatory responses in S1 neurons. (A) Left: In vitro brain slice through S1 under DIC at 4X magnification.
Right: Same brain slice under mCherry fluorescence shows robust ChR2-M1 labeling in S1. (B) Recording of single
S1 pyramidal neurons during optical stimulation with 470 nm light (black arrows) evokes excitatory post-synaptic
potentials (EPSPs) in some neurons (left) but not others (right). (C) Higher resolution traces of single optically-
evoked response shown in (B).
35
In order to test for M1 input to individual neurons in S1 we optically stimulated the ChR2-
expressing M1 axon terminals while recording from a neuron in S1 (Figure 2.2A). We
determined whether the recorded cell received M1 input by stimulating with trains of light pulse
(Figure 2.2B). Cells deemed to have an evoked response showed time-locked excitatory post-
synaptic potentials (EPSPs) that were typically present following every individual pulse; that is,
they displayed little synaptic failure. Excitatory responses were readily observed when averaged
across trials (Figure 2.2B&C, left). Occasionally, an inhibitory response was observed as well
(see below). In a subset of cells, we computed the latency to EPSP onset on each trial (10-30
trials per cell) and averaged the values for each cell (3.21 ± 0.41 ms; n=5 cells). To determine the
trial-to-trial ‘jitter’ in the EPSP response onset, for each cell we calculated the coefficient of
variation (CV) of the EPSP onset latency across trials. The mean CV was 0.09 ± 0.02 (n=5 cells).
Because variability between trials was low, we calculated an average EPSP for each cell and
performed subsequent analyses on such trial-averaged responses. The trial-averaged EPSP
latency for all cells (n=95) was 2.99 ± 0.09 ms.
In order to verify that the short-latency responses were monosynaptic we performed a
series of experiments where we included 1 µM tetrodotoxin (TTX) and 1 mM 4-aminopyridine
(4-AP) in the bath to block sodium and potassium channels, respectively (Petreanu et al., 2009;
Cruikshank et al., 2010). In the presence of TTX only, M1-evoked responses were always
abolished (data not shown; n=11/11 cells). When we additionally added 4-AP, to enhance
indirectly the depolarizing effects of ChR2, evoked responses were present in most cells (data
not shown; n=11/13). When responses remained in the presence of TTX and 4-AP, for all cells
(n=11/11) the M1-evoked response latency was significantly longer than under control
conditions (control: 3.13 ± 0.04 ms; TTX + 4-AP: 6.46 ± 0.09 ms; p < 0.005). Also, almost all

36
Figure 2.3 M1 contacts three major cell types in S1. (A) Example traces identifying a regular-spiking (RS)
pyramidal neuron (left), a fast-spiking (FS) inhibitory interneuron (middle), and a somatostatin-expressing (SOM)
inhibitory interneuron (right). Each cell type exhibits characteristic voltage responses (top) to hyperpolarizing and
depolarizing current step injections (bottom). (B) Example traces for an RS cell (left), FS cell (middle), and SOM
cell (right) demonstrating excitatory responses to optical stimulation of ChR2-M1 fibers. Responses were measured
in current-clamp (top) and voltage-clamp (bottom). Holding potential for voltage-clamp is -80 mV for all recordings.
Note that the FS cell spiked. (C) Quantification of the probability of receiving an input from M1 by cell type
demonstrates equivalence among them (p = 0.32). (D) Amplitudes of excitatory currents evoked by ChR2-M1
stimulation are significantly greater in FS than RS (p < 0.05) and SOM cells (p < 0.005). Amplitudes do not differ
between RS and SOM cells (p > 0.05). Panels C and D contain cells recorded from layers 2 though 6.
37
neurons (n=10/11) exhibited reduced M1-evoked response amplitudes in the presence of TTX
and 4-AP, although on average this decrease was not significant (control: 6.87 ± 0.33 mV; TTX
+ 4-AP: 3.80 ± 0.33mV; p=0.08). The cells tested with TTX and 4-AP included all three cell
types examined in this study (see below) and the effects of TTX and 4-AP did not depend on cell
type. These results are consistent with previous findings (Cruikshank et al., 2010) and illustrate
that the light-evoked excitatory responses we observed are directly post-synaptic to ChR2-
expressing M1 axon terminals.
Previous work demonstrated that M1 inputs directly contact pyramidal neurons within
L2/3 and L5 of somatosensory cortex (Petreanu et al., 2009; Mao et al., 2011; Rocco-Donovan et
al., 2011). We wanted to determine here whether M1 also provides synaptic input onto inhibitory
interneurons. We therefore recorded from three cell types within S1: regular-spiking pyramidal
(RS) neurons, fast-spiking (FS) inhibitory interneurons, and somatostatin-expressing (SOM)
inhibitory interneurons (Figure 2.3A). RS and FS neurons were identified using established
electrophysiological criteria (see Methods) and SOM interneurons expressed GFP. In addition,
we recorded from a population of neurons that could not be readily categorized into one of these
three groups yet were too heterogeneous to comprise a meaningful fourth cell type (“non-
classified” cells).
We found that in addition to contacting pyramidal neurons with a high probability
(n=56/74), M1 also provides input to FS interneurons (n=10/17) and SOM inhibitory
interneurons (n=18/27). Connections probabilities were equivalent among the cell types (p=0.32;
Figure 2.3C). The latency of the evoked responses also did not differ between the three cell types
(RS: 2.97 ± 0.02 ms; FS: 2.61 ± 0.07 ms; GIN: 3.08 ± 0.04 ms; p=0.42). The “non-classified”
cells also received input from M1 (n=9/16; data not shown). The characteristics of the M1 inputs

38
to the non-classified neurons were not distinct and fell within the range observed for our three
identified cell types; therefore we opted to not include these cells in further analyses. Overall,
these results suggest that M1 afferents do not discriminate by cell type, but instead provide direct
input to most types of cells within S1.
We compared the strength of excitatory responses among cell types. We found that
although all three cell types had a similar probability of receiving M1 input, the strength of the
inputs differed among them (ANOVA p=0.0012; Figure 2.3D). The average amplitude of
EPSCs onto FS cells was the largest (730.29 ± 261.1 pA), and this was significantly greater than
that of the M1 input onto RS cells (321.83 ± 52.8 pA; p < 0.05) or SOM cells (84.43 ± 28.8 pA;
p < 0.005). This demonstrates that M1 strongly contacts FS cells, which could evoke robust
disynaptic inhibition within S1 (see below).
Short-term dynamics of M1 inputs are dependent on post-synaptic cell type
Both thalamocortical and local cortical inputs onto RS, FS, and SOM cells exhibit
distinct short-term dynamics that are dependent on the identity of the post-synaptic cell. To
determine if M1 inputs show short-term synaptic depression or facilitation, we stimulated the
ChR2-expressing M1 terminals with trains of light pulses at 1 Hz and 10 Hz (Figure 2.4A). The
dynamics of the M1 input depended on the post-synaptic cell type. With 10 Hz trains, the
magnitude of the excitatory post-synaptic currents (EPSCs) displayed short-term depression in
the RS cell and FS cell populations and short-term facilitation in the SOM population (Figure
2.4A&B). The time course of short-term depression in the RS and FS cell populations was
similar at 1 and 10 Hz (Figure 2.4B).
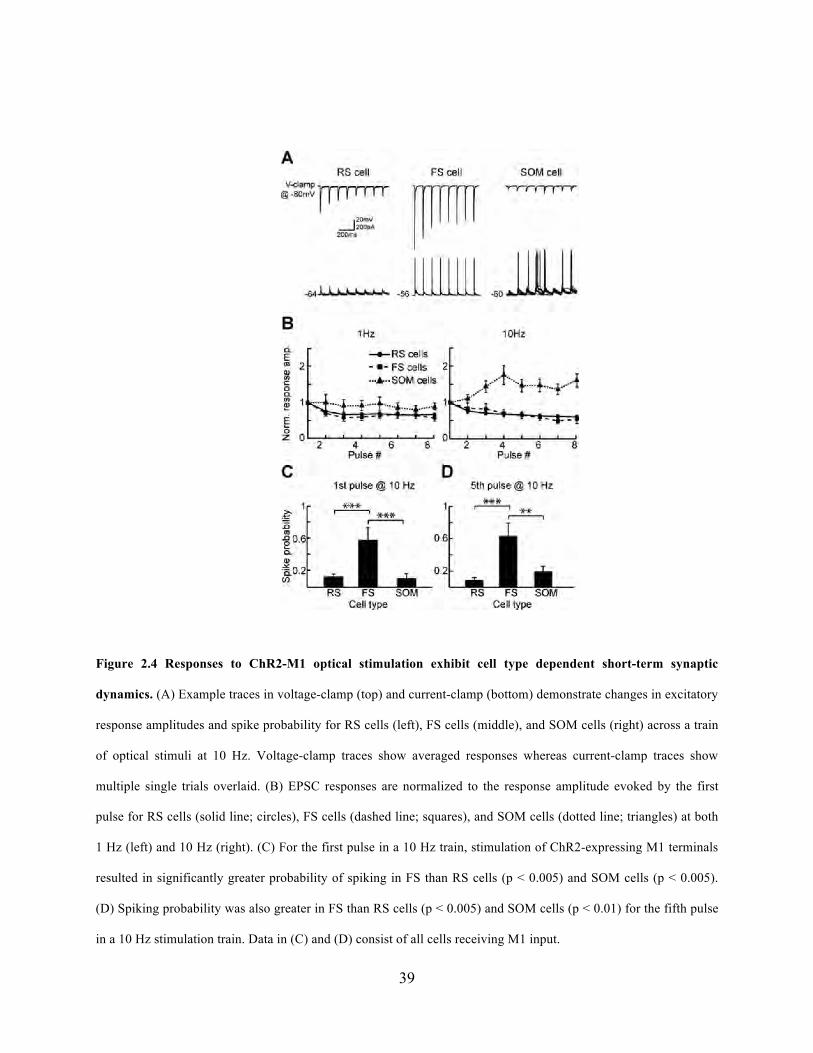
39
Figure 2.4 Responses to ChR2-M1 optical stimulation exhibit cell type dependent short-term synaptic
dynamics. (A) Example traces in voltage-clamp (top) and current-clamp (bottom) demonstrate changes in excitatory
response amplitudes and spike probability for RS cells (left), FS cells (middle), and SOM cells (right) across a train
of optical stimuli at 10 Hz. Voltage-clamp traces show averaged responses whereas current-clamp traces show
multiple single trials overlaid. (B) EPSC responses are normalized to the response amplitude evoked by the first
pulse for RS cells (solid line; circles), FS cells (dashed line; squares), and SOM cells (dotted line; triangles) at both
1 Hz (left) and 10 Hz (right). (C) For the first pulse in a 10 Hz train, stimulation of ChR2-expressing M1 terminals
resulted in significantly greater probability of spiking in FS than RS cells (p < 0.005) and SOM cells (p < 0.005).
(D) Spiking probability was also greater in FS than RS cells (p < 0.005) and SOM cells (p < 0.01) for the fifth pulse
in a 10 Hz stimulation train. Data in (C) and (D) consist of all cells receiving M1 input.

40
We also recorded in current-clamp and examined the change in the probability of
eliciting spikes across the stimulus train (Figure 2.4A, C&D). Out of the cells in each cell type
that spiked at least once (16/56 RS cells; 6/10 FS cells; 10/18 SOM cells), the probability of
eliciting a spike across the train tended to increase in SOM cells and decrease in the RS cells,
although the change was variable in both populations (data not shown). The incidence of spiking
is consistent with SOM cells displaying short-term facilitation and RS cells exhibiting short-term
depression (Figure 2.4B). In FS cells, although EPSC responses displayed synaptic depression,
we observed spiking in response to each pulse across the 10 Hz train. This is likely due to the
large amplitude EPSCs evoked in FS cells (Figure 2.3D) under these conditions.
When we compared all cells receiving M1 input for each cell type under equivalent
recording conditions (i.e. same light intensity for stimulation), FS cells (n=10) were significantly
more likely to spike to both the first pulse (0.64 ± 0.16; Figure 2.4C) and fifth pulse (0.63 ± 0.16;
Figure 2.4D) in a 10 Hz train than RS (1st pulse: 0.12 ± 0.04, 5th pulse: 0.09 ± 0.03; p <0.005) or
SOM (1st pulse: 0.10 ± 0.06, p < 0.01; 5th pulse: 0.19 ± 0.07, p<0.005) cells. This is consistent
with our previous finding that FS cells receive stronger excitatory drive from M1 than RS or
SOM cells and likely produce feedforward inhibition onto S1 neurons.
Feedforward inhibition recruited by M1 stimulation
We observed a high probability of spiking in the FS cell population, indicating that M1
activation could recruit widespread disynaptic inhibition within S1. To test this possibility, we
recorded in voltage-clamp and held the cells at a potential of -20 mV to determine the presence
or absence of an inhibitory post-synaptic current (IPSC; Figure 2.5). We observed IPSCs in RS
41
Figure 2.5 Optical stimulation of ChR2-M1 terminals evokes widespread disynaptic inhibition in RS cells, FS cells,
and SOM cells within S1. (A) Examples of excitatory and inhibitory post-synaptic currents (EPSCs and IPSCs) in
RS cells (left), FS cells (middle), and SOM cells (right) in response to ChR2-M1 stimulation. Cells were held at -80
mV for EPSC recordings and -20 mV for IPSC recordings. (B) Summary of number of neurons with both E&IPSC
responses by cell type. (C) Normalized IPSC amplitudes for RS cells (sold line; circles), FS cells (dashed line;
squares), and SOM cells (dotted line; triangle) for a 10 Hz optical pulse train.

42
cells, FS cells, and SOM cells that appeared delayed relative to the initial EPSC (Figure 2.5A).
We found that for each cell type a high proportion of the cells that received excitatory input from
M1 also displayed a disynaptic inhibitory response (66% of RS cells, 60% of FS cells, 65% of
SOM cells; Figure 2.5B). The peak of the IPSC followed the peak of the EPSC in nearly all cells
(n=36/38; average delay was 4.89 ± 0.57 ms). The IPSC-EPSC peak delay was slightly less in FS
cells (3.76 ± 1.07 ms) than RS (4.99 ± 0.77 ms) or SOM cells (4.97 ± 1.02 ms), however there
was no significant difference among cell types (p=0.85). In contrast to the short-term dynamics
of the M1 excitatory inputs, the disynaptic inhibitory responses showed short-term depression in
all three cell types (Figure 2.5C). This suggests that M1 activation generates extensive inhibition
within S1 that depresses at frequencies of 10 Hz and greater. That FS cells are the most likely to
be driven suprathreshold by M1 stimulation strongly suggests that this inhibition is mediated by
FS interneurons.
Laminar dependence of M1 input
The pattern of ChR2-M1 axons was distinctly non-uniform across S1 cortical layers (see
above; Figure 2.1). We therefore examined in a subset of cells whether particular layers within
S1 receive more M1 input than others and whether this depends on cell type (Figure 2.6A). The
probability of a cell receiving an M1 input was lowest in L4 (~20%), and this was the case for all
three cell types (RS: p=0.0008, FS: p=0.016, SOM: p=0.037; Figure 2.6B). In each of the other
layers, input probability was ~80% for each cell type. We similarly examined response
amplitudes (EPSPs). For all S1 neurons we recorded, there was a significant difference in
response magnitude across layers (ANOVA p < 0.005; data not shown). When we separated the
data by cell type, RS amplitudes differed significantly by laminar location (ANOVA p=0.0011).

43
Figure 2.6 M1 inputs to excitatory and inhibitory neurons in S1 exhibit similar laminar distributions. (A) Amplitude
of M1 input as a function of depth from pia. Each point represents EPSP amplitude in response to ChR2-M1
stimulation for individual cells (circles: RS cells; squares: FS cells; triangles: SOM cells). Dashed lines indicate
laminar boundaries and were placed as follows (in µm from pia): L2/3-L4: 419; L4-L5: 626; L5-L6: 940. Data
plotted are a subset of data shown in (B) and (C). Filled circles represent cells that spiked in response to ChR2-M1
on at least 2 trials; open circles are cells that did not spike. (B) Probability of receiving an M1 input by layer for RS
cells (left), FS cells (middle), and SOM cells (right). Numbers represent the number of cells that received input out
of total number of cells recorded for that layer and cell type. (C) EPSP amplitude of evoked response to ChR2-M1
optical stimulation as a function of layer for RS cells (left; circles), FS cells (middle; squares), and SOM cells (right;
triangles). Conventions as in (A).
44
Laminar dependency was at best at trend level for FS (ANOVA p=0.18), and SOM cells
did not display laminar differences (ANOVA p=0.82). In both RS and FS cells, excitatory
responses were largest in L6 as was the proportion of cells that fired action potentials. In RS
cells, L6 response amplitudes were on average significantly larger than in the other layers (p <
0.05). We were unable to determine whether SOM interneurons also receive their strongest M1
inputs in L6 because there are no GFP+ cells in L6 of GIN mice; SOM cells do exist there,
however (Markram et al., 2004; Ma et al., 2006; Lee et al., 2010).
We found unexpectedly that M1 inputs were especially large in a subset of L6 cells. To
verify that these results were not an artifact of between-animal variability in ChR2 expression or
activation (see Methods), we recorded sequentially from RS neurons in L5 and L6 within the
same slice (Figure 2.7). Pair-wise comparison of L5 and L6 RS cells showed that L6 cells indeed
receive, on average, significantly larger M1 inputs (p=0.02; Figure 2.7B, left) though the
difference was not necessarily observed in every pair. When we normalized the paired data to the
amplitude of the L5 cell, it was clear that relative to nearby L5 neurons a subset of neurons in L6
receive especially strong M1 input (mean normalized L6: 2.47 ± 0.57, p=0.02; Figure 2.7B,
right). Interestingly, it appears that the L6 cells having the largest responses are concentrated in
upper L6, near the L5/L6 border (Figure 2.6A). The cells receiving large M1 inputs exhibited
regular-spiking characteristics, as did all L6 pyramidal neurons; however they did tend to show
an initial spike ‘doublet’ in response to current step injection whereas L6 pyramidal neurons
receiving less M1 input did not. These results suggest they could represent a specific class of
projection neurons (Otsuka and Kawaguchi, 2011) that remain to be identified in future studies.

45
2.5 DISCUSSION
Here we took advantage of optogenetic tools to investigate motor cortex to somatosensory cortex
synaptic circuitry. By injecting an AAV vector carrying the ChR2 gene into M1 we were able
specifically to investigate properties of anterograde connections from M1 to S1. Provided that
ChR2 is transported only anterogradely, our experimental approach avoided confounds
associated with inadvertent synaptic activation by local recurrent axons in S1. We verified that
labeling was indeed virtually entirely anterograde in nature (see Methods).
Our experiments yield four important findings. First, M1 inputs engage three main types
of S1 neurons, including two classes of inhibitory interneurons as well as excitatory pyramidal
neurons. As a consequence, M1 activation produces both direct excitation as well as substantial
disynaptic inhibition within S1. Second, motor cortex inputs to pyramidal neurons, FS and SOM
inhibitory interneurons possess cell-type specific synaptic dynamics. The dynamics are similar to
those of other extrinsic and intrinsic inputs, including thalamocortical and local corticocortical
connections. Third, M1 input to excitatory and inhibitory neurons display similar laminar
distributions. Regardless of cell type, neurons in L4 were the least likely to receive input from
motor cortex, whereas all three cell types in other layers showed a similar, high probability of
M1 input. Fourth, M1 labeling is distributed into vertically-oriented columns that are
complementary to those described for thalamocortical inputs from the ventral posteromedial
(VPm) thalamic nucleus, the major subcortical station in the whisker-to-barrel pathway. Taken
together, our findings suggest that M1 exerts on S1 modulatory excitatory and inhibitory effects
that may differentially influence corticocortical vs. thalamocortical processing streams.
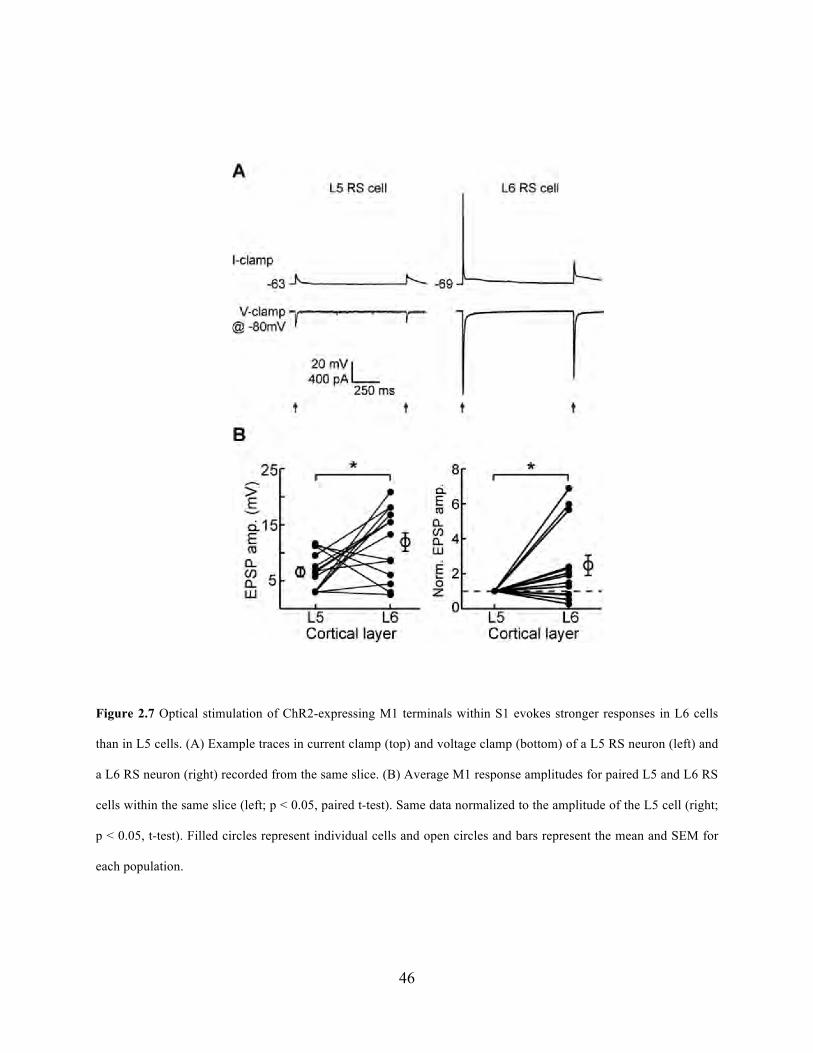
46
Figure 2.7 Optical stimulation of ChR2-expressing M1 terminals within S1 evokes stronger responses in L6 cells
than in L5 cells. (A) Example traces in current clamp (top) and voltage clamp (bottom) of a L5 RS neuron (left) and
a L6 RS neuron (right) recorded from the same slice. (B) Average M1 response amplitudes for paired L5 and L6 RS
cells within the same slice (left; p < 0.05, paired t-test). Same data normalized to the amplitude of the L5 cell (right;
p < 0.05, t-test). Filled circles represent individual cells and open circles and bars represent the mean and SEM for
each population.
47
Selective stimulation of M1 axons with channelrhodopsin
Use of optogenetic techniques allowed for sole activation within S1 of axons originating from
primary motor cortex. Such specificity has been difficult to achieve with traditional electrical
stimulation techniques, as unintentional antidromic activation of fibers in reciprocally connected
brain regions, such as S1 and M1, is difficult to avoid. In addition, we were able to activate
ChR2-expressing fibers directly within S1 as opposed to the neuronal somata in M1. This allows
greater confidence for detecting the presence of synaptic connections, as the entire axon tract
need not be preserved within the slice. Under these conditions, the latency measure likely reflects
primarily the synaptic delay of neurotransmitter release from the presynaptic ChR2-expressing
terminal to the post-synaptic neuron.
Wide-field optical stimulation, as we used in this study, likely produces synchronous or
near-synchronous activation of all or most of the ChR2-expressing M1 terminals within the
activated region, a condition that could correspond to the upper-bound of S1 engagement by M1.
While our stimulation protocol may not be analogous to physiological M1 activity, it enabled us
to identify connections that may not have been apparent with weaker stimuli. Importantly, our
approach provided the opportunity to identify similarities, such as feedforward inhibition, and
differences, i.e., direct engagement of SOM cells, in afferent cortical circuitry, notably that
associated with thalamic input (see below).
Further investigation into the strength of unitary connections, as opposed to population
connections, will provide additional insight into whether the large inputs to some S1 neurons
result from stronger synaptic connections and/or a convergence of more synapses onto single
post-synaptic neurons. Traditional in vitro experimental paradigms, such as minimal stimulation
48
techniques, could be adapted for use with optical stimulation to address these questions in future
studies. Nevertheless, our findings are consistent with other results demonstrating that FS cells
receive large thalamocortical and corticocortical inputs. Previous studies have demonstrated for
these inputs that FS cells receive larger unitary inputs than RS cells (Cruikshank et al., 2007) or
SOM cells (Beierlein et al., 2003); it seems likely that the same could be true for M1 inputs onto
FS interneurons.
Motor cortex input to inhibitory and excitatory neurons in S1
At a population level, motor cortex neurons contact three major types of S1 neurons with high
probability. Indeed, up to 80% of recorded S1 cells displayed short-latency excitatory responses.
The strongest M1 inputs are to FS inhibitory neurons. This was evident in both the size of the
excitatory currents and the likelihood that these inputs evoked FS spikes. Our finding that FS
interneurons overall receive the strongest M1 input could be a reflection of the greater
recruitment of FS interneurons located in deeper layers (see below). That FS cells receive large
excitatory input is reminiscent of the synaptic properties of thalamocortical inputs to FS cells in
layer 4 barrels (Porter et al., 2001; Beierlein et al., 2003; Cruikshank et al., 2007). SOM
inhibitory interneurons also have a high probability of receiving M1 input, but the amplitude of
the responses and the probability of spiking were substantially smaller. SOM inhibitory
interneurons have high input resistances and depolarized resting potentials (Fanselow et al.,
2008; Kinnischtzke et al., 2012). However, despite their greater intrinsic excitability relative to
FS interneurons the probability of eliciting action potentials with M1-ChR2 activation was much
lower at the stimulation frequency used here. Together, these M1-S1 findings parallel those
showing strong input from local S1 excitatory neurons onto FS interneurons and weak input onto
49
SOM interneurons (Markram et al., 1998; Xiang et al., 2002; Beierlein et al., 2003; Thomson and
Lamy, 2007). Thus, the distinctive synaptic profiles of FS and SOM interneurons extend to at
least one long-range, inter-areal corticocortical system.
Given the high convergence of FS cells onto local excitatory neurons in S1 (Thomson
and Lamy, 2007; Oswald et al., 2009; Packer and Yuste, 2011), strong activation of FS cells by
motor cortex is likely to result in widespread disynaptic inhibition within S1. We determined the
presence or absence of disynaptic IPSCs following M1 stimulation, and indeed found that when
an S1 neuron of any cell type received an excitatory M1 input it was usually followed by an
IPSC. Based on our findings with FS and SOM inhibitory cells, we hypothesize that this
disynaptic inhibition originates from FS cells. We also recorded from “non-classified” neurons.
This group likely contains inhibitory neurons that were neither GFP+ (identifying them as SOM-
expressing) nor conclusively fast-spiking interneurons, such as VIP-expressing, CCK-
expressing, or neurogliaform cells (Markram et al., 2004; Lee et al., 2010). Because the “non-
classified” cells also received input from M1 (data not shown), it is possible that these additional
inhibitory interneuron classes may also be involved in mediating the IPSCs observed here. This
could also vary by depth, as the relative abundance of these inhibitory interneuron groups varies
across S1 layers (Lee et al., 2010). However, given the high spiking probability that we observed
in FS cells, M1-evoked inhibition in our preparation most likely originated from the FS
inhibitory neurons. Direct, efficacious thalamocortical (TC) inputs to FS cells also provide
strong, fast disynaptic inhibition for processing sensory signals (Cruikshank et al., 2007). Thus,
FS interneurons generate fast, reliable inhibition in response to thalamic, local corticocortical,
and M1 signals.

50
Pyramidal neurons in S1 show considerable diversity in terms of their morphology,
intrinsic biophysical properties, projection targets, sources of excitatory input and response
properties (e.g. Swadlow, 1989; Elhanany and White, 1990; Agmon and Connors, 1992; Hattox
and Nelson, 2007). Given this diversity, we were somewhat surprised by the lack of discernible
groups of pyramidal neurons in terms of their M1 inputs. With the exception of some L6 cells
(see below), responses tended to be subthreshold (usually <10 mV). These inputs appear to be
smaller than those of the reciprocal S1 to M1 projection (Mao et al., 2011; Rocco-Donovan et al.,
2011). These findings suggest that M1 provides weak excitation to L2/3 and L5 pyramidal
neurons in S1 regardless of their projection target, as well as to many L6 pyramidal neurons.
This conclusion is consistent with recent findings that L2/3 and L5A M1-projecting pyramidal
neurons receive similar magnitudes of M1 input as nearby pyramidal neurons projecting to other
targets (Mao et al., 2011). M1 may therefore provide a general increase in excitation to the
majority of pyramidal neurons in S1, with a subset of L6 pyramidal cells being the exception.
Synaptic dynamics of M1 inputs onto neurons in S1
A striking feature of SOM interneurons is how the efficacy of their excitatory synaptic inputs
changes with repeated stimulation. Local corticocortical synapses to SOM cells facilitate,
whereas excitatory inputs to RS and FS cells depress. We observed qualitatively similar effects
here. In response to periodic M1-ChR2 stimulation, RS and FS cells exhibited short-term
depression similar to that observed for thalamocortical (Beierlein and Connors, 2002; Chung et
al., 2002; Cruikshank et al., 2007) and local intra-cortical synapses (Markram et al., 1998; Reyes
et al., 1998; Oswald and Reyes, 2008, 2011). These findings indicate that the distinct synaptic
dynamics that apply to FS versus SOM inhibitory interneurons extend to long-range cortical
51
inputs, such as from primary motor cortex. Because SOM cells exhibit short-term facilitation it
has been suggested they provide a delayed source of inhibition in the presence of sustained high
frequency inputs (Pouille and Scanziani, 2004; Kapfer et al., 2007; Silberberg and Markram,
2007). We did not measure responses at frequencies above 10 Hz, as we observed at frequencies
≥20 Hz a larger probability of response failure as well as a summation of post-synaptic
responses. This could be a result of using ChR2 as opposed to electrical stimulation, as ChR2 has
relatively slow recovery from inactivation and can continue to conduct for a few milliseconds
following removal of the light stimulus (Nagel et al., 2003; Cruikshank et al., 2010; Gunaydin et
al., 2010). M1 inputs to SOM cells may continue to facilitate at higher frequencies, as occurs at
local RS to SOM synapses (Fanselow et al., 2008), which could lead to greater recruitment of
SOM interneurons.
Synaptic depression in RS and FS cells at 10 Hz was modest, particularly considering
that channelrhodopsin tends to slightly exaggerate the degree of synaptic depression compared to
electrical stimulation (Cruikshank et al., 2010). Nevertheless, our data are consistent with the
idea that M1-S1 synapses depress less than thalamocortical synapses. Using a similar
optogenetics approach, Cruikshank et al reported greater synaptic depression at TC-FS and TC-
RS synapses than we find at M1-FS and M1-RS synapses. M1 inputs may therefore be more
similar to local corticocortical synapses, which are generally thought to exhibit less synaptic
depression than thalamocortical synapses (Gil et al., 1997; Beierlein et al., 2003). Together,
findings raise the interesting possibility that the intrinsic nature of synaptic depression reflects
the spiking statistics of the pre-synaptic neurons. That is, populations associated with high firing
rates may have more depressing synapses than those associated with lower firing rates. In this
regard, in vivo firing of VPm neurons is likely higher than that of cells in S1. Correspondingly,
52
for equivalent stimulation frequencies TC synapses display more depression than S1 synapses. In
addition, overall in vivo firing frequencies of M1 neurons projecting to S1 may be lower than
those of VPm cells, and this may be reflected in the tendency for M1-S1 synapses to exhibit less
short-term synaptic depression.
Laminar and columnar organization of M1 input to S1
Our anatomical data demonstrate that L4 is largely devoid of M1 axons, particularly within
barrel centers. In accordance with this, neurons in L4 were the least likely to receive input from
M1 (Figure 2.6). This was true for all three cell types: RS excitatory cells, FS inhibitory neurons
and SOM inhibitory interneurons. L4 is the primary input layer for thalamocortical axon
terminals to S1 from VPm (Killackey, 1973). Because we observed relatively few M1 contacts to
L4 neurons, we conclude that M1 is unlikely to directly modulate VPm inputs within L4.
Furthermore, S1 neurons that project back to M1 are similarly scarce in L4 (Alloway et al.,
2004). Therefore, during active whisking M1 may modulate S1 in a layer-specific manner
(Krupa et al., 2004), with signal processing in L4 occurring largely independently of direct M1
influences.
Motor cortex axons terminate in a distinct pattern within S1, wherein the axon from a
single M1 neuron terminates extensively within L5 and L6 before traveling vertically and
ramifying largely within L1 (Veinante and Deschenes, 2003). We observed the same pattern of
ChR2 labeling (Figures 2.1&2.2). M1 projections were vertically concentrated in columns
interposed between barrel-related columns, particularly in L4. In rats, M1-projecting pyramidal
neurons are also concentrated in vertical columns within inter-barrel septa (Alloway et al., 2004).
VPm-related circuits in L4 and L6 are more barrel-focused than inputs from the thalamic

53
posteromedial (POm) nucleus, which target inter-barrel septa (Chmielowska et al., 1989;
Wimmer et al., 2010). Present findings thus provide further evidence for a vertical organization
within the whisker area of S1 in which barrel- and septal-related columns represent different
information streams and/or different modes of sensorimotor integration. As suggested by others
(Alloway, 2008), septal-related columns may be more tightly coupled to the motor system.
Pyramidal cells in L6 exhibited more heterogeneity in their M1 input amplitudes than
pyramidal neurons in any of the other layers (Figure 2.6). On average, L6 pyramidal neurons had
signifiantly larger M1 inputs. This was due to a subset of cells that received exceptionally strong
inputs; unlike other pyramidal cells these often spiked. Pyramidal neurons in L6 are
heterogeneous in their projections (Zhang and Deschenes, 1997). Perhaps M1 strongly contacts a
particular class of L6 neurons, such as those projecting to a specific target (e.g. VPM, POm, M1,
etc.).
M1 input magnitudes to pyramidal neurons are progressively larger in deeper layers,
particularly at the border of L5 and L6 (Figure 2.6A). Interestingly, the inputs to FS cells scaled
similarly. FS cells in L5 and L6 received strong M1 inputs, and most of them reliably fired
action potentials in response to ChR2 stimulation. Although SOM cells constitute a major
portion of inhibitory interneurons within L6 (Markram et al., 2004; Lee et al., 2010), in our
mouse line SOM cells in L6 are not labeled with GFP (Ma et al., 2006) and we were therefore
unable to identify and record from SOM-expressing interneurons in L6. However, our findings
with the FS cells provide evidence that M1 recruits strong inhibition within the deeper layers that
parallels strong, direct excitatory input from M1.
Functional Significance
54
Our findings demonstrate that M1 broadly engages S1 circuits and, further, that M1 inputs onto
pyramidal neurons are widespread but usually subthreshold. Thalamocortical recipient zones
seem to be the exception, with L4 barrel centers receiving few inputs and upper layer 6 receiving
especially strong ones. Our findings thus suggest that M1 targets multiple pyramidal cell
populations that participate in a variety of local circuits and that collectively project to a broad
range of cortical and subcortical targets. M1 neurons also directly contact at least two major
types of inhibitory neurons and possibly other types.
M1 neurons abruptly increase their firing prior to the onset of whisking and many
continue to fire tonically throughout the whisking bout (Carvell et al., 1996; Friedman et al.,
2006; Friedman et al., 2012). Present results show that M1 activates fast feedforward inhibition,
likely via FS inhibitory interneurons, in a manner similar to that of thalamocortical inputs to
layer 4 of barrel cortex. There, feedforward inhibition creates a ‘window of opportunity’ for L4
neurons to spike, producing a robust and brief signature of stimulus onset (Gabernet et al., 2005).
Feedforward inhibition may serve a similar role in M1-S1 interactions. The pre-whisking burst of
M1 activity could transiently engage S1 neurons, providing a strong signal of whisking onset;
this could set S1 circuits in a state to be further modified by the continued tonic firing of some
M1 neurons.
On longer timescales, studies have demonstrated that over the course of a whisking bout
the responsiveness of cells in S1 is diminished relative to non-whisking states (Fanselow and
Nicolelis, 1999; Hentschke et al., 2006; Ferezou et al., 2007). One possibility is that sustained
increases in motor cortex firing during whisking suppress activity in S1. We have demonstrated
that such a neural substrate exists in the direct projection from M1 onto S1 inhibitory
interneurons. However, given that M1 inputs broadly engage populations of both inhibitory and
55
pyramidal neurons, it seems unlikely that M1 exerts a predominantly inhibitory or excitatory
effect on S1. Furthermore, the activity of S1 FS and SOM inhibitory interneurons also decreases
during whisking (Gentet et al., 2010; Gentet et al., 2012). In the whisker-barrel system, as well as
in other somatosensory systems, motor-related gating occurs at subcortical levels (Furuta et al.,
2008), resulting in reduced stimulus-evoked thalamic firing (Lee et al., 2008). Therefore, the
reduced activity of S1 excitatory and inhibitory neurons during whisking may be a reflection of
decreased thalamic input that is not fully compensated for by corticocortical input from M1.
Elevations in motor cortex firing that precede and accompany whisking may produce a
barrage of excitatory and inhibitory synaptic activity within S1 that contributes to state-
dependent changes observed in cortical neurons during active touch. Transformations in input-
output functions of individual pyramidal neurons as well as the correlated activity between
neurons can be regulated dynamically by the timing and rate of excitatory and inhibitory inputs
(Chance et al., 2002; Prescott and De Koninck, 2003; de la Rocha et al., 2007; Renart et al.,
2010). Moreover, M1 inputs are located more distally along S1 apical dendrites than VPm inputs
(Petreanu et al., 2009). Changes in the balance of proximal and distal synaptic inputs can also
affect neuronal responsiveness (Larkum et al., 2004; Oviedo and Reyes, 2005). Whisking-
associated reductions in sensory-evoked thalamic activity, accompanied by increases in motor
cortex activity, could therefore modify or even sharpen stimulus-encoding properties of S1
neurons. M1-S1 inputs may thus contribute to sensorimotor integration by modulating S1 circuits
through broad recruitment of both excitatory and inhibitory cell populations.
56
3.0 DISTINCT INTRINSIC PROPERTIES AND M1 INPUT TO INFRAGRANULAR
S1 PYRAMIDAL NEURONS PROJECTING TO DIFFERENT TARGETS
3.1 ABSTRACT
The pathway from primary motor cortex (M1) to primary somatosensory cortex (S1) is
thought to influence activity in S1 by conveying a general modulatory signal and/or a copy of the
motor command. The nature of the circuits in S1 that receive such signals are still unknown;
functionally, the impact of M1 inputs may depend on cell-type specific microcircuits within S1.
Recently, we discovered that a subset of pyramidal neurons in the infragranular layers of S1
receive especially strong input from M1 (Kinnischtzke et al., 2013), suggesting that M1 may
differentially contact classes of pyramidal neurons, such as those projecting to different
sensorimotor centers at cortical and subcortical levels. To test this hypothesis, we combined
optogenetic techniques for specifically labeling M1 synaptic inputs to S1 and retrograde tracing
identifying specific populations of projection neurons in infragranular layers of S1. In agreement
with previous findings, we observed that different projection neurons have distinguishing
intrinsic electrophysiological properties. Here we report that the magnitude of M1 inputs to an
S1 neuron is highly dependent on its projection target. These results indicate that M1 may
engage S1 by circuit-specific mechanisms related to how S1 influences subcortical centers from
which it receives afferent input.
57
3.2 INTRODUCTION
During active exploration, sensory and motor systems function in concert so that sensory
feedback can inform ongoing and future movements. Although different regions within the
central nervous system process sensory and motor information, the structures are highly
interconnected to form large-scale sensorimotor integration systems (Kleinfeld et al., 2006;
Petersen, 2007). At the level of the telencephalon, primary somatosensory (S1) and primary
motor (M1) cortices are reciprocally connected (White and DeAmicis, 1977; Porter and White,
1983; Miyashita et al., 1994; Cauller et al., 1998). Both anatomical and physiology studies
demonstrate that S1 sends a strong projection to superficial layers in M1, in particular to neurons
that project back to S1 (Aronoff et al., 2010; Mao et al., 2011). Conversely, M1 densely
innervates and provides the strongest input to the infragranular layers in S1 (Zhang and
Deschenes, 1998; Veinante and Deschenes, 2003; Kinnischtzke et al., 2013).
Layers 5 and 6 of somatosensory cortex contain a diversity of pyramidal neuron
populations that project to a number of cortical and subcortical sites. Our previous study
(Kinnischtzke et al., 2013) demonstrated that pyramidal neurons in S1 are broadly contacted by
M1, consistent with the view that M1 sends a general ‘modulatory’ signal to S1. On the other
hand, we also observed significant variability in the amount of M1 input, with a subset of
neurons in the top of L6 receiving especially large inputs. M1 may therefore differentially
engage specific circuits within S1, possibly those projecting to particular cortical or subcortical
targets.
Here, we investigate synaptic input from M1 onto several classes of S1 pyramidal
neurons: neurons projecting back to M1 (M1-projecting), corticothalamic neurons projecting to
either the posteromedial thalamus (PoM-projecting) or ventral posterior medial nucleus (VPM-

58
projecting), and corticotrigeminal neurons (Sp5-projecting). Our results demonstrate that the
projection target of the neuron is strongly related to both its intrinsic electrophysiological
properties and the strength and effectiveness of the M1 inputs it receives.
3.3 METHODS
All experiments were carried out in compliance with the University of Pittsburgh School
of Medicine animal use policies and were approved by the University of Pittsburgh Institutional
Animal Care and Use Committee.
Channelrhodopsin and retrograde labeling procedures
Viral constructs carrying channelrhodopsin-2 (ChR2) and mCherry genes were injected
into primary motor cortex (M1) as previously described (Kinnischtzke et al., 2013). Briefly, mice
(aged 10-16 postnatal days of age) were anesthetized using isoflurane (1–2%/oxygen) and a
craniotomy was performed over M1 (1.0 mm anterior to and 0.8 mm lateral from bregma). The
virus was pressure-injected at depths of 0.9 and 0.4 mm (corresponding to deep and superficial
layers in M1) within a single penetration. A volume of 0.1-0.2 µl was injected at each depth. We
used the adeno-associated virus construct AAV2/5.CamKIIα.hChR2(H134R)-
mCherry.WPRE.SV40 (University of Pennsylvania Vector Core; permission from Dr. Karl
Deisseroth) for all experiments, as this construct results in strong anterograde expression but
virtually no retrograde transport (Kinnischtzke et al., 2013).
During the same surgery, mice were also injected with red and green fluorescent
59
retrograde tracers (RetroBeads, Lumafluor Inc.). All mice had green retrobeads injected in M1;
the beads were typically co-injected simultaneously with the ChR2 virus (in approximately 1:4
ratio with the virus). Mice were then injected with red fluorescent retrobeads in one of the
following locations: ventral posterior medial (VPM) thalamus, posteromedial (PoM) thalamus, or
the spinal trigeminal nucleus (Sp5). For injections in the thalamus, a small craniotomy was
performed dorsal to VPM (1.4 mm posterior and 1.7 mm lateral to bregma) or PoM (1.6 mm
posterior and 1.4 mm lateral to bregma). Beads were pressure-injected (volume of 0.1-0.2 µl)
using a picospritzer (depth of 3.20 mm for VPM and 3.10 mm for PoM). The pipette was
withdrawn slowly 5-10 minutes after injection to limit inadvertent leakage in the cortex. For Sp5
injections, the brainstem was exposed directly posterior to the cerebellum and the pipette was
advanced at a 40° angle. Retrobeads were pressure injected at depths of 0.8 and 0.6 mm (volume
of 0.1 µl at each depth). Experiments were conducted using the ‘GIN’ transgenic mouse line
(Oliva et al., 2000), in order to be consistent with our previous study.
Slice preparation
Electrophysiological experiments were performed 4-6 weeks following the injection
surgery to allow for transport and full expression of the virus. Mice were between postnatal days
44-74 at the time of experiments. Mice were anesthetized with isoflurane, and the brain was
removed and placed in ice-cold artificial cerebrospinal fluid (ACSF) containing (in mM): 126
NaCl, 3 KCl, 1.25 NaH2PO4, 2 MgSO4, 26 NaHCO3, 10 dextrose, and 2 CaCl2, saturated with
95% O2–5% CO2. The tissue was sliced at 400 µm in the coronal plane using a vibratome.
Slices were incubated at 32 °C for 30–45 min and then maintained at room temperature until
used for recording. Slices containing S1 barrel cortex were identified by the presence of layer IV
60
barrels and a patchy barrel-related pattern of ChR2-mCherry fluorescence (Figure 3.4A). We
recorded primarily from the larger, more medially situated barrels (rows D–E), as this is where
the ChR2-mCherry labeling was typically strongest. We recorded from 1 to 3 adjacent barrel-
related columns per slice.
Recording procedures
All recorded cells were positive for either red or green retrobeads, which allowed for
unambiguous classification of the projection target. Whole-cell recordings were performed using
glass micropipettes (4–10 MΩ) filled with internal solution containing (in mM): 135 K-
gluconate, 4 KCl, 2 NaCl, 10 HEPES, 0.2 EGTA, 4 ATP-Mg, 0.3 GTP-Tris, and 14
phosphocreatine-Tris (pH 7.25, 280–290 mOsm). Biocytin (0.5%) was added to the internal
solution in the majority of experiments. Membrane potentials reported here were not corrected
for liquid junction potential. Recordings were conducted at 32 °C. When patching, cell-attached
seal resistances were ≥1 GΩ, and series resistance after achieving whole-cell configuration was
5–20 MΩ. After establishing whole-cell configuration, a series of current steps was presented in
current-clamp for use in analysis of electrophysiological characteristics. Current steps were 600
ms in duration and presented in 20 pA steps, ranging from −100 to 300 pA. Steps were presented
5 s apart. In voltage-clamp experiments, series resistances ranged from 10 to 40 MΩ and were
compensated for up to 70%. For excitatory postsynaptic current (EPSC) measurements, all cells
were held at a potential of −80 mV. Data were collected using a Multiclamp 700B amplifier and
pClamp10 software (Molecular Devices) at a sampling rate of 20 kHz.
Laminar definitions

61
Laminar boundaries were measured using Nissl stained coronal sections in S1 (Figure
3.1B). Measurements of laminar position are reported as normalized to the top of L5A (value of
0.0) and the bottom of L6 (value of 1.0) to account for slight variability in cortical depth due, for
example, to section plane. The actual, non-normalized, laminar boundary measurements were
similar to previously reported values (Hooks et al., 2011). Border boundaries were based on
changes in cell densities indicated by the Nissl stain. The L4/L5A boundary showed a clear
border, indicated by an abrupt loss of barrel structure and a decrease in the number of cells. The
bottom of L5A was estimated by changes in the density of cells and was typically ~100 µm
below the L4/L5A border. The boundary between L5B and L6 was visible as a notable increase
in cell density near the top of L6; it was typically located approximately halfway between the top
of L5A and the subcortical white matter.
Optical stimulation procedures
All experimental procedures were carried out as previously described (Kinnischtzke et
al., 2013). Full-field blue light (470 nm; OptoLED, Cairn Research) was delivered through a 40x
objective; light intensity at the surface of the slice was ~20 mW/mm2. A single pulse (duration
1.0 ms) was delivered per trial and individual trials were separated by 8 seconds.
Data analysis
Data analyses were performed using custom-written MATLAB codes (The MathWorks,
Natick, MA, USA; A. Kinnischtzke). Intrinsic properties were derived from a series of DC
current steps that were presented to the cell (see above). Input resistance was calculated as the
slope of the voltage-current relationship for subthreshold voltage deflections that were within

62
±30 mV of the resting membrane potential. Using hyperpolarizing current steps, sag current
magnitude (mV) was measured as the difference in the minimum voltage during the initial 100
ms and the mean voltage during the last 50 ms in the step. Because sag currents exhibit a
voltage-dependence, the first current step where the minimum voltage value was greater than -90
mV was used.
Action potential (AP) features were calculated from the first action potential in the first
current step that elicited at least two APs at 10 Hz or greater. AP threshold was measured as the
maximum of the second derivative in the voltage 10 ms preceding the AP peak. AP half-width
was calculated as the width halfway between the AP threshold and the AP peak. To measure
afterhyperpolarization (AHP) depth, the minimum voltage (Vmin) within the 5 ms following the
AP threshold was subtracted from the AP threshold (see Figure 3.3D). To determine the presence
or absence of a depolarizing after-potential (DAP), the local maximum (Vmax) was found
between Vmin and the voltage during the following 10 ms. The voltage 17 ms following Vmin was
also calculated (Vend). If Vmax > Vend, the DAP magnitude was calculated as the difference
between Vmax and Vmin (see Figure 3.3D). If Vmax < Vend, the DAP magnitude was 0.
Rheobase current was the first current step amplitude that elicited at least one action
potential. All spike train properties were calculated from the first current step that resulted in an
average of 10 Hz firing or greater. This was typically ~30 pA (range 0-80 pA) above the
rheobase current. A ‘burst’ was defined as two or more APs with an inter-spike interval (ISI) of
12 ms or less. An initial adaptation ratio was defined as the ISI between the first and second
action potentials divided by the ISI between the second and third action potentials. A steady-state
adaptation ratio was calculated as the ISI between the third and fourth spikes divided by the ISI
of the last two spikes in the train.
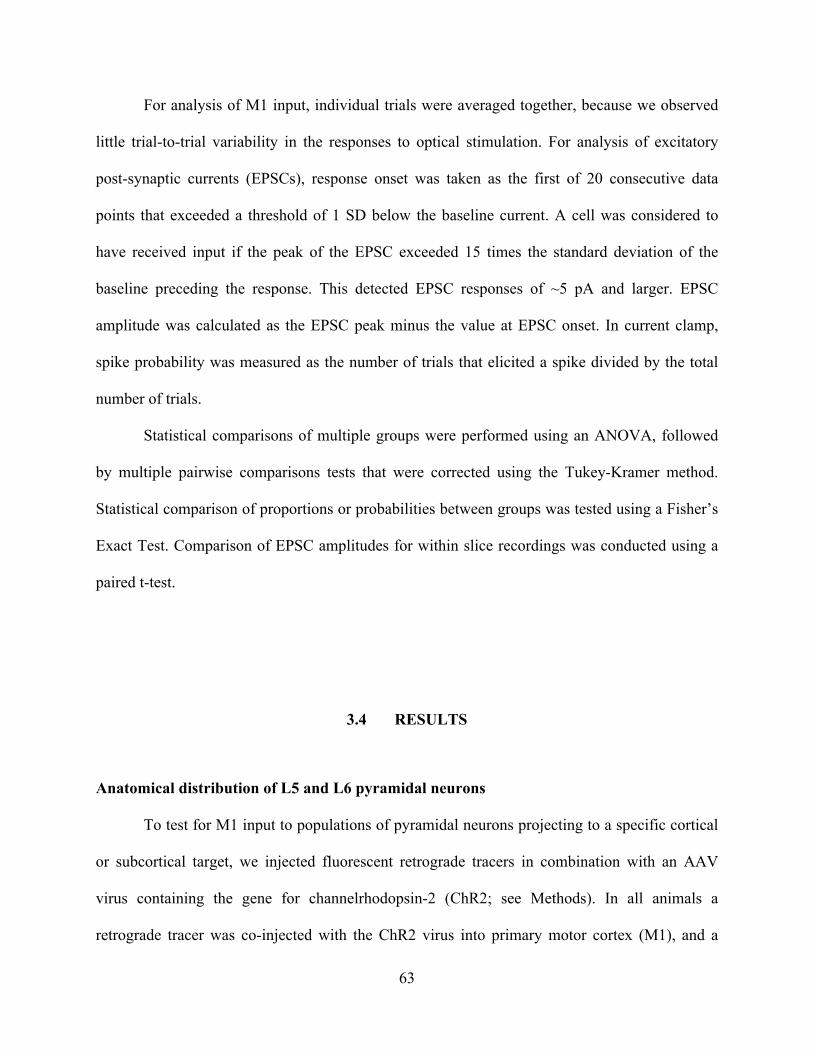
63
For analysis of M1 input, individual trials were averaged together, because we observed
little trial-to-trial variability in the responses to optical stimulation. For analysis of excitatory
post-synaptic currents (EPSCs), response onset was taken as the first of 20 consecutive data
points that exceeded a threshold of 1 SD below the baseline current. A cell was considered to
have received input if the peak of the EPSC exceeded 15 times the standard deviation of the
baseline preceding the response. This detected EPSC responses of ~5 pA and larger. EPSC
amplitude was calculated as the EPSC peak minus the value at EPSC onset. In current clamp,
spike probability was measured as the number of trials that elicited a spike divided by the total
number of trials.
Statistical comparisons of multiple groups were performed using an ANOVA, followed
by multiple pairwise comparisons tests that were corrected using the Tukey-Kramer method.
Statistical comparison of proportions or probabilities between groups was tested using a Fisher’s
Exact Test. Comparison of EPSC amplitudes for within slice recordings was conducted using a
paired t-test.
3.4 RESULTS
Anatomical distribution of L5 and L6 pyramidal neurons
To test for M1 input to populations of pyramidal neurons projecting to a specific cortical
or subcortical target, we injected fluorescent retrograde tracers in combination with an AAV
virus containing the gene for channelrhodopsin-2 (ChR2; see Methods). In all animals a
retrograde tracer was co-injected with the ChR2 virus into primary motor cortex (M1), and a
64
second retrograde tracer was injected into either the ventral posterior medial (VPM) thalamic
nucleus, the posteromedial (PoM) nucleus, or the spinal trigeminal nucleus (Sp5) in the
brainstem (Figure 3.1). For each injection target, the resulting laminar pattern of labeled neurons
in S1 was consistent with known labeling patterns (Wise and Jones, 1977; Chmielowska et al.,
1989; Killackey et al., 1989; Deschenes et al., 1994; Alloway et al., 2004; Hattox and Nelson,
2007; Mao et al., 2011). M1-projecting neurons were found in L2/3, L5A, at the boundary
between L5 and L6 (L5/6), as well as deep in L6 (Figure 3.1A). Neurons projecting to Sp5, on
the other hand, were located exclusively in L5B. Corticothalamic neurons projecting to PoM
were found in L5B, in a similar position as the Sp5-projecting neurons, as well as in deep layer
6. Finally, corticothalamic neurons projecting to VPM were only found in L6 and tended to be
concentrated in the upper half of L6 as has been previously described (Zhang and Deschenes,
1997).
The retrogradely labeled neurons recorded in this study were grouped into the following
five populations: M1-projecting cells in layer 5A (L5A M1-projecting), M1-projecting neurons
near the border of layers 5 and 6 (L5/6 M1-projecting), Sp5-projecting neurons, L5B PoM-
projecting neurons (PoM-projecting), and VPM-projecting neurons. Only two L6 PoM-
projecting neurons were recorded and therefore were not included as an additional population
(see Discussion). Depth measurements, normalized to the layer 4/5A border, revealed that each
population of pyramidal neurons was consistently positioned in specific locations in L5A, L5B,
and/or L6 (Figure 3.1C). Interestingly, each population also tended to be largely segregated
within a layer, with only a small degree of overlap between populations (Figure 3.1C). The
exception was that PoM-projecting neurons and Sp5-projecting neurons in L5B were completely
overlapping in their laminar location (Figure 3.1C).
65
Figure 3.1 Laminar position of S1 pyramidal neurons in L5 and L6 is organized by projection target. (A) Retrobead
injections into M1 (1) resulted in retrogradely labeled pyramidal neurons throughout layer 2-6. Labeled cells were
especially numerous in L5A and the very bottom of L5 and top of L6. Red fluorescent retrobeads injected into the
spinal trigeminal nucleus (2) exclusively labeled S1 neurons in L5B. Injection of retrobeads into the posteromedial
(PoM) thalamus (3) labeled neurons in both L5B and L6, whereas retrobeads in the ventral posterior medial (VPM)
thalamic nucleus (4) only labeled neurons in L6 of S1. In panels 1-4 an inset illustrates the injection target (top;
marked with an asterisk) and an example injection for each target location (bottom). (B) Nissl stained tissue was
used to demarcate laminar boundaries (see Methods). (C) Laminar depth measurements for each recorded cell were
normalized to the top of L5A. Histograms illustrate the distribution of each population within L5 and L6. Open
circles and error bars (right) indicate the mean and standard deviation, respectively, for each population.

66
Co-expression of both red and green fluorescent retrobeads was observed in a few
neurons recorded from animals injected in M1 and Sp5 (n=2; data not shown). These cells were
located in the deep part of L5B and were included in both the Sp5- and L5/6 M1-projecting data
sets. No other cases of co-labeling were observed in this study. Morphological examination of all
pyramidal neurons revealed anatomical differences between the populations that have been
previously described by others (Chagnac-Amitai et al., 1990; Deschenes et al., 1994; Zhang and
Deschenes, 1997; Hattox and Nelson, 2007; Le Be et al., 2007), and therefore were not
quantified further.
Physiological properties of L5 and L6 pyramidal neurons
We compared the electrophysiological characteristics of L5A M1-projecting neurons
(n=23), L5/6 M1-projecting neurons (n=19), Sp5-projecing neurons (n=24), L5B PoM-projecting
neurons (n=15), and VPM-projecting neurons (n=19). As seen in juvenile mice (Hattox and
Nelson, 2007), many subthreshold and action potential characteristics were strongly dependent
on the projection target of the pyramidal neuron (Table 1; Figures 3.2&3.3). All statistical
relationships are listed in Table 1.
Comparisons of passive properties demonstrated that VPM-projecting neurons had the
highest input resistance (241 ± 9.1 MΩ) and PoM- and Sp5-projecting neurons the lowest (131 ±
11.3 MΩ and 106 ± 6.9 MΩ, respectively; Table 1 & Figure 3.3A). These differences are
inversely related to the size of the neurons, as Sp5- and PoM-projecting neurons are among the
largest neurons in S1 and VPM-projecting neurons the smallest. L5A M1- and L5/6 M1-
projecting neurons had significantly more hyperpolarized resting membrane potentials (-65.2 ±
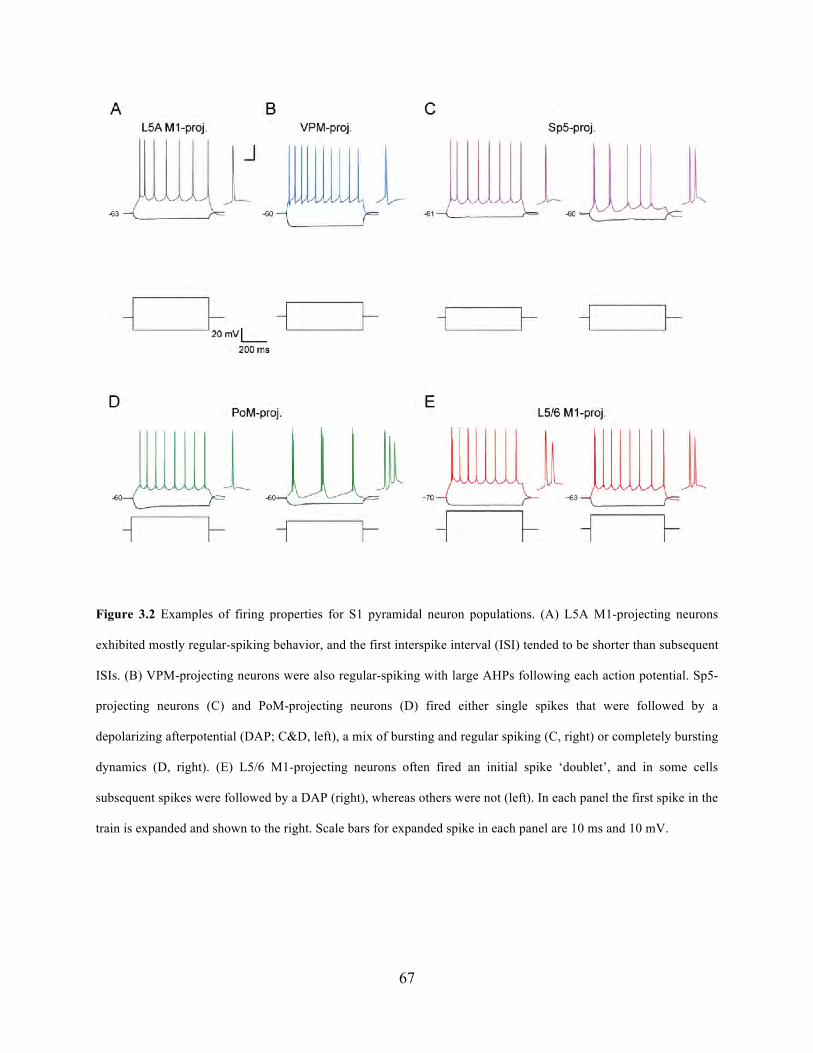
67
Figure 3.2 Examples of firing properties for S1 pyramidal neuron populations. (A) L5A M1-projecting neurons
exhibited mostly regular-spiking behavior, and the first interspike interval (ISI) tended to be shorter than subsequent
ISIs. (B) VPM-projecting neurons were also regular-spiking with large AHPs following each action potential. Sp5-
projecting neurons (C) and PoM-projecting neurons (D) fired either single spikes that were followed by a
depolarizing afterpotential (DAP; C&D, left), a mix of bursting and regular spiking (C, right) or completely bursting
dynamics (D, right). (E) L5/6 M1-projecting neurons often fired an initial spike ‘doublet’, and in some cells
subsequent spikes were followed by a DAP (right), whereas others were not (left). In each panel the first spike in the
train is expanded and shown to the right. Scale bars for expanded spike in each panel are 10 ms and 10 mV.
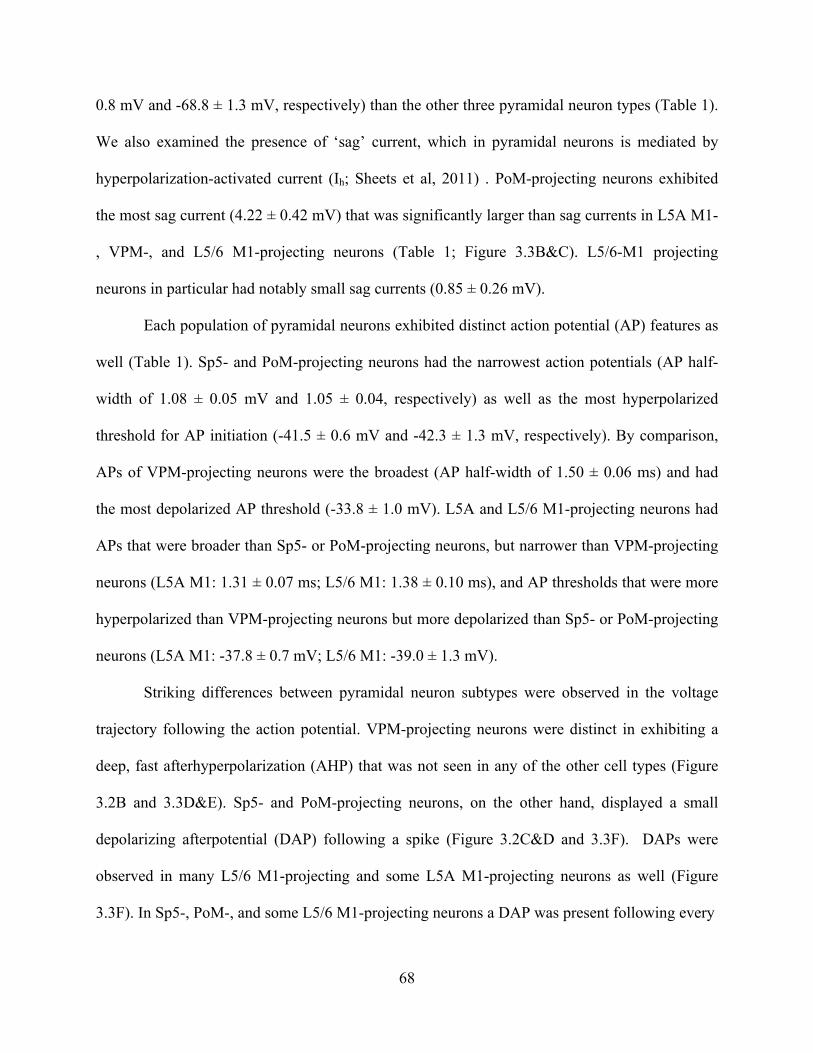
68
0.8 mV and -68.8 ± 1.3 mV, respectively) than the other three pyramidal neuron types (Table 1).
We also examined the presence of ‘sag’ current, which in pyramidal neurons is mediated by
hyperpolarization-activated current (Ih; Sheets et al, 2011) . PoM-projecting neurons exhibited
the most sag current (4.22 ± 0.42 mV) that was significantly larger than sag currents in L5A M1-
, VPM-, and L5/6 M1-projecting neurons (Table 1; Figure 3.3B&C). L5/6-M1 projecting
neurons in particular had notably small sag currents (0.85 ± 0.26 mV).
Each population of pyramidal neurons exhibited distinct action potential (AP) features as
well (Table 1). Sp5- and PoM-projecting neurons had the narrowest action potentials (AP half-
width of 1.08 ± 0.05 mV and 1.05 ± 0.04, respectively) as well as the most hyperpolarized
threshold for AP initiation (-41.5 ± 0.6 mV and -42.3 ± 1.3 mV, respectively). By comparison,
APs of VPM-projecting neurons were the broadest (AP half-width of 1.50 ± 0.06 ms) and had
the most depolarized AP threshold (-33.8 ± 1.0 mV). L5A and L5/6 M1-projecting neurons had
APs that were broader than Sp5- or PoM-projecting neurons, but narrower than VPM-projecting
neurons (L5A M1: 1.31 ± 0.07 ms; L5/6 M1: 1.38 ± 0.10 ms), and AP thresholds that were more
hyperpolarized than VPM-projecting neurons but more depolarized than Sp5- or PoM-projecting
neurons (L5A M1: -37.8 ± 0.7 mV; L5/6 M1: -39.0 ± 1.3 mV).
Striking differences between pyramidal neuron subtypes were observed in the voltage
trajectory following the action potential. VPM-projecting neurons were distinct in exhibiting a
deep, fast afterhyperpolarization (AHP) that was not seen in any of the other cell types (Figure
3.2B and 3.3D&E). Sp5- and PoM-projecting neurons, on the other hand, displayed a small
depolarizing afterpotential (DAP) following a spike (Figure 3.2C&D and 3.3F). DAPs were
observed in many L5/6 M1-projecting and some L5A M1-projecting neurons as well (Figure
3.3F). In Sp5-, PoM-, and some L5/6 M1-projecting neurons a DAP was present following every
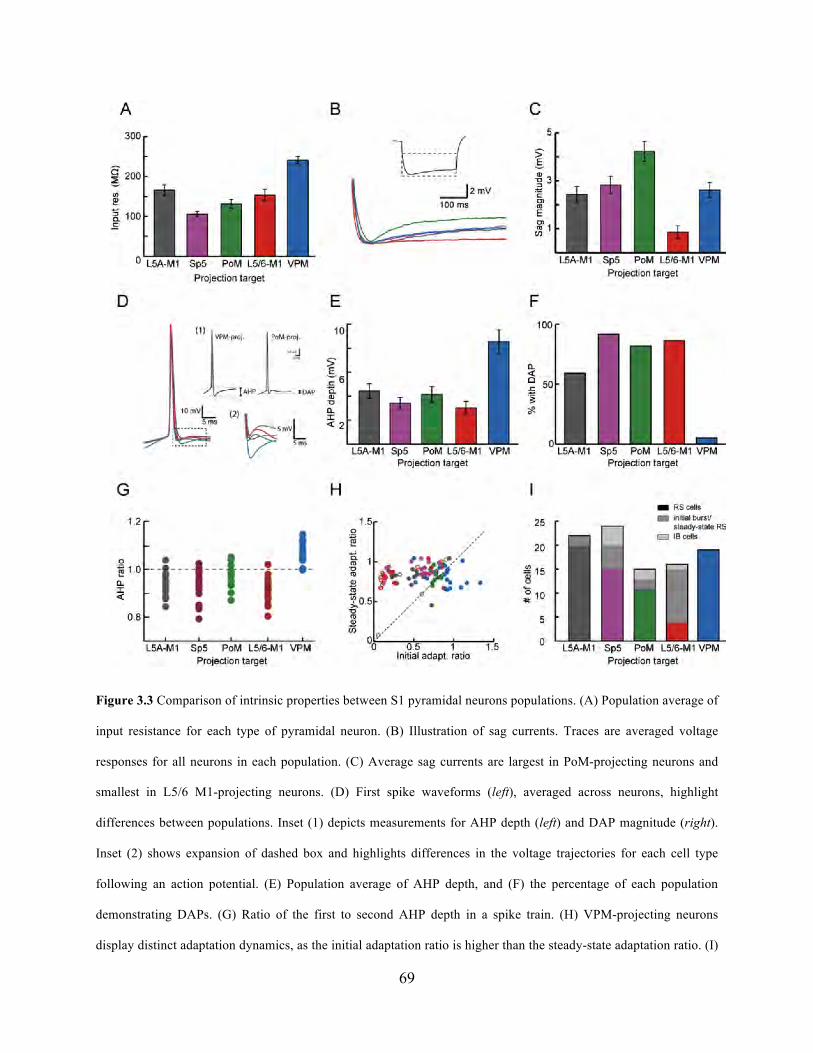
69
Figure 3.3 Comparison of intrinsic properties between S1 pyramidal neurons populations. (A) Population average of
input resistance for each type of pyramidal neuron. (B) Illustration of sag currents. Traces are averaged voltage
responses for all neurons in each population. (C) Average sag currents are largest in PoM-projecting neurons and
smallest in L5/6 M1-projecting neurons. (D) First spike waveforms (left), averaged across neurons, highlight
differences between populations. Inset (1) depicts measurements for AHP depth (left) and DAP magnitude (right).
Inset (2) shows expansion of dashed box and highlights differences in the voltage trajectories for each cell type
following an action potential. (E) Population average of AHP depth, and (F) the percentage of each population
demonstrating DAPs. (G) Ratio of the first to second AHP depth in a spike train. (H) VPM-projecting neurons
display distinct adaptation dynamics, as the initial adaptation ratio is higher than the steady-state adaptation ratio. (I)

70
Number of cells in each population that showed regular spiking (colored bars), initial bursts (medium gray bars), or
intrinsic bursting (light gray bars). In panels A-I statistical relationships are not shown and instead are illustrated in
Table 1. All bars and error bars indicate mean and SEM. Color scheme in B, D, and H is the same as bar plots in
other panels.
spike (Figure 3.2C,D and 3.2E, right). For L5A M1-projecting and the remaining L5/6 M1-
projecting neurons a DAP was only found following the first action potential in a train (Figure
3.2A and 3.2E, left).
DAP potentials in pyramidal neurons are calcium-dependent (Friedman et al., 1992) and
may underlie the generation of bursting behaviors observed in some pyramidal neurons (Llano
and Sherman, 2009). We therefore compared the proportion of pyramidal neurons that were
either completely regular-spiking (RS), displayed an initial burst(s) followed by single spikes
(B/RS), or exhibited bursting throughout the current step (intrinsic bursting [IB]; Figure 3.3I).
VPM-projecting cells were always RS (19/19; Figure 3.2B). L5A-M1 projecting cells were
almost always RS cells (22/23; Figure 3.2A) with one cell exhibiting an initial burst followed by
regular-spiking behavior (B/RS; Figure 3.3I). Neurons projecting to Sp5 could be RS, B/RS, or
IB cells (RS: 12/24; B/RS: 8/24; IB: 4/24; Figure 3.2C); the same was true for PoM-projecting
neurons (RS: 9/15; B/RS: 4/15; IB: 2/15; Figure 3.2D). Interestingly, most L5/6 M1-projecting
neurons were B/RS cells (11/19) as they often exhibited an initial spike ‘doublet’ (Figure 3.2E).
Most of the remaining L5/6 M1-projecting neurons were RS (7/19) although one was an IB cell
(1/19).
Finally, we examined changes in spike properties across the spike train. In VPM-
projecting neurons AHP depth decreased from the 1st spike to subsequent spikes, resulting in an
AHP ratio that was larger than 1 (Figure 3.3G). In the other cell types, the first AHP was

71
Table 1. Intrinsic properties of S1 pyramidal neurons
PROJECTION TARGET SIGNIFICANCE LEVEL
Property L5A M1 (1) Sp5 (2) PoM (3) L5/6 M1 (4) VPM (5) p < 0.05 p < 0.01 p < 0.005
N 23 24 15 19 19 Passive properties Input resistance (MΩ) 166 ± 13.7 106 ± 6.9 131 ± 11.3 153 ± 14.5 241 ± 9.1 2 : 4 1 : 2 5 :
1,2,3,4 Vrest (mV) -65.2 ± 0.8 -62.3 ± 0.9 -62.4 ± 1.4 -68.8 ± 1.3 -61.0 ± 1.1 1 : 5 4 : 2,3,5
Sag current (mV) 2.43 ± 0.32 2.82 ± 0.36 4.22 ± 0.42 0.85 ± 0.26 2.61 ± 0.32 3 : 5 4 : 1,2,3 3 : 1,4
4 : 5
Action potential (AP) features
AP half-width (ms) 1.31 ± 0.07 1.08 ± 0.05 1.05 ± 0.04 1.38 ± 0.10 1.50 ± 0.06 1 : 2,3 4 : 2,3 5 : 2,3
AP threshold (mV) -37.8 ± 0.7 -41.5 ± 0.6 -42.3 ± 1.3 -39.0 ± 1.3 -33.8 ± 1.0 1 : 2,3,5 5 : 2,3,4
AP peak (mV) 43.0 ± 1.0 42.7 ± 1.7 39.8 ± 2.3 43.8 ± 1.7 41.6 ± 1.7 ----------------n.s.------------------
AHP depth (mV) 4.4 ± 0.6 3.4 ± 0.5 4.9 ± 0.8 3.1 ± 0.7 8.6 ± 1.0 5 : 3 5 : 1,2,4
% with depolarizing 59% 92% 87% 94% 5% 1 : 2 1 : 4 5 :
1,2,3,4 after-potential (DAP) (13/22) (22/24) (13/15) (15/16) (1/19)
Spiking properties Rheobase (pA) 71.0 ± 9.6 77.5 ± 7.7 60.0 ± 5.5 96.3 ± 10.4 79.0 ± 7.6 ----------------n.s.------------------
Initial adaptation ratio 0.52 ± 0.04 0.50 ± 0.06 0.69 ± 0.07 0.38 ± 0.08 0.90 ± 0.05 3 : 4 5 : 1,2,4
Steady-state 0.72 ± 0.02 0.88 ± 0.03 0.79 ± 0.04 0.71 ± 0.07 0.70 ± 0.04 2 : 1,4,5 adaptation ratio
% with initial burst
4% 33% 27% 58% 0% 1 : 2
1 : 4
(1/23) (8/24) (4/15) (11/19) (0/19) 4 : 2,3 5 : 2,4
3 : 5
% with steady-state bursts
0% 17% 13% 5% 0% ----------------n.s.------------------
(0/23) (4/24) (2/15) (1/19) (0/19)
shallower than subsequent AHPs and AHP ratios were less than 1 (Figure 3.3G). VPM-
projecting neurons also had different adaptation dynamics, with the inter-spike interval (ISI)
gradually increasing across the spike train (Figure 3.2B). This resulted in initial adaptation ratios
larger than the steady-state adaptation ratios (0.90 ± 0.05 vs. 0.70 ± 0.04; Figure 3.3H; Table 1).
For each of the other cell types, the initial adaptation ratio was typically smaller than the steady-

72
state adaptation ratio. This was particularly evident in the neurons that exhibited an initial burst
(Figure 3.3H; open circles). IB cells were not included in analysis of adaptation dynamics, as the
irregular spike patterns within and between bursts yielded highly variable adaptation values.
Motor cortex input to L5 and L6 S1 pyramidal neurons
All animals were injected with a virus containing the ChR2 gene and retrobeads in M1.
The resultant fluorescence in S1 therefore included both M1 axons, labeled with ChR2-mCherry,
and M1-projecting neurons, labeled with retrobeads. In the same animal a second population of
S1 neurons was labeled with retrograde tracers, either Sp5-, PoM-, or VPM-projecting neurons.
Sp5-, PoM-, and VPM-projecting neurons were labeled and recorded in separate animals. In
order to account for possible differences in ChR2 expression in the different animals, all
experiments were conducted using a paired approach in which L5A M1-projecting neurons were
recorded in the same slice as cells from one of the other pyramidal neuron populations: L5/6 M1-
, Sp5-, PoM-, or VPM-projecting neurons (Figures 3.4&3.5). Paired comparisons could then be
used to determine the strength of M1 inputs relative to a standard population (L5A M1 projecting
neurons).
Recording from a L5A M1-projecting neuron and an Sp5-projecting neuron within the
same slice demonstrated that optical stimulation of ChR2-M1 axons evoked a short-latency,
excitatory post-synaptic current (EPSC) that was similar in amplitude for each cell (Figure 3.4B).
Comparison across the population of paired recordings (n=12 pairs) determined that the average
amplitude of M1 input was equivalent for each population (L5A M1-proj: 113.32 ± 25.97 pA,
Sp5-proj: 138.09 ± 34.51 pA; p=0.31; Figure 3.4D). Similar results were found for L5A M1- and
PoM-projecting neurons (n=9 pairs), indicating that L5A M1-projecting and PoM-projecting
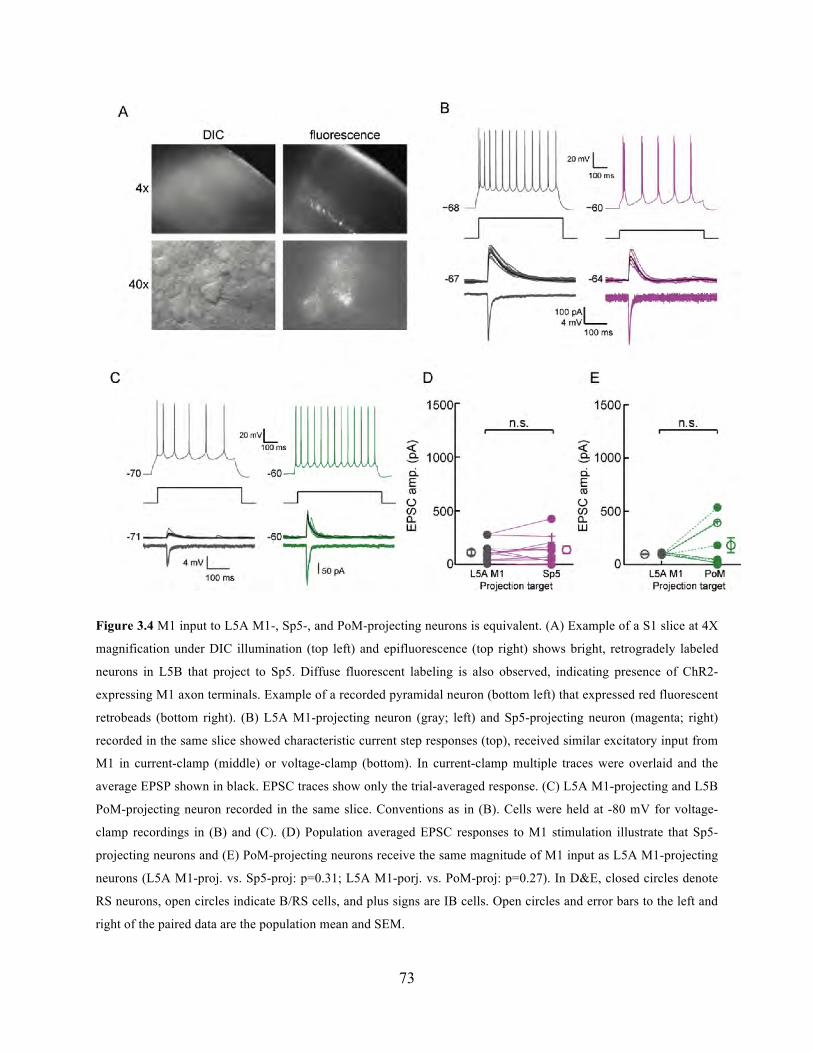
73
Figure 3.4 M1 input to L5A M1-, Sp5-, and PoM-projecting neurons is equivalent. (A) Example of a S1 slice at 4X
magnification under DIC illumination (top left) and epifluorescence (top right) shows bright, retrogradely labeled
neurons in L5B that project to Sp5. Diffuse fluorescent labeling is also observed, indicating presence of ChR2-
expressing M1 axon terminals. Example of a recorded pyramidal neuron (bottom left) that expressed red fluorescent
retrobeads (bottom right). (B) L5A M1-projecting neuron (gray; left) and Sp5-projecting neuron (magenta; right)
recorded in the same slice showed characteristic current step responses (top), received similar excitatory input from
M1 in current-clamp (middle) or voltage-clamp (bottom). In current-clamp multiple traces were overlaid and the
average EPSP shown in black. EPSC traces show only the trial-averaged response. (C) L5A M1-projecting and L5B
PoM-projecting neuron recorded in the same slice. Conventions as in (B). Cells were held at -80 mV for voltage-
clamp recordings in (B) and (C). (D) Population averaged EPSC responses to M1 stimulation illustrate that Sp5-
projecting neurons and (E) PoM-projecting neurons receive the same magnitude of M1 input as L5A M1-projecting
neurons (L5A M1-proj. vs. Sp5-proj: p=0.31; L5A M1-porj. vs. PoM-proj: p=0.27). In D&E, closed circles denote
RS neurons, open circles indicate B/RS cells, and plus signs are IB cells. Open circles and error bars to the left and
right of the paired data are the population mean and SEM.

74
neurons also receive equivalent amount of input from M1 (L5A M1-proj: 97.59 ± 3.44 pA, PoM-
proj: 181.55 ± 69.21 pA; p=0.27; Figure 3.4E). Sp5- and PoM-projecting cells that exhibited
either initial bursts (Figure 3.4D&E, open circles) or were intrinsically bursting (Figure 3.4D&E,
plus signs) received a comparable magnitude of M1 input as the cells that were regular spiking
(Figure 3.4D&E, closed circles).
In contrast to Sp5- and PoM-projecting neurons, many L5/6 M1-projecting neurons had
very large amplitude EPSC responses to optical stimulation (Figure 3.5A). Indeed, M1 input was
often strong enough to evoke action potentials in the L5/6 M1-projecting neuron; action
potentials were never observed in L5A M1-projecting neurons (Figure 3.5A; see also below).
Across the population (n=9 pairs), L5/6 M1-projecting neurons on average received significantly
stronger input from M1 than the L5A M1-projecting neurons (158.62 ± 50.14 pA vs. 700.62 ±
184.66 pA; p=0.01; Figure 3.5C). Many of the L5/6 M1-projecting neurons in our paired sample
that received strong M1 input exhibited an initial spike burst (Figure 3.5C; open circles);
however, large amplitude M1 inputs were observed in regular spiking cells as well (Figure 3.5C;
closed circles).
M1 input to VPM-projecting neurons was also distinct, in this case because these cells
received small input from M1 (n=16 pairs; Figure 3.5B&D). Across all paired recordings, the
amplitude of M1 input to VPM-projecting neurons was significantly less than input to the L5A
M1-projecting cells (161.55 ± 31.58 pA vs. 54.55 ±10.88 pA; p=0.008).
The mean amplitude of M1 input to each population of paired L5A M1-projecting
neurons did not differ (p=0.43), and therefore we pooled data for all pyramidal cell types in order
to make direct comparisons among pyramidal neuron populations (Figure 3.6A). Group data
showed similar results as the paired data, demonstrating that synaptic inputs from M1
75
Figure 3.5 M1 provides strong input to L5/6 M1-projecting neurons and weak input to VPM-projecting neurons.
(A) Example L5A M1-projecting (left, gray) and L5/6 M1-projecting neuron (right, red) responses to current steps
(top). In this pair the L5/6 M1-projecting neuron received larger M1 input as seen in current-clamp (middle) and
voltage-clamp (bottom). Note that the L5/6 M1-projecting neuron fired spikes on several trials (one trial shown in
dashed box inset). Cells were recorded in the same slice. (B) Same as (A) but for a L5A M1-projecting neuron
(gray; left) and VPM-projecting neuron (blue) recorded in the same slice. (C) On average, the L5/6 M1-projecting
neurons received significantly larger input than the paired L5A M1-projecting cells (p < 0.05). (D) VPM-projecting
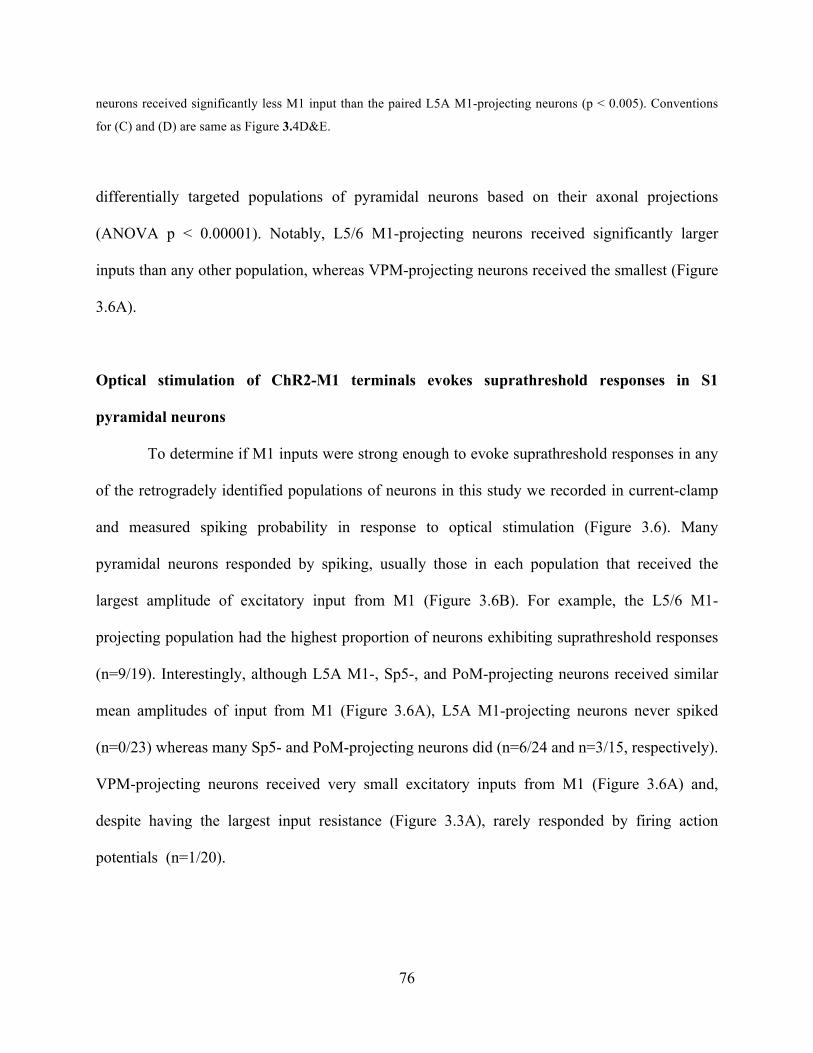
76
neurons received significantly less M1 input than the paired L5A M1-projecting neurons (p < 0.005). Conventions
for (C) and (D) are same as Figure 3.4D&E.
differentially targeted populations of pyramidal neurons based on their axonal projections
(ANOVA p < 0.00001). Notably, L5/6 M1-projecting neurons received significantly larger
inputs than any other population, whereas VPM-projecting neurons received the smallest (Figure
3.6A).
Optical stimulation of ChR2-M1 terminals evokes suprathreshold responses in S1
pyramidal neurons
To determine if M1 inputs were strong enough to evoke suprathreshold responses in any
of the retrogradely identified populations of neurons in this study we recorded in current-clamp
and measured spiking probability in response to optical stimulation (Figure 3.6). Many
pyramidal neurons responded by spiking, usually those in each population that received the
largest amplitude of excitatory input from M1 (Figure 3.6B). For example, the L5/6 M1-
projecting population had the highest proportion of neurons exhibiting suprathreshold responses
(n=9/19). Interestingly, although L5A M1-, Sp5-, and PoM-projecting neurons received similar
mean amplitudes of input from M1 (Figure 3.6A), L5A M1-projecting neurons never spiked
(n=0/23) whereas many Sp5- and PoM-projecting neurons did (n=6/24 and n=3/15, respectively).
VPM-projecting neurons received very small excitatory inputs from M1 (Figure 3.6A) and,
despite having the largest input resistance (Figure 3.3A), rarely responded by firing action
potentials (n=1/20).

77
Figure 3.6 Optical stimulation of ChR2-M1 terminals evoked suprathreshold responses in multiple types of S1
pyramidal neurons. (A) Population average of EPSC amplitude evoked by M1 stimulation showed that L5/6 M1-
projecting neurons received significantly larger M1 input than the other pyramidal neuron populations (p < 0.005).
(B) Pyramidal neurons in each population with largest M1-evoked EPSC often showed non-zero spike probabilities
when recorded in current-clamp. Note that upper left panel shows both L5A M1- (gray circles) and L5/6 M1-
projecting neurons (red circles). Color conventions as in (A). (C) Average spike probability in L5/6 M1 projecting
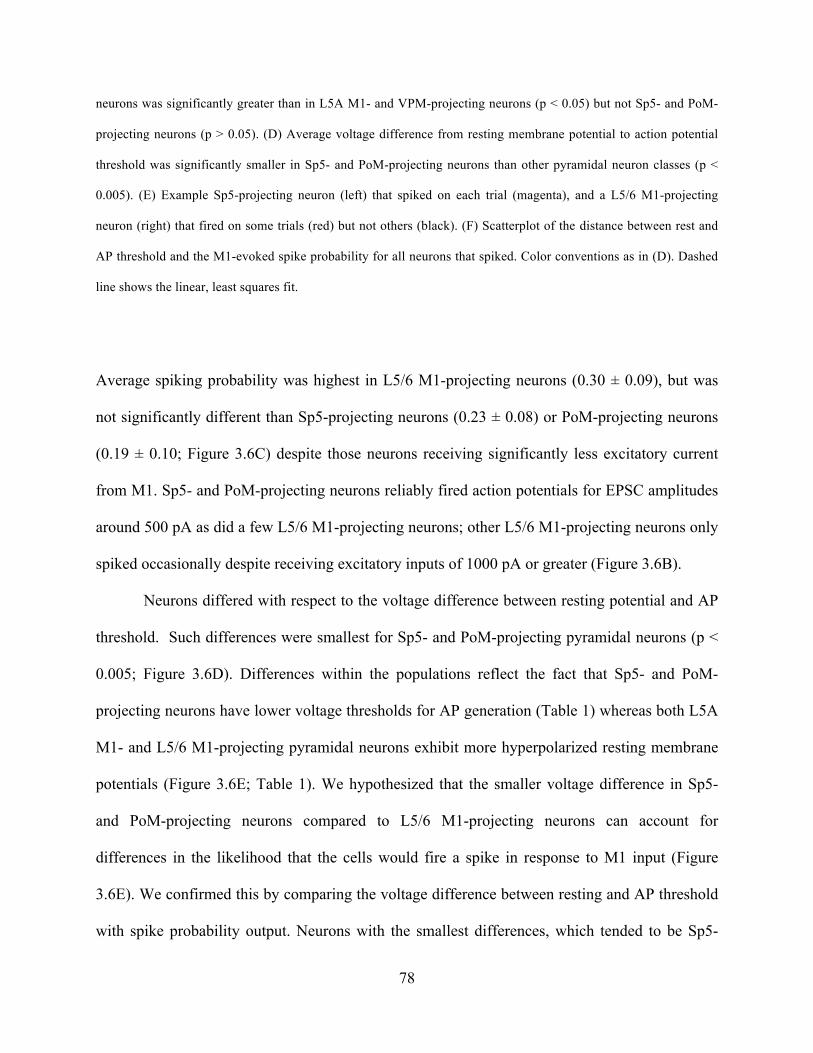
78
neurons was significantly greater than in L5A M1- and VPM-projecting neurons (p < 0.05) but not Sp5- and PoM-
projecting neurons (p > 0.05). (D) Average voltage difference from resting membrane potential to action potential
threshold was significantly smaller in Sp5- and PoM-projecting neurons than other pyramidal neuron classes (p <
0.005). (E) Example Sp5-projecting neuron (left) that spiked on each trial (magenta), and a L5/6 M1-projecting
neuron (right) that fired on some trials (red) but not others (black). (F) Scatterplot of the distance between rest and
AP threshold and the M1-evoked spike probability for all neurons that spiked. Color conventions as in (D). Dashed
line shows the linear, least squares fit.
Average spiking probability was highest in L5/6 M1-projecting neurons (0.30 ± 0.09), but was
not significantly different than Sp5-projecting neurons (0.23 ± 0.08) or PoM-projecting neurons
(0.19 ± 0.10; Figure 3.6C) despite those neurons receiving significantly less excitatory current
from M1. Sp5- and PoM-projecting neurons reliably fired action potentials for EPSC amplitudes
around 500 pA as did a few L5/6 M1-projecting neurons; other L5/6 M1-projecting neurons only
spiked occasionally despite receiving excitatory inputs of 1000 pA or greater (Figure 3.6B).
Neurons differed with respect to the voltage difference between resting potential and AP
threshold. Such differences were smallest for Sp5- and PoM-projecting pyramidal neurons (p <
0.005; Figure 3.6D). Differences within the populations reflect the fact that Sp5- and PoM-
projecting neurons have lower voltage thresholds for AP generation (Table 1) whereas both L5A
M1- and L5/6 M1-projecting pyramidal neurons exhibit more hyperpolarized resting membrane
potentials (Figure 3.6E; Table 1). We hypothesized that the smaller voltage difference in Sp5-
and PoM-projecting neurons compared to L5/6 M1-projecting neurons can account for
differences in the likelihood that the cells would fire a spike in response to M1 input (Figure
3.6E). We confirmed this by comparing the voltage difference between resting and AP threshold
with spike probability output. Neurons with the smallest differences, which tended to be Sp5-

79
and PoM-projecting neurons, had the highest spike probability, while those with larger voltage
differences had lower probability of spiking, despite many of them receiving larger amplitude
EPSCs (Figure 3.6F).
Neurons in the mid-depths of the infragranular layers, on average, received the largest
M1 inputs (Figure 3.7A). Indeed, comparison of spike probability as a function of the laminar
position showed that neurons mostly likely to fire action potentials in response to M1 synaptic
input (i.e. Sp5-, PoM-, or L5/6 M1-projecting neurons) are primarily located within L5B or
upper L6 (Figure 3.7B). This sub-laminar ‘zone’ within S1 may therefore be the most heavily
influenced by increased activity in M1, such as occurs in vivo during whisking.
3.5 DISCUSSION
Here, we combined optogenetic techniques with retrograde tracers to investigate the
anatomy, physiology, and magnitude of M1 input to selected classes of S1 pyramidal neurons in
the infragranular layers. Retrograde tracers allowed unambiguous identification of the projection
target for each recorded neuron. Injection of an AAV virus containing the gene for ChR2
permitted selective activation of synaptic inputs originating in M1.
Our results demonstrate a number of important findings. First, we found that pyramidal
neuron subtypes that project to a particular target are organized within L5 and L6 such that, in
most cases, little spatial overlap occurs among populations. Next, consistent with previous
studies in juvenile mice, S1 pyramidal neurons exhibited a variety of physiological
characteristics that correlated with the projection target of the neuron. L5A M1-projecting

80
Figure 3.7 Activation of M1 primarily modulates L5B and upper L6 of S1. (A) Population graph of the amplitude of
the M1 evoked EPSC as a function of the depth for each neuron indicates that M1 inputs are particularly strong
around the border between L5 and L6. (B) The majority of the neurons that spike in response to optical stimulation
of M1 axon terminals are located in L5B or the top of L6.

81
neurons exhibited classic pyramidal neuron characteristics that are consistent with known
properties of corticocortical neurons. Intriguingly, VPM-projecting neurons possessed
characteristics not typically associated with pyramidal neurons, such as high input resistance and
fast, deep AHPs. Sp5-, PoM, and L5/6 M1-projecting neurons showed the most diversity with
regards to intrinsic properties, as some neurons were regular spiking upon depolarization
whereas others produced bursts of action potentials. Finally, M1 input was highly dependent on
the projection target of the neuron, with VPM-projecting neurons receiving small input and L5/6
M1-projecting neurons receiving large input.
For this study we focused on S1 pyramidal neurons in L5 and/or L6 that projected to one
of four targets (i.e. M1, Sp5, PoM, or VPM). Many other classes of pyramidal neurons exist in
the infragranular layers, including neurons projecting to contralateral S1, secondary
somatosensory cortex (S2), striatum, and the pons among others (White and DeAmicis, 1977;
Wise and Jones, 1977; Wilson, 1987; Killackey et al., 1989; Petrof et al., 2012). Future studies
will be needed to obtain a complete map of M1 inputs to all types of pyramidal neurons in S1.
However, our results here demonstrate a remarkable degree of specialization and specificity
regards to sub-laminar organization, intrinsic properties and spike dynamics, and M1 synaptic
input to these S1 pyramidal neuron populations.
Comparison of L5A and L5/6 M1-projecting neurons in S1
In our study we distinguished between two populations of M1-projecting neurons on the
basis of their non-overlapping locations within L5. The first population was restricted to L5A,
residing just below the boundary between L4 and L5. These neurons were thin tufted pyramidal
neurons (data not shown) and demonstrated typical corticocortical spike properties. L5A M1-
82
projecting neurons were relatively homogeneous in their intrinsic properties, exhibiting
predominantly regular-spiking behavior and similar passive properties and spike adaptation
dynamics as other corticocortical neurons (Hattox and Nelson, 2007).
The second population of M1-projecting neurons was located near the L5/6 boundary.
M1-projecting neurons have been previously shown to exist in the deep layers in rats (Zhang and
Deschenes, 1997; Alloway et al., 2004). The physiology of L5/6 M1-projecting neurons was
heterogeneous. Many displayed similar passive and spike dynamics as the L5A M1-projecting
neurons; these cells may therefore also be corticocortical neurons that have M1 as their primary
target. However, other L5/6 M1-projecting neurons instead resembled Sp5- and PoM-projecting
neurons based on the presence of a DAP following each action potential and bursting tendencies.
Given that we observed a few instances of co-labeled neurons in animals injected with retrobeads
in M1 and Sp5, perhaps those M1-projecting neurons resembling Sp5-projecting neurons are
actually corticofugal neurons (e.g. Sp5-projecting) that send a collateral to M1.
Based on our previous study, we hypothesized that a specific class of pyramidal neurons
near the top of L6 received particularly strong input from M1. The finding that it was a subset of
M1-projecting neurons only located around the L5/6 border was unexpected (see General
Discussion). It is especially interesting that L5/6 M1-projecting neurons received significantly
stronger input than L5A M1-projecting neurons. A previous study also found that M1-projecting
neurons in L5A, as well as those in L2/3, do not receive especially strong input from M1 (Mao et
al., 2011). Together, these results suggest a unique role for L5/6 M1-projecting neurons in
serving as a sensory feedback signal to M1 during conditions when M1 activity is high.
Similarities between L5B PoM- and Sp5-projecting pyramidal neurons

83
Sp5-projecting neurons and PoM-projecting neurons in L5B were equivalent for all the
intrinsic properties we measured and were intermixed within layer 5B. L5B PoM- and Sp5-
projecting neurons, therefore, appear to be more similar to each other than to other types of L5
pyramidal neuron types, such as M1-projecting neurons and VPM-projecting neurons (this
study), or callosal and corticostriatal neurons (Hattox and Nelson, 2007). Sp5-projecting neurons
send a collateral to PoM, giving rise to the possibility that Sp5- and PoM-projecting neurons in
L5B may be largely the same population of neurons (Deschenes et al., 1994). However, co-
labeling within the same animal indicated that only a small percentage of Sp5- and PoM-
projecting neurons project to both targets (Hattox and Nelson, 2007). Either way, our results
suggest that PoM-projecting and Sp5 projecting neurons in layer 5B have similar or closely
related functions.
Many Sp5- and PoM-projecting neurons exhibited bursting properties, either initially or
continuously in response to current step injection. In the auditory system, only corticothalamic
neurons located in L5B, not those in L6, exhibited bursting behaviors (Llano and Sherman,
2009), similar to our results in this study within S1. Throughout sensory and motor cortices,
intrinsically bursting (IB) neurons are large, thick-tufted pyramidal neurons that reside in L5B
and project subcortically, such as corticotectal and corticopontine neurons (Tseng and Prince,
1993; Wang and McCormick, 1993; Kasper et al., 1994; Rumberger et al., 1998). Across the
cortex, therefore, neurons with intrinsic bursting behaviors appear to be restricted to pyramidal
neurons in L5B that project to the thalamus, midbrain, or brainstem.
Interestingly, PoM- and Sp5-projecting neurons that were regular spiking (RS) still
displayed different dynamics from regular spiking M1- or VPM-projecting neurons. In Sp5- and
PoM-projecting neurons, every action potential is followed by a small depolarization (DAP).

84
DAPs are calcium-dependent (Friedman et al., 1992), and it has been suggested that the DAP
underlies the bursting behavior in these neurons (Llano and Sherman, 2009). Therefore, RS
neurons that exhibit DAPs may be capable of firing in bursts to certain types of stimuli and/or
under certain conditions (Schwindt et al., 1997; Schwindt and Crill, 1999). This is in contrast to
early electrophysiological studies, which classified neurons as either RS or IB cells (McCormick
et al., 1985; Agmon and Connors, 1989). Thus, in the case of PoM- and Sp5-projecting neurons,
RS and IB neurons may possess the same underlying dynamics and ionic currents and could
represent a continuum of a single cell type, not two discrete populations (Schwindt et al., 1997).
Furthermore, bursting behavior is developmentally regulated and is only seen in adult
corticothalamic neurons (Kasper et al., 1994; Llano and Sherman, 2009). In juveniles, all L5B
corticothalamic and corticotrigeminal neurons are regular spiking but still exhibit DAPs (Hattox
and Nelson, 2007; Llano and Sherman, 2009).
PoM- and Sp5-projecting neurons received only moderate amount of synaptic input from
M1, yet because of their intrinsic properties fired relatively easily in response to M1 synaptic
stimulation. In vivo, L5B thick tufted neurons, which likely include PoM- and Sp5-projecting
neurons, have the highest spontaneous firing rates of all S1 pyramidal neurons during both
quiescent and whisking brain states (de Kock et al., 2007; de Kock and Sakmann, 2009), and also
have robust whisker-evoked sensory responses (de Kock et al., 2007). In a similar manner to our
results with M1 input, Sp5- and PoM-projecting neurons may therefore fire robustly to moderate
amounts of synaptic input from many sources, both sensory and motor.
Unique properties of VPM-projecting neurons
85
Of the pyramidal neuron populations examined here, VPM-projecting neurons were the
most distinct with regards to intrinsic properties (Figure 3.2; Table 1). VPM-projecting neurons
had high input resistance, which is probably related to their compact size, and exhibited deep
AHPs, slow adaptation dynamics, and were always regular-spiking. It is worth noting that the
few L6 PoM-projecting neurons we recorded (n=2) resembled L6 VPM-projecting neurons in
their intrinsic properties, not the L5B PoM-projecting neurons (data not shown). Therefore, as
suggested for auditory cortex (Llano and Sherman, 2009), corticothalamic feedback in S1 may
be laminar, not projection, specific with corticothalamic neurons in L5B (i.e. PoM-projecting
only) having a different role than corticothalamic neurons in L6 (i.e. VPM- and PoM-
projecting;).
M1 sends a dense projection to L6 of S1 (Zhang and Deschenes, 1998), where VPM-
projecting neurons comprise about half of all neurons (Zhang and Deschenes, 1997). It was
therefore unexpected that M1 input instead strongly contacted the M1-projecting neurons in the
very top of L6, while the input to VPM-projecting neurons was actually the weakest of all the
pyramidal neuron populations we examined in this study (Figure 3.6A). Interestingly,
enhancement of M1 activity in vivo activates VPM-projecting neurons (Lee et al., 2008). This
engagement of VPM-projecting neurons in vivo may require the conjunction of M1 input with
another source of input, perhaps one that is sensory in nature (see General Discussion).
86
4.0 GENERAL DISCUSSION
4.1 SUMMARY OF FINDINGS
The function of the pathway from M1 to S1 continues to be examined, but these studies
have laid a foundation for understanding how increased activity in M1, as occurs during
whisking, will engage excitatory and inhibitory circuits in layers 2-6 of S1. Our findings
demonstrate a broad excitation of excitatory and inhibitory neurons in the supragranular and
infragranular layers, but a striking paucity of connections with barrel circuits in L4. Furthermore,
our results suggest that while pyramidal cells in the superficial layers receive only weak
excitation, specific pyramidal cell populations in the infragranular layers are driven strongly by
M1. This increased excitation in deep layers is mirrored by stronger recruitment of inhibition,
specifically of FS inhibitory interneurons in L5 and L6. Most inhibitory and pyramidal cells that
receive direct M1 input also receive disynaptic inhibition, indicating an important role for
inhibition in regulating excitatory connections between M1 and S1.

87
4.2 EFFECTS OF M1 ACTIVATION ON S1 CIRCUITS
4.2.1 Differential contributions of FS and SOM inhibitory interneurons
One main finding of this work is that M1 inputs ubiquitously contact two main inhibitory
interneuron classes, FS and SOM inhibitory cells. Because M1 synapses onto both the
perisomatic and apical dendrite of individual S1 pyramidal neurons (Petreanu et al., 2009), M1
may recruit somatic inhibition (i.e. FS cells) and dendritic inhibition (i.e. SOM interneurons) to
regulate the excitatory drive to both subcellular domains.
Although both inhibitory interneuron subtypes were broadly contacted by M1, synapses
onto FS cells were large but strongly depressing while SOM inhibitory interneurons received
weak, facilitating synaptic input. These dynamics are strikingly similar to those for local cortical
excitatory synapses and, in the case of FS cells, thalamocortical input. Therefore, FS inhibitory
interneurons may regulate the excitatory drive from M1 in a similar manner to thalamocortical
input; that is by sharpening the S1 response to the onset of M1 activity through feedforward
somatic inhibition. In contrast, SOM inhibitory interneurons, due to the facilitating nature of
excitatory synapses onto them, are maximally activated by high-frequency bursts of action
potentials in pre-synaptic pyramidal neurons (Kapfer et al., 2007; Berger et al., 2010). Bursts of
action potentials caused by excitatory input to the apical dendrite are inhibited by dendritic
inhibition mediated, at least in part, by SOM interneurons (reviewed in Palmer et al, 2012).
Therefore, the facilitating nature of excitatory inputs to SOM cells, both local and long-range,
may serve to recruit dendritic inhibition and thereby regulate the prevalence and/or propagation
of bursting activity in pyramidal neurons.

88
4.2.2 M1 contribution to state-dependent changes in S1 neurons
Cortical brain states during active behavior, relative to quiescent or anesthetized periods,
are associated with increased neuromodulator actions, altered thalamocortical drive, and
increased intercortical interactions. Specifically, in S1 this translates to decreased afferent drive
from VPM and increased input from M1 and possibly other cortical areas. Heightened
corticocortical activity is likely responsible for the increased levels of calcium activity in the
apical dendrites of L5 pyramidal neurons during awake behaving states (Murayama and Larkum,
2009). In fact, a recent study found that calcium-dependent dendritic potentials occur in the
apical dendrites of L5 S1 pyramidal neurons during active but not passive touch; furthermore,
these dendritic potentials were dependent on input from M1 (Xu et al., 2012). The broad, but
subthreshold M1 inputs to L2/3 and L5 S1 pyramidal neurons we reported in the first study may
serve to heighten activity in the apical dendrites, which when combined with other inputs,
perhaps sensory in nature, could contribute to the generation of dendritic calcium potentials.
How increased activity in the apical dendrites in vivo translates to spike output at the soma is not
yet clear, but a matter of ongoing research.
Our results in the second study add several important points regarding the function of M1
input to S1. First, M1 input to pyramidal neurons varies based on their projection target.
Therefore, the function of the M1 to S1 pathway may broadly modulate S1 neurons, but also
have circuit-specific effects through stronger inputs to certain types of pyramidal neurons.
Secondly, the intrinsic properties also vary depending on the projection target of the neuron.
These results emphasize that M1 feedback does not equally engage all S1 neurons and
therefore needs to be thought of in the context of specific circuits. For example, why do only
pyramidal neurons that project subcortically exhibit intrinsic bursting? Perhaps M1 input during
89
active touch produces bursts of action potentials in PoM- and Sp5-projecting neurons but only
weakly excites VPM-projecting neurons. Why would this be important for the system? To
address this we will consider the specific type of projection neurons and their properties that we
looked at in these studies.
4.3 M1 REGULATION OF CORTICAL AND SUBCORTICAL S1 PROJECTIONS
4.3.1 M1-S1 reciprocal circuitry
Regarding the reciprocal S1 to M1 pathway, optical mapping studies indicate that M1
neurons in L2/3 and L5A receive stronger input from S1 than L5B and L6 M1 neurons (Mao et
al., 2011). Interestingly, S1-projecting neurons in L2/3 and L5A receive particularly strong input
from S1 compared to other nearby pyramidal neurons (Mao et al., 2011). Together with our
findings, this suggests that superficial S1-projecting neurons in M1 receive strong S1 input,
while deep M1-projecting neurons in S1 receive strong M1 input (Figure 4.1A&B).
Whether these M1-S1 connections involve direct recurrent loops involving the same local
neurons, or groups of neurons, is still unclear. For example, the upper layer M1 neurons that
receive strong S1 input are neurons projecting back to S1 (Figure 4.1A), but what layers and
neurons within S1 do they target? How do they interact with the L5/6 M1-projecting neurons in
our study that receive strong M1 input (Figure 4.1B)? A number of circuit interactions are
possible given the information we currently know. One possibility is that they could interact
directly, forming a strong, direct recurrent loop (L2/3 and L5A M1 ↔ L5/6 S1; Figure 4.1C). A

90
second option is that they interact indirectly, through multiple laminar interactions within S1 and
M1 (for example: L2/3 S1 → L2/3 M1 → L5/6 M1→ L5/6 S1). Finally, it is also unknown how
M1-projecting neurons across different S1 layers interact with one another. Do L2/3, L5A, and
L5/6 M1-projecting neurons preferentially synapse with one another, forming sub-networks in
S1? Future studies that utilize more targeted expression of ChR2, either in specific layers or
specific populations of projection neurons, are needed to answer each of these questions.
Based on known information, we suggest a circuit model wherein superficial layers of S1
and M1 are strongly connected from S1 to M1 and weakly connected in the reverse direction
(Figure 4.1D). Such a pathway may serve to propagate sensory information from S1 to M1
(Ferezou et al., 2007). Conversely, the deep layers are strongly connected from M1 to S1 with a
weaker connection in the other direction. In agreement with this idea, anatomical studies indicate
that a dense projection exists from L5/6 of M1 to L5/6 of S1 (Zhang and Deschenes, 1998).
Interestingly, M1 neurons in the deep layers that project to S1 are both callosal and corticofugal
neurons (Veinante and Deschenes, 2003). The signal being relayed from M1 to S1 via M1
corticofugal neurons may be a copy of the motor command sent subcortically. However, an
additional M1 to S1 circuit via M1 callosal neurons may also exist. The function of this circuit is
less clear, but may carry to S1 information other than a copy of the subcortical motor command.
91
Figure 4.1 Schematic illustrating M1-S1 circuit interactions. (A) and (B) illustrate known information; (C) & (D)
show possible models. (A) S1-projecting neurons in L2/3 and L5A of M1 receive strong S1 input. (B) L5/6 M1-
projecting neurons in S1 receive strong M1 input. (C) Illustration of direct loops between superficial M1 and deep
layer S1. (D) Proposed circuit model strongest connections are from superficial S1 to superficial M1, and deep M1
to deep S1 layers.

92
4.3.2 M1 influence on cortical feedback to VPM
VPM-projecting neurons in vivo are quiescent, exhibiting little or no spontaneous firing;
neither do they reliably respond to whisker deflection, even when the animal is awake (Swadlow
and Hicks, 1996). However, when activity in M1 is pharmacologically heightened, VPM-
projecting neurons become more responsive to whisker deflections (Lee et al., 2008). Because in
our study M1 input is weak and did not evoke action potentials in VPM-projecting neurons, our
results, albeit in an in vitro preparation, argue against direct suprathreshold activation of VPM-
projecting neurons by M1. However, M1 activity could excite VPM-projecting neurons
indirectly in a number of different ways. For example, other S1 pyramidal neurons that are
activated by M1, such as L5/6 M1-, Sp5-, or PoM-projecting neurons, may send a recurrent
excitatory collateral onto VPM-projecting neurons, activating them via a disynaptic excitatory
circuit within S1. However, corticothalamic neurons in L6 are relatively unconnected with
cortical neurons in other layers and instead receive the majority of their excitatory input from
other neurons in L6 (Zarrinpar and Callaway, 2006; Llano and Sherman, 2009).
Another possibility is that small input from M1 could combine with subthreshold input
from another source, such as VPM, to evoke firing in VPM-projecting neurons. VPM-projecting
neurons do receive input from VPM (White and Hersch, 1982), however this input alone also
seems to be insufficient to evoke spiking activity since VPM-projecting neurons do not exhibit
reliable suprathreshold responses to whisker deflections (see above). Therefore, perhaps VPM-
projecting neurons act as ‘coincidence detectors’ by only firing when excitatory inputs from
multiple sources are active. This would support the finding that VPM-projecting neurons become
responsive to whisker deflection only when paired with activation of M1 (Lee et al., 2008). This
idea would predict that VPM-projecting neurons might be more responsive during active touch,
93
when animals are actively moving their whisker while palpating an object thereby activating
both the sensory and motor systems.
4.3.3 Cortical regulation of PoM and Sp5 circuits
An interesting difference between cortical feedback to PoM and VPM is the
presence of L5B corticofugal neurons that send a collateral to PoM, but not VPM, en route to the
brainstem. These corticothalamic synapses in PoM are very strong but also highly depressing
(Reichova and Sherman, 2004; Groh et al., 2008). Therefore, the relatively high in vivo firing
rates of PoM-projecting neurons and other subcortically projecting L5B neurons (de Kock et al.,
2007) may cause these synapses to remain in a depressed, less effective state (Groh et al., 2008).
Intriguingly, if L5B PoM-projecting neurons transition between regular-spiking and
intrinsically bursting dynamics in vivo, this could change the transfer of information at the L5B-
PoM corticothalamic synapses in two ways, similar to the effects of thalamic bursting on cortical
neurons (Swadlow and Gusev, 2001; Llano and Sherman, 2009). First, the high frequency
spiking within a burst could increase the probability of information propagating through a
depressed synapse; secondly, the relatively long time interval between bursts could allow for
recovery of the synapse from synaptic depression (Llano and Sherman, 2009). Combination of
these two features would allow for increased communication from S1 to PoM during states when
PoM-projecting neurons are in burst mode. Whether the S1 to Sp5 synapse shows similar
synaptic properties is unknown. If so, a similar model could regulate S1 input to Sp5 as well.
Finally, if M1 input to PoM- and Sp5-projecting neurons changes the incidence of burst firing,

94
via its input to the apical tuft in L1, it could regulate the information transfer between S1 and its
subcortical projections.
4.4 GENERAL IMPLICATIONS
Some models of the cerebral cortex assume that cortical connectivity is random and
indiscriminate; that is, a given axon will synapse with equal probability on all neurons within it
target zone. In this case, the actual number of synapses on a given neuron simply reflects,
statistically, the number of contacting terminals and the number of available post-synaptic sites.
Because pyramidal cell morphology is relatively uniform, at least when compared to that of
interneurons, such models often consider pyramidal neurons, especially neighboring ones, as a
single population. However, accumulating evidence demonstrates that pyramidal neurons differ
with respect to their intrinsic properties and their local and extrinsic projections. Based on these
properties, recent studies have found that excitatory connections among local S1 pyramidal
neurons are not random, but instead can form subnetworks based on either similar physiological
properties (Otsuka and Kawaguchi, 2008), number of shared pre-synaptic neurons (Perin et al.,
2011), or the projection target of the neurons (Brown and Hestrin, 2009; Otsuka and Kawaguchi,
2011). Incorporating non-uniform connections between excitatory neurons can greatly alter the
dynamics and properties of a cortical network (Litwin-Kumar and Doiron, 2012).
The findings of the studies in this thesis argue strongly against an indiscriminate
connection model regarding long-range corticocortical connections. Indeed, present findings
indicate a high degree of specificity not only in the connections from M1 to excitatory versus

95
inhibitory S1 neurons but also to different sub-classes of interneurons and of pyramidal cells. In
the case of the latter, projection target, and hence effects on other brain regions, may be the most
important factor. Our studies do not distinguish whether the larger inputs onto some classes of S1
pyramidal neurons are due to larger unitary inputs and/or the convergence of a larger number of
M1 neurons onto a single post-synaptic S1 neuron, although both have interesting implications.
Our findings of M1 to S1 specificity are entirely consistent with rules of cortical circuitry
originally formalized by White (1989) based on his careful light and electron microscope studies
of VPM input to L4 neurons and to pyramidal neurons projecting to M1, striatum, and the
thalamus. First, axon terminals from any extrinsic source will form synaptic contacts with every
neuronal type within its axonal projection field that is capable of receiving that type of synapse.
Second, neuron types will receive characteristic patterns of synaptic input regarding the actual
numbers and proportions of synapses. Regarding our findings, a functional counterpart of these
rules is that inputs from M1 may generally modulate S1 circuitry by synaptically contacting
multiple cell types at different depths within a cortical column, but such inputs will also engage
to different degrees specific cell populations based on their extrinsic, and possibly local,
projections.

96
APPENDIX A
POSTNATAL MATURATION OF SOMATOSTATIN-EXPRESSING INHIBITORY
CELLS IN THE SOMATOSENSORY CORTEX OF GIN MICE
A.1 ABSTRACT
Postnatal inhibitory neuron development affects mammalian brain function, and failure of
this maturation process may underlie pathological conditions such as epilepsy, schizophrenia and
depression. Furthermore, understanding how physiological properties of inhibitory neurons
change throughout development is critical to understanding the role(s) these cells play in cortical
processing. One subset of inhibitory neurons that may be affected during postnatal development
is somatostatin-expressing cells. A subset of these cells is labeled with green-fluorescent protein
(GFP) in a line of mice known as the GIN line. Here, we studied how intrinsic
electrophysiological properties of these cells changed in the somatosensory cortex of GIN mice
between postnatal ages P11 to P32+. GIN cells were targeted for whole-cell current clamp
recordings and ranges of positive and negative current steps were presented to each cell. The
results showed that as the neocortical circuitry matured during this critical time period, multiple
intrinsic and firing properties of GIN inhibitory neurons, as well as those of excitatory (regular-
spiking [RS]) cells, were altered. Furthermore, these changes were such that the output of GIN
97
cells, but not RS cells, increased over this developmental period. We quantified changes in
excitability by examining the input-output relationship of both GIN and RS cells. We found that
the firing frequency of GIN cells increased with age, while the rheobase current remained
constant across development. This created a multiplicative increase in the input-output
relationship of the GIN cells, leading to increases in gain with age. The input-output relationship
of the RS cells, on the other hand, showed primarily an additive shift with age, but no substantial
change in gain. These results suggest that as the neocortex matures, inhibition coming from GIN
cells may become more influential in the circuit and play a greater role in the modulation of
neocortical activity.
A.2 INTRODUCTION
The second and third postnatal weeks are a period of massive developmental change
within the rodent neocortex. This is the time of sensory onset for multiple sensory modalities,
including the visual, auditory, and somatosensory systems (Welker, 1964, Ehret, 1976, Hensch,
2005). This time window represents a ‘critical period’ for the brain, as the organization of neural
circuitry that develops within this time remains relatively fixed throughout adulthood. Diseases
such as schizophrenia, which do not appear until late adolescence in humans, are thought to be a
manifestation of pathological alterations in developmental processes, potentially in inhibitory
neurons (Lewis et al., 2005). Understanding the development of cortical circuits during this
period is therefore an important component to understanding both normal and pathological
cortical function.
98
Maturation of inhibitory circuitry is of particular importance for shaping cortical activity
during postnatal development (Hensch, 2005). Investigation of inhibitory interneuron
development in multiple cortical areas reveals that during the second to third postnatal weeks,
inhibitory cells undergo changes in their physiological, molecular, and anatomical characteristics
and do not reach maturation until the third week of postnatal development or later (Goldberg et
al., 2011, Lazarus and Huang, 2011, Oswald and Reyes, 2011). In mice and rats, the animals first
begin actively using their whiskers around postnatal day 14, signaling the onset of active sensory
processing within the somatosensory system (Welker, 1964, Mosconi et al., 2010). During the
first few weeks of postnatal development, inhibition onto pyramidal neurons in somatosensory
cortex increases in amplitude and frequency (Kobayashi et al., 2008), and alterations in sensory
experience, such as whisker removal, cause substantial disruptions to the intrinsic and synaptic
properties of inhibitory interneurons (Jiao et al., 2006, Daw et al., 2007, Lee et al., 2007,
Chittajallu and Isaac, 2010, Jiao et al., 2011).
Understanding maturation of inhibitory circuits is important for determining how neurons
control synaptic integration and communication within and amongst cortical areas during
development. Most studies investigating how development of inhibitory neurons affects cortical
circuitry have focused on one type of inhibitory neuron, known as the fast-spiking (FS) or
parvalbumin-expressing (PV) cells. These cells represent a major subtype of inhibitory neurons,
but only constitute approximately half of inhibitory neurons as a whole (Markram et al., 2004).
A second major class of inhibitory neurons is the somatostatin-expressing (SOM) inhibitory
cells. However, the developmental trajectory of SOM cells in the somatosensory system is
largely unknown. One recent study found that the intrinsic properties of SOM cells in the visual
99
cortex change during the second postnatal week and suggested SOM cells may be involved in
ocular dominance plasticity (Lazarus and Huang, 2011).
The role of SOM inhibitory cells in the neocortex has yet to be fully understood. Because
the properties of these cells differ significantly from other inhibitory cells, such as PV cells, it is
thought that they could play a unique role in neocortical processing. In contrast to PV cells,
which target the perisomatic regions of their downstream cells, SOM cells primarily target the
dendrites of pyramidal neurons. They may therefore be important for regulating and modulating
incoming synaptic inputs. Recent in vivo recordings from superficial SOM cells in mouse
somatosensory cortex have found that activity in SOM cells is suppressed during both passive
whisker deflection and during active whisking states (Gentet et al., 2012). This loss of dendritic
inhibition may function to allow excitatory inputs on the distal dendrites to summate and
propagate to the soma more effectively. This may be particularly relevant during awake states
when activity in the dendrites is enhanced (Murayama and Larkum, 2009). Activation of SOM
cells has also been shown to effectively prevent pyramidal neurons from producing ‘bursts’ of
action potentials that are generated in the apical dendrite through active dendritic currents
(Larkum et al., 1999, Gentet et al., 2012, Lovett-Barron et al., 2012). In addition, SOM cells are
extensively coupled to each other through gap junctions (Gibson et al., 1999, Fanselow et al.,
2008). Alterations in intrinsic properties with age could change how SOM cells act as an
electrically coupled network, such as by changing their tendency to correlate or synchronize their
activity (Amitai et al., 2002, Long et al., 2005, de la Rocha et al., 2007).
Across the SOM interneuron population there exists a degree of variability in the
morphology, physiological characteristics, and co-expression of additional neuropeptides.
Whether this reflects variability within a single class or is sufficiently diverse to warrant multiple

100
subtypes is unclear (Ma et al., 2006, Sugino et al., 2006, McGarry et al., 2010). This issue has
been partially addressed by the creation of transgenic mouse lines that express a fluorescent
molecule, such as green fluorescent protein (GFP), in particular subsets of inhibitory neurons.
Here, we used such a mouse line to study SOM inhibitory cells by utilizing a line of mice that
expresses GFP in approximately one-third of SOM cells (Oliva et al., 2000). In these mice, the
GFP-positive inhibitory neurons (“GIN”) express the neuropeptide, somatostatin, exhibit
adapting responses to intracellular current steps, and are often of Martinotti morphology, with an
axon traveling up to layer 1 and ramifying extensively (Oliva et al., 2000, Halabisky et al., 2006,
Ma et al., 2006, Fanselow et al., 2008).
Understanding the normal trajectory of GIN cell maturation serves several purposes.
First, it helps clarify the physiological role(s) these cells can play during different stages of
postnatal development by indicating how intrinsic properties of GIN cells change over age, how
readily these cells are excited and what their firing characteristics are once activated. Second, it
will help us learn how to best distinguish between types and subtypes of inhibitory neurons even
as their physiological characteristics, which are often used as factors to distinguish between cell
types (Kawaguchi, 1995, Kawaguchi and Kubota, 1996, Kawaguchi and Kondo, 2002, Markram
et al., 2004, Ascoli et al., 2008), change systematically with age. Finally, the way circuitry of
excitatory and inhibitory neurons changes at different stages of maturation may help us
determine causes and mechanisms of abnormal cortical development (Dani et al., 2005, Lewis et
al., 2005, Yizhar et al., 2011).
Here, we characterized the intrinsic physiological properties of GIN cells and regular-
spiking (RS) excitatory cells in the mouse primary somatosensory cortex during a developmental
period (P11-P32+) that encompasses changes in multiple intrinsic cellular properties in
101
somatosensory cortex (Maravall et al., 2004, Jiao et al., 2006, Goldberg et al., 2011, Jiao et al.,
2011) as well as whisking onset. We found that changes in sub- and suprathreshold properties
occurred in both cell types, collectively resulting in an increase in GIN cell excitability and a
reduction in RS cell excitability as a function of age. These results suggest that as the
neocortical circuit develops, GIN cells may increasingly participate in sensory processing within
somatosensory cortex.
A.3 MATERIALS AND METHODS
Slicing procedure
All experiments were carried out in compliance with the University of Pittsburgh School
of Medicine animal use policies and were approved by the University of Pittsburgh Institutional
Animal Care and Use Committee. Thalamocortical slices from mouse somatosensory cortex
were prepared as previously described (Agmon and Connors, 1991). In addition, a subset of cells
was recorded from coronal sections of the same brain region. No systematic differences between
these two slicing angles were observed, so the data were pooled.
Recording procedures
Whole cell current-clamp recordings were performed using micropipettes (4–7 MΩ)
filled with internal solution containing (in mM): 135 K-gluconate, 4 KCl, 2 NaCl, 10 HEPES,
0.2 EGTA, 4 ATP-Mg, 0.3 GTP-Tris, and 14 phosphocreatine-Tris (pH 7.25, 280-290 mOsm).
Membrane potentials reported here were not corrected for the liquid junction potential.

102
Recordings were conducted at 32°C. When patching, cell-attached seal resistances were 1 GΩ or
greater and series resistance after achieving whole cell configuration was 5-20 MΩ. Data were
collected using a Multiclamp 700B amplifier and pClamp10 software (Molecular Devices). Data
were analyzed using in-house programs written in Matlab (The MathWorks, Natick, MA; E.
Fanselow).
Cell visualization and identification
Cells were viewed under infrared-differential interference contrast illumination using a
Nikon FN-1 microscope and a Dage IR-1000 CCD camera. GIN cells were identified by
visualization of GFP under epifluorescence illumination. Regular-spiking (RS) pyramidal cells
did not express GFP in these mice and were therefore targeted for recording based on having a
triangular-shaped soma. During recording, RS pyramidal cells were positively distinguished
from regular-spiking inhibitory interneurons as having strongly adapting spike firing rates during
suprathreshold current steps, small amplitude AHPs, and during a train of action potentials the
first AHP was smaller than subsequent AHPs (Porter et al., 2001; Beierlein et al., 2003). All cells
were recorded in layers 2 and 3 of somatosensory cortex. Layer 2/3 cells were defined as those
between the bottom of layer 1, identified by its lack of cell bodies, and the tops of the barrels,
which demarcate layer 4.
Cells recorded
Recordings from a total of 269 GIN cells and 200 RS cells from a total of 170 mice were
analyzed for this study. Numbers of cells for each cell type and age can be found in Table 1. All
mice were of the GIN strain (Jackson Labs, Bar Harbor, ME; (Oliva et al., 2000)) and were aged

103
P11-50. Cells from those aged > P31 were combined and are identified here as P32+. In addition,
we combined P18 and P19 cells in to one group, identified as P19 in the text and on our plots.
Both male and female mice were used. The morphologies of GIN cells have been described
extensively in other publications, and these cells have been shown to express the peptide,
somatostatin (SOM; (Oliva et al., 2000; Halabisky et al., 2006; Ma et al., 2006; Fanselow et al.,
2008)).
Measures of cellular properties
Once patched, we presented each cell with a series of negative and positive current steps,
ranging from -100 pA to 300 pA in 10 or 20 pA steps. The following measures were made from
the voltage traces recorded during these current steps.
Adaptation ratio: inverse of mean of the last three interspike intervals during a 200 pA step,
divided by the inverse of the initial interspike interval in that step.
Action potential threshold: voltage at the time of the peak of the 3rd derivative of the voltage
trace for the first action potential in a given current step.
After-hyperpolarization (AHP) magnitude (mV): voltage at the most negative trough of the AHP
(within 4 ms of the action potential peak) minus the action potential threshold voltage.
AHP slope (mV/ms): positive slope of the AHP for 8 ms following the most negative trough in
the AHP.
Firing frequency, initial (Fi; Hz): inverse of the first interspike interval during a 200 pA current
step.
Firing frequency, steady state (Fss; Hz): average of the inverse of the last 3 interspike intervals
in a 200 pA current step.

104
Half-width (ms): width of the action potential halfway between the threshold voltage and the
peak voltage.
Input-output gain (F-I slope; Hz/pA): slope of the linear portion of each frequency-current (F-I)
curve calculated from responses to suprathreshold current steps. Frequency was defined
as the inverse of the interspike intervals throughout the entire current step.
Input resistance (MΩ): magnitude of voltage deflection (mV)/magnitude of current step (pA);
calculated as the slope of the V/I plot for positive and negative voltage deflections
between ±8 mV.
Membrane time constant (τm;ms): calculated from a monoexponential curve best fitting the
falling phase of the voltage deflection in response to negative current steps. Only voltage
deflections < 8 mV negative to the resting membrane potential were used.
Rebound depolarization (mV): The height of the voltage peak within 200 ms of the end of a
current step. Current steps with voltage deflections from -70 to -15 mV were used.
Resting membrane potential (Vrest; mV): average voltage in the 20 ms prior to a current step.
Rheobase current (pA): We plotted the number of action potentials as a function of input current
and extrapolated to find the current required to elicit a single action potential
Sag magnitude (mV): calculated from negative-going current steps as the difference between the
peak negative voltage deflection and the average voltage for the last 50 ms of the 600 ms
current step. Only traces in which the maximum voltage deflection was >15 mV more
negative than the resting membrane potential were analyzed.
Threshold voltage (mV): calculated as the voltage at the time of the maximum of the 3rd
derivative of the action potential voltage trace.

105
Statistical analyses
For quantification of RS and GIN cell properties, measurements were made from
negative or positive current steps as described above. When results were plotted as a function of
age, the resulting data were fit with linear, exponential, 2nd degree polynomial or sigmoidal
functions, as appropriate, using SigmaPlot (San Jose, CA). P11 and P32+ values were compared
for each type of measurement using a 2-tailed t-test and results are presented in Table 2.
A.4 RESULTS
In this study, we quantified intrinsic physiological properties of GIN and regular-spiking (RS)
pyramidal cells in layer 2/3 of somatosensory cortex ranging in age from P11 to P32+. We
recorded from local pyramidal neurons (RS cells) in order to directly compare how GIN and RS
cells develop relative to one another within the same network. The development of intrinsic
properties of pyramidal cells has been reported previously in multiple brain regions (McCormick
and Prince, 1987; Maravall et al., 2004; Frick et al., 2007; Oswald and Reyes, 2008), and the
results we present here for RS cells are largely in agreement with these previous studies. In
contrast, the changes in GIN properties we observed have not been reported for the
somatosensory cortex and differed somewhat from those described for visual cortex (Lazarus and
Huang, 2011).
Subthreshold intrinsic properties
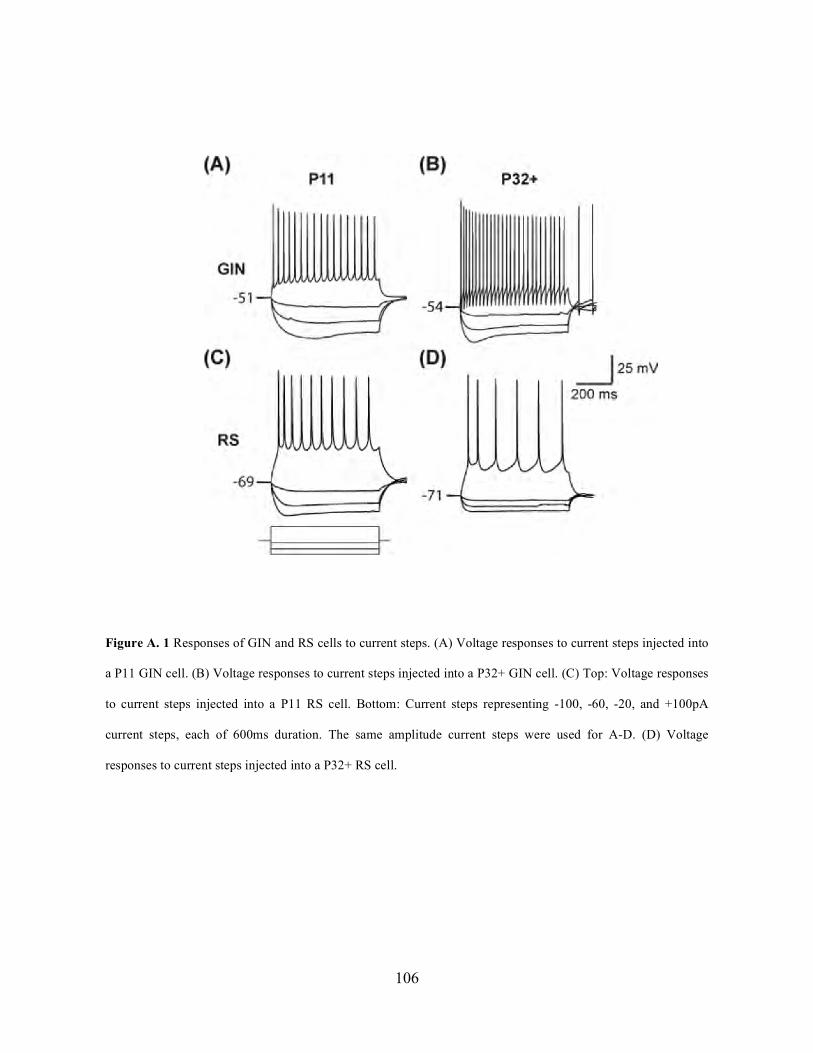
106
Figure A. 1 Responses of GIN and RS cells to current steps. (A) Voltage responses to current steps injected into
a P11 GIN cell. (B) Voltage responses to current steps injected into a P32+ GIN cell. (C) Top: Voltage responses
to current steps injected into a P11 RS cell. Bottom: Current steps representing -100, -60, -20, and +100pA
current steps, each of 600ms duration. The same amplitude current steps were used for A-D. (D) Voltage
responses to current steps injected into a P32+ RS cell.
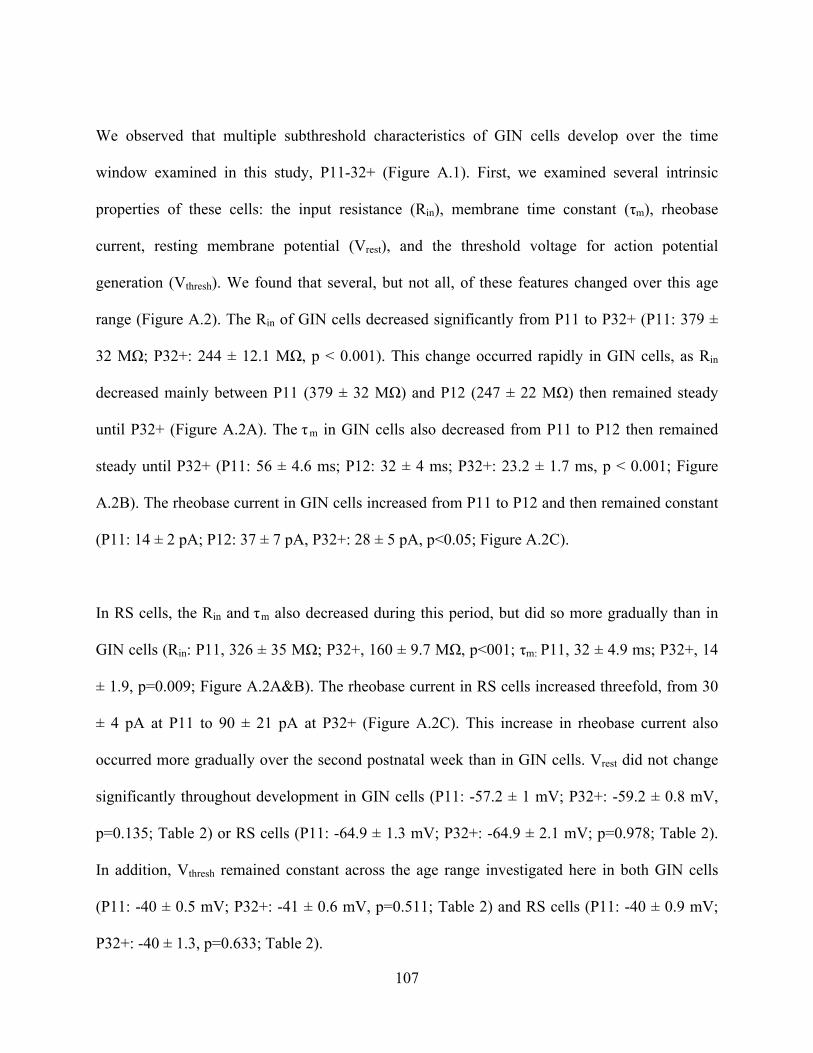
107
We observed that multiple subthreshold characteristics of GIN cells develop over the time
window examined in this study, P11-32+ (Figure A.1). First, we examined several intrinsic
properties of these cells: the input resistance (Rin), membrane time constant (τm), rheobase
current, resting membrane potential (Vrest), and the threshold voltage for action potential
generation (Vthresh). We found that several, but not all, of these features changed over this age
range (Figure A.2). The Rin of GIN cells decreased significantly from P11 to P32+ (P11: 379 ±
32 MΩ; P32+: 244 ± 12.1 MΩ, p < 0.001). This change occurred rapidly in GIN cells, as Rin
decreased mainly between P11 (379 ± 32 MΩ) and P12 (247 ± 22 MΩ) then remained steady
until P32+ (Figure A.2A). The τm in GIN cells also decreased from P11 to P12 then remained
steady until P32+ (P11: 56 ± 4.6 ms; P12: 32 ± 4 ms; P32+: 23.2 ± 1.7 ms, p < 0.001; Figure
A.2B). The rheobase current in GIN cells increased from P11 to P12 and then remained constant
(P11: 14 ± 2 pA; P12: 37 ± 7 pA, P32+: 28 ± 5 pA, p<0.05; Figure A.2C).
In RS cells, the Rin and τm also decreased during this period, but did so more gradually than in
GIN cells (Rin: P11, 326 ± 35 MΩ; P32+, 160 ± 9.7 MΩ, p<001; τm: P11, 32 ± 4.9 ms; P32+, 14
± 1.9, p=0.009; Figure A.2A&B). The rheobase current in RS cells increased threefold, from 30
± 4 pA at P11 to 90 ± 21 pA at P32+ (Figure A.2C). This increase in rheobase current also
occurred more gradually over the second postnatal week than in GIN cells. Vrest did not change
significantly throughout development in GIN cells (P11: -57.2 ± 1 mV; P32+: -59.2 ± 0.8 mV,
p=0.135; Table 2) or RS cells (P11: -64.9 ± 1.3 mV; P32+: -64.9 ± 2.1 mV; p=0.978; Table 2).
In addition, Vthresh remained constant across the age range investigated here in both GIN cells
(P11: -40 ± 0.5 mV; P32+: -41 ± 0.6 mV, p=0.511; Table 2) and RS cells (P11: -40 ± 0.9 mV;
P32+: -40 ± 1.3, p=0.633; Table 2).
108
Table 2. Summary of cell counts
Postnatal Age (days) Cell Type P11 P12 P13 P14 P15 P16 P17 P18-19 P32+ Totals
GIN 16 14 41 66 48 46 10 6 22 269
RS 11 4 42 37 39 20 22 12 13 200
Collectively, these results suggest that during the age range investigated, the intrinsic excitability
of both GIN and RS cells decreased. But it should be noted that within the same age range, GIN
cells remained more excitable than RS cells, exhibiting higher input resistance, higher τm, lower
rheobase current, and more depolarized Vrest than RS cells across this developmental period.
Another characteristic feature of GIN cells is the presence of a pronounced ‘sag current’ in
response to hyperpolarizing current steps (Oliva et al., 2000; Halabisky et al., 2006; Ma et al.,
2006) Figure A.1B & A.3A). In GIN cells, sag currents are mediated by Ih currents (Ma et al.,
2006). We observed a strong increase in the magnitude of the sag current with age (P11: 3 ± 0.6
mV; P32+: 5.6 ± 0.5 mV, p<0.01; Figure A.3A&B). A related feature observed in GIN cells is the
presence of a rebound depolarization when the cell is released from hyperpolarization, which in
some cases results in the generation of a rebound spike (Figure A.1B & A.3A). This
depolarization is also mediated by Ih currents in GIN cells (Ma et al., 2006). We observed that the
amplitude of rebound depolarization also increased with age (P11: 2 ± 0.8 mV; P32+: 4.4 ± 0.4,
p<0.05; Figure A.3C), and showed a similar developmental time course as the change in sag
current magnitude. RS cells also showed a small Ih-mediated sag current (Maravall et al., 2004),
but the magnitude of the sag current and rebound depolarization decreased with age in RS cells
(Figure A.3A-C), consistent with previous results (Maravall et al., 2004). Together, these findings
suggest that Ih currents increased in GIN cells and decreased in RS cells from ages P11 to P32+.
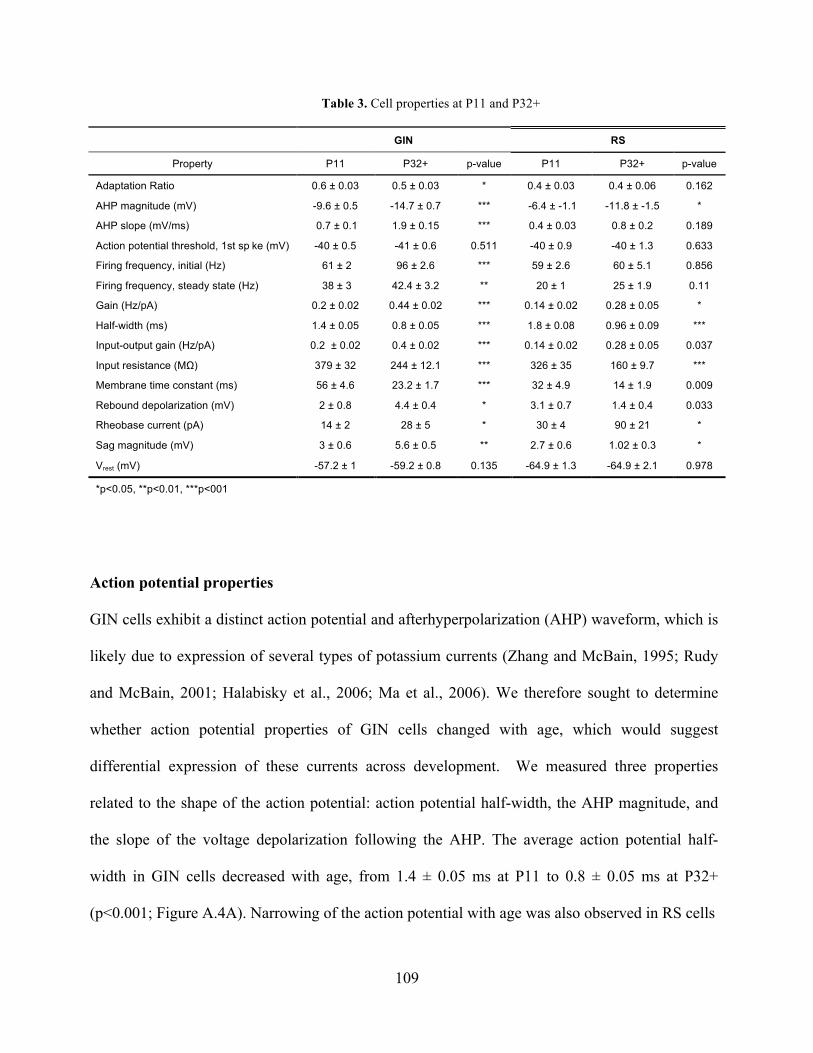
109
Table 3. Cell properties at P11 and P32+
GIN RS
Property P11 P32+ p-value P11 P32+ p-value
Adaptation Ratio 0.6 ± 0.03 0.5 ± 0.03 * 0.4 ± 0.03 0.4 ± 0.06 0.162
AHP magnitude (mV) -9.6 ± 0.5 -14.7 ± 0.7 *** -6.4 ± -1.1 -11.8 ± -1.5 *
AHP slope (mV/ms) 0.7 ± 0.1 1.9 ± 0.15 *** 0.4 ± 0.03 0.8 ± 0.2 0.189
Action potential threshold, 1st sp ke (mV) -40 ± 0.5 -41 ± 0.6 0.511 -40 ± 0.9 -40 ± 1.3 0.633
Firing frequency, initial (Hz) 61 ± 2 96 ± 2.6 *** 59 ± 2.6 60 ± 5.1 0.856
Firing frequency, steady state (Hz) 38 ± 3 42.4 ± 3.2 ** 20 ± 1 25 ± 1.9 0.11
Gain (Hz/pA) 0.2 ± 0.02 0.44 ± 0.02 *** 0.14 ± 0.02 0.28 ± 0.05 *
Half-width (ms) 1.4 ± 0.05 0.8 ± 0.05 *** 1.8 ± 0.08 0.96 ± 0.09 ***
Input-output gain (Hz/pA) 0.2 ± 0.02 0.4 ± 0.02 *** 0.14 ± 0.02 0.28 ± 0.05 0.037
Input resistance (MΩ) 379 ± 32 244 ± 12.1 *** 326 ± 35 160 ± 9.7 ***
Membrane time constant (ms) 56 ± 4.6 23.2 ± 1.7 *** 32 ± 4.9 14 ± 1.9 0.009
Rebound depolarization (mV) 2 ± 0.8 4.4 ± 0.4 * 3.1 ± 0.7 1.4 ± 0.4 0.033
Rheobase current (pA) 14 ± 2 28 ± 5 * 30 ± 4 90 ± 21 *
Sag magnitude (mV) 3 ± 0.6 5.6 ± 0.5 ** 2.7 ± 0.6 1.02 ± 0.3 *
Vrest (mV) -57.2 ± 1 -59.2 ± 0.8 0.135 -64.9 ± 1.3 -64.9 ± 2.1 0.978
*p<0.05, **p<0.01, ***p<001
Action potential properties
GIN cells exhibit a distinct action potential and afterhyperpolarization (AHP) waveform, which is
likely due to expression of several types of potassium currents (Zhang and McBain, 1995; Rudy
and McBain, 2001; Halabisky et al., 2006; Ma et al., 2006). We therefore sought to determine
whether action potential properties of GIN cells changed with age, which would suggest
differential expression of these currents across development. We measured three properties
related to the shape of the action potential: action potential half-width, the AHP magnitude, and
the slope of the voltage depolarization following the AHP. The average action potential half-
width in GIN cells decreased with age, from 1.4 ± 0.05 ms at P11 to 0.8 ± 0.05 ms at P32+
(p<0.001; Figure A.4A). Narrowing of the action potential with age was also observed in RS cells

110
Figure A. 2 Intrinsic properties of GIN cells and RS cells change over development. (A) Average input
resistance of GIN cells (black) and RS cells (gray) decreases as a function of age. (B) The average membrane time
constant also decreases with age in both the GIN cells (black) and the RS cells (gray). (C) The rheobase current
increases from P11 to P12 in the GIN cells, then remains constant into maturity (black). The rheobase current in the
RS cells increases significantly with age (gray). Data for each cell type was fit with an exponential function (A&B)
or a sigmoidal function (C).

111
(P11: 1.8 ± 0.08 ms; P32+: 0.96 ± 0.09, p<0.001; Figure A.4A), but at all ages recorded the half-
width of GIN cells was shorter than for RS cells of the same age.
GIN cells can display a complex ‘triphasic’ AHP shape following an action potential that
consists of both a rapid 'early' component, followed by a slower 'late' component (Halabisky et
al., 2006; Ma et al., 2006). We found that both of these features were almost completely absent
at P11 in the GIN cells but developed throughout the second and third postnatal weeks (Figure
A.1A&B; Figure A.3B). Specifically, the trough of the AHP became increasingly negative with
age (P11: -9.6 ± 0.5 mV; P32+: -14.7 ± 0.7 mV, p<0.001; Figure A.4B&C). We then quantified
the repolarization of the voltage following the AHP and found that the slope increased almost
threefold from P11 (0.7 ± 0.1 mV/ms) to P32+ (1.9 ± 0.15, p<0.001; Figure A.4B&C).
Therefore, in GIN cells, although the AHP became increasingly negative with age, the voltage
repolarized more quickly so that by ~8ms following the AHP the voltage was more depolarized
in mature animals than younger animals (Figure A.4B). In contrast, RS cells had a smaller AHP
magnitude across all ages than GIN cells (Figure A.4C). We did observe a significant increase in
the AHP magnitude with age in RS cells (P11: -6.4 ± -1.1; P32+ -11.8 ± -1.5, p<0.05), but no
significant change in AHP slope for RS cells (P11: 0.4 ± 0.03 mV/ms; P32+: 0.8 ± 0.2; p=0.189).
Firing properties
Finally, we examined how the propensity of GIN cells to fire in response to a current step
changed as a function of age. We started by quantifying the firing of the GIN cells throughout
the duration of suprathreshold current steps across each age (Figure A.5A). GIN cells across all
ages exhibited adaptation throughout the current steps, such that the initial firing rate was higher
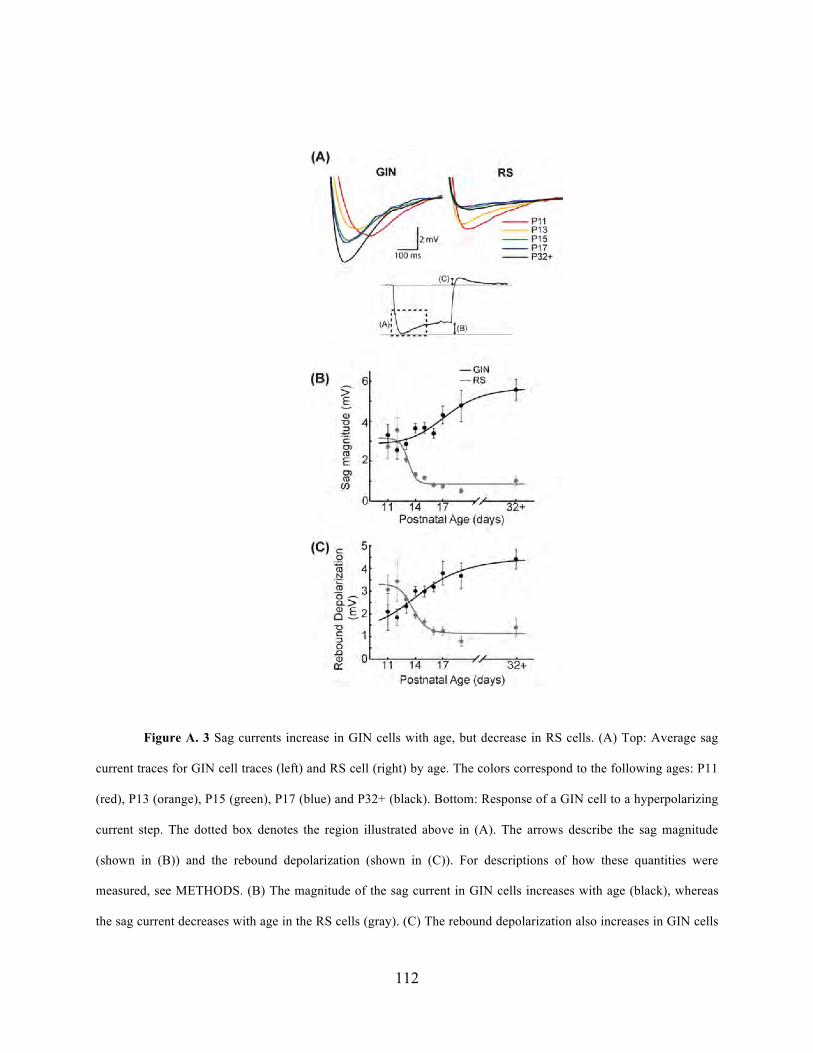
112
Figure A. 3 Sag currents increase in GIN cells with age, but decrease in RS cells. (A) Top: Average sag
current traces for GIN cell traces (left) and RS cell (right) by age. The colors correspond to the following ages: P11
(red), P13 (orange), P15 (green), P17 (blue) and P32+ (black). Bottom: Response of a GIN cell to a hyperpolarizing
current step. The dotted box denotes the region illustrated above in (A). The arrows describe the sag magnitude
(shown in (B)) and the rebound depolarization (shown in (C)). For descriptions of how these quantities were
measured, see METHODS. (B) The magnitude of the sag current in GIN cells increases with age (black), whereas
the sag current decreases with age in the RS cells (gray). (C) The rebound depolarization also increases in GIN cells

113
(black) and decreases in RS cells, following a similar time course as the sag current (gray). Data for each cell type
was fit with a sigmoidal function (B&C).
than the steady state firing rate (Figure A.5A&C). Both the initial (P11: 61 ± 2 Hz; P32+: 96 ±
2.6 Hz, p<0.001) and the steady state firing rate (P11: 38 ± 3 Hz; P32+: 42.4 ± 3.2 Hz, p<0.01)
increased significantly with age. The ratio of the two values, the adaptation ratio, decreased
across development (P11: 0.6 ± 0.03; P32+: 0.5 ± 0.03, p<0.05; Figure A.3C). This is likely due
to the fact that the initial firing rate increased more with age than the steady state firing rate,
causing GIN cells to exhibit more adaptation in older animals. In comparison, we observed no
significant change in the initial firing rate, steady state firing rate, or adaptation ratio across ages
in RS cells (Table 2; Figure A.5B&C).
In order to fully understand how the firing dynamics of GIN cells and RS cells changed during
development, we examined the input-output relationship of both cell types from P11 to P32+.
When we compared the input-output relationship across age, GIN cells showed a 'multiplicative'
increase in firing rate from P11 to P32+ (Figure A.5D). This was primarily because whereas the
firing rates increased with age, the rheobase current stayed constant from P12 through P32+
(Figure A.2C; Figure A.5D). To quantify this change, we calculated the slope of the linear
portion of the input-output relationship, or the "gain" of the cell. The gain of the GIN cells
increased significantly across development (P11: 0.2 ± 0.02 Hz/pA; P32+: 0.44 ± 0.02 Hz/pA, p
< 0.001; Figure A.5F). RS cells also showed a significant increase in gain from P11 (0.14 ± 0.02
Hz/pA) to P32+ (0.28 ± 0.05 Hz/pA, p < 0.05; Figure A.5F). However, the dominant change in
the input-output curve of RS cells was a rightward shift with age (Figure A.5E). This was due to
the increase
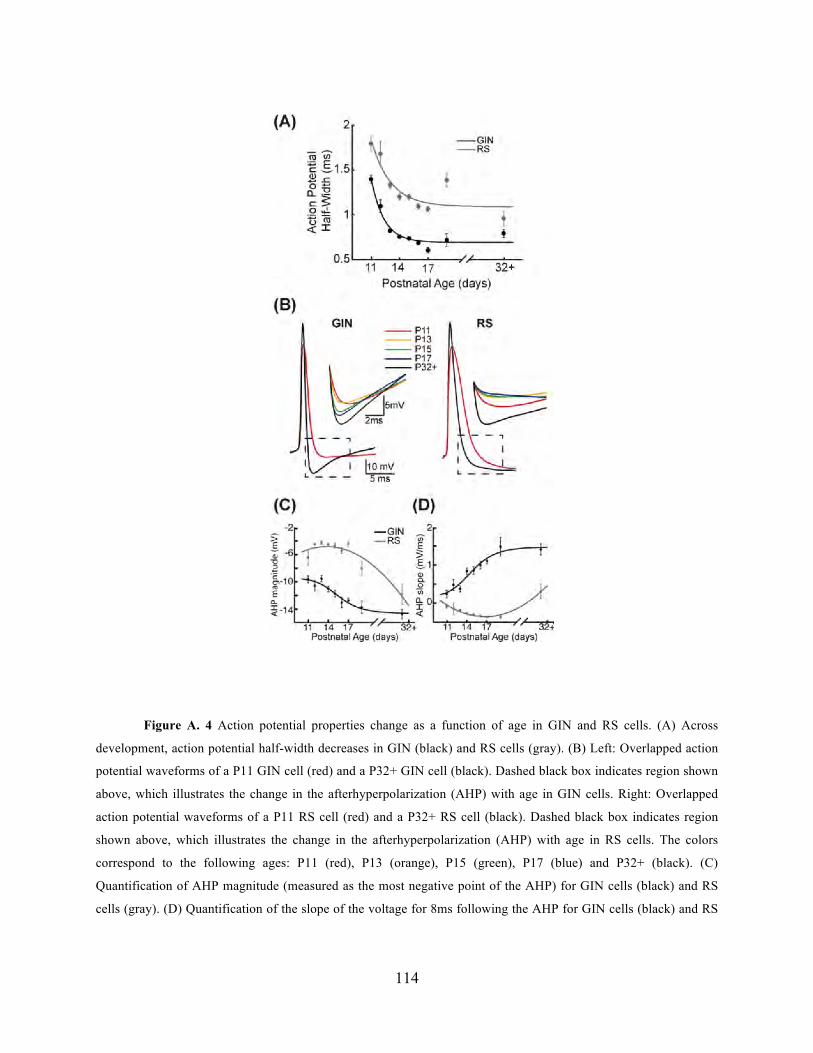
114
Figure A. 4 Action potential properties change as a function of age in GIN and RS cells. (A) Across
development, action potential half-width decreases in GIN (black) and RS cells (gray). (B) Left: Overlapped action
potential waveforms of a P11 GIN cell (red) and a P32+ GIN cell (black). Dashed black box indicates region shown
above, which illustrates the change in the afterhyperpolarization (AHP) with age in GIN cells. Right: Overlapped
action potential waveforms of a P11 RS cell (red) and a P32+ RS cell (black). Dashed black box indicates region
shown above, which illustrates the change in the afterhyperpolarization (AHP) with age in RS cells. The colors
correspond to the following ages: P11 (red), P13 (orange), P15 (green), P17 (blue) and P32+ (black). (C)
Quantification of AHP magnitude (measured as the most negative point of the AHP) for GIN cells (black) and RS
cells (gray). (D) Quantification of the slope of the voltage for 8ms following the AHP for GIN cells (black) and RS
115
cells (gray). Data for each cell type was fit with a sigmoidal function (C&D; black) or a 2nd degree polynomial
(C&D; gray).
in rheobase current with age in RS cells (Figure A.2C), resulting in more current being required
to drive RS cells to fire at a given rate as the neurons matured.
Discussion
In this study, we sought to determine whether physiological features of GIN inhibitory cells
changed as a function of age. Our data demonstrated that multiple intrinsic physiological
characteristics of L2/3 GIN cells and RS cells in somatosensory cortex changed across the
developmental time period investigated here (P11-P32+). GIN and RS cells showed decreased
intrinsic excitability over the second and third weeks of postnatal development, based on features
such as input resistance, membrane time constant and rheobase current. However, despite these
changes, the net change in GIN cell output during this time was an increase in firing rate as a
function of age. This was due to an increase in initial and steady state firing rates with age, which
resulted in a multiplicative increase in the input-output relationship. In contrast, RS cells did not
show substantial changes in firing rate with age. Together, these results suggest that, for the same
level of input current, GIN cells became more active as the animal matured through the age
range investigated, whereas RS cells became less readily activated.
The results we reported here for GIN cells are consistent with developmental changes to intrinsic
properties reported for pyramidal neurons in the current study and elsewhere (Maravall et al.,
2004) and for other types of inhibitory interneurons (Goldberg et al., 2011) in the upper layers of
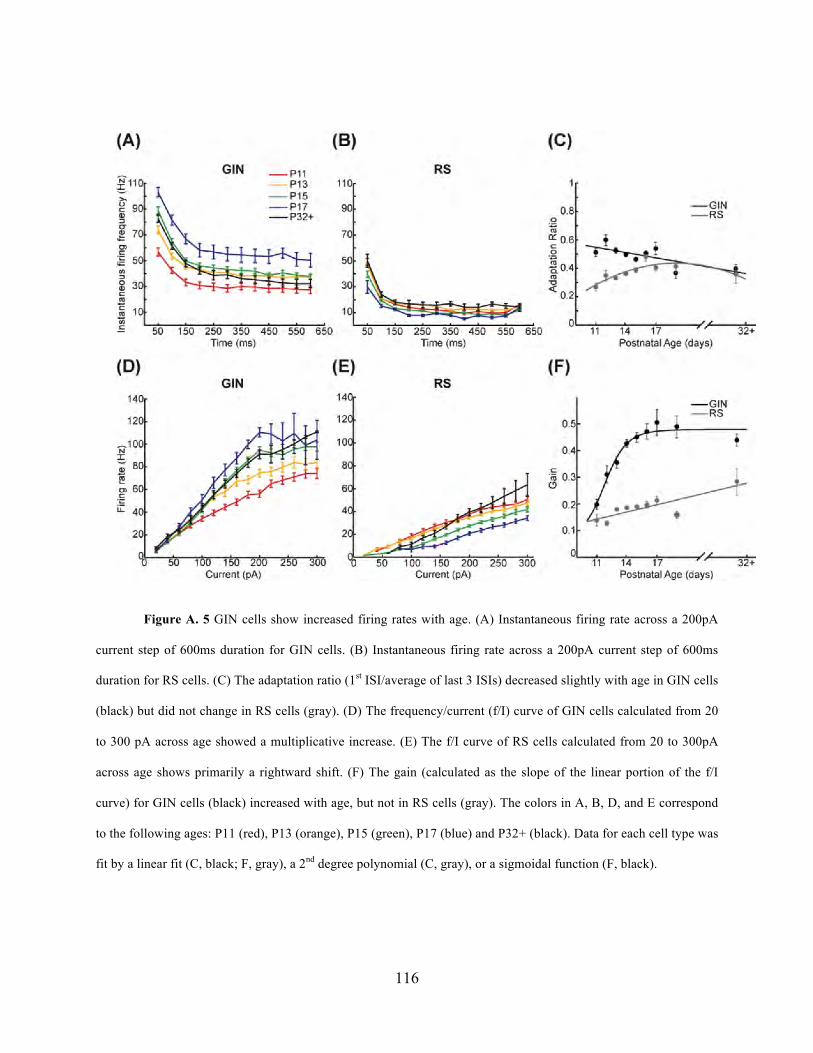
116
Figure A. 5 GIN cells show increased firing rates with age. (A) Instantaneous firing rate across a 200pA
current step of 600ms duration for GIN cells. (B) Instantaneous firing rate across a 200pA current step of 600ms
duration for RS cells. (C) The adaptation ratio (1st ISI/average of last 3 ISIs) decreased slightly with age in GIN cells
(black) but did not change in RS cells (gray). (D) The frequency/current (f/I) curve of GIN cells calculated from 20
to 300 pA across age showed a multiplicative increase. (E) The f/I curve of RS cells calculated from 20 to 300pA
across age shows primarily a rightward shift. (F) The gain (calculated as the slope of the linear portion of the f/I
curve) for GIN cells (black) increased with age, but not in RS cells (gray). The colors in A, B, D, and E correspond
to the following ages: P11 (red), P13 (orange), P15 (green), P17 (blue) and P32+ (black). Data for each cell type was
fit by a linear fit (C, black; F, gray), a 2nd degree polynomial (C, gray), or a sigmoidal function (F, black).

117
the somatosensory cortex. Therefore, this may be a general developmental trend across many cell
types within this neocortical region. It should be noted that a recent study investigated
maturation of SOM and PV cells in the visual cortex during the first few weeks of postnatal
development (Lazarus and Huang, 2011). Interestingly, they observed different trends than we
reported here, as SOM cells in the visual cortex displayed increases in input resistance and
membrane time constant with age. These different developmental trajectories seen by Lazarus
and Huang (2011) could reflect differences between cortical areas. Additionally, these authors
investigated SOM and PV cells from ages P15-P30, and grouped the data into bins of multiple
days, including P15 to P17. Because the decreases we observed in SOM cell input resistance and
membrane time constant occurred at earlier ages (greatest changes prior to day 14), it is difficult
to compare across these studies.
Intrinsic cellular properties during postnatal development
Previous studies have examined the properties of pyramidal neurons during the age range studied
here and have observed a similar decrease in intrinsic excitability of these cells with age
(McCormick and Prince, 1987; Maravall et al., 2004; Oswald and Reyes, 2008). Interestingly,
although we observed changes to these properties in GIN and RS cells as a function of age, GIN
cells consistently exhibited higher Rin, higher τm, and lower rheobase current than RS cells of the
same age. This illustrates that the relative intrinsic excitability between GIN and RS cells is
preserved at all ages. This may be important for maintaining the proper ratio of excitation to
inhibition throughout development (Zhang et al., 2011).
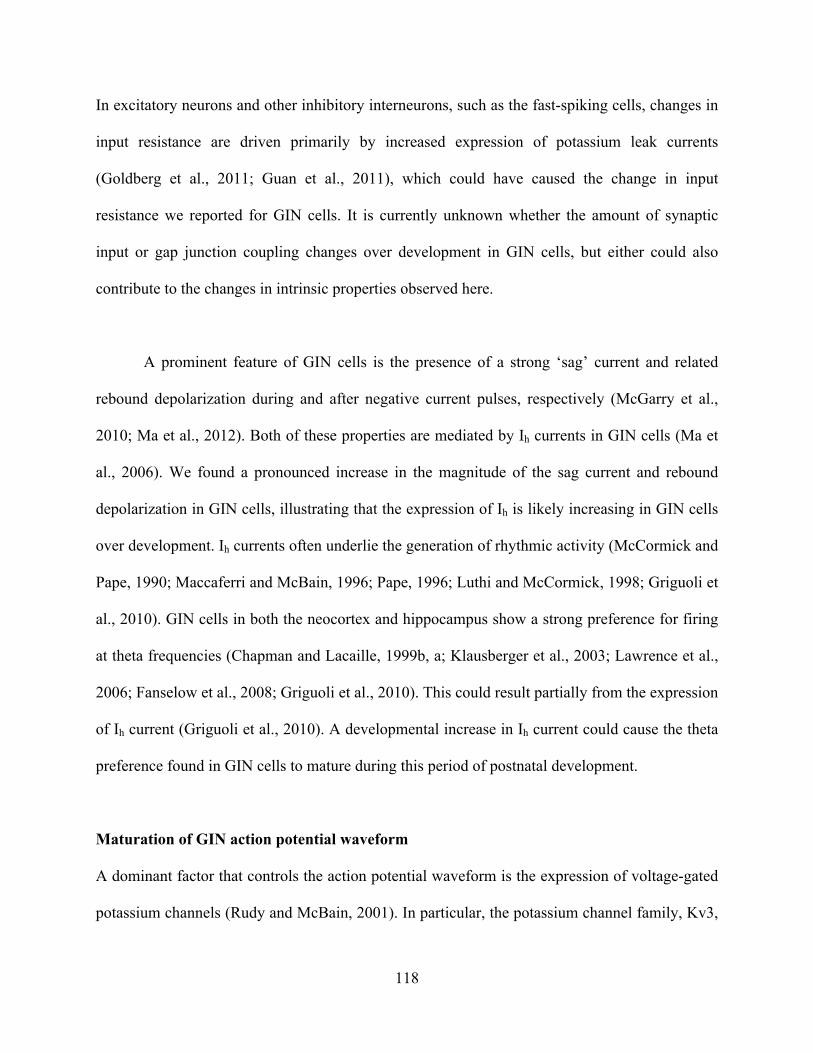
118
In excitatory neurons and other inhibitory interneurons, such as the fast-spiking cells, changes in
input resistance are driven primarily by increased expression of potassium leak currents
(Goldberg et al., 2011; Guan et al., 2011), which could have caused the change in input
resistance we reported for GIN cells. It is currently unknown whether the amount of synaptic
input or gap junction coupling changes over development in GIN cells, but either could also
contribute to the changes in intrinsic properties observed here.
A prominent feature of GIN cells is the presence of a strong ‘sag’ current and related
rebound depolarization during and after negative current pulses, respectively (McGarry et al.,
2010; Ma et al., 2012). Both of these properties are mediated by Ih currents in GIN cells (Ma et
al., 2006). We found a pronounced increase in the magnitude of the sag current and rebound
depolarization in GIN cells, illustrating that the expression of Ih is likely increasing in GIN cells
over development. Ih currents often underlie the generation of rhythmic activity (McCormick and
Pape, 1990; Maccaferri and McBain, 1996; Pape, 1996; Luthi and McCormick, 1998; Griguoli et
al., 2010). GIN cells in both the neocortex and hippocampus show a strong preference for firing
at theta frequencies (Chapman and Lacaille, 1999b, a; Klausberger et al., 2003; Lawrence et al.,
2006; Fanselow et al., 2008; Griguoli et al., 2010). This could result partially from the expression
of Ih current (Griguoli et al., 2010). A developmental increase in Ih current could cause the theta
preference found in GIN cells to mature during this period of postnatal development.
Maturation of GIN action potential waveform
A dominant factor that controls the action potential waveform is the expression of voltage-gated
potassium channels (Rudy and McBain, 2001). In particular, the potassium channel family, Kv3,

119
has been shown to underlie the narrow action potential waveform in fast-spiking (FS) inhibitory
interneurons (Rudy and McBain, 2001; Lien and Jonas, 2003; Goldberg et al., 2011). The action
potential half-width observed in FS cells decreases during the second and third weeks of
postnatal development, and this property is paralleled by increased expression of Kv3 over
development (Goldberg et al., 2011). It is possible that developmental increases in potassium
currents could also underlie the decreased action potential half-widths observed in GIN cells in
the current study. Although Kv3 channels are observed in deep layer SOM inhibitory
interneurons, they are not present in superficial SOM cells (Chow et al., 1999), which were
recorded here. The specific types of potassium channels expressed in superficial SOM cells are
not known, so it is difficult to know which potassium currents could underlie the developmental
changes in action potential waveform we observed in our study.
We demonstrated that the voltage trajectory following the AHP trough depolarized more rapidly
in older GIN cells than in younger ones. The ability of mature GIN cells to repolarize more
rapidly following an action potential may underlie the increased firing rates observed at older
ages. Ih currents can act on the shape and duration of the AHP and increase the slope of the
membrane potential during the interspike interval (McCormick and Pape, 1990; Maccaferri and
McBain, 1996; Pape, 1996; Griguoli et al., 2010). The changes observed here in the AHP shape
and slope therefore further support the idea that Ih currents increase in GIN cells over the second
and third postnatal weeks.
GIN cells display multiplicative increases in the input-output relationship with age
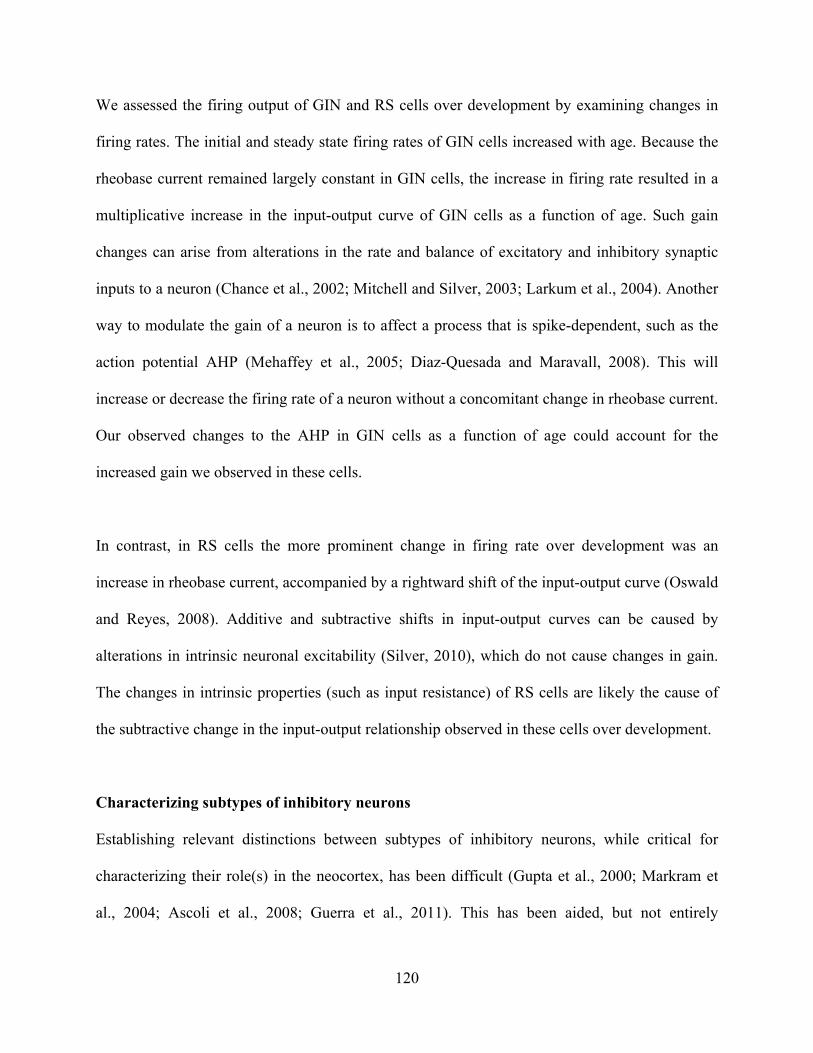
120
We assessed the firing output of GIN and RS cells over development by examining changes in
firing rates. The initial and steady state firing rates of GIN cells increased with age. Because the
rheobase current remained largely constant in GIN cells, the increase in firing rate resulted in a
multiplicative increase in the input-output curve of GIN cells as a function of age. Such gain
changes can arise from alterations in the rate and balance of excitatory and inhibitory synaptic
inputs to a neuron (Chance et al., 2002; Mitchell and Silver, 2003; Larkum et al., 2004). Another
way to modulate the gain of a neuron is to affect a process that is spike-dependent, such as the
action potential AHP (Mehaffey et al., 2005; Diaz-Quesada and Maravall, 2008). This will
increase or decrease the firing rate of a neuron without a concomitant change in rheobase current.
Our observed changes to the AHP in GIN cells as a function of age could account for the
increased gain we observed in these cells.
In contrast, in RS cells the more prominent change in firing rate over development was an
increase in rheobase current, accompanied by a rightward shift of the input-output curve (Oswald
and Reyes, 2008). Additive and subtractive shifts in input-output curves can be caused by
alterations in intrinsic neuronal excitability (Silver, 2010), which do not cause changes in gain.
The changes in intrinsic properties (such as input resistance) of RS cells are likely the cause of
the subtractive change in the input-output relationship observed in these cells over development.
Characterizing subtypes of inhibitory neurons
Establishing relevant distinctions between subtypes of inhibitory neurons, while critical for
characterizing their role(s) in the neocortex, has been difficult (Gupta et al., 2000; Markram et
al., 2004; Ascoli et al., 2008; Guerra et al., 2011). This has been aided, but not entirely

121
ameliorated, by the use of lines of mice that express fluorescent proteins in inhibitory neurons of
interest. It is not clear whether GIN cells form a homogeneous population. These cells have been
subdivided in to three (McGarry et al., 2010) and four (Halabisky et al., 2006) groups based on
physiological and morphological characteristics. In our study, we showed that physiological
factors frequently used to characterize inhibitory neurons vary with age. Therefore, in order to
use these factors to accurately categorize GIN neurons it is necessary to take age into account.
Here, we focused on changes in the physiological features of GIN cells, but other features, such
as morphological characteristics, can also be considered when subdividing GIN cells (McGarry
et al., 2010). It would be interesting to know whether the morphological features of GIN cells
also develop over this time window, and whether they change in concert with the physiological
changes we have described. In fact, developmental morphological changes could constitute
possible mechanisms for some of the physiological changes we observed. For example, changes
in overall dendritic length with age could account for the decreased input resistance in GIN cells
we report in this study.
Impact of GIN cell maturation on cortical circuitry
This study represents the first in-depth analysis showing how the physiology of GIN cells in
layers 2/3 of somatosensory cortex changes during the second and third postnatal weeks. This
encompasses a period of massive reorganization of the neocortex correlated with the onset of
sensory input and plasticity. Our results suggest that GIN cells become more active in the
cortical network around P14, which corresponds to the approximate time of whisking onset in
mice and rats (Mosconi et al., 2010). Although a precise function for GIN cells, and more
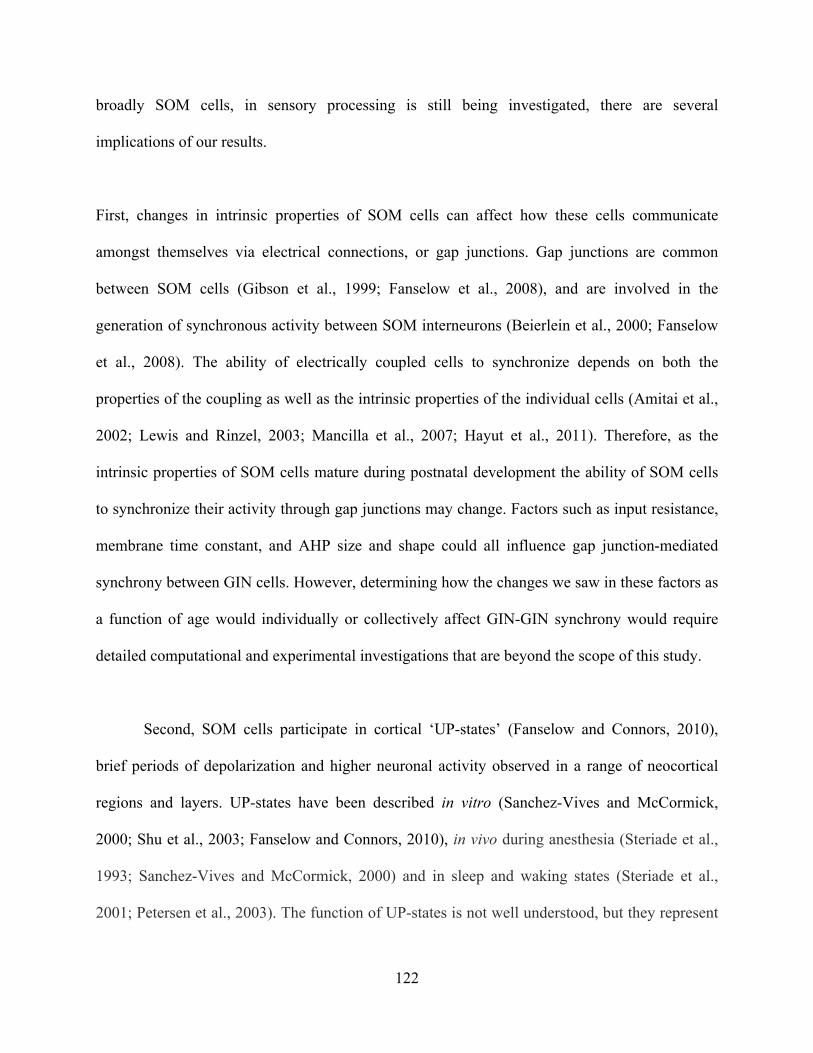
122
broadly SOM cells, in sensory processing is still being investigated, there are several
implications of our results.
First, changes in intrinsic properties of SOM cells can affect how these cells communicate
amongst themselves via electrical connections, or gap junctions. Gap junctions are common
between SOM cells (Gibson et al., 1999; Fanselow et al., 2008), and are involved in the
generation of synchronous activity between SOM interneurons (Beierlein et al., 2000; Fanselow
et al., 2008). The ability of electrically coupled cells to synchronize depends on both the
properties of the coupling as well as the intrinsic properties of the individual cells (Amitai et al.,
2002; Lewis and Rinzel, 2003; Mancilla et al., 2007; Hayut et al., 2011). Therefore, as the
intrinsic properties of SOM cells mature during postnatal development the ability of SOM cells
to synchronize their activity through gap junctions may change. Factors such as input resistance,
membrane time constant, and AHP size and shape could all influence gap junction-mediated
synchrony between GIN cells. However, determining how the changes we saw in these factors as
a function of age would individually or collectively affect GIN-GIN synchrony would require
detailed computational and experimental investigations that are beyond the scope of this study.
Second, SOM cells participate in cortical ‘UP-states’ (Fanselow and Connors, 2010),
brief periods of depolarization and higher neuronal activity observed in a range of neocortical
regions and layers. UP-states have been described in vitro (Sanchez-Vives and McCormick,
2000; Shu et al., 2003; Fanselow and Connors, 2010), in vivo during anesthesia (Steriade et al.,
1993; Sanchez-Vives and McCormick, 2000) and in sleep and waking states (Steriade et al.,
2001; Petersen et al., 2003). The function of UP-states is not well understood, but they represent
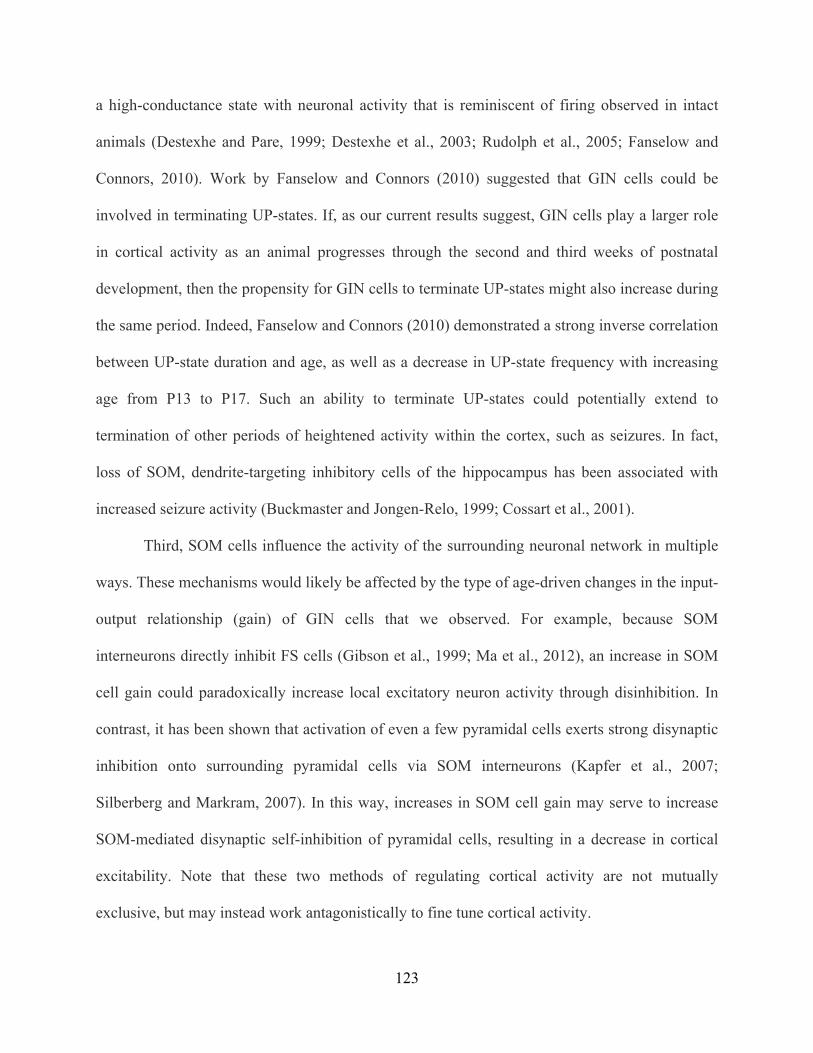
123
a high-conductance state with neuronal activity that is reminiscent of firing observed in intact
animals (Destexhe and Pare, 1999; Destexhe et al., 2003; Rudolph et al., 2005; Fanselow and
Connors, 2010). Work by Fanselow and Connors (2010) suggested that GIN cells could be
involved in terminating UP-states. If, as our current results suggest, GIN cells play a larger role
in cortical activity as an animal progresses through the second and third weeks of postnatal
development, then the propensity for GIN cells to terminate UP-states might also increase during
the same period. Indeed, Fanselow and Connors (2010) demonstrated a strong inverse correlation
between UP-state duration and age, as well as a decrease in UP-state frequency with increasing
age from P13 to P17. Such an ability to terminate UP-states could potentially extend to
termination of other periods of heightened activity within the cortex, such as seizures. In fact,
loss of SOM, dendrite-targeting inhibitory cells of the hippocampus has been associated with
increased seizure activity (Buckmaster and Jongen-Relo, 1999; Cossart et al., 2001).
Third, SOM cells influence the activity of the surrounding neuronal network in multiple
ways. These mechanisms would likely be affected by the type of age-driven changes in the input-
output relationship (gain) of GIN cells that we observed. For example, because SOM
interneurons directly inhibit FS cells (Gibson et al., 1999; Ma et al., 2012), an increase in SOM
cell gain could paradoxically increase local excitatory neuron activity through disinhibition. In
contrast, it has been shown that activation of even a few pyramidal cells exerts strong disynaptic
inhibition onto surrounding pyramidal cells via SOM interneurons (Kapfer et al., 2007;
Silberberg and Markram, 2007). In this way, increases in SOM cell gain may serve to increase
SOM-mediated disynaptic self-inhibition of pyramidal cells, resulting in a decrease in cortical
excitability. Note that these two methods of regulating cortical activity are not mutually
exclusive, but may instead work antagonistically to fine tune cortical activity.

124
It will be useful in future studies to determine how developmental changes to synaptic
connections complement development of the intrinsic properties we have described here, and, in
turn, affect the influence SOM cells have on neighboring neurons. Excitatory inputs onto SOM
cells are initially weak, but display strong short-term facilitation (Gibson et al. 1999, Fanselow et
al, 2008), which suggests these cells are engaged during periods of heightened neuronal activity
(Kapfer et al., 2007; Silberberg and Markram, 2007; Fanselow et al., 2008; Hayut et al., 2011).
Interestingly, inhibitory output from SOM cells initially exhibits weak depression followed by
weak facilitation (Ma et al., 2012). Together, these short-term dynamics suggest that SOM cells
would be able to increase and then sustain their inhibitory influence on downstream targets
during sensory processing. This is in contrast to FS cells, which receive initially strong but
rapidly depressing synapses from upstream neurons and make depressing connections onto target
neurons (Beierlein et al., 2003; Ma et al., 2012). This suggests that FS cells, while exerting
strong inhibitory output at first, would decrease their influence on surrounding cells as ongoing
neuronal activity progressed. These opposing short-term dynamics suggest SOM and FS cells
may be specialized for distinct modes of inhibitory processing: FS cells are optimized for fast,
transient inhibition, whereas SOM cells can provide somewhat delayed, but sustained, inhibition
(Tan et al., 2008). The extent to which each of these functions is fulfilled at a given point during
development remains to be determined. Developmental changes in the short-term dynamics of
synapses onto and from SOM cells would dictate the degree to which these cells could be
activated by high-frequency inputs and the time course over which they could affect their
downstream targets. Additionally, inhibitory synapses between SOM cells and fast-spiking (FS)
cells can produce synchronous activity between these different types of inhibitory interneurons
(Hu et al., 2011). Therefore, developmental regulation of the inhibitory output from SOM cells
125
may impact the ability of SOM cells to synchronize with FS cells through inhibitory synapses.
Further investigation of SOM input and output properties (e.g. synaptic dynamics) as a function
of age will be critical to our understanding of the role of SOM cells during this postnatal time
period.
Finally, multiple studies in vitro, in vivo, and using computational models have suggested
unique roles for SOM inhibitory interneurons during cortical sensory processing (Tan et al.,
2008; Vierling-Claassen et al., 2010; Hayut et al., 2011; Ma et al., 2012). For example, inhibition
onto the apical dendrite of pyramidal cells can inhibit pyramidal cell firing by influencing active
currents in this dendritic sub-region (Larkum et al., 1999, 2001; Perez-Garci et al., 2006; Gentet
et al., 2012; Lovett-Barron et al., 2012). This suggests that SOM cells may be involved in
regulating excitatory synapses onto such apical dendrites, including long-range projections from
other cortical and subcortical areas (Petreanu et al., 2007; Petreanu et al., 2009). In contrast, FS
cells, which terminate on the perisomatic regions of their targets, would not directly control these
inputs. Thus, developmentally mediated increases in SOM cell activity due to increases in gain
might more closely regulate long-range inputs to somatosensory cortex at later ages. In addition,
SOM cells exhibit different behaviors in vivo than other inhibitory interneurons, including FS
cells. Specifically, it has been shown that SOM cells are preferentially active during quiet
wakefulness, and are hyperpolarized in response to sensory input, whereas FS cells respond
robustly to sensory input (Gentet et al., 2012). If, as these findings collectively suggest, increased
SOM cell activity gates out excitatory distal dendritic input during sensory processing, then it
would appear from our study that such dendritic input (e.g. from motor cortex) becomes
increasingly gated as a function of age. Whether and why more excitatory dendritic input might

126
be useful early in the development of the sensorimotor system, or a detriment at older ages, is not
yet known. In any case, it is clear that SOM and FS cells possess distinct intrinsic and synaptic
properties that may contribute to their different behaviors in vivo. The development of these
properties in both FS and SOM cells happens concurrently, over the second and third postnatal
weeks, and may contribute to the dichotomous roles of these subsets of interneurons in
neocortical processing.
127
BIBLIOGRAPHY
Agmon A, Connors BW (1989) Repetitive burst-firing neurons in the deep layers of mouse somatosensory cortex. Neurosci Lett 99:137-141.
Agmon A, Connors BW (1992) Correlation between intrinsic firing patterns and thalamocortical synaptic responses of neurons in mouse barrel cortex. J Neurosci 12:319-329.
Alloway KD (2008) Information processing streams in rodent barrel cortex: the differential functions of barrel and septal circuits. Cereb Cortex 18:979-989.
Alloway KD, Zhang M, Chakrabarti S (2004) Septal columns in rodent barrel cortex: functional circuits for modulating whisking behavior. J Comp Neurol 480:299-309.
Amitai Y, Gibson JR, Beierlein M, Patrick SL, Ho AM, Connors BW, Golomb D (2002) The spatial dimensions of electrically coupled networks of interneurons in the neocortex. J Neurosci 22:4142-4152.
Aronoff R, Matyas F, Mateo C, Ciron C, Schneider B, Petersen CC (2010) Long-range connectivity of mouse primary somatosensory barrel cortex. Eur J Neurosci 31:2221-2233.
Ascoli GA et al. (2008) Petilla terminology: nomenclature of features of GABAergic interneurons of the cerebral cortex. Nat Rev Neurosci 9:557-568.
Bartley AF, Huang ZJ, Huber KM, Gibson JR (2008) Differential activity-dependent, homeostatic plasticity of two neocortical inhibitory circuits. J Neurophysiol 100:1983-1994.
Beierlein M, Connors BW (2002) Short-term dynamics of thalamocortical and intracortical synapses onto layer 6 neurons in neocortex. J Neurophysiol 88:1924-1932.

128
Beierlein M, Gibson JR, Connors BW (2000) A network of electrically coupled interneurons drives synchronized inhibition in neocortex. Nat Neurosci 3:904-910.
Beierlein M, Gibson JR, Connors BW (2003) Two dynamically distinct inhibitory networks in layer 4 of the neocortex. J Neurophysiol 90:2987-3000.
Beloozerova IN, Sirota MG, Swadlow HA (2003) Activity of different classes of neurons of the motor cortex during locomotion. J Neurosci 23:1087-1097.
Berger TK, Silberberg G, Perin R, Markram H (2010) Brief bursts self-inhibit and correlate the pyramidal network. PLoS Biol 8.
Bernardo KL, Woolsey TA (1987) Axonal trajectories between mouse somatosensory thalamus and cortex. J Comp Neurol 258:542-564.
Bourassa J, Pinault D, Deschenes M (1995) Corticothalamic projections from the cortical barrel field to the somatosensory thalamus in rats: a single-fibre study using biocytin as an anterograde tracer. Eur J Neurosci 7:19-30.
Boyden ES, Zhang F, Bamberg E, Nagel G, Deisseroth K (2005) Millisecond-timescale, genetically targeted optical control of neural activity. Nat Neurosci 8:1263-1268.
Brecht M, Schneider M, Sakmann B, Margrie TW (2004) Whisker movements evoked by stimulation of single pyramidal cells in rat motor cortex. Nature 427:704-710.
Brecht M, Grinevich V, Jin TE, Margrie T, Osten P (2006) Cellular mechanisms of motor control in the vibrissal system. Pflugers Arch 453:269-281.
Brown SP, Hestrin S (2009) Intracortical circuits of pyramidal neurons reflect their long-range axonal targets. Nature 457:1133-1136.
Bruno RM, Simons DJ (2002) Feedforward mechanisms of excitatory and inhibitory cortical receptive fields. J Neurosci 22:10966-10975.
Buckmaster PS, Jongen-Relo AL (1999) Highly specific neuron loss preserves lateral inhibitory circuits in the dentate gyrus of kainate-induced epileptic rats. The Journal of neuroscience : the official journal of the Society for Neuroscience 19:9519-9529.
Carvell GE, Simons DJ (1987) Thalamic and corticocortical connections of the second somatic sensory area of the mouse. J Comp Neurol 265:409-427.
Carvell GE, Simons DJ (1990) Biometric analyses of vibrissal tactile discrimination in the rat. J Neurosci 10:2638-2648.
129
Carvell GE, Miller SA, Simons DJ (1996) The relationship of vibrissal motor cortex unit activity to whisking in the awake rat. Somatosens Mot Res 13:115-127.
Castro-Alamancos MA (2004) Dynamics of sensory thalamocortical synaptic networks during information processing states. Prog Neurobiol 74:213-247.
Cauller LJ, Clancy B, Connors BW (1998) Backward cortical projections to primary somatosensory cortex in rats extend long horizontal axons in layer I. J Comp Neurol 390:297-310.
Chagnac-Amitai Y, Luhmann HJ, Prince DA (1990) Burst generating and regular spiking layer 5 pyramidal neurons of rat neocortex have different morphological features. J Comp Neurol 296:598-613.
Chance FS, Abbott LF, Reyes AD (2002) Gain modulation from background synaptic input. Neuron 35:773-782.
Chapin JK, Woodward DJ (1982) Somatic sensory transmission to the cortex during movement: gating of single cell responses to touch. Exp Neurol 78:654-669.
Chapman CA, Lacaille JC (1999a) Cholinergic induction of theta-frequency oscillations in hippocampal inhibitory interneurons and pacing of pyramidal cell firing. J Neurosci 19:8637-8645.
Chapman CA, Lacaille JC (1999b) Intrinsic theta-frequency membrane potential oscillations in hippocampal CA1 interneurons of stratum lacunosum-moleculare. J Neurophysiol 81:1296-1307.
Chapman CE (1994) Active versus passive touch: factors influencing the transmission of somatosensory signals to primary somatosensory cortex. Can J Physiol Pharmacol 72:558-570.
Chmielowska J, Carvell GE, Simons DJ (1989) Spatial organization of thalamocortical and corticothalamic projection systems in the rat SmI barrel cortex. J Comp Neurol 285:325-338.
Chow A, Erisir A, Farb C, Nadal MS, Ozaita A, Lau D, Welker E, Rudy B (1999) K(+) channel expression distinguishes subpopulations of parvalbumin- and somatostatin-containing neocortical interneurons. J Neurosci 19:9332-9345.
Chung S, Li X, Nelson SB (2002) Short-term depression at thalamocortical synapses contributes to rapid adaptation of cortical sensory responses in vivo. Neuron 34:437-446.

130
Constantinople CM, Bruno RM (2011) Effects and mechanisms of wakefulness on local cortical networks. Neuron 69:1061-1068.
Cossart R, Dinocourt C, Hirsch JC, Merchan-Perez A, De Felipe J, Ben-Ari Y, Esclapez M, Bernard C (2001) Dendritic but not somatic GABAergic inhibition is decreased in experimental epilepsy. Nat Neurosci 4:52-62.
Cramer NP, Keller A (2006) Cortical control of a whisking central pattern generator. J Neurophysiol 96:209-217.
Cramer NP, Li Y, Keller A (2007) The whisking rhythm generator: a novel mammalian network for the generation of movement. J Neurophysiol 97:2148-2158.
Crochet S, Petersen CC (2006) Correlating whisker behavior with membrane potential in barrel cortex of awake mice. Nat Neurosci 9:608-610.
Cruikshank SJ, Lewis TJ, Connors BW (2007) Synaptic basis for intense thalamocortical activation of feedforward inhibitory cells in neocortex. Nat Neurosci 10:462-468.
Cruikshank SJ, Urabe H, Nurmikko AV, Connors BW (2010) Pathway-Specific Feedforward Circuits between Thalamus and Neocortex Revealed by Selective Optical Stimulation of Axons. Neuron 65:230-245.
de Kock CP, Sakmann B (2009) Spiking in primary somatosensory cortex during natural whisking in awake head-restrained rats is cell-type specific. Proc Natl Acad Sci U S A 106:16446-16450.
de Kock CP, Bruno RM, Spors H, Sakmann B (2007) Layer- and cell-type-specific suprathreshold stimulus representation in rat primary somatosensory cortex. J Physiol 581:139-154.
de la Rocha J, Doiron B, Shea-Brown E, Josic K, Reyes A (2007) Correlation between neural spike trains increases with firing rate. Nature 448:802-806.
Deschenes M, Bourassa J, Pinault D (1994) Corticothalamic projections from layer V cells in rat are collaterals of long-range corticofugal axons. Brain Res 664:215-219.
Deschenes M, Moore J, Kleinfeld D (2012) Sniffing and whisking in rodents. Curr Opin Neurobiol 22:243-250.
Destexhe A, Pare D (1999) Impact of network activity on the integrative properties of neocortical pyramidal neurons in vivo. J Neurophysiol 81:1531-1547.
131
Destexhe A, Rudolph M, Pare D (2003) The high-conductance state of neocortical neurons in vivo. Nat Rev Neurosci 4:739-751.
Diamond ME, Armstrong-James M, Ebner FF (1992a) Somatic sensory responses in the rostral sector of the posterior group (POm) and in the ventral posterior medial nucleus (VPM) of the rat thalamus. J Comp Neurol 318:462-476.
Diamond ME, Armstrong-James M, Budway MJ, Ebner FF (1992b) Somatic sensory responses in the rostral sector of the posterior group (POm) and in the ventral posterior medial nucleus (VPM) of the rat thalamus: dependence on the barrel field cortex. J Comp Neurol 319:66-84.
Diaz-Quesada M, Maravall M (2008) Intrinsic mechanisms for adaptive gain rescaling in barrel cortex. J Neurosci 28:696-710.
Dittgen T, Nimmerjahn A, Komai S, Licznerski P, Waters J, Margrie TW, Helmchen F, Denk W, Brecht M, Osten P (2004) Lentivirus-based genetic manipulations of cortical neurons and their optical and electrophysiological monitoring in vivo. Proc Natl Acad Sci U S A 101:18206-18211.
Douglas RJ, Martin KA (2004) Neuronal circuits of the neocortex. Annu Rev Neurosci 27:419-451.
Elhanany E, White EL (1990) Intrinsic circuitry: synapses involving the local axon collaterals of corticocortical projection neurons in the mouse primary somatosensory cortex. J Comp Neurol 291:43-54.
Erzurumlu RS, Killackey HP (1979) Efferent connections of the brainstem trigeminal complex with the facial nucleus of the rat. J Comp Neurol 188:75-86.
Fanselow EE, Nicolelis MA (1999) Behavioral modulation of tactile responses in the rat somatosensory system. J Neurosci 19:7603-7616.
Fanselow EE, Connors BW (2010) The roles of somatostatin-expressing (GIN) and fast-spiking inhibitory interneurons in UP-DOWN states of mouse neocortex. J Neurophysiol 104:596-606.
Fanselow EE, Richardson KA, Connors BW (2008) Selective, state-dependent activation of somatostatin-expressing inhibitory interneurons in mouse neocortex. J Neurophysiol 100:2640-2652.
Fee MS, Mitra PP, Kleinfeld D (1997) Central versus peripheral determinants of patterned spike activity in rat vibrissa cortex during whisking. J Neurophysiol 78:1144-1149.

132
Feldmeyer D (2012) Excitatory neuronal connectivity in the barrel cortex. Front Neuroanat 6:24.
Feldmeyer D, Lubke J, Sakmann B (2006) Efficacy and connectivity of intracolumnar pairs of layer 2/3 pyramidal cells in the barrel cortex of juvenile rats. J Physiol 575:583-602.
Felleman DJ, Van Essen DC (1991) Distributed hierarchical processing in the primate cerebral cortex. Cereb Cortex 1:1-47.
Ferezou I, Bolea S, Petersen CC (2006) Visualizing the cortical representation of whisker touch: voltage-sensitive dye imaging in freely moving mice. Neuron 50:617-629.
Ferezou I, Haiss F, Gentet LJ, Aronoff R, Weber B, Petersen CC (2007) Spatiotemporal dynamics of cortical sensorimotor integration in behaving mice. Neuron 56:907-923.
Frick A, Feldmeyer D, Sakmann B (2007) Postnatal development of synaptic transmission in local networks of L5A pyramidal neurons in rat somatosensory cortex. J Physiol 585:103-116.
Friedman A, Arens J, Heinemann U, Gutnick MJ (1992) Slow depolarizing afterpotentials in neocortical neurons are sodium and calcium dependent. Neurosci Lett 135:13-17.
Friedman WA, Zeigler HP, Keller A (2012) Vibrissae motor cortex unit activity during whisking. J Neurophysiol 107:551-563.
Friedman WA, Jones LM, Cramer NP, Kwegyir-Afful EE, Zeigler HP, Keller A (2006) Anticipatory activity of motor cortex in relation to rhythmic whisking. J Neurophysiol 95:1274-1277.
Furuta T, Urbain N, Kaneko T, Deschenes M (2010) Corticofugal control of vibrissa-sensitive neurons in the interpolaris nucleus of the trigeminal complex. J Neurosci 30:1832-1838.
Furuta T, Timofeeva E, Nakamura K, Okamoto-Furuta K, Togo M, Kaneko T, Deschenes M (2008) Inhibitory gating of vibrissal inputs in the brainstem. J Neurosci 28:1789-1797.
Gabernet L, Jadhav SP, Feldman DE, Carandini M, Scanziani M (2005) Somatosensory integration controlled by dynamic thalamocortical feed-forward inhibition. Neuron 48:315-327.
Gao P, Bermejo R, Zeigler HP (2001) Whisker deafferentation and rodent whisking patterns: behavioral evidence for a central pattern generator. J Neurosci 21:5374-5380.
Gao P, Hattox AM, Jones LM, Keller A, Zeigler HP (2003) Whisker motor cortex ablation and whisker movement patterns. Somatosens Mot Res 20:191-198.
133
Gentet LJ, Avermann M, Matyas F, Staiger JF, Petersen CC (2010) Membrane Potential Dynamics of GABAergic Neurons in the Barrel Cortex of Behaving Mice. Neuron 65:422-435.
Gentet LJ, Kremer Y, Taniguchi H, Huang ZJ, Staiger JF, Petersen CC (2012) Unique functional properties of somatostatin-expressing GABAergic neurons in mouse barrel cortex. Nat Neurosci 15:607-612.
Ghazanfar AA, Krupa DJ, Nicolelis MA (2001) Role of cortical feedback in the receptive field structure and nonlinear response properties of somatosensory thalamic neurons. Exp Brain Res 141:88-100.
Gibson JR, Beierlein M, Connors BW (1999) Two networks of electrically coupled inhibitory neurons in neocortex. Nature 402:75-79.
Gil Z, Connors BW, Amitai Y (1997) Differential regulation of neocortical synapses by neuromodulators and activity. Neuron 19:679-686.
Goldberg EM, Jeong HY, Kruglikov I, Tremblay R, Lazarenko RM, Rudy B (2011) Rapid developmental maturation of neocortical FS cell intrinsic excitability. Cereb Cortex 21:666-682.
Gottlieb JP, Keller A (1997) Intrinsic circuitry and physiological properties of pyramidal neurons in rat barrel cortex. Exp Brain Res 115:47-60.
Griguoli M, Maul A, Nguyen C, Giorgetti A, Carloni P, Cherubini E (2010) Nicotine blocks the hyperpolarization-activated current Ih and severely impairs the oscillatory behavior of oriens-lacunosum moleculare interneurons. J Neurosci 30:10773-10783.
Grinevich V, Brecht M, Osten P (2005) Monosynaptic pathway from rat vibrissa motor cortex to facial motor neurons revealed by lentivirus-based axonal tracing. J Neurosci 25:8250-8258.
Groh A, de Kock CP, Wimmer VC, Sakmann B, Kuner T (2008) Driver or coincidence detector: modal switch of a corticothalamic giant synapse controlled by spontaneous activity and short-term depression. J Neurosci 28:9652-9663.
Guan D, Horton LR, Armstrong WE, Foehring RC (2011) Postnatal development of A-type and Kv1- and Kv2-mediated potassium channel currents in neocortical pyramidal neurons. J Neurophysiol 105:2976-2988.
134
Guerra L, McGarry LM, Robles V, Bielza C, Larranaga P, Yuste R (2011) Comparison between supervised and unsupervised classifications of neuronal cell types: a case study. Dev Neurobiol 71:71-82.
Guillery RW, Sherman SM (2011) Branched thalamic afferents: what are the messages that they relay to the cortex? Brain Res Rev 66:205-219.
Gunaydin LA, Yizhar O, Berndt A, Sohal VS, Deisseroth K, Hegemann P (2010) Ultrafast optogenetic control. Nat Neurosci 13:387-392.
Gupta A, Wang Y, Markram H (2000) Organizing principles for a diversity of GABAergic interneurons and synapses in the neocortex. Science 287:273-278.
Halabisky B, Shen F, Huguenard JR, Prince DA (2006) Electrophysiological classification of somatostatin-positive interneurons in mouse sensorimotor cortex. J Neurophysiol 96:834-845.
Hattox AM, Nelson SB (2007) Layer V neurons in mouse cortex projecting to different targets have distinct physiological properties. J Neurophysiol 98:3330-3340.
Hattox AM, Priest CA, Keller A (2002) Functional circuitry involved in the regulation of whisker movements. J Comp Neurol 442:266-276.
Hayut I, Fanselow EE, Connors BW, Golomb D (2011) LTS and FS inhibitory interneurons, short-term synaptic plasticity, and cortical circuit dynamics. PLoS Comput Biol 7:e1002248.
Helmstaedter M, Sakmann B, Feldmeyer D (2009) L2/3 interneuron groups defined by multiparameter analysis of axonal projection, dendritic geometry, and electrical excitability. Cereb Cortex 19:951-962.
Hentschke H, Haiss F, Schwarz C (2006) Central signals rapidly switch tactile processing in rat barrel cortex during whisker movements. Cereb Cortex 16:1142-1156.
Hill DN, Curtis JC, Moore JD, Kleinfeld D (2011) Primary motor cortex reports efferent control of vibrissa motion on multiple timescales. Neuron 72:344-356.
Hoogland PV, Wouterlood FG, Welker E, Van der Loos H (1991) Ultrastructure of giant and small thalamic terminals of cortical origin: a study of the projections from the barrel cortex in mice using Phaseolus vulgaris leuco-agglutinin (PHA-L). Exp Brain Res 87:159-172.

135
Hooks BM, Hires SA, Zhang YX, Huber D, Petreanu L, Svoboda K, Shepherd GM (2011) Laminar analysis of excitatory local circuits in vibrissal motor and sensory cortical areas. PLoS Biol 9:e1000572.
Hu H, Ma Y, Agmon A (2011) Submillisecond firing synchrony between different subtypes of cortical interneurons connected chemically but not electrically. J Neurosci 31:3351-3361.
Jacquin MF, Mooney RD, Rhoades RW (1986) Morphology, response properties, and collateral projections of trigeminothalamic neurons in brainstem subnucleus interpolaris of rat. Exp Brain Res 61:457-468.
Jensen KF, Killackey HP (1987) Terminal arbors of axons projecting to the somatosensory cortex of the adult rat. I. The normal morphology of specific thalamocortical afferents. J Neurosci 7:3529-3543.
Jones LM, Lee S, Trageser JC, Simons DJ, Keller A (2004) Precise temporal responses in whisker trigeminal neurons. J Neurophysiol 92:665-668.
Kapfer C, Glickfeld LL, Atallah BV, Scanziani M (2007) Supralinear increase of recurrent inhibition during sparse activity in the somatosensory cortex. Nat Neurosci 10:743-753.
Kasper EM, Lubke J, Larkman AU, Blakemore C (1994) Pyramidal neurons in layer 5 of the rat visual cortex. III. Differential maturation of axon targeting, dendritic morphology, and electrophysiological properties. J Comp Neurol 339:495-518.
Kawaguchi Y (1993) Physiological, morphological, and histochemical characterization of three classes of interneurons in rat neostriatum. J Neurosci 13:4908-4923.
Kawaguchi Y, Kubota Y (1996) Physiological and morphological identification of somatostatin- or vasoactive intestinal polypeptide-containing cells among GABAergic cell subtypes in rat frontal cortex. J Neurosci 16:2701-2715.
Killackey HP (1973) Anatomical evidence for cortical subdivisions based on vertically discrete thalamic projections from the ventral posterior nucleus to cortical barrels in the rat. Brain Res 51:326-331.
Killackey HP, Koralek KA, Chiaia NL, Rhodes RW (1989) Laminar and areal differences in the origin of the subcortical projection neurons of the rat somatosensory cortex. J Comp Neurol 282:428-445.
Kinnischtzke AK, Simons DJ, Fanselow EE (2013) Motor Cortex Broadly Engages Excitatory and Inhibitory Neurons in Somatosensory Barrel Cortex. Cereb Cortex.
136
Kinnischtzke AK, Sewall AM, Berkepile JM, Fanselow EE (2012) Postnatal maturation of somatostatin-expressing inhibitory cells in the somatosensory cortex of GIN mice. Front Neural Circuits 6:33.
Klausberger T, Magill PJ, Marton LF, Roberts JD, Cobden PM, Buzsaki G, Somogyi P (2003) Brain-state- and cell-type-specific firing of hippocampal interneurons in vivo. Nature 421:844-848.
Kleinfeld D, Ahissar E, Diamond ME (2006) Active sensation: insights from the rodent vibrissa sensorimotor system. Curr Opin Neurobiol 16:435-444.
Koralek KA, Jensen KF, Killackey HP (1988) Evidence for two complementary patterns of thalamic input to the rat somatosensory cortex. Brain Res 463:346-351.
Koralek KA, Olavarria J, Killackey HP (1990) Areal and laminar organization of corticocortical projections in the rat somatosensory cortex. J Comp Neurol 299:133-150.
Krupa DJ, Wiest MC, Shuler MG, Laubach M, Nicolelis MA (2004) Layer-specific somatosensory cortical activation during active tactile discrimination. Science 304:1989-1992.
Kwegyir-Afful EE, Simons DJ (2009) Subthreshold receptive field properties distinguish different classes of corticothalamic neurons in the somatosensory system. J Neurosci 29:964-972.
Kwegyir-Afful EE, Marella S, Simons DJ (2008) Response properties of mouse trigeminal ganglion neurons. Somatosens Mot Res 25:209-221.
Land PW, Buffer SA, Jr., Yaskosky JD (1995) Barreloids in adult rat thalamus: three-dimensional architecture and relationship to somatosensory cortical barrels. J Comp Neurol 355:573-588.
Landisman CE, Connors BW (2007) VPM and PoM nuclei of the rat somatosensory thalamus: intrinsic neuronal properties and corticothalamic feedback. Cereb Cortex 17:2853-2865.
Larkum ME, Zhu JJ, Sakmann B (1999) A new cellular mechanism for coupling inputs arriving at different cortical layers. Nature 398:338-341.
Larkum ME, Zhu JJ, Sakmann B (2001) Dendritic mechanisms underlying the coupling of the dendritic with the axonal action potential initiation zone of adult rat layer 5 pyramidal neurons. J Physiol 533:447-466.
137
Larkum ME, Senn W, Luscher HR (2004) Top-down dendritic input increases the gain of layer 5 pyramidal neurons. Cereb Cortex 14:1059-1070.
Lavallee P, Urbain N, Dufresne C, Bokor H, Acsady L, Deschenes M (2005) Feedforward inhibitory control of sensory information in higher-order thalamic nuclei. J Neurosci 25:7489-7498.
Lawrence JJ, Grinspan ZM, Statland JM, McBain CJ (2006) Muscarinic receptor activation tunes mouse stratum oriens interneurones to amplify spike reliability. J Physiol 571:555-562.
Lazarus MS, Huang ZJ (2011) Distinct maturation profiles of perisomatic and dendritic targeting GABAergic interneurons in the mouse primary visual cortex during the critical period of ocular dominance plasticity. J Neurophysiol 106:775-787.
Le Be JV, Silberberg G, Wang Y, Markram H (2007) Morphological, electrophysiological, and synaptic properties of corticocallosal pyramidal cells in the neonatal rat neocortex. Cereb Cortex 17:2204-2213.
Lee S, Carvell GE, Simons DJ (2008) Motor modulation of afferent somatosensory circuits. Nat Neurosci 11:1430-1438.
Lee S, Hjerling-Leffler J, Zagha E, Fishell G, Rudy B (2010) The largest group of superficial neocortical GABAergic interneurons expresses ionotropic serotonin receptors. J Neurosci 30:16796-16808.
Lee SH, Kwan AC, Zhang S, Phoumthipphavong V, Flannery JG, Masmanidis SC, Taniguchi H, Huang ZJ, Zhang F, Boyden ES, Deisseroth K, Dan Y (2012) Activation of specific interneurons improves V1 feature selectivity and visual perception. Nature 488:379-383.
Lefort S, Tomm C, Floyd Sarria JC, Petersen CC (2009) The excitatory neuronal network of the C2 barrel column in mouse primary somatosensory cortex. Neuron 61:301-316.
Lewis TJ, Rinzel J (2003) Dynamics of spiking neurons connected by both inhibitory and electrical coupling. J Comput Neurosci 14:283-309.
Lien CC, Jonas P (2003) Kv3 potassium conductance is necessary and kinetically optimized for high-frequency action potential generation in hippocampal interneurons. J Neurosci 23:2058-2068.
Litwin-Kumar A, Doiron B (2012) Slow dynamics and high variability in balanced cortical networks with clustered connections. Nat Neurosci 15:1498-1505.
138
Llano DA, Sherman SM (2009) Differences in intrinsic properties and local network connectivity of identified layer 5 and layer 6 adult mouse auditory corticothalamic neurons support a dual corticothalamic projection hypothesis. Cereb Cortex 19:2810-2826.
Lovett-Barron M, Turi GF, Kaifosh P, Lee PH, Bolze F, Sun XH, Nicoud JF, Zemelman BV, Sternson SM, Losonczy A (2012) Regulation of neuronal input transformations by tunable dendritic inhibition. Nat Neurosci 15:423-430.
Lubke J, Egger V, Sakmann B, Feldmeyer D (2000) Columnar organization of dendrites and axons of single and synaptically coupled excitatory spiny neurons in layer 4 of the rat barrel cortex. J Neurosci 20:5300-5311.
Luthi A, McCormick DA (1998) H-current: properties of a neuronal and network pacemaker. Neuron 21:9-12.
Ma Y, Hu H, Agmon A (2012) Short-term plasticity of unitary inhibitory-to-inhibitory synapses depends on the presynaptic interneuron subtype. J Neurosci 32:983-988.
Ma Y, Hu H, Berrebi AS, Mathers PH, Agmon A (2006) Distinct subtypes of somatostatin-containing neocortical interneurons revealed in transgenic mice. J Neurosci 26:5069-5082.
Maccaferri G, McBain CJ (1996) The hyperpolarization-activated current (Ih) and its contribution to pacemaker activity in rat CA1 hippocampal stratum oriens-alveus interneurones. J Physiol 497 ( Pt 1):119-130.
Mancilla JG, Lewis TJ, Pinto DJ, Rinzel J, Connors BW (2007) Synchronization of electrically coupled pairs of inhibitory interneurons in neocortex. J Neurosci 27:2058-2073.
Manns ID, Sakmann B, Brecht M (2004) Sub- and suprathreshold receptive field properties of pyramidal neurones in layers 5A and 5B of rat somatosensory barrel cortex. J Physiol 556:601-622.
Mao T, Kusefoglu D, Hooks BM, Huber D, Petreanu L, Svoboda K (2011) Long-range neuronal circuits underlying the interaction between sensory and motor cortex. Neuron 72:111-123.
Maravall M, Stern EA, Svoboda K (2004) Development of intrinsic properties and excitability of layer 2/3 pyramidal neurons during a critical period for sensory maps in rat barrel cortex. J Neurophysiol 92:144-156.

139
Markram H, Wang Y, Tsodyks M (1998) Differential signaling via the same axon of neocortical pyramidal neurons. Proc Natl Acad Sci U S A 95:5323-5328.
Markram H, Toledo-Rodriguez M, Wang Y, Gupta A, Silberberg G, Wu C (2004) Interneurons of the neocortical inhibitory system. Nat Rev Neurosci 5:793-807.
Masri R, Bezdudnaya T, Trageser JC, Keller A (2008) Encoding of stimulus frequency and sensor motion in the posterior medial thalamic nucleus. J Neurophysiol 100:681-689.
Masri R, Trageser JC, Bezdudnaya T, Li Y, Keller A (2006) Cholinergic regulation of the posterior medial thalamic nucleus. J Neurophysiol 96:2265-2273.
Masri R, Quiton RL, Lucas JM, Murray PD, Thompson SM, Keller A (2009) Zona incerta: a role in central pain. J Neurophysiol 102:181-191.
McCormick DA, Prince DA (1987) Post-natal development of electrophysiological properties of rat cerebral cortical pyramidal neurones. J Physiol 393:743-762.
McCormick DA, Pape HC (1990) Properties of a hyperpolarization-activated cation current and its role in rhythmic oscillation in thalamic relay neurones. J Physiol 431:291-318.
McCormick DA, Connors BW, Lighthall JW, Prince DA (1985) Comparative electrophysiology of pyramidal and sparsely spiny stellate neurons of the neocortex. J Neurophysiol 54:782-806.
McGarry LM, Packer AM, Fino E, Nikolenko V, Sippy T, Yuste R (2010) Quantitative classification of somatostatin-positive neocortical interneurons identifies three interneuron subtypes. Front Neural Circuits 4:12.
Mehaffey WH, Doiron B, Maler L, Turner RW (2005) Deterministic multiplicative gain control with active dendrites. J Neurosci 25:9968-9977.
Minnery BS, Simons DJ (2003) Response properties of whisker-associated trigeminothalamic neurons in rat nucleus principalis. J Neurophysiol 89:40-56.
Minnery BS, Bruno RM, Simons DJ (2003) Response transformation and receptive-field synthesis in the lemniscal trigeminothalamic circuit. J Neurophysiol 90:1556-1570.
Mitchell SJ, Silver RA (2003) Shunting inhibition modulates neuronal gain during synaptic excitation. Neuron 38:433-445.
Miyashita E, Keller A, Asanuma H (1994) Input-output organization of the rat vibrissal motor cortex. Exp Brain Res 99:223-232.

140
Moore JD, Deschenes M, Furuta T, Huber D, Smear MC, Demers M, Kleinfeld D (2013) Hierarchy of orofacial rhythms revealed through whisking and breathing. Nature 497:205-210.
Mosconi T, Woolsey TA, Jacquin MF (2010) Passive vs. active touch-induced activity in the developing whisker pathway. Eur J Neurosci 32:1354-1363.
Murayama M, Larkum ME (2009) Enhanced dendritic activity in awake rats. Proc Natl Acad Sci U S A 106:20482-20486.
Nagel G, Szellas T, Huhn W, Kateriya S, Adeishvili N, Berthold P, Ollig D, Hegemann P, Bamberg E (2003) Channelrhodopsin-2, a directly light-gated cation-selective membrane channel. Proc Natl Acad Sci U S A 100:13940-13945.
Nathanson JL, Yanagawa Y, Obata K, Callaway EM (2009) Preferential labeling of inhibitory and excitatory cortical neurons by endogenous tropism of adeno-associated virus and lentivirus vectors. Neuroscience 161:441-450.
Oliva AA, Jr., Jiang M, Lam T, Smith KL, Swann JW (2000) Novel hippocampal interneuronal subtypes identified using transgenic mice that express green fluorescent protein in GABAergic interneurons. J Neurosci 20:3354-3368.
Oswald AM, Reyes AD (2008) Maturation of intrinsic and synaptic properties of layer 2/3 pyramidal neurons in mouse auditory cortex. J Neurophysiol 99:2998-3008.
Oswald AM, Reyes AD (2011) Development of inhibitory timescales in auditory cortex. Cereb Cortex 21:1351-1361.
Oswald AM, Doiron B, Rinzel J, Reyes AD (2009) Spatial profile and differential recruitment of GABAB modulate oscillatory activity in auditory cortex. J Neurosci 29:10321-10334.
Otsuka T, Kawaguchi Y (2008) Firing-pattern-dependent specificity of cortical excitatory feed-forward subnetworks. J Neurosci 28:11186-11195.
Otsuka T, Kawaguchi Y (2011) Cell diversity and connection specificity between callosal projection neurons in the frontal cortex. J Neurosci 31:3862-3870.
Oviedo H, Reyes AD (2005) Variation of input-output properties along the somatodendritic axis of pyramidal neurons. J Neurosci 25:4985-4995.
Packer AM, Yuste R (2011) Dense, unspecific connectivity of neocortical parvalbumin-positive interneurons: a canonical microcircuit for inhibition? J Neurosci 31:13260-13271.

141
Palmer L, Murayama M, Larkum M (2012) Inhibitory Regulation of Dendritic Activity in vivo. Front Neural Circuits 6:26.
Pape HC (1996) Queer current and pacemaker: the hyperpolarization-activated cation current in neurons. Annu Rev Physiol 58:299-327.
Perez-Garci E, Gassmann M, Bettler B, Larkum ME (2006) The GABAB1b isoform mediates long-lasting inhibition of dendritic Ca2+ spikes in layer 5 somatosensory pyramidal neurons. Neuron 50:603-616.
Perin R, Berger TK, Markram H (2011) A synaptic organizing principle for cortical neuronal groups. Proc Natl Acad Sci U S A 108:5419-5424.
Petersen CC (2007) The functional organization of the barrel cortex. Neuron 56:339-355.
Petersen CC, Sakmann B (2000) The excitatory neuronal network of rat layer 4 barrel cortex. J Neurosci 20:7579-7586.
Petersen CC, Hahn TT, Mehta M, Grinvald A, Sakmann B (2003) Interaction of sensory responses with spontaneous depolarization in layer 2/3 barrel cortex. Proc Natl Acad Sci U S A 100:13638-13643.
Petreanu L, Huber D, Sobczyk A, Svoboda K (2007) Channelrhodopsin-2-assisted circuit mapping of long-range callosal projections. Nat Neurosci 10:663-668.
Petreanu L, Mao T, Sternson SM, Svoboda K (2009) The subcellular organization of neocortical excitatory connections. Nature 457:1142-1145.
Petrof I, Viaene AN, Sherman SM (2012) Two populations of corticothalamic and interareal corticocortical cells in the subgranular layers of the mouse primary sensory cortices. J Comp Neurol 520:1678-1686.
Pinto DJ, Hartings JA, Brumberg JC, Simons DJ (2003) Cortical damping: analysis of thalamocortical response transformations in rodent barrel cortex. Cereb Cortex 13:33-44.
Porter JT, Johnson CK, Agmon A (2001) Diverse types of interneurons generate thalamus-evoked feedforward inhibition in the mouse barrel cortex. J Neurosci 21:2699-2710.
Porter LL, White EL (1983) Afferent and efferent pathways of the vibrissal region of primary motor cortex in the mouse. J Comp Neurol 214:279-289.
Pouille F, Scanziani M (2001) Enforcement of temporal fidelity in pyramidal cells by somatic feed-forward inhibition. Science 293:1159-1163.

142
Pouille F, Scanziani M (2004) Routing of spike series by dynamic circuits in the hippocampus. Nature 429:717-723.
Poulet JF, Petersen CC (2008) Internal brain state regulates membrane potential synchrony in barrel cortex of behaving mice. Nature 454:881-885.
Prescott SA, De Koninck Y (2003) Gain control of firing rate by shunting inhibition: roles of synaptic noise and dendritic saturation. Proc Natl Acad Sci U S A 100:2076-2081.
Reichova I, Sherman SM (2004) Somatosensory corticothalamic projections: distinguishing drivers from modulators. J Neurophysiol 92:2185-2197.
Renart A, de la Rocha J, Bartho P, Hollender L, Parga N, Reyes A, Harris KD (2010) The asynchronous state in cortical circuits. Science 327:587-590.
Reyes A, Lujan R, Rozov A, Burnashev N, Somogyi P, Sakmann B (1998) Target-cell-specific facilitation and depression in neocortical circuits. Nat Neurosci 1:279-285.
Rocco-Donovan M, Ramos RL, Giraldo S, Brumberg JC (2011) Characteristics of synaptic connections between rodent primary somatosensory and motor cortices. Somatosens Mot Res 28:63-72.
Rudolph M, Pelletier JG, Pare D, Destexhe A (2005) Characterization of synaptic conductances and integrative properties during electrically induced EEG-activated states in neocortical neurons in vivo. J Neurophysiol 94:2805-2821.
Rudy B, McBain CJ (2001) Kv3 channels: voltage-gated K+ channels designed for high-frequency repetitive firing. Trends Neurosci 24:517-526.
Rudy B, Fishell G, Lee S, Hjerling-Leffler J (2011) Three groups of interneurons account for nearly 100% of neocortical GABAergic neurons. Dev Neurobiol 71:45-61.
Rumberger A, Schmidt M, Lohmann H, Hoffmann KP (1998) Correlation of electrophysiology, morphology, and functions in corticotectal and corticopretectal projection neurons in rat visual cortex. Exp Brain Res 119:375-390.
Sanchez-Vives MV, McCormick DA (2000) Cellular and network mechanisms of rhythmic recurrent activity in neocortex. Nat Neurosci 3:1027-1034.
Schubert D, Kotter R, Luhmann HJ, Staiger JF (2006) Morphology, electrophysiology and functional input connectivity of pyramidal neurons characterizes a genuine layer va in the primary somatosensory cortex. Cereb Cortex 16:223-236.

143
Schwindt P, Crill W (1999) Mechanisms underlying burst and regular spiking evoked by dendritic depolarization in layer 5 cortical pyramidal neurons. J Neurophysiol 81:1341-1354.
Schwindt P, O'Brien JA, Crill W (1997) Quantitative analysis of firing properties of pyramidal neurons from layer 5 of rat sensorimotor cortex. J Neurophysiol 77:2484-2498.
Semba K, Komisaruk BR (1984) Neural substrates of two different rhythmical vibrissal movements in the rat. Neuroscience 12:761-774.
Sheets PL, Suter BA, Kiritani T, Chan CS, Surmeier DJ, Shepherd GM (2011) Corticospinal-specific HCN expression in mouse motor cortex: I(h)-dependent synaptic integration as a candidate microcircuit mechanism involved in motor control. J Neurophysiol 106:2216-2231.
Shepherd GM, Svoboda K (2005) Laminar and columnar organization of ascending excitatory projections to layer 2/3 pyramidal neurons in rat barrel cortex. J Neurosci 25:5670-5679.
Sherman SM (2005) Thalamic relays and cortical functioning. Prog Brain Res 149:107-126.
Sherman SM, Guillery RW (2011) Distinct functions for direct and transthalamic corticocortical connections. J Neurophysiol 106:1068-1077.
Shu Y, Hasenstaub A, McCormick DA (2003) Turning on and off recurrent balanced cortical activity. Nature 423:288-293.
Silberberg G, Markram H (2007) Disynaptic inhibition between neocortical pyramidal cells mediated by Martinotti cells. Neuron 53:735-746.
Silver RA (2010) Neuronal arithmetic. Nat Rev Neurosci 11:474-489.
Simons DJ (1978) Response properties of vibrissa units in rat SI somatosensory neocortex. J Neurophysiol 41:798-820.
Simons DJ, Carvell GE (1989) Thalamocortical response transformation in the rat vibrissa/barrel system. J Neurophysiol 61:311-330.
Smith JB, Alloway KD (2013) Rat whisker motor cortex is subdivided into sensory-input and motor-output areas. Front Neural Circuits 7:4.
Somogyi P, Kisvarday ZF, Martin KA, Whitteridge D (1983) Synaptic connections of morphologically identified and physiologically characterized large basket cells in the striate cortex of cat. Neuroscience 10:261-294.
144
Steriade M, Nunez A, Amzica F (1993) A novel slow (< 1 Hz) oscillation of neocortical neurons in vivo: depolarizing and hyperpolarizing components. J Neurosci 13:3252-3265.
Steriade M, Timofeev I, Grenier F (2001) Natural waking and sleep states: a view from inside neocortical neurons. J Neurophysiol 85:1969-1985.
Swadlow HA (1989) Efferent neurons and suspected interneurons in S-1 vibrissa cortex of the awake rabbit: receptive fields and axonal properties. J Neurophysiol 62:288-308.
Swadlow HA (2003) Fast-spike interneurons and feedforward inhibition in awake sensory neocortex. Cereb Cortex 13:25-32.
Swadlow HA, Hicks TP (1996) Somatosensory cortical efferent neurons of the awake rabbit: latencies to activation via supra--and subthreshold receptive fields. J Neurophysiol 75:1753-1759.
Swadlow HA, Gusev AG (2001) The impact of 'bursting' thalamic impulses at a neocortical synapse. Nat Neurosci 4:402-408.
Tan Z, Hu H, Huang ZJ, Agmon A (2008) Robust but delayed thalamocortical activation of dendritic-targeting inhibitory interneurons. Proceedings of the National Academy of Sciences of the United States of America 105:2187-2192.
Tanaka YR, Tanaka YH, Konno M, Fujiyama F, Sonomura T, Okamoto-Furuta K, Kameda H, Hioki H, Furuta T, Nakamura KC, Kaneko T (2011) Local connections of excitatory neurons to corticothalamic neurons in the rat barrel cortex. J Neurosci 31:18223-18236.
Temereanca S, Simons DJ (2004) Functional topography of corticothalamic feedback enhances thalamic spatial response tuning in the somatosensory whisker/barrel system. Neuron 41:639-651.
Thomson AM, Lamy C (2007) Functional maps of neocortical local circuitry. Front Neurosci 1:19-42.
Timofeeva E, Dufresne C, Sik A, Zhang ZW, Deschenes M (2005) Cholinergic modulation of vibrissal receptive fields in trigeminal nuclei. J Neurosci 25:9135-9143.
Trageser JC, Keller A (2004) Reducing the uncertainty: gating of peripheral inputs by zona incerta. J Neurosci 24:8911-8915.
Trageser JC, Burke KA, Masri R, Li Y, Sellers L, Keller A (2006) State-dependent gating of sensory inputs by zona incerta. J Neurophysiol 96:1456-1463.

145
Tseng GF, Prince DA (1993) Heterogeneity of rat corticospinal neurons. J Comp Neurol 335:92-108.
Veinante P, Deschenes M (2003) Single-cell study of motor cortex projections to the barrel field in rats. J Comp Neurol 464:98-103.
Vierling-Claassen D, Cardin JA, Moore CI, Jones SR (2010) Computational modeling of distinct neocortical oscillations driven by cell-type selective optogenetic drive: separable resonant circuits controlled by low-threshold spiking and fast-spiking interneurons. Frontiers in human neuroscience 4:198.
Wang Y, Gupta A, Toledo-Rodriguez M, Wu CZ, Markram H (2002) Anatomical, physiological, molecular and circuit properties of nest basket cells in the developing somatosensory cortex. Cereb Cortex 12:395-410.
Wang Y, Toledo-Rodriguez M, Gupta A, Wu C, Silberberg G, Luo J, Markram H (2004) Anatomical, physiological and molecular properties of Martinotti cells in the somatosensory cortex of the juvenile rat. J Physiol 561:65-90.
Wang Z, McCormick DA (1993) Control of firing mode of corticotectal and corticopontine layer V burst-generating neurons by norepinephrine, acetylcholine, and 1S,3R-ACPD. J Neurosci 13:2199-2216.
Welker E, Hoogland PV, Van der Loos H (1988) Organization of feedback and feedforward projections of the barrel cortex: a PHA-L study in the mouse. Exp Brain Res 73:411-435.
White EL (1989) Cortical circuits : synaptic organization of the cerebral cortex--structure, function, and theory. Boston: Birkhäuser.
White EL, DeAmicis RA (1977) Afferent and efferent projections of the region in mouse SmL cortex which contains the posteromedial barrel subfield. J Comp Neurol 175:455-482.
White EL, Hersch SM (1982) A quantitative study of thalamocortical and other synapses involving the apical dendrites of corticothalamic projection cells in mouse SmI cortex. J Neurocytol 11:137-157.
Wilson CJ (1987) Morphology and synaptic connections of crossed corticostriatal neurons in the rat. J Comp Neurol 263:567-580.
Wilson NR, Runyan CA, Wang FL, Sur M (2012) Division and subtraction by distinct cortical inhibitory networks in vivo. Nature 488:343-348.
146
Wimmer VC, Bruno RM, de Kock CP, Kuner T, Sakmann B (2010) Dimensions of a projection column and architecture of VPM and POm axons in rat vibrissal cortex. Cereb Cortex 20:2265-2276.
Wise SP, Jones EG (1977) Cells of origin and terminal distribution of descending projections of the rat somatic sensory cortex. J Comp Neurol 175:129-157.
Xiang Z, Huguenard JR, Prince DA (2002) Synaptic inhibition of pyramidal cells evoked by different interneuronal subtypes in layer v of rat visual cortex. J Neurophysiol 88:740-750.
Xu NL, Harnett MT, Williams SR, Huber D, O'Connor DH, Svoboda K, Magee JC (2012) Nonlinear dendritic integration of sensory and motor input during an active sensing task. Nature 492:247-251.
Zarrinpar A, Callaway EM (2006) Local connections to specific types of layer 6 neurons in the rat visual cortex. J Neurophysiol 95:1751-1761.
Zhang L, McBain CJ (1995) Potassium conductances underlying repolarization and after-hyperpolarization in rat CA1 hippocampal interneurones. J Physiol 488 ( Pt 3):661-672.
Zhang Z, Jiao YY, Sun QQ (2011) Developmental maturation of excitation and inhibition balance in principal neurons across four layers of somatosensory cortex. Neuroscience 174:10-25.
Zhang ZW, Deschenes M (1997) Intracortical axonal projections of lamina VI cells of the primary somatosensory cortex in the rat: a single-cell labeling study. J Neurosci 17:6365-6379.
Zhang ZW, Deschenes M (1998) Projections to layer VI of the posteromedial barrel field in the rat: a reappraisal of the role of corticothalamic pathways. Cereb Cortex 8:428-436.
Zucker E, Welker WI (1969) Coding of somatic sensory input by vibrissae neurons in the rat's trigeminal ganglion. Brain Res 12:138-156.