Embed Size (px)
Citation preview

J. Cell Set. 54, 173-191 (1982) 173
Printed in Great Britain © Company of Biologists Limited 1982
CELL VOLUME AND THE CONTROL OF
THE CHLAMYDOMONAS CELL CYCLE
R. A. CRAIGIE AND T. CAVALIER-SMITHDepartment of Biophysics, King's College London, 26-20 Drury Lane, LondonWCzB sRL, U.K.
SUMMARY
Chlamydomonas reinhardii divides by multiple fission to produce 2" daughter cells perdivision burst, where n is an integer. By separating predivision cells from synchronous culturesinto fractions of differing mean cell volumes, and electronically measuring the numbers andvolume distributions of the daughter cells produced by the subsequent division burst, we haveshown that n is determined by the volume of the parent cell. Control of n can occur simply, ifafter every cell division the daughter cells monitor their volume and divide again if, and onlyif, their volume is greater than a fixed minimum value.
In cultures synchronized by 12-h light/12-h dark cycles, the larger parent cells divide earlierin the dark period than do smaller cells. This has been shown by two independent methods:(1) by separating cells into different size fractions by Percoll density-gradient centrifugationand using the light microscope to see when they divide; and (2) by studying changes in thecell volume distribution of unfractioned cultures. Since daughter cells remain within the mother-cell wall for some hours after cell division, and cell division causes an overall swelling of themother-cell wall, the timing of division can be determined electronically by measuring thisincrease in cell volume that occurs in the dark period in the absence of growth; we find thatcells at the large end of the size distribution range undergo this swelling first, and are thenfollowed by successively smaller size fractions.
A simple model embodying a sizer followed by a timer gives a good quantitative fit to thesedata for 12-h light/ 12-h dark cycles if cell division occurs 12-h after attaining a critical volumeof approximately 140 fitn'. However, this simple model is called into question by our findingthat alterations in the length of the light period alter the rate of progress towards division evenof cells that have attained their critical volume. We discuss the relative roles of light and cellvolume in the control of division timing in the Chlamydomonas cell cycle.
INTRODUCTION
The control of cell volume and of cell division are two fundamental and closelyinterrelated problems. The idea that growth in cell volume beyond a certain pointin some way triggers division has been repeatedly discussed (Hertwig, 1903, 1908;Fantes et al. 1975; Mitchison, 1977; Cooper, 1979) and has received experimentalsupport in Amoeba (Hartmann, 1928; Prescott, 1956), Escherichia colt (Maaloe &Kjeldgaard, 1966; Donachie, 1968, 1974; Donachie, Jones & Teather, 1973; Davern,1979), Stentor (Frazier, 1973), the yeasts Schizosaccharomyces pombe (Nurse, 1975;Fantes, 1977, 1979; Fantes & Nurse, 1977, 1978; Thuriaux, Nurse & Carter, 1978;Nurse & Mitchison, 1980) and Saccharomyces cerevisiae (Johnston, Pringle & Hartwell,1977; Lorincz & Carter, 1979; Johnston, Singer, Sharrow & Slater, 1980), and theslime mould Physarum (Sudbery & Grant, 1975, 1976), A radically different view

174 R. A. Craigie and T. Cavalier-Smith
(Smith & Martin, 1973, 1974; Minor & Smith, 1974) is that commitment to divideis a purely random process, unrelated to cell volume. This random transition modelhas received most support from studies of mammalian cell-cycle kinetics (Smith &Martin, 1973, 1974; Minor & Smith, 1974; Shields & Smith, 1977; Shields, 1978),but because of statistical difficulties (Nurse & Fantes, 1977; Wheals, 1977) andalternative explanations of the data (Castor, 1980), the evidence for it is equivocal. Nurse(1980) has suggested that deterministic and probabilistic models may describedifferent aspects of a common cell-cycle control mechanism. This view is supportedby the finding (Wheals, 1980) that bud emergence in the yeast S. cerevisiae, althoughprobabilistic, is a monotonic increasing function of cell volume; the largest cellshave a constant high probability of bud emergence and therefore exhibit randomkinetics. There is also evidence in mammalian cells that entry into the postulated Bphase, or the length of the B phase (Smith & Martin, 1973, 1974) is volume-dependentfor cells smaller than a minimum size (Shields et al. 1978).
Although unicellular algae are especially well suited for cell cycle studies becauseof the ease of synchronizing them by light/dark cycles (Lien & Knutsen, 1979),previous studies of their cell cycle, mainly in Chorella (Wanka, 1965; McCullough &John, 1972) and Chlamydomonas (Jones, 1970; Mihara & Hase, 1971, 1975; Cavalier-Smith, 1974; Howell, Blaschko & Drew, 1975; Lien & Knutsen, 1979; Spudich &Sager, 1980) have not directly tackled the problem of volume control over celldivision. In the experiments reported here we have studied the relationship betweencell volume and the timing of cell division in the green alga Chlamydomonas rein-hardii. By measuring cell volume distributions electronically, and comparing cellvolumes with division times in synchronized cultures and in different size fractionsseparated from such cultures by density-gradient centrifugation, we have obtainedfirm evidence that cell volume is a major determinant of the timing of cell divisionin Chlamydomonas. Preliminary evidence derived from manipulation of the lightregime suggests, however, that attainment of a critical cell volume alone is insufficientto explain the timing of division under all conditions. We discuss possible explana-tions of these extra complexities.
Chlamydomonas is especially suited to these studies because it is possible to measurethe spread of cell division times in a semi-synchronous population without the useof time-lapse photography. This is because daughter cells remain inside the mothercell wall for some hours after cell division itself. This makes it easy to distinguishdivided and undivided cells microscopically, and even to determine the time ofdivision of specific size fractions of the population by electronic cell-sizing (because,as we show here, cell division causes a swelling of the mother cell wall).
Cell division in Chlamydomonas is by multiple fission rather than the binary fissionfound in most organisms. Since multiple fission in the absence of cell growth iswidespread in protists (Cavalier-Smith, 1980), and also occurs in egg cleavage inanimals (Mitchison, 1971), its mechanism is of considerable interest. C. reinhardii isprobably the best model system for such studies, because of the ease of obtainingsynchrony, the possibility of genetic analysis (Lewin, 1976), and the availability ofcell cycle mutants (Cavalier-Smith, unpublished; Howell & Naliboff, 1973; Howell,

Chlamydomonas cell cycle 175
1974; Warr & Quinn, 1977). Two problems are of particular interest: the mechanismthat determines the number of daughter cells in multiple fission, and the nature of thesimilarities and differences between multiple and binary fission cell cycles. Ourresults show that the number of daughters is controlled by the volume of the mothercells, and suggests that the mechanisms controlling cell division in multiple fissioncell cycles are fundamentally similar to those seen in normal binary fission cycles.However, unlike the first DNA replication and division of the multiple fission burst,subsequent rounds of replication and division appear to involve no special initiationprocess and proceed automatically and in quick succession until daughter cells aresmaller than a threshold cell volume.
MATERIALS AND METHODS
Culture methods
C. reinhardii (32C strain from the Cambridge Culture Collection) were grown in minimalmedium (Cavalier-Smith, 1974) sterilized by filtration through a 0-22 fim Millipore filter. Thisalso removed particles that would have interfered with Coulter counting.
'Feeder' cultures were prepared by inoculating 100 ml volumes of medium from agarslants. Feeder cultures (concentration range 5 x io'~3 x 10' cells/ml) were used to inoculate1-litre volumes of medium in 2-litre Eilenmeyer flasks to an initial concentration of 5 x io*cells/ml. These batch cultures were aerated with filtered air, and incubated at 20 °C underalternating 12 h light/12 h dark cycles and at a light intensity of approximately 10000 lux.Experiments were conducted during the 4th dark period following a full 12 h light period, bywhich time the cell concentration was approximately 5 x io4 cells/ml.
Scoring of cell division
A portion (0-5 ml) of a solution of 4 % (w/v) iodine, 6 % (w/v) potassium iodide in distilledwater was added to 9-5 ml of cell suspension. After mixing, the cells were pelleted using abenchtop centrifuge. The pellet was resuspended in 1 ml of supernatant by gently bubblingair through a Pasteur pipette. Samples were examined under phase-contrast using a Zeissx 16 objective. A total of 1000 cells was examined from each sample and the percentage ofundivided cells recorded. The above method gave good preservation of the parent cell wall,at least over a period of several days, even for cells fixed just prior to the onset of zoosporerelease.
Counting the daughter cells was greatly facilitated by squashing them gently between theslide and coverslip, and quickly sealing the coverslip with nail varnish to prevent evaporation.
Cell counts and size distributions
Cell counts were obtained using a model ZBi Coulter counter, using an orifice diameter of100 fim. A reciprocal amplification setting of 2 or 4, a reciprocal aperture current of 2 and alower threshold setting of 5 were used. The upper threshold was set at infinity.
Cell volume distributions were determined using a Coulter model C-1000 Channelyzer; theedit function was used throughout to minimize the effect of coincidence, variation in transittimes and oblique particle trajectory (Harvey, 1968). Latex spheres of known mean diameterwere used for calibration, and to check that no drift occurred during experiments. Size distri-bution data were stored on punch cards for future analysis.
Fractionation of cells by volume
Percoll (Pharmacia Fine Chemicals) was diluted 1:3 (v/v) with filtered medium. Gradientswere formed in situ by centrifugation for 30 min at 20000 rev./min in a Beckman L275Bultracentrifuge using an SW41 rotor. A total of 800 ml of culture was harvested by centrifugation

i 7 6 R. A. Craigie and T. Cavalier-Smith
2 4Time into dark period (h)
2 4 6Time into dark period (h)
Fig. i. A. Timing of the ist (#) , 2nd (A) and 3rd ( • ) divisions during a normal12 h light/12 h dark cycle. B. Effect on the timing of the ist (#) , 2nd (A) and 3rd ( • )divisions of replacing the final dark period by a light period. The culture, which isthe same as for A, was divided into two at the end of the light period. Half was incu-bated in darkness (A) and half in continuous light (B). The higher percentage of cellsthat divide to produce 8 daughters in the light-incubated culture is due to the extraincrease in cell volume (see text).
at 5000 rev./min in an MSE high-speed 18 centrifuge (MSE 6 X 250 ml rotor) at 200 Cfor 20 min (includes time for acceleration). The pellets were resuspended in a few ml ofsupernatant.
Two ml of concentrated cell suspension was layered onto the preformed gradients (equilib-rated at 20 °C), and then spun in a benchtop centrifuge at 200 g for 5 min. This includes thetime taken for acceleration (65 s) but excludes that for deceleration (45 s). Samples (1 ml) fromthe top, middle and bottom of the gradient were inoculated into 200 ml volumes of sterilemedium in 500 ml screw-top flasks at 20 CC (no aeration). Harvesting and separation togethertook between 40 and 45 min.
RESULTS
General properties of the Chlamydomonas cell cycle
C. reinhardii divides by multiple fission, 2n daughters being produced per divisionburst, where n is an integer. Since the daughter cells remain enclosed by the parentcell wall for a period after division, n can be readily determined by microscopy.Under the 12 h light/12 h dark regime for inducing synchrony, cell division is con-fined to the dark period (Jones, 1970; Mihara & Hase, 1971; Cavalier-Smith, 1974).Under our conditions most cells produced 4 daughters per division burst, but someproduced 2, 8 or 16. Fig. 1 A is a typical plot of the proportion of cells that have dividedto produce 2, 4 and 8 daughters at successive times in the dark period. Breakdown
Chlamydomona8 cell cycle 177
Time into dark period (h)
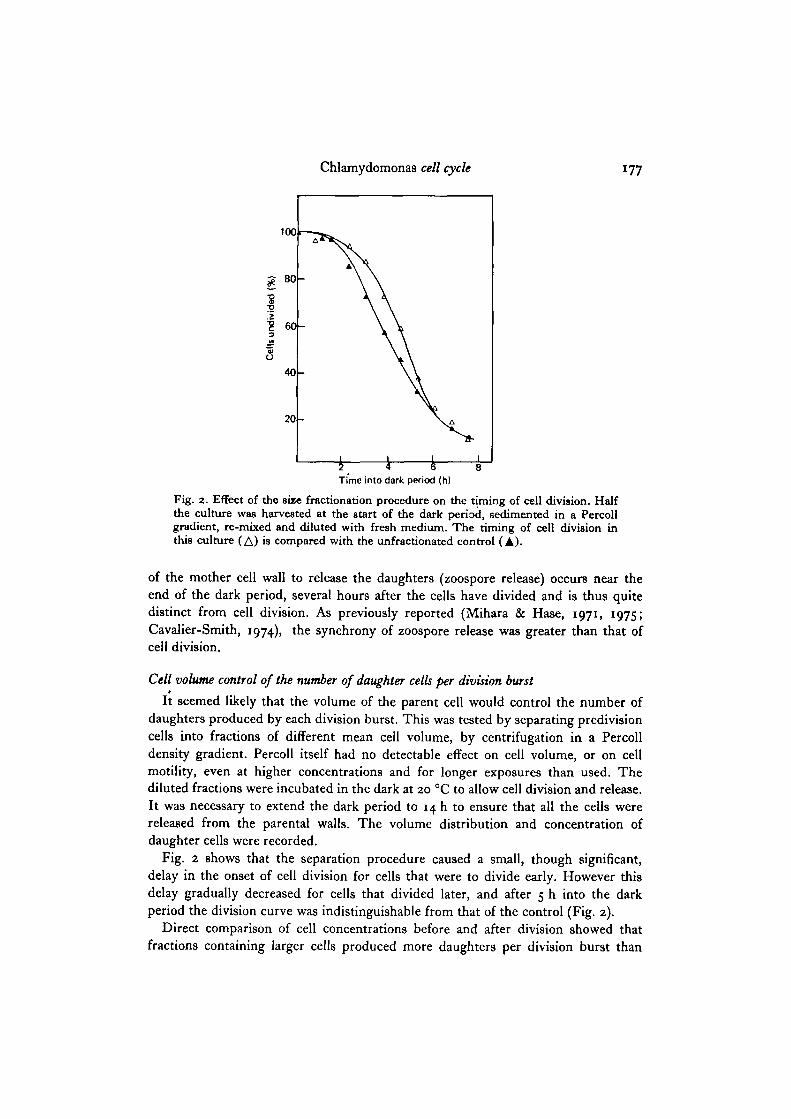
Fig. 2. Effect of the siie fractionation procedure on the timing of cell division. Halfthe culture was harvested at the start of the dark period, sedimented in a Percollgradient, re-mixed and diluted with fresh medium. The riming of cell division inthis culture (A) is compared with the unfractionated control (A).
of the mother cell wall to release the daughters (zoospore release) occurs near theend of the dark period, several hours after the cells have divided and is thus quitedistinct from cell division. As previously reported (Mihara & Hase, 1971, 1975;Cavalier-Smith, 1974), the synchrony of zoospore release was greater than that ofcell division.
Cell volume control of the number of daughter cells per division burst
It seemed likely that the volume of the parent cell would control the number ofdaughters produced by each division burst. This was tested by separating predivisioncells into fractions of different mean cell volume, by centrifugation in a Percolldensity gradient. Percoll itself had no detectable effect on cell volume, or on cellmotility, even at higher concentrations and for longer exposures than used. Thediluted fractions were incubated in the dark at 20 °C to allow cell division and release.It was necessary to extend the dark period to 14 h to ensure that all the cells werereleased from the parental walls. The volume distribution and concentration ofdaughter cells were recorded.
Fig. 2 shows that the separation procedure caused a small, though significant,delay in the onset of cell division for cells that were to divide early. However thisdelay gradually decreased for cells that divided later, and after 5 h into the darkperiod the division curve was indistinguishable from that of the control (Fig. 2).
Direct comparison of cell concentrations before and after division showed thatfractions containing larger cells produced more daughters per division burst than

i 7 8 R. A. Craigie and T. Cavalier-Smith
o
EZ
200 400 600
Cell volume (/im3)
Ez
100 150 200
Cell volume (jim'l
250
Fig. 3. Relation between parent and daughter-cell volume. Parent cells were separatedinto 3 size classes at the start of the dark period: their volume distributions, designatedsmall (V), medium (^) and large (El) are shown in A. The daughter-cell volumedistributions produced by the small (V), medium ((}) and large (13) parent classes areshown in B. Cells were separated by size at the start of the dark period and incubated indarkness for 14 h, by which time all the daughter cells were released. The medianvolume of each fraction was recorded immediately after fractionation (parent cells)and after 14 h incubation in the dark (daughter cells).

Chlamydomonas cell cycle 179
160 180 200 220 240 260
Median parent-cell volume (pm3)
Fig. 4. Relation between parent and daughter-cell volume. The graph, which sum-marizes the pooled results of several experiments as described in the legend to Fig. 3,shows that daughter-cell volume is essentially constant and independent of parent-cellvolume.
those containing smaller cells. In one experiment where the average number ofdaughters produced per parent in the unfractionated culture was 4-4, the meannumbers produced by the various size fractions shown in Fig. 3 were: 5-5 for thelarge cells, 3-4 for the medium ones and 2-6 for the small ones. Fig. 3 shows that themajority of the daughter cells were similar in volume irrespective of whether theywere produced by large, medium or small parent cells, which implies that in multiplefission successive divisions continue until the daughter cells have reached a minimumvolume. However, a small minority of cells may exceptionally fail to divide to yielddaughters of the minimum size as is shown by the trimodal size distribution of thedaughter cells produced by the smallest parent cell size class in Fig. 3B. The smallpeak at the right of this curve is due to a small number of cells remaining undivided.The middle peak results from cells dividing into only 2 daughters, and the largestpeak at the left of the trimodal curve is due to division into 4 daughters. The size ofthe small parental cell class shown in Fig. 3 A was the smallest obtained in theseexperiments, and the only one that showed evidence of some cells not having divided.In all other experiments, the daughter-cell size distributions produced by the smallparent-cell size classes were unimodal, with a shoulder due to some division intoonly 2 daughter cells, i.e. similar to the medium daughter-cell size class in Fig. 3B.The largest parent-cell size category in Fig. 3 A produced some of the smallest daughtercells, because some of them divided into eight.
Fig. 4. shows the pooled results of several such experiments; the median cellvolume of populations fractionated at the start of the dark period is compared withthe median daughter-cell volume produced by each size category. Over the rangestudied there is little or no positive correlation between parent and daughter-cellvolume. This shows that large cells must, on average, produce more daughters perdivision burst than do small cells, and that the number of daughters produced is so

i8o R. A. Craigie and T. Cavalier-Smith
4 6 8Time into dark period (h)
Fig. S
c§ 6E
8£"8 4c&i.
0
int
o oUJI
(-
A- A\- \
\\
\ A
A \\ A
\A \
\
A \\
_ \\
I I I00 300 400 500
80th percsntile (^im3
Fig. 6
Fig. 5. Influence of cell volume on the timing of the ist division of the cell cycle.At the start of the dark period cells were fractionated into 2 sixe classes, havingmedian volumes of aoo/im* (A) and 260/tm1 (#) , respectively, and the timing ofcell division was followed in each by microscopy.Fig. 6. Correlation between cell size at the start of the dark period and the timing ofcell division. Cell division in populations of cells fractionated by size at the start of thedark period was followed by microscopy. In some experiments less that 30 % of thecells in the smallest size classes divided before the onset of zoospore release. Thereforewe used the time into the dark period required for 20 % of the population to divideas a measure of division timing, and the 80th percentile of each volume distribution asa measure of cell size. Results from several experiments are pooled, and clearly showthat larger cells divide earlier.
regulated as to keep the average daughter-cell volume constant irrespective of parental-cell volume.
Large cells divide earlier in the dark period than do small cells
Two independent types of experiment demonstrate this. In the first, we fractionatedcells into size classes at the start of the dark period, and then at intervals during thedark period we determined (by light microscopy) the percentage of cells that hadby then divided at least once. In the experiment shown in Fig. 5 the large cellsdivided about 2-5 h before the small cells. The pooled results from several suchexperiments, summarized in Fig. 6, clearly show a strong negative correlation betweencell volume and the time elapsing before division. The scatter between points is dueto variation between experiments; in each individual experiment the larger volumefraction entered division first. The points in Fig. 6 are not corrected for the effectof the separation procedure slightly delaying division of the cells that divide early

Chlamydomonas cell cycle 181
in the dark period (Fig. 2). If such a correction were made there would be an evenstronger correlation, because this factor will decrease, rather than increase, thecorrelation between cell size and the timing of division.
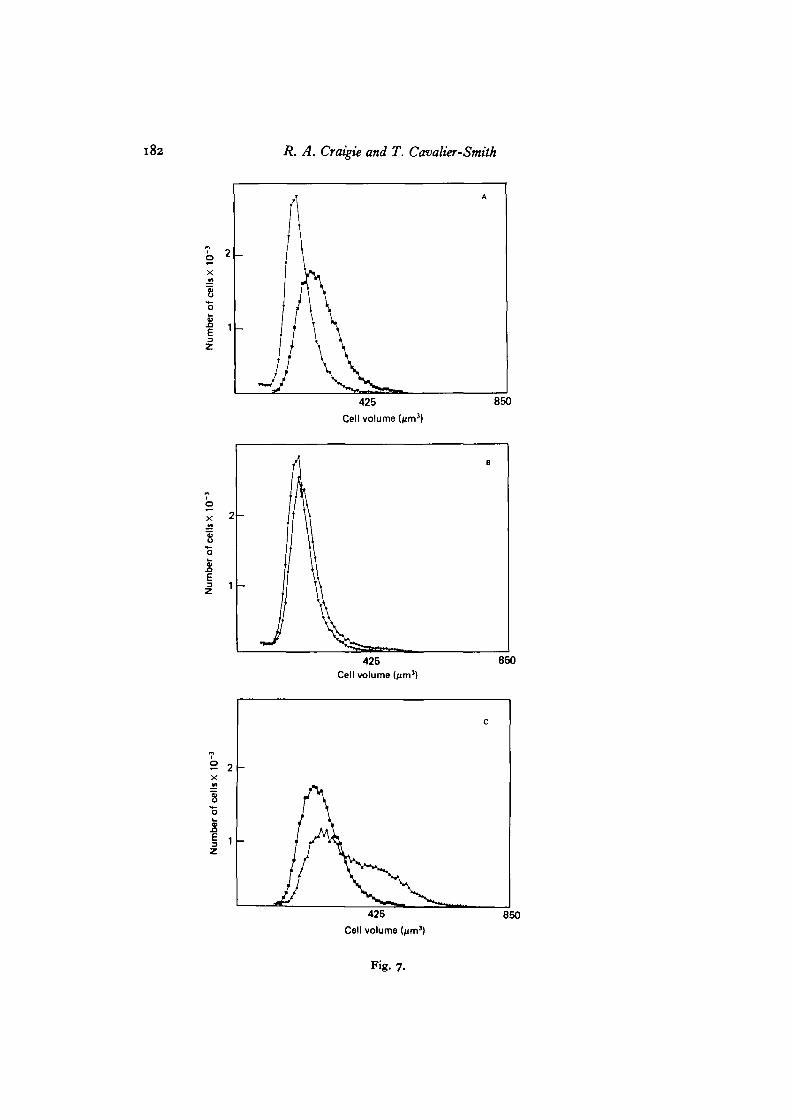
Independent evidence that larger cells divide earlier comes from the divisionkinetics of cells of different volume in unfractionated cell populations. It is possibleto study this directly using the Coulter counter, because we find that Chlamydomonascells, paradoxically, increase in volume when they divide (the decrease in size dis-cussed above occurs only later when daughters are released). This increase in 'cell'volume on division can be demonstrated by fractionating cells according to size at thestart of the dark period and correlating changes in the cell size distribution duringthe dark period with the timing of cell division as determined by microscopy. Fig. 7shows an example where at 4-5 h into the dark period 40% of the large cell fractionhave divided and a corresponding increase in the cell size distribution has occurred,whereas in the small cell fraction where only 5% have divided there is very littleincrease in cell volume. This volume increase, observed at division in all our experi-ments, can be explained by the spaces visible in the microscope between daughtercells. If the total protoplasmic volume remains constant during division, the mothercell wall must clearly expand to accommodate these new intercellular spaces. Sincethe Coulter counter essentially measures the volume of displaced electrolyte, it is notsurprising that it measures the overall volume enclosed by the mother cell wall,including any intercellular spaces.
Cell volume distributions were consistently log-normal during the light period andprior to cell division during the dark period. The cell volume distribution at thestart of the dark period is therefore conveniently represented as a straight line ploton logarithmic probability co-ordinates (Fig. 8). Since cell division is accompanied byan increase in volume, it will alter the cell size distribution. If large cells divide earlier,there should be a deviation from the straight line plot at those times when only partof the population has divided. Fig. 9 shows clearly that large cells divide first, andthat smaller ones divide later in the dark period. Just prior to the onset of zoosporerelease the size distribution is again log-normal with the same slope, except for aslight curvature at the small end of the cell size distribution (Fig. 9), due to some ofthe small cells remaining undivided at this stage of the dark period.
Timing of the second and subsequent divisions
Division curves for the ist, 2nd and 3rd divisions are parallel, with an interval of1-1-5 h between each (Fig. 1 A, B). The timing of 2nd and subsequent divisions, whenthey occur, is therefore determined only by the timing of the ist division.
Effect of shortened and extended final light period on cell division
Though not investigated in detail, the results obtained are summarized in Table 1.As the light period is shortened the timing of division is progressively delayed and theproportion of the population dividing is reduced from near 100% for a 12 h lightperiod to only 3-4% for a 6-5 h light period. Conversely, extending the light periodadvances division and decreases its spread. Fig. 1 B indicates that although extending
182 R. A. Craigie and T. Cavalier-Smith
oXw
84-o
3
425
Cell volume (pirn3)
850
oX
8
425Cell volume (>im3)
850
Ez
425
Cell volume (pm3
850
Fig. 7-

Chlamydomonas cell cycle 183
1200-1 30 50 70
Cumulative % of cells
90 99 999
Fig. 8. Cell volume distribution of an unfractionated population at the start of thedark period. The logarithm of cell volume is plotted agpinst the cumulative percentageof cells of that volume on probability co-ordinates. The resulting straight line indicatesthat the logarithm of cell volume is normally distributed.
the light period advanced the 1st division, there was no detectable difference in thetime interval between the 1st and 2nd, or the 2nd and 3rd divisions compared to thecontrol (Fig. 1 A). There was, however, an increase in the proportion of cells thatdivided to produce 8 daughters. During extended light periods it was not possibleto follow the division curves down to a lower percentage of undivided cells becausezoospore release began before all the cells had divided. We also noticed that innormal 12 h light/12 h dark cycles, when samples were taken near the end of thedark period, light from the Coulter counter optics stimulated zoospore release. Theseobservations confirm earlier reports (Schlosser, 1966) that light directly initiates cellrelease.
DISCUSSION
Our results establish two fundamental features of the multiple-fission cell cycleof C. reinhardii. One is that parental cell volume controls n, the number of divisionsper cell cycle. The other is that the timing of the first division in each cycle is under
Fig. 7. Effect of cell division on the volume enclosed by the parent cell wall. Small( • ) and large (D) volume classes fractionated at the start of the dark period are shownin A. After 4-5 h into the dark period s % of the small fraction and 40 % of the largefraction had divided. The volume distribution of the small fraction at 5 h into thedark period (<^) is shown in B, together with the original volume distribution (V) forcomparison. The volume distribution of the large fraction at this time (A) is shownin c together with the original distribution (Q).

184 R. A. Craigie and T. Cavalier-Smith
o
10 30 50 70
Cumulative % of cells90 999
Fig. 9. Changes in the volume distribution of unfractionated cells during the darkperiod. Cell size distributions are represented after 2% ( • ) , n % ( • ) , 71 % ( • )and 92 % (^ ) division. After 2 % of the cells have divided, the volume distributionis still log-normal. After 11% cell division there is a clear departure from log-normality at the large end of the size distribution, indicating that essentially only thelargest cells have increased their volume as a result of division. As the percentage ofdivided cells increases, the volume increase spreads towards the lower end of the cell,size distribution. After 92 % division ( • ) , the size distribution is again log-normal,except for a slight curvature for the smallest 10 % of the population, because some ofthese cells have still not divided.
Table 1. Effect of the length of the final light period on cell division
Length of final lightperiod (h)
Time from startof light periodfor 20 % cellsdivided once
(h)
Time from startof light periodfor 40 % cellsdivided once
(h) Comments
6-59
12Continuous light
20-25 ±0301475 ±030I37S ±030
4 % divided after 24-5 ± 0-3 h34% divided after 22-0 ±0-3 h
17-5 ±0-3015-5 ±
separate control from that of subsequent divisions: the timing of the first division isstrongly influenced by cell volume as well as by the light regime, whereas the timingof the subsequent divisions appears not to be directly dependent on either of thesefactors but to occur at fixed times after the first division.

Chlamydomonas cell cycle 185
2 4 6Time into dark period (h)
Fig. 10. Comparison of the timing of the 1st cell division during the dark period withthat predicted by a simple critical size model. Assuming a critical volume of 140 /tm*(see text) the cumulative percentage of cells larger than this size was recorded as a func-tion of time into the light period. Assuming a constant interval of 12 h between reachingthe critical size and division itself, there is excellent agreement between the predictedcurve (—) and the experimental curve (A), recorded during the following dark period.
Control of the timing of the first division in each cycle
The correlation we observe between the timing of cell division and cell volumecould only be explained in terms of a purely random commitment to divide (Smith &Martin, 1973, 1974), by postulating that the larger cells that divide early in eachcycle were produced earlier in the preceding dark period than the smaller cells thatdivide later. This possibility is excluded by our finding that parent and daughter-cellvolumes are not in general positively correlated. A simple transition probabilitymodel (Smith & Martin, 1973, 1974) (or any other purely time-dependent model)therefore cannot explain our observations on the Chlamydomonas cell cycle. Inprinciple, the observed correlation between cell volume and the timing of divisioncan be explained by supposing either that cells must attain a critical volume beforethey can enter some phase of the cell cycle, or that the rate of the preparations fordivision itself depends on cell volume.
A very simple model for division control is that commitment to divide occurs whencells reach a critical size, but that division itself takes place later after the elapse of atime interval that is independent of cell volume. This model can be tested by predict-ing the course of cell division during the dark period from changes in the cell volumedistribution during the preceding light period. Since essentially all the cells divideduring each dark period, the critical size must be below that of the smallest cells atthe end of the light period. A lower limit to the critical size is set by the size of the
CEL 54

186 R. A. Craigie and T. Cavalier-Smith
largest cells at the end of the dark period: if any newly produced daughter cells werelarger than the critical size, a secondary division burst should occur before the maindivision period; this was never observed. These two constraints limit the critical sizeto 140+ 20/mi8 under our experimental conditions. Fig. 10 shows that, for a criticalsize of 140 /ira. and a time interval of 12 h between commitment and division, there isexcellent agreement between the predicted and experimental curves for the timingof division in the dark period. The model can also account for our (unpublished)observation that a reduced light intensity results in delayed onset and increasedtemporal spread of cell division. Under these conditions cells grow more slowlyduring the light period, so they take longer to reach the critical volume; the increasedspread of division is accounted for by the reduced rate at which cells reach the criticalsize.
The above model fails, however, to account for the effect of shortening or extendingthe final light period, for it predicts that cells that are larger than the critical sizewhen the light period is truncated will divide at the usual time. Thus the early partof the division curve should be the same as for a 12 h light period, flattening off at apoint determined by the length of the light period. But this is not what we observed.As Table 1 shows, shortening the final light period delays division and increases itsspread; moreover, shortening the light period by only a few hours results in a muchgreater increase in the proportion of cells that remain undivided at the end of thedark period than we predict from the above model. Conversely, extending the lightperiod beyond 12 h (Fig. IB) advances division, also against the prediction of themodel.
The increase in the fraction of undivided cells when the light period is shortenedis in keeping with the observations of Spudich & Sager (1980) on light/dark synchron-ized C. reinhardii cultures: under their experimental conditions progression towardsdivision became independent of light about halfway through the light period. Thistransition to light-independence must be separate from our postulated size threshold,since we find that after a 6-5 h light period essentially no cells divide, even though asubstantial proportion are larger than the small cells that do divide after a 12 h lightperiod. Though the existence of a light requirement for division early in the cell cycle(Spudich & Sager, 1980) explains the reduction in the proportion of cells dividingwhen the light period is truncated, it does not explain the changes in the timing ofdivision caused by alterations in the length of the light period. These changes, however,could be simply explained by supposing that the time interval between a cell's size-dependent commitment to progress towards division and division itself is shortenedby light; since shortening the final light period reduces the amount of light receivedby all cells during this period their division will be delayed. However, the proportionalreduction in light is greater for cells that reach their critical size later in the lightperiod; the delay is therefore greater for cells that divide late during the followingdark period, resulting in an increased spread in the timing of division as we observed.Conversely, extending the light period should advance division and reduce its spread,as is also observed. The most serious objection to this explanation is the good agree-ment between our experimental division curves after a 12 h light period and those

Chlamydomonas cell cycle 187
predicted by assuming a constant time between reaching the critical size and division(Fig. 10). If the length of this period is light-dependent, the predicted curve in Fig. 10should be steeper than the experimental curve. Changing the assumed critical sizewithin the limits explained above does not significantly alter the spread of the predicteddivision curve.
Further work is clearly needed to clarify the relationship between the volume-dependent and light-dependent controls on the Chlamydomonas cell cycle. This shouldmake possible a unified model for the timing of division. Our experiments indicatethat, for autotrophic growth, a complete model must eventually incorporate:
(1) A threshold cell volume as a prerequisite for division.(2) An interval between reaching the threshold volume and division that is influ-
enced by light. (Since extra light causes growth in cell volume, we cannot saywhether this influence is entirely independent of cell volume, or is mediated by meansof an effect of cell volume on the rate of progression towards division after reaching athreshold volume.)
(3) A minimum period or amount of light early in the cell cycle (also shown bySpudich & Sager, 1980).
Since C. reinhardii can grow and divide in the absence of light if supplied withacetate (Jones, 1970), we suggest that the light-dependent effects on the cell cycle canbe explained purely in terms of its role as an energy source. Exactly the same cellcycle controls may therefore operate under both photoautotrophic and heterotrophicconditions, which would not be the case if light is a specific prerequisite for division,independent of its role as an energy source.
Control of the second and subsequent divisions
When C. reinhardii divides into more than 2 daughters, a round of DNA synthesisimmediately precedes each mitosis (Kates, Chiang & Jones, 1968; Jones, 1970),and the second mitosis is usually initiated after the start of the first cytoplasmiccleavage (Jones, 1970; Mihara & Hase, 1971; Osafune, Mihara, Hase & Ohkuro,1972). The parallel curves we obtain for the timing of the first, second and thirddivisions (Fig. 1 A, B) suggest that the timing of the second and subsequent divisionsis determined only by the timing of the first division, with an interval of approxi-mately 1-1-5 h between each. This interval, which is unaffected by light, probablyrepresents a constant time required for DNA replication, nuclear division and cyto-kinesis. Our results show that the number of daughters produced in a division burstis determined by the parent cell volume. However daughter-cell number does notincrease continuously with cell volume: there is instead a sharp doubling in daughter-cell number when parent-cell volume reaches 2n times that of daughter cells (where nis an integer), but no change in number for intermediate values. Extending the lightperiod increases the proportion of cells that divide into 4 and 8 daughters (Fig. IB).Since these large cells divide early in the dark period, the size of the division burst isnot determined until or just prior to division.
We propose that following a division burst, daughter cells enter a state in whichDNA cannot be replicated, and that, in contrast to binary fission cell cycles in which
7-2

188 R. A. Craigie and T. Cavalier-Smith
DNA replication is immediately initiated at a threshold volume (see references in theIntroduction for evidence), nuclear DNA replication in the multiple fission cycle ofChlamydomonas is not initiated until after the elapse of an interval after reaching athreshold volume. Cycles, consisting of S+M phases only, then repeat, in quicksuccession, until daughter-cell volume is below a threshold level. The number ofdaughters produced in a division burst is therefore determined by the amount of cellgrowth during the period between attainment of a threshold volume and the lastdivision of the division burst.
Mechanism and significance of division synchrony
Growth in C. reinhardii cultures under light/dark cycles in minimal medium ceasesduring the dark period. If, as we propose, progression beyond some part of Gjdepends on cells first reaching a critical size, this, together with the possibly volume-independent requirement for a minimum period, or amount, of light before progressiontowards division becomes light-independent (Spudich & Sager, 1980), will result inrepeated dark periods synchronizing cell division. The maximum attainable syn-chrony within each dark period is limited by: (1) the spread in cell size of newlyproduced zoospores; and (2) the rate of, and intercellular variation in, growth duringthe light period. We predict that in minimal medium the degree of synchrony ispositively correlated with the growth rate during the light period, since the proportionof the population passing the critical size per unit time is determined by this. Ourresults suggest that the length of the period between attainment of a critical size anddivision is light-dependent. The proportional difference in the length of this periodfor the first and last cells to reach their threshold volume will also be least at highgrowth rates, since cells will attain this volume earlier during the light period. Divi-sion synchrony should deteriorate if conditions allow newly produced zoospores togrow as soon as they are produced, as observed (Mihara & Hase, 1971).
C. reinhardii can grow in the dark and may be synchronized by light/dark cycles ifsupplied with acetate (Jones, 1970). This is expected provided the growth rate in thelight period is significantly greater than the growth rate of newly produced zoosporesduring the dark period. If light/dark cultures are grown at various light intensitiesand acetate concentrations, we expect poor division synchrony when the ratio betweenthe growth rate in the light and that in the dark is low. Synchrony should improve asthis growth-rate ratio increases.
It seems probable that in C. reinhardii, as in many other multiple fission systems(Cavalier-Smith, 1980), the function of multiple fission is to facilitate the temporalseparation of growth and division. In natural conditions autotrophic growth cannotoccur at night. The period of approximately 12 h between the attainment of a thres-hold size and division, will ensure that division, which interrupts RNA synthesis(Mitchison, 1971), will only occur at night and therefore not retard growth duringthe day.

Chlamydomonas cell cycle
REFERENCES
CASTOR, L. N. (1980). A Gy rate model accounts for cell-cycle kinetics attributed to ' transitionprobability'. Nature, Land. 287, 857-859.
CAVALIKR-SMITH, T. (1974). Basal body and flagellar development during the vegetative cellcycle and the sexual cycle of Chlamydomonas reinhardii. J. Cell Sci. 16, 529-556.
CAVALIER-SMITH, T. (1980). r- and K-tactics in the evolution of protist developmental systems:cell and genome size, phenotype diversifying selection, and cell cycle patterns. BioSystems13, 43-59-
COOPER, S. (1979). A unifying model for the Gx period in prokaryotes and eukaryotes. Nature,Lond. 280, 17-19.
DAVBRN, C. I. (1979). Replication of the prokaryotic chromosome with emphasis on thebacterial chromosome replication in relation to the cell cycle. In Cell Biology: A Comprehen-sive Treatise, vol. 2 (ed. D. M. Prescott & L. Goldstein), pp. 131-169. New York, SanFrancisco, London: Academic Press.
DONACHIE, W. D. (1968). Relationship between cell size and the time of initiation of DNAreplication. Nature, Lond. 219, 1077-1079.
DONACHIE, W. (1974). Cell division in bacteria. In Mechanisms and Regulation of DNA Replica-tion (ed. A. R. Kolber & M. Kohiyama), pp. 431-445. New York: Plenum.
DONACHIE, W. D., JONES, N. C. & TEATHER, R. (1973). The bacterial cell cycle. Symp. Soc. Gen.Microbiol. 23, 9-44.
FANTES, P. A. (1977). Control of cell size and cycle time in ScMzosaccharomyces pombe. J. CellSci. 24, 51-67.
FANTES, P. (1979). Epistatic gene interactions in the control of division in fission yeast. Nature,Lond. 279, 428-430.
FANTES, P. A., GRANT, W. D., PRITCHARD, R. H., SUDBERY, P. E. & WHEALS, A. E. (1975). Theregulation of cell size and the control of mitosis. J. theor. Biol. 50, 213-244.
FANTES, P. & NURSE, P. (1977). Control of cell size at division in fission yeast by a growth-modulated size control over nuclear division. Expl Cell Res. 107, 377-386.
FANTES, P. A. & NURSE, P. (1978). Control of the timing of cell division in fission yeast.Expl Cell Res. 115, 317-329.
FRAZIER, E. A. J. (1973). DNA synthesis following gross alterations of the nucleocytoplasmicratio in the ciliate Stentor coeruleus. Devi Biol. 34, 77-92.
HARTMANN, M. (1928). Ober experimented Unsterblichkeit von Protozoen-individuen. Ersatzder Fortpflanzung von Amoeba proteus durch Fortgesetzte Regenerationen. Zool. J. (Algem.)45. 973-987.
HARVEY, R. J. (1968). Measurement of cell volumes by electronic sensing zone instruments. InMethods in Cell Physiology, vol. 3 (ed. D. M. Prescott), pp. 1-23. New York, London:Academic Press.
HERTWIG, R. (1903). Ueber Korrelation von Zell-und Kerngrfisse und ihre Bedeutung fiir diegeschlechtliche Differenzierung und die Teilung der Zelle. Biol. Zbl. 23, 49-62, 108-119.
HERTWIG, R. (1908). Ober neue Probleme der Zellenlehre. Arch. Zellforsch. 1, 1-32.HOWELL, S. H. (1974). An analysis of cell cycle controls in temperature sensitive mutants of
Chlamydomonas reinhardi. In Cell Cycle Controls (ed. G. M. Padilla, I. L. Cameron & A.Zimmerman), pp. 235-249. New York, London: Academic Press.
HOWELL, S. H., BLASCHKO, W. J. & DREW, C. M. (1975). Inhibitor effects during the cell cyclein Chlamydomonas reinhardtii. J. Cell Biol. 67, 126-135.
HOWELL, S. H. & NALIBOFF, J. A. (1973). Conditional mutants in Chlamydomonas reinhardtiiblocked in the cell cycle. J. Cell Biol. 57, 760-772.
JOHNSTON, G. C, PRINGLE, J. R. & HARTWELL, L. H. (1977). Co-ordination of growth withcell division in the yeast Saccharomyces cerevisiae. Expl Cell. Res. 105, 79—98.
JOHNSTON, G. C, SINGER, R. A., SHARROW, S. O. & SLATER, M. L. (1980). Cell division inthe yeast Saccharomyces cerevisiae growing at different rates. J. gen. Microbiol. 118, 479-484.
JONES, R. F. (1970). Physiological and biochemical aspects of growth and gametogenesis inChlamydomonas reinhardtii. Ann. N. Y. Acad. Sci. 175, 648—659.
KATES, J. R., CHIANG, K. S. & JONES, R. F. (1968). Studies on DNA replication duringsynchronized vegetative growth and gametic differentiation in Chlamydomonas reinhardtii.Expl Cell Res. 49, 121-135.

190 R. A. Craigie and T. Cavalier-Smith
LEWIN, R. A. (ed.) (1976). The Genetics of Algae. Oxford, London, Edinburgh, Melbourne:Blackwell Scientific Publications.
LIEN, T. & KNUTSEN, G. (1979). Synchronous growth of Chlamydomonas reinttardtii (Chloro-phyceae): a review of optimal conditions. ,7. Phycol. 15, 191-200.
LORINCZ, A. & CARTER, B. L. A. (1979). Control of cell size at bud initiation in Saccharomycescerevisiae. J. gen. Microbiol. 113, 287-295.
MAAL0E, O. & KJELDGAARD, N. O. (1966). Control of macromolecular tynthesis. New York:Benjamin.
MCCULLOUGH, W. & JOHN, P. C. L. (1972). A temporal control of the de novo synthesis ofisocitrate lyase during the cell cycle of the eucaryote Chlorella pyrenoidosa. Biochim. biophys.Acta 269, 287-296.
MIHARA, S. & HASE, E. (1971). Studies on the vegetative life cycle of Chlamydomonas reinhardiDangeard in synchronous culture. I. Some characteristics of the cell cycle. PI. Cell Physiol. 12,225-236.
MIHARA, S. & HASE, E. (1975). Studies on the vegetative life cycle of Chlamydomonas reinhardiDangeard in synchronous culture. III. Some notes on the process of zoospore liberation.PI. Cell Physiol. 16, 371-375.
MINOR, P. D. & SMITH, J. A. (1974). Explanation of degree of correlation of sibling generationtimes in animal cells. Nature, Lond. 248, 241-243.
MITCHISON, J. M. (1971). The Biology of the Cell Cycle. Cambridge University Press.MiTCHisoN, J. M. (1977). The timing of cell cycle events. In Mitosis: Facts and Questions (ed.
M. Little, N. Paweletz, C. Petzelt, H. Ponstingl, D. Schroeter & H.-P. Zimmermann),pp. 1-13. Berlin, Heidelberg, New York: Springer-Verlag.
NURSE, P. (1975). Genetic control of cell size at cell division in yeast. Nature, Lond. 256,547-551-
NURSE, P. (1980). Cell cycle control - both deterministic and probabilistic? Nature, Lond. 286,9-10.
NURSE, P. & FANTES, P. (1977). Transition probability and cell cycle initiation in yeast. NatureLond. 267, 647.
NURSE, P. & MITCHISON, J. M. (1980). Tip growth during the cell cycle of Schizosaccharomycespombe. Soc. gen. Microbiol. Q. 8, 28.
OSAFUNE, T., MIHARA, S., HASE, E. & OHKURO, I. (1972). Electron microscope studies on thevegetative cellular life cycle of Chlamydomonas reinhardi Dangeard in synchronous culture. I.Some characteristics of changes in subcellular structures during the cell cycle, especially information of giant mitochondria. PI. Cell Physiol. 13, 211-227.
PRESCOTT, D. M. (1956). Relation between cell growth and cell division. II. The effect of cellsize on growth rate and generation time in Amoeba proteus. III. Changes in nuclear volumeand growth rate and prevention of cell division in Amoeba proteus resulting from cytoplasmicamputations. Expl Cell Res. 11, 86-98.
SCHLOSSER, V. (1966). Enzymatisch gesteuerte Freisetzung von Zoosporen bei Chlamydomonasreinhardi Dangeard in Synchronkultur. Arch. Mikrobiol. 54, 129-159.
SHIELDS, R. (1978). Further evidence for a random transition in the cell cycle. Nature, Lond.273, 755-758.
SHIELDS, R., BROOKS, R. F., RIDDLE, P. N., CAPELLARO, D. F. & DELIA, D. (1978). Cell size,cell cycle and transition probability in mouse fibroblasts. Cell 15, 469-474.
SHIELDS, R. & SMITH, J. A. (1977). Cells regulate their proliferation through alterations intransition probability. .7. cell. Physiol. 91, 345-356.
SMITH, J. A. & MARTIN, L. (1973). Do cells cycle? Proc. natn. Acad. Sci. U.S.A. 70, 1263-1267.
SMITH, J. A. & MARTIN, L. (1974). Regulation of cell proliferation. In Cell Cycle Controls(ed. G. M. Padilla, I. L. Cameron, & A. Zimmerman), pp. 43-60. New York, London:Academic Press.
SPUDICH, J. L. & SAGER, R. (1980). Regulation of the Chlamydomonas cell cycle by light anddark.J. CellBiol. 85, 136-145.
SUDBERY, P. E. & GRANT, W. D. (1975). The control of mitosis in Physarum polycephalum.The effect of lowering the DNA: mass ratio by UV irradiation. Expl Cell. Res. 95, 405-415.
SUDBERY, P. E. & GRANT, W. D. (1976). The control of mitosis in Physarum polycephalum:

Chlamydomonas cell cycle 191
the effect of delaying mitosis and evidence for the operation of the control mechanism in theabsence of growth. J. Cell Set. 23, 59-65.
THUHIAUX, P., NURSE, P. & CARTER, B. (1978). Mutants altered in the control co-ordinatingcell division with cell growth in the fission yeast Schisosaccharomyces pombe. Molec. gen.Genet. 161, 215-220.
WANKA, F. (1965). The use of colchicine in investigation of the life cycle of Chlorella. Arch.Mikrobiol. 52, 305-318.
WARR, J. R. & QUINN, D. (1977). Low molecular weight sulphydryl compounds and theexpression of a cell division mutant of Chlamydomonai reinhardi. Expl Cell Res. 104, 442-445.
WHEALS, A. E. (1977). Transition probability and cell cycle initiation in yeast. Nature, Land.367, 647.
WHEALS, A. E. (1980). Sloppy size control of the Saccharomyces cerevisiae cell cycle. Soc. gen.Microbiol. Q. 8, 28.
(Received 24 July 1981)