Embed Size (px)
Citation preview

The potential of cellular network infrastructure
as a futuristic system for monitoring fog is introduced.
CELLULAR NETWORK INFRASTRUCTUREThe Future of Fog Monitoring?
by Noam DaviD, omry SeNDik, Hagit meSSer, aND PiNHaS alPert
AFFILIATIONS: DaviD aND alPert—Department of Geosci-ences, Tel Aviv University, Tel Aviv, Israel; SeNDik aND meSSer—School of Electrical Engineering, Tel Aviv University, Tel Aviv, IsraelCORRESPONDING AUTHOR: Dr. Noam David, Dept. of Geosciences, Tel Aviv University, P.O. Box 39040, Tel Aviv 6997801, IsraelE-mail: [email protected]
The abstract for this article can be found in this issue, following the table of contents.DOI:10.1175/BAMS-D-13-00292.1
In final form 3 December 2014©2015 American Meteorological Society
T he Glossary of Meteorology (Glickman 2000) defines fog as water droplets suspended in the atmosphere near Earth’s surface that reduce vis-
ibility to less than 1 km. The intensity of fog can be characterized by its liquid water content (LWC) and its droplet number concentration ND or by the visibility existing in the area observed during the occurrence of the phenomenon. According to the World Meteo-rological Organization (WMO) visibility is defined as the greatest distance in a given direction at which a prominent black object can be seen and identified against the sky at the horizon in daylight, or the great-est distance it could be seen and recognized at night if the general illumination were raised to the level of
normal daylight (WMO 2008). Visibility is related to both the LWC and droplet number in a given volume of air. In warm fog conditions (T > 0°C), and a given LWC, an increase in ND results in decreased visibility. An increase in LWC results in decreased visibility as well. Additionally, prior field research found that LWC increases with increasing ND (Gultepe et al. 2009). This being the case, visibility parameteriza-tions for warm fog conditions should include both LWC and ND (Meyer et al. 1980; Gultepe and Isaac 2004; Gultepe et al. 2006). Details on particle spectra, chemical composition, definitions, and visibility issues in warm and cold fog conditions can be found in the literature (Klemm et al. 2005; Herckes et al. 2007; Gultepe et al. 2009, 2014). Severe visibility limitations associated with the phenomenon of fog may result in acute transportation accidents, substantial property losses, and human casualties. The total economic damage caused by the impact of fog on the different transportation modes in air, at sea, and on land can be reasonably compared with that of winter storms (Gultepe et al. 2009). Thus, reliable fog monitoring fa-cilities are of extreme importance. Nevertheless, cur-rent observation techniques may suffer from obstacles in providing a sufficient response to coping with this hazard on a worldwide scale. Currently, predominant monitoring means include satellites, visibility sensors, transmissometers, and human-based observations. Satellite systems are most advantageous due to their
1687OCTOBER 2015AMERICAN METEOROLOGICAL SOCIETY |

high spatial coverage. Their observations, however, may suffer from difficulties in measuring near-surface levels of fog, for example, as a result of middle- or high-altitude clouds that obscure the ground-level fog from the satellite’s vantage point (Gultepe et al. 2007a). Visibility sensors provide estimates based on the principle of forward scattering of visual light. These instruments, being relatively small in dimen-sion, only acquire small, localized air samples and may, therefore, provide observations that may not be representative of the total areal fog patch. Thus, the point measurements obtained by these instruments should be used cautiously for larger area coverage (Gultepe et al. 2007b). Transmissometers, composed of a transmitting and a receiving unit, typically located several tens of meters apart from each other, measure both the scattering and the absorption coefficients of light and can therefore provide accurate observations. However, their implementation and maintenance costs are extremely high. Consequently, these tools are characteristically deployed only in specific locations of interest such as airports. Human observers can identify fog and estimate the visibility based on the ap-pearance and obstruction of objects that are located at known distances. However, this way of observation is not only “not automatic” but also subjective as a result of its psychophysical nature, as one human’s eye may assess the visibility differently than another’s.
On the other hand, David et al. (2013b) have recently shown that commercial microwave links (MLs), which form the infrastructure of cellular com-munication networks, can provide crucial informa-tion concerning the appearance of dense fog and its intensity. Cellular network infrastructure is widely spread over the terrain at ground-level altitudes. As these commercial networks operate at frequencies of tens of gigahertz, they are highly sensitive to the effects of weather phenomena and can be considered as built-in facilities for atmospheric monitoring, as was first demonstrated for rain-rate observations by Messer et al. (2006) and Leijnse et al. (2007). Since that point, rainfall monitoring using commercial MLs has been extensively studied (Zinevich et al. 2008, 2009, 2010; Chwala et al. 2012; Wang et al. 2012; Doumounia et al. 2014). Notably, the received signal level (RSL) measurements of these networks are routinely logged by many of the communication providers and can therefore be utilized for measuring fog. The costs of using the presented technology are particularly low, as opposed to complete installation and positioning of specialized dedicated instru-ments, since the cellular network infrastructure is already deployed in the field. At present, commercial
microwave systems typically operate at frequencies between around 6 and 40 GHz. As such, the already existing links can, for the most part, observe only rel-atively heavy fog when its intensity (LWC, ND) is high enough to be sensed by the given system. Modern mobile radio networks have an increasing need for high data rates and wide bandwidth; however, in most current networks, capacity expansion through coding and higher bandwidth have been maximized, and no further increase can be achieved through these means. To overcome this, higher frequencies are being implemented as a solution for network ac-cess expansion. Radio links in bands as high as, for example, 81–86 GHz are already being implemented to fulfill these increased bandwidth requirements [for further reading, see Csurgai-Horváth and Bitó (2010) and Harsryd and Edstam (2011)]. These frequency bands are highly sensitive to the effects of fog and can potentially provide, for the first time, the opportunity to monitor typical fog intensities on a wide scale, at high resolution and low costs.
This work presents a theoretical comparison of the sensitivity of commercial microwave systems in detecting fog, when operating at the typical current operating frequencies, 20 and 38 GHz, versus the 80-GHz range, a frequency range that is being increasing-ly deployed. Real-data measurements of commercial MLs operating in the 38-GHz band are also presented to demonstrate the potential applicability of the tech-nique in reality. The aim of this paper is, therefore, to examine and quantify the expected improvement in the potential of cellular network infrastructure as an opportunistic system to monitor fog.
SCIENTIFIC BACKGROUND. The attenuation effects of fog on microwave channels (dB km−1) are well known and can be described by the following relation:
, (1)
where γF is the fog-induced attenuation, a function of the LWC (g m−3) and the expression κ (dB km−1) (g m−3)−1, which is dependent on the temperature T (K) and the link frequency f (GHz). [For further reading concerning the detailed functions comprising κ, refer to International Telecommunication Union (2013).] Figure 1, which is based on Eq. (1), describes the attenuation as a function of microwave frequencies induced by fog at typical liquid water contents, rang-ing between 0.01 and 0.4 g m−3 (Gultepe et al. 2007b). Notably, the fog-induced attenuation increases with increasing frequency.
1688 OCTOBER 2015|

Previous studies, including, for instance, Kunkel (1984) and Klemm et al. (2005), have shown a high correlation between the LWC of fog and visibility. Thus, given the fog LWC, an estimation of the visibility can be derived (and vice versa). Additional studies have shown the dependency of visibility (in addition to its dependency on the LWC) on the microphysical characteristics of the fog, particularly on the droplet number per cubic volume ND (cm−3). The following parameterization scheme, developed by Gultepe et al. (2006) for warm fog conditions (T > 0°C), can be used in order to obtain a rough visibility estimation (Vis; km) given LWC and ND:
. (2)
The uncertainty in estimating visibility using this parameterization scheme [Eq. (2)] was found to be approximately 29% under the assumption that in the case of visibility, fractional uncertainty is the sum of
the fractional uncertainties in LWC and the parameter ND, which in this case were 15% and 30%, respectively.
Based on the RSL acquired by the microwave system, γF can be derived and, thus, using Eq. (1), the LWC of the fog. As a result, given ND, a rough estima-tion of the visibility can be obtained using Eq. (2). Preferably, ND can be measured directly using special-ized equipment or estimated based on previous obser-vations conducted, for example. This parameter may also be obtained as a function of temperature when saturation occurs but nucleation processes cannot be ignored (Gultepe and Isaac 2004).
In this work the LWC levels were calculated using theoretical simulations and the value of the param-eter ND taken from the literature and substituted as a constant in Eq. (2) (Gultepe and Isaac 2004; Gultepe et al. 2006, 2007b). Consequently, the visibility esti-mations were acquired without testing their accuracy directly (a task that is beyond the scope of this paper). Thus, the visibility estimate derived is used only as an order-of-magnitude guide.
Fig. 1. Transmission loss per 1 km at frequencies of up to 100 GHz due to fog at typical LWCs [Eq. (1); International Telecommunication Union (2013)]. The horizontal dashed line, along the 0.1-dB level, signifies a typical magnitude resolution (digital quantization error) of com-mercial MLs and specifically the one used during the current study. The yellow bars indicate traditional microwave frequency ranges commonly used today, while blue denotes available frequency bands being implemented more commonly worldwide in order to fulfill increased bandwidth needs.
1689OCTOBER 2015AMERICAN METEOROLOGICAL SOCIETY |

TWO-DIMENSIONAL SIMULATION TOOL: CALCULATING THE MINIMUM DETECT-ABLE LWC USING MEASUREMENTS FROM MULTIPLE MLS. A simulation study has been carried out in order to quantify the minimum detectable LWC that can be sensed using a given set of existing MLs deployed across Israel by one cellular provider. The algorithm employed generates a two-dimensional map of the minimum detectable LWC based on the network’s given characteristics, that is, the link locations, lengths, frequencies, and their RSL quantization resolution.
To determine the effective detection threshold for each link, it is assumed that the minimal fog-induced attenuation can be sensed whenever the signal loss caused is equal to the quantization interval ∆q (dB), divided by the length of the intersection between the fog patch and the link L (km). The minimum detectable liquid water content, LWCMIN (g m−3), can therefore be calculated as follows:
. (3)
Notably, at a given frequency and temperature, the longer L is, the longer the distance that ∆q is divided over, and as a result the effective sensitivity for unit of distance is better, under the assumption made here that the fog is homogenous along L. Surface conditions—the properties and current state of the soil, vegetation, or urban layout in the case of fog over land, and the state of the surface of the sea for marine fog—strongly influence the formation of fog, its evolution, and its spatial pattern. The effect of the surface on the fog can be direct, such as in cases where it influences wind profiles, local circulations, temperature, or humidity, or it may be indirect, such as in cases when it modifies the radiative properties of the atmosphere through microphysical processes (Gultepe et al. 2007b). Here, the spatial shape of the fog patch, its rotation angle and dimension, can be modeled according to the user’s definition. It was chosen to model the fog patch as a generalized el-lipse of an area of about 15 km2 (e.g., Pagowski et al. 2004), which was inserted into the test site with its major axis oriented north–south. The fog’s modeled patch was swept across the area of the whole map we wished to create. Then, for each point on the map, the intersection between the link and the fog was derived. Clearly, only the part of the link path that actually intersects with the fog assists in sensing it. If the length of a given intersection between a link and a fog profile was greater than zero, then Eq. (3) was
used to determine the minimum detectable LWC. In cases when a group of MLs deployed over the same location was covered by the same fog patch, the al-gorithm chose the longest link within the group (i.e., the most sensitive link per unit of distance) in order to derive the minimum detectable value of LWC for that specific domain.
SIMULATION RESULTS. The threshold fog LWC values calculated using the algorithm described above were compared for three different cases. The first simulation was run using a real, already existing, set of MLs operating in a frequency range of around 38 GHz. During the second simulation study, the performance of the same set of links was tested while a simulated frequency of 20 GHz was chosen for the whole set of links. In the third simulation the algorithm was run using a simulated frequency of 80 GHz, illustrating a future network designed to fulfill the increasing demands of network access expansion. During each of the three simulations the algorithm was applied on a set of 696 links, deployed over an area of about 14,000 km2, with a quantization of 0.1 dB each, as illustrated in Fig. 2a. The areal temperature was taken to be 10°C. The sensitivity maps in Figs. 2b–d present the minimum detectable LWCs, which were derived by applying the same algorithm on the set of links depicted in Fig. 2a at a simulated frequency of 20 GHz (Fig. 2b), at the original existing frequency around 38 GHz (Fig. 2c) and a simulated frequency of 80 GHz (Fig. 2d).
Under the same link deployment (illustrated in Fig. 2a), Fig. 3 presents the spatial coverage of fog that can be obtained using each of the three frequency ranges discussed here, at LWCs of 0.01, 0.05, and 0.1 (g m−3). In accordance with the increase in the ability to sense lighter fog, as depicted in the sensitivity maps (Figs. 2b–d), the number of links capable of detect-ing the phenomenon is getting larger with increasing frequency. As theoretically expected (International Telecommunication Union 2013) given a certain LWC and temperature, the sensitivity of the simulated 80-GHz links improves on the sensitivity of the 38- and 20-GHz links by a factor of approximately 3.5 and 10, accordingly. As a result, the spatial coverage that can be achieved increases, as shown in Fig. 3. Specifically, it can be seen from Fig. 3 that fog detection at the 80-GHz frequency range was good for all three LWC val-ues tested, while at the 38-GHz frequency detection was good at LWC values of 0.1 and 0.05 (g m−3), and in the 20-GHz case, fog detection is hardly possible.
Rough visibility estimates were derived using Eq. (2) (Gultepe et al. 2006, 2009) based on the
1690 OCTOBER 2015|

minimum detectable LWC values that were calcu-lated according to the sensitivity of the system at each geographic location (as presented in Figs. 2b–d). These estimates denote a rough threshold value of visibility below which the microwave network can sense fog for each one of the three frequency ranges demonstrated here. For this calculation we used the fixed value of ND = 150 cm−3 (Gultepe and Isaac 2004; Gultepe et al. 2006, 2009). Two visibility threshold values were derived for each of the given three operat-ing frequencies. The first is an upper visibility value that was calculated based on the system of the longest links deployed in a certain region, where the system is the most sensitive per unit of distance [according to Eq. (3)]. The second threshold value (which is lower) derived for the same operating frequency was calculated for a different area where the link system is the least sensitive per unit of distance (because in that particular area, the links are of shorter lengths). The visibility threshold estimates derived were found to be in the range from 750 (in the case of the most sensitive MLs) down to 100 m (in the case of the less sensitive ones), at 80 GHz. At 38 GHz, the rough vis-ibility threshold estimates derived were 500 and 50 m, respectively. Of the 20-GHz links, the most sensitive ones were capable of sensing only relatively heavy fog, where the estimated visibility is 150–200 m and less.
Since at this frequency range (20 GHz) the system is relatively insensitive to the effects of fog, in several cases, the minimum detectable LWC values that were calculated exceeded the range of physical values for fog (see Fig. 2b).
REAL-DATA SPATIAL MEASUREMENTS OF FOG FROM COMMERCIAL MICROWAVE NETWORKS. This section presents real-data mea-surements, taken in the field, from tens of commercial MLs, operating in the 38-GHz band, during heavy fog, demonstrating the potential applicability of the technology. The demonstration uses data from an event, presented in David et al. (2013b), that took place from the late evening hours of 9 December 2005 to the morning hours of the following day. The extreme fog event caused major disruptions to schedules at the Ben Gurion International Airport in Israel, as well as flight cancellations, because of the poor visibility. Figure 4a presents an Meteosat Second Generation (MSG) image produced by the Clouds–Aerosols–Precipitation Sat-ellite Analysis Tool (CAPSAT; Lensky and Rosenfeld 2008) for the night of the event, around 0130 UTC, the time we will focus on here. The image shows the massive spatial dimensions of the fog, indicated by a white shadow, covering hundreds of square kilometers from the Sinai Peninsula in Egypt to the southern and
Fig. 2. Simulation results: sensitivity. (a) A set of 696 links deployed by one cellular provider in Israel (updated to Mar 2014). The MLs are deployed at altitudes between 5 and 200 m above the surface with lengths ranging from 40 m up to 4.1 km. One may notice the high variation in link density across the country. The urban area of the city of Tel Aviv (central Israel) is characterized by a dense distribution of links as compared to the rural part of the country (e.g., southern Israel), which has a less dense distribution. (b) The minimal LWC values that can be detected by the given set of MLs as calculated given a simulated frequency of 20 GHz. The colored shadows il-lustrate the LWC threshold values according to the scale to the right of the figure. In several cases, the sensitivity threshold values that were calculated for this frequency range (20 GHz) exceeded the range of physical values for fog LWC and are indicated in this figure with the dark red–brown color that appears at the top region of the LWC scale. (c) The minimal LWC values that can be detected by the microwave network, calculated given a frequency range of around 38 GHz, which is the actual link frequency of the set as deployed by the cellular provider. (d) The minimal LWC values that can be detected as calculated using a simulated frequency of 80 GHz.
1691OCTOBER 2015AMERICAN METEOROLOGICAL SOCIETY |
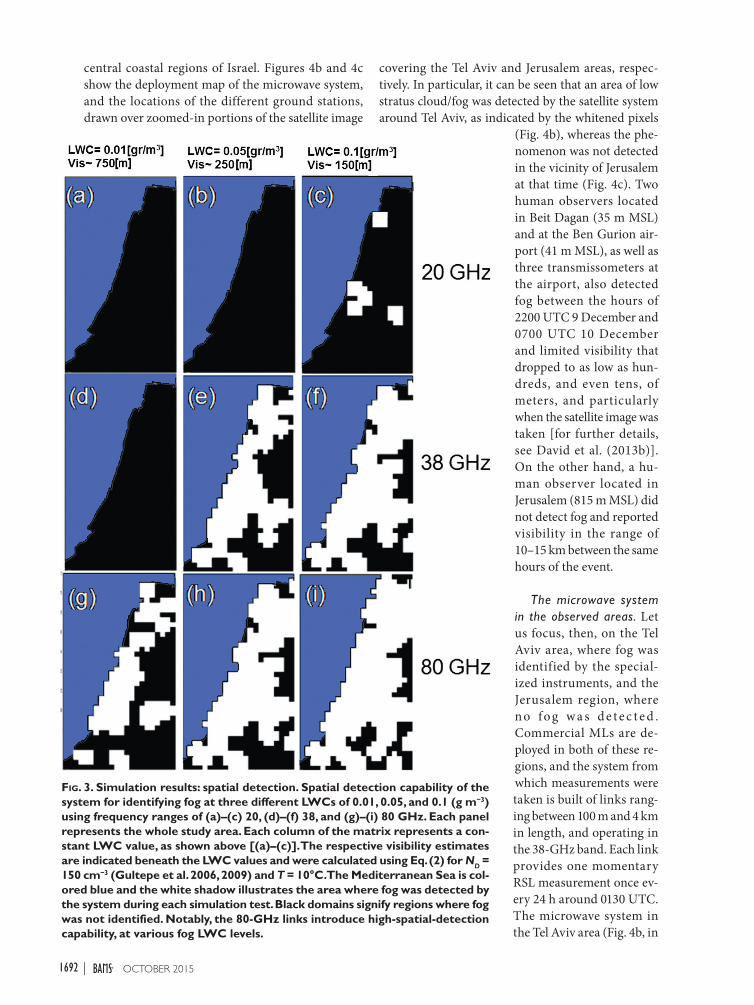
Fig. 3. Simulation results: spatial detection. Spatial detection capability of the system for identifying fog at three different LWCs of 0.01, 0.05, and 0.1 (g m−3) using frequency ranges of (a)–(c) 20, (d)–(f) 38, and (g)–(i) 80 GHz. Each panel represents the whole study area. Each column of the matrix represents a con-stant LWC value, as shown above [(a)–(c)]. The respective visibility estimates are indicated beneath the LWC values and were calculated using Eq. (2) for ND = 150 cm−3 (Gultepe et al. 2006, 2009) and T = 10°C. The Mediterranean Sea is col-ored blue and the white shadow illustrates the area where fog was detected by the system during each simulation test. Black domains signify regions where fog was not identified. Notably, the 80-GHz links introduce high-spatial-detection capability, at various fog LWC levels.
central coastal regions of Israel. Figures 4b and 4c show the deployment map of the microwave system, and the locations of the different ground stations, drawn over zoomed-in portions of the satellite image
covering the Tel Aviv and Jerusalem areas, respec-tively. In particular, it can be seen that an area of low stratus cloud/fog was detected by the satellite system around Tel Aviv, as indicated by the whitened pixels
(Fig. 4b), whereas the phe-nomenon was not detected in the vicinity of Jerusalem at that time (Fig. 4c). Two human observers located in Beit Dagan (35 m MSL) and at the Ben Gurion air-port (41 m MSL), as well as three transmissometers at the airport, also detected fog between the hours of 2200 UTC 9 December and 0700 UTC 10 December and limited visibility that dropped to as low as hun-dreds, and even tens, of meters, and particularly when the satellite image was taken [for further details, see David et al. (2013b)]. On the other hand, a hu-man observer located in Jerusalem (815 m MSL) did not detect fog and reported visibility in the range of 10–15 km between the same hours of the event.
The microwave system in the observed areas. Let us focus, then, on the Tel Aviv area, where fog was identified by the special-ized instruments, and the Jerusalem region, where no fo g w a s d e t e c t e d . Commercial MLs are de-ployed in both of these re-gions, and the system from which measurements were taken is built of links rang-ing between 100 m and 4 km in length, and operating in the 38-GHz band. Each link provides one momentary RSL measurement once ev-ery 24 h around 0130 UTC. The microwave system in the Tel Aviv area (Fig. 4b, in
1692 OCTOBER 2015|

green) has 88 links deployed over 46 paths, while the Jerusalem system (Fig. 4c, in black) consists of 36 links over 19 paths (multiple links can operate over the same path by using separate frequencies or polarizations).
Results. Figure 5 shows the attenuation measure-ments from the links as a function of their length D (km) as taken in the areas around Tel Aviv (Fig. 5, left, in green) and Jerusalem (Fig. 5, right, in black). Each point in the figures indicates a single measure-ment received by each of the links around 0130 UTC 10 December 2005.
To calculate the attenuation on each link, a baseline reference signal level has to be set and attenuation derived with respect to it. For each link, this refer-ence point was chosen to be the median of the RSL measurements from the link during that month. The equations in each panel in Fig. 5 describe the calculated linear approximations. The slope of the measurement graph from the foggy region, as well as
the y-axis intercept, can be seen to be larger than the equivalent values for the nonfoggy region (where both parameters tend to zero approximately). The differ-ences in slope are the result of attenuation increasing with link length in the case where the microwave signals interacted with the foggy medium (Tel Aviv area), while in the area where the phenomenon did not exist (Jerusalem), attenuation did not increase with link length. During fog, relative humidity (RH) is exceptionally high, and as a result, a thin layer of water can condense directly on the microwave an-tennas, increasing the attenuation measured by the system. The y-axis intercept of the graphs represents here an imaginary infinitesimal distance between the microwave antennas. The value calculated for this parameter based on the system measurements in the foggy area indicates that this wet-antenna phenomenon occurred (Henning and Stanton 1996; Harel et al. 2015). This being the case, calculating these two parameters (slope, y-axis intercept) by
Fig. 4. Regional satellite image and locations of the specialized measuring instruments and MLs. (a) MSG image of the observed region taken at 0127 UTC and presented as a “night microphysi-cal” color scheme using CAPSAT (Lensky and Rosenfeld 2008). The fog is indicated as a white shadow. (b) A magnified satellite image of the Tel Aviv area with a map of the commercial MLs deployed in the region (green lines) and the locations of the different ground stations. (c) A microwave link map (black lines) overlaid on a magnified satellite image of the Jerusalem area. The whitened pixels in (b) indicate detection of fog/low stratus cloud in that area by the satellite system as opposed to the Jerusalem area, where the phenomenon was not detected.
1693OCTOBER 2015AMERICAN METEOROLOGICAL SOCIETY |

using system measurements allows for the detection of cases of fog, as shown in David et al. (2013b), while also using meteorological side information, including humidity gauges for detecting conditions of high rela-tive humidity (RH > 95%) and offsetting its effects on the system (International Telecommunication Union 2005) and rain gauges or other techniques to rule out different forms of precipitation (rain, hail, etc.) that also affect received signal levels in the network. Additionally, the ability to derive a rough estimation for visibility from the slopes of the measurement graphs in the fog-affected area was shown [using Eqs. (1) and (2), given the areal temperature]. In the case presented here, it was found to be in the range between 30 and 70 m and matched the measurements of human observers and the specialized equipment in the area in order of magnitude. For further reading describing the method in detail, the uncertainty calculations, further examples of microwave measurements, etc., the reader is kindly referred to David et al. (2013b).
The microwave system that provided the real mea-surements shown here stores data once every 24 h. It is important to note that there are systems that routinely store measurements in higher temporal resolutions, for example, every 1 or every 15 min (e.g., Rayitsfeld et al. 2012; Liberman et al. 2014). The measurements presented here are from the microwave data that were available from this fog event.
In this section, two specific subregions were examined using real data, out of the entire area investigated theoretically through simulation (in "Two-dimensional simulation tool: Calculating the minimum detectable LWC using measurements from multiple MLs" and "Simulation results"). A future chal-lenge is, therefore, to further investigate the potential
applicability in all areas where the network is deployed, over wide regions, for a large number of events, while comparing the results to ground-truth measurements, with the goal of testing the ability to spatially map the phenomena using current and future frequency bands.
DISCUSSION. At frequencies of tens of gigahertz, rainfall has a predominant effect on the microwave channel compared to those induced by other hydro-meteors such as water vapor and fog. Thus, commer-cial MLs have been shown to be particularly useful for rainfall monitoring (Rayitsfeld et al. 2012; David et al. 2013a; Sendik and Messer 2015). A preliminary study, by David et al. (2013b), showed the feasibility of monitoring dense fog (with LWCs in the range 0.5–0.8 g m−3) using multiple commercial MLs oper-ating around the 38-GHz frequency range. The real measurements presented here also demonstrate the potential for identifying or ruling out the occurrence of the phenomena in space, in different regions.
The results of the simulation point to the potential for great improvement in the capabilities of future mi-crowave systems to detect lighter fog, including cases in the typical LWC range for fog (LWC < 0.4 g m−3; Gultepe et al. 2007b, 2009)], as a result of theoretically expected attenuation effects when moving to higher frequencies.
Certain previous research has shown that the LWC can vary widely with altitude and in some cases grow by up to an order of magnitude above the values that exist near the surface (Pinnick et al. 1978; Kunkel 1984; Fuzzi et al. 1992). However, further research on this topic is required (Klein and Dabas 2014). On the other hand, commercial microwave systems are deployed at elevations of between several meters and up to tens or
Fig. 5. ML observations. Attenuation measurements as a function of link length taken by the microwave systems deployed in the areas around (left) Tel Aviv and (right) Jerusalem. According to the measurements of the me-teorological stations in the observed areas, no precipitation (rain, hail, etc.) that may have affected microwave system measurements fell during the event. Between 0120 and 0140 UTC, the RH was found to be in the range of 97%–100% in the Tel Aviv area and 33% in the Jerusalem area. The Pearson correlation coefficient between the attenuation measurements and the propagation pathlengths in Tel Aviv area (left) was found to be r = 0.6 with a p value < 0.01 (Neter et al. 1996, 640–645). System magnitude resolution is 0.1 dB.
1694 OCTOBER 2015|

hundreds of meters above ground level. In practice, microwave units are installed on masts, buildings, tow-ers, and in some cases on hills and mountains (Chwala et al. 2012; David et al. 2013a). Thus, the system can provide measurements from a range of elevations. Measurement effectiveness can suffer, though, in cases where the microwave propagation path is, for example, above the fog layer, particularly since this phenomenon is often created in low-lying areas. The transition to higher frequencies provides a solution for network access expansion, a need that is greatly increasing, especially in densely populated areas. On the other hand, since the attenuation caused by rainfall increases with the operating frequency, this transition generally goes hand in hand with a move to shorter links, which are more resilient to precipitation. As a result of these factors, the use of relatively short links operating at high frequencies is especially suited to ur-ban areas. This is in contrast to rural areas, where the transmission distances required between base stations are longer and therefore the tendency is to use lower frequencies. The potential for fog monitoring using commercial MLs is thus expected to be distributed across a certain area, according to these constraints.
In the current paper the analysis of system per-formance in the simulation was a theoretical one, using an existing, given set of commercial MLs. It is important to note that other interference factors exist and may lead to inexact measurements (see, e.g., Zinevich et al. 2010). This can be seen, for the real-data case presented here as well, in the scatter of the points representing the microwave measurements around the linear fit in Fig. 5. These factors include the existence of other atmospheric phenomena in parallel with the fog, such as precipitation that af-fects the RSL more dominantly or condensation of a thin layer of water on the outside of the microwave transmission units, causing excess signal attenu-ation. Additionally, changes to the baseline refer-ence level can be caused, for example, by changes in humidity (David et al. 2009; Chwala et al. 2014), and add to the uncertainty in the measurements. Therefore, in addition to the RSL measurements, David et al. (2013b) used supplemental side informa-tion (humidity and rain gauge data) to identify the fog. In addition to these environmental sources of perturbation, technical factors affecting the ability to acquire accurate measurements exist, including white noise, the magnitude resolution of the MLs, and additional characteristics of the system. For example, in some commercial microwave systems transmission power is not constant and can vary (increase or decrease). In these cases this parameter
needs to be taken into account in addition to the RSL to estimate the baseline reference level. Some other systems with a coarser magnitude resolution than the one used here (0.1 dB) exist. For example, some systems have a magnitude resolution of 1 dB. In the course of the expected transition to higher-frequency links, the sensitivity to fog will increase, and the ability to contend with these types of interference will improve as well. These topics, which lie outside of the scope of the current paper, are left for future research. That being said, in communication systems that are densely deployed, the links measuring the phenomenon are varied in pathlength and operating frequencies. The amount of data provided simultane-ously is immense and can partially compensate for the measurement quality of each link on its own. The diversity of the link system being used as the sen-sor array for monitoring allows us to overcome the different interference factors. Thus, for example, by using a large number of short and long links, which are simultaneously measuring the fog in the same area, the attenuation as a result of condensation on the microwave units themselves can be separated from the attenuation caused by the fog itself, utiliz-ing the principle that the shorter the link, the more dominant the effect of condensation on the antenna, and vice versa. This is done, as is presented here, for example, by calculating a parametric fit.
Additional research could also focus on the com-bination of meteorological side information from ground-based sensors or satellites with the microwave link measurements. For instance, RSL from MLs could be used to check whether fog in satellite images is, in fact, present close to the surface (or, perhaps, is stratus cloud found at higher altitudes). Naturally, this depends on the availability of these dedicated sensor data. Furthermore, commercial MLs were found to be efficient in their ability to differentiate between cases of rainfall and cases where no rain ex-isted (e.g., Rayitsfeld et al. 2012), as well as between different types of precipitation [pure rain and sleet; Cherkassky et al. (2014)], through the use of signal processing techniques. Additionally, the feasibility of using commercial microwave systems for measuring atmospheric water vapor utilizing frequencies around the absorption line of this phenomenon at 22.235 GHz was shown (David et al. 2009, 2011). It is possible, then, in future research, to develop and investigate the use of these methods and others to minimize or completely remove the need for side information for fog detection. In the simulation carried out here, homogeneity of the fog patches introduced into the area where the links are deployed was assumed. In reality, fog intensity changes
1695OCTOBER 2015AMERICAN METEOROLOGICAL SOCIETY |

in space (e.g., David et al. 2013b). Given a suitably sen-sitive link network (with respect to the fog affecting it), a future challenge would be to investigate the ability to create a two-dimensional map of the distribution of fog intensity in space using real RSL measurements—that is, in addition to a simple detection of whether the phenomenon occurred in a given area, in a similar fashion to rainfall-intensity mapping, which is already carried out using this technology (e.g., Zinevich et al. 2008, 2009; Goldshtein et al. 2009; Overeem et al. 2013; Liberman et al. 2014). Additionally, the pos-sibility of improving the precision of the model used here (International Telecommunication Union 2013) to estimate fog intensity by adding information about the microphysical characteristics of the phenomenon (e.g., ND or fog droplet size distribution) can be also included in the scope of future research.
CONCLUSIONS. The goal of the work presented here is to reveal the future potential that exists in com-mercial microwave systems, where higher frequencies, which are more sensitive to fog, are starting to be used. This being the case, we carried out a theoretical simula-tion to model the planned future state. The novelty of the current paper is, foremost, conceptual, presenting the window of opportunity being opened by the planned future engineering design, for monitoring fog with high resolution. Additionally, unique algorithms were devel-oped, as part of this research, allowing and theoretically demonstrating for the first time the following:
1) the creation of a 2D map of the sensitivity thresh-old to fog in a region, given an arbitrary link de-ployment, and
2) 2D detection (there was or was not fog) in an area of interest by using commercial microwave links.
In summary, the fol lowing points can be highlighted:
• When cellular network infrastructure is shifted to operate in higher-frequency bands, its use for fog monitoring can be more reliable.
• The method suggested here can potentially be used for real-time fog prediction.
• Fog prediction is a complex process and strongly depends on model physical parameterizations (Gultepe et al. 2007b). This suggests that future improvements exist for the method proposed here, as detailed in the discussion section.
• Validation of the proposed technology needs to be done using well-planned field projects that use state-of-the-art measurements.
Fog is an important atmospheric parameter for varied fields of interest, from meteorology to trans-portation safety to its effects on economics and more. The method proposed here for fog monitoring using cellular network infrastructure can potentially pro-vide information of extraordinary value.
ACKNOWLEDGMENTS. The authors are grateful to Yariv Dagan, Idit Alexandrovitz, Yaniv Koriat, Ido Inbar, Shahar Shilyan, Eli Levi, and Yosi Eisenberg (Cellcom); Nissim Dvela (Pelephone); and Haim Ben Shabat, Amir Shor, Haim Mushvilli, and Yoav Bar Asher (Orange) for providing the microwave data, pro bono, for our research. We deeply thank our research team members (Tel Aviv University): Yonatan Ostrometzky, Ori Auslender, Rana Samuels, Roi Reich, Yaakov Cantor, Itay Zlotnik, Ronen Radian, Lior Gazit, and Elad Heiman for their fruitful cooperation and discussions.Our sincere acknowledgments to the Israeli Meteorological Service and the European Organization for the Exploita-tion of Meteorological Satellites (EUMETSAT) for provid-ing meteorological and satellite data A special thank you to the weather specialist Asaf Rayitsfeld from the Israeli Meteorological Service for the practical consultation and advice.
REFERENCESCherkassky, D., J. Ostrometzky, and H. Messer, 2014:
Precipitation classification using measurements from commercial microwave links. IEEE Trans. Geosci. Remote Sens., 52, 2350–2356, doi:10.1109 /TGRS.2013.2259832.
Chwala, C., and Coauthors, 2012: Precipitation ob-servation using microwave backhaul links in the alpine and pre-alpine region of southern Germany. Hydrol. Earth Syst. Sci., 16, 2647–2661, doi:10.5194 /hess-16-2647-2012.
—, P. Kunstmann, S. Hipp, and U. Siart, 2014: A monostatic microwave transmission experiment for line integrated precipitation and humidity re-mote sensing. Atmos. Res., 144, 57–72, doi:10.1016/j .atmosres.2013.05.014.
Csurgai-Horváth, L., and J. Bitó, 2010: Fog attenuation on V band terrestrial radio and a low-cost measure-ment setup. Future Network and Mobile Summit 2010 Conference Proceedings, P. Cunningham and M. Cunningham, Eds., IIMC International Information Management Corporation, 47.
David, N., P. Alpert, and H. Messer, 2009: Novel method for water vapour monitoring using wireless communi-cation networks measurements. Atmos. Chem. Phys., 9, 2413–2418, doi:10.5194/acp-9-2413-2009.
1696 OCTOBER 2015|
—, —, and —, 2011: Humidity measurements us-ing commercial microwave links. Advanced Trends in Wireless Communications, M. Khatib, Ed., In-Tech Open Access Publisher, 65–78.
—, —, and —, 2013a: The potential of cellular network infrastructures for sudden rainfall monitor-ing in dry climate regions. Atmos. Res., 131, 13–21, doi:10.1016/j.atmosres.2013.01.004.
—, —, and —, 2013b: The potential of commercial microwave networks to monitor dense fog- feasibility study. J. Geophys. Res. Atmos., 118, 11 750–11 761, doi:10.1002/2013JD020346.
Doumounia, A., M. Gosset, F. Cazenave, M. Kacou, and F. Zougmore, 2014: Rainfall monitoring based on micro-wave links from cellular telecommunication networks: First results from a West African test bed. Geophys. Res. Lett., 41, 6016–6022, doi:10.1002/2014GL060724.
Fuzzi, S., and Coauthors, 1992: The Po Valley Fog Experiment 1989: An overview. TeIlus, 44B, 448–468, doi:10.1034/j.1600-0889.1992.t01-4-00002.x.
Glickman, T., Ed., 2000: Glossary of Meteorology. 2nd ed. Amer. Meteor. Soc., 855 pp.
Goldshtein, O., H. Messer, and A. Zinevich, 2009: Rain rate estimation using measurements from commercia l telecommunications l inks. IEEE Trans. Signal Process., 57, 1616–1625, doi:10.1109 /TSP.2009.2012554.
Gultepe, I., and G. A. Isaac, 2004: Aircraft observations of cloud droplet number concentration: Implications for climate studies. Quart. J. Roy. Meteor. Soc., 130, 2377–2390, doi:10.1256/qj.03.120.
—, M. D. Müller, and Z. Boybeyi, 2006: A new visibility parameterization for warm-fog applica-tions in numerical weather prediction models. J. Appl. Meteor. Climatol., 45, 1469–1480, doi:10.1175 /JAM2423.1.
—, M. Pawgoski, and J. Reid, 2007a: A satellite-based fog detection scheme using screen air temperature Wea. Forecasting, 22, 444–456, doi:10.1175/WAF1011.1.
—, and Coauthors, 2007b: Fog research: A review of past achievements and future perspectives. Pure Appl. Geophys., 164, 1121–1159, doi:10.1007 /s00024-007-0211-x.
—, and Coauthors, 2009: The fog remote sensing and modeling field project. Bull. Amer. Meteor. Soc., 90, 341–359, doi:10.1175/2008BAMS2354.1.
—, and Coauthors, 2014: Ice fog in Arctic during FRAM–Ice Fog Project: Aviation and nowcasting applications. Bull. Amer. Meteor. Soc., 95, 211–226, doi:10.1175/BAMS-D-11-00071.1.
Harel, O., N. David, P. Alpert, and H. Messer, 2015: The potential of microwave communication networks to detect dew using the GLRT—Experimental study.
IEEE J. Sel. Top. Appl. Earth Obs. Remote Sens., doi:10.1109/JSTARS.2015.2465909, in press.
Harsryd, J., and J. Edstam, 2011: Microwave capacity evaluation. Ericsson Review, Stockholm, Sweden. [Available online at www.ericsson.com/res/docs /review/Microwave-Capacity-Evolution.pdf.]
Henning, R. E., and J. R. Stanton, 1996: Effects of dew on millimeter-wave propagation. Proceedings of the IEEE Southeastcon '96: Bringing Together Education, Science and Technology, IEEE, 684–687, doi:10.1109/SECON.1996.510158.
Herckes, P., H. Chang, T. Lee, and J. L. Collet Jr., 2007: Air pollution processing by radiation fogs. Water Air Soil Pollut., 181, 65–75, doi:10.1007 /s11270-006-9276-x.
International Telecommunication Union, 2005: Attenuation by atmospheric gases. Rec. ITU-R P.676-6. 23 pp. [Available online at www.itu.int/rec /R-REC-P.676-6-200503-S/en.]
—, 2013: Attenuation due to clouds and fog. Rec. ITU-R P.840-6, 4 pp. [Available online at www.itu.int/rec /R-REC-P.840-6-201309-I/en.]
Klein, C., and A. Dabas, 2014: Relationship between optical extinction and liquid water content in fogs. Atmos. Meas. Tech., 7, 1277–1287, doi:10.5194 /amt-7-1277-2014.
Klemm, O., T. Wrzesinsky, and C. Scheer, 2005: Fog water f lux at a canopy top: Direct measurement versus one-dimensional model. Atmos. Environ., 39, 5375–5386, doi:10.1016/j.atmosenv.2005.05.041.
Kunkel, B., 1984: Parameterization of droplet ter-minal velocity and extinction coefficient in fog models. J. Appl. Meteor. Climatol., 23, 34–41, doi:10.1175/1520-0450(1984)023<0034:PODTVA >2.0.CO;2.
Leijnse, H., R. Uijlenhoet, and J. Stricker, 2007: Rainfall measurement using radio links from cellular com-munication networks. Water Resour. Res., 43, W03201, doi:10.1029/2006WR005631.
Lensky, I. M., and D. Rosenfeld, 2008: Clouds-Aerosols-Precipitation Satellite Analysis Tool (CAPSAT). Atmos. Chem. Phys., 8, 6739–6753, doi:10.5194 /acp-8-6739-2008.
Liberman, Y., R. Samuels, P. Alpert, and H. Messer, 2014: New algorithm for integration between wireless microwave sensor network and radar for improved rainfall measurement and mapping. Atmos. Meas. Tech., 7, 3549–3563, doi:10.5194 /amt-7-3549-2014.
Messer, H., A. Zinev ich, and P. A lper t , 2006: Environmental monitoring by wireless commu-nication networks. Science, 312, 713, doi:10.1126/science.1120034.
1697OCTOBER 2015AMERICAN METEOROLOGICAL SOCIETY |

Meyer, M. B., J. E. Jiusto, and G. G. Lala, 1980: Measurements of visual range and radiation-fog (haze) microphysics. J. Atmos. Sci., 37, 622–629, doi:10.1175/1520-0469(1980)037<0622:MOVRAR>2.0.CO;2.
Neter, J., M. H. Kutner, C. Nachtsheim, and W. Wasserman, 1996: Applied Linear Statistical Models. 4th ed. McGraw Hill, 720 pp.
Overeem, A., H. Leijnse, and R. Uijlenhoet, 2013: Country-wide rainfall maps from cellular commu-nication networks. Proc. Natl. Acad. Sci. USA, 110, 2741–2745, doi:10.1073/pnas.1217961110.
Pagowski, M., I. Gultepe, and P. King, 2004: Analysis and modeling of an extremely dense fog event in southern Ontario. J. Appl. Meteor., 43, 3–16, doi:10.1175/1520-0450(2004)043<0003:AAMOAE>2.0.CO;2.
Pinnick, R. G., D. L. Hoihjelle, G. Fernandez, E. B. Stenmark, J. D. Lindberg, and G. B. Hoidale, 1978: Vertical struc-ture in atmospheric fog and haze and its effects on vis-ible and infrared extinction. J. Atmos. Sci., 35, 2020–2032, doi:10.1175/1520-0469(1978)035<2020:VSIAFA>2.0.CO;2.
Rayitsfeld, A., R. Samuels, A. Zinevich, U. Hadar, and P. Alpert, 2012: Comparison of two methodologies for long term rainfall monitoring using a commercial microwave communication system. Atmos. Res., 104–105, 119–127, doi:10.1016/j.atmosres.2011.08.011.
Sendik, O., and H. Messer, 2015: A new approach to precipitation monitoring: A critical survey of exist-ing technologies and challenges. IEEE Signal Process. Mag., 32, 110–122, doi:10.1109/MSP.2014.2309705.
Wang, Z., M. Schleiss, J. Jaffrain, A. Berne, and J. Rieckermann, 2012: Using Markov switching models to infer dry and rainy periods from telecommunica-tion microwave link signals. Atmos. Meas. Tech., 5, 1847–1859, doi:10.5194/amt-5-1847-2012.
World Meteorological Organization, 2008: Guide to Meteorological Instruments and Methods of Observation. 7th ed. WMO-8. [Available online at www.wmo.int/pages/prog/gcos/documents/gruan manuals/CIMO/CIMO_Guide-7th_Edition-2008.pdf.]
Zinevich, A., P. Alpert, and H. Messer, 2008: Estimation of rainfall f ields using commercial microwave communication networks of variable density. Adv. Water Resour., 31, 1470–1480, doi:10.1016/j |.advwatres.2008.03.003.
—, H. Messer, and P. Alpert, 2009: Frontal rainfall observation by a commercial microwave commu-nication network. J. Appl. Meteor. Climatol., 48, 1317–1334, doi:10.1175/2008JAMC2014.1.
—, —, and —, 2010: Prediction of rainfall inten-sity measurement errors using commercial micro-wave communication links. Atmos. Meas. Tech., 3, 1385–1402, doi:10.5194/amt-3-1385-2010.
1698 OCTOBER 2015|