Embed Size (px)
Citation preview

Contents lists available at ScienceDirect
Cement and Concrete Research
journal homepage: www.elsevier.com/locate/cemconres
Determination of mortar setting times using shear wave velocity evolutioncurves measured by the bender element technique
J. Zhua,b, J.N. Caob, B. Batec,⁎, K.H. Khayatd
a Jones Lang LaSalle, 1 Zhongxinsi Road, Futian District, Shenzhen 518048, ChinabDepartment of Civil, Architectural and Environmental Engineering, Missouri University of Science and Technology, Rolla, MO 65409, United Statesc Institute of Geotechnical Engineering, College of Civil Engineering and Architecture, Zhejiang University, Hangzhou, ChinadUniversity Transportation Center and the Center for Infrastructure Engineering Studies, Department of Civil, Architectural and Environmental Engineering, MissouriUniversity of Science and Technology, Rolla, MO 65409, United States
A R T I C L E I N F O
Keywords:MortarEarly ageShear wave velocityInitial setting timeFinal setting timeBender element
A B S T R A C T
Although identified as a good indicator to characterize freshly cast cementitious materials, shear wave velocity(Vs) alone has not been used successfully to determine the initial and final setting times (ti and tf). The challengeoriginates from the large Vs range that can vary from<50m/s to>2000m/s for cementitious materials at earlyage (typically< 24 h). To overcome these challenges, modifications to traditional bender element and to spe-cimen geometry were made to obtain Vs versus time (Vs(t)) curves of six early age mortars at different water-to-cement ratios, some with chemical admixtures. Derivative methods were then proposed to obtain ti and tf. Thepeak time (tpeak′) in the first-order derivative of Vs(t) curves correlate well to the final setting time (R2=0.979),while the peak time (tpeak″) of the second-order derivative of Vs(t) curves correspond well to the initial settingtime (R2=0.950).
1. Introduction
Monitoring freshly cast cementitious materials (paste, mortar, andconcrete) at early age (approximately the first 24 h) is desired in qualityassurance and quality control (QA/QC), and for long-term performanceprediction. Initial and final setting times are the two key parameters tocharacterize cementitious material properties of early age. Initial set-ting time denotes the time when a cementitious material is sufficientlyrigid to withstand a certain pressure and the material starts losing itsplasticity. Final setting time denotes the time when the developments ofstrength and stiffness start, and the plasticity is completely lost. Bothsetting times are useful parameters in the transportation, casting, andconsolidation of cementitious materials and are key parameters forstrength development at early age and for formwork removal [1,2].
The standard methods of measuring setting times are based on thepenetration resistance test (ASTM C403) for mortar or concrete and theVicat needle test (ASTM C191) for paste. Both tests are destructive la-boratory tests. The isothermal calorimetry method was employed todetermine setting times from heat evolution curves [3–8]. The abovemethods are at the specimen scale. The ultrasonic pulse velocity mea-surement [9,10] is widely used in the field due to its non-destructivenature and its sensitivity to the presence of air pockets, abnormalities,or defects. However, water in the concrete leads to a high Vp value
(approximately 1490m/s), which is on the same order of magnitude asthat of the fresh cementitious material where Vp can vary from ap-proximately 100m/s in the fresh state to over 4000m/s in the hardenedstate. Subsequently, P-wave velocity originating from the solid portionof the cement-based material during curing is shielded by water, whichmakes it a poor indicator of the curing process when used alone. Caretteand Staquet [11] combined Vp and Vs results to determine setting timeof mortars, and concluded that the P-wave is less sensitive to the settingprocess than S-wave. The hydraulic pressure method monitors the set-ting/hardening process using wall hydraulic pressure that are in contactwith the concrete through the formwork (from hydrostatic to zero asthe specimen cures from slump to fully hardening) [7,12]. Hydraulicpressure method can be implemented in the field. However, thismethod necessitates the use of high accuracy pressure sensors. Porewater pressure sensors in contact with concrete can then be used toevaluate the rate of setting.
Previous studies suggest that shear wave velocity (Vs) is a goodindicator of the curing process of cementitious materials, such asmortars [11] and cement-soil mixtures [13,14]. This is because shearwaves propagate primarily through the solid skeleton of a material andis not significantly influenced by the presence of water or air. In spite ofits use in evaluating characteristics of in-situ soils and cemented soil inthe laboratory, shear wave velocity alone is not commonly used to
https://doi.org/10.1016/j.cemconres.2018.01.013Received 14 February 2017; Received in revised form 4 November 2017; Accepted 11 January 2018
⁎ Corresponding author at: Institute of Geotechnical Engineering, College of Civil Engineering and Architecture, Zhejiang University, Hangzhou, China.E-mail address: [email protected] (B. Bate).
Cement and Concrete Research 106 (2018) 1–11
0008-8846/ © 2018 Elsevier Ltd. All rights reserved.
T

monitor the early age properties of cementitious materials. This is be-cause early-age cementitious materials have a larger range of stiffnessvariations during the curing process where Vs can vary from around50m/s in the fresh state to over 2000m/s in the hardened stage. This isconsiderably greater than soils that normally vary from 30m/s (kaoli-nite [15]) to 350m/s (iron oxide-coated sand, [16]) under normalloading conditions (< 400 kPa). The quick stiffness (Vs) increment in-creases the resonant frequency of the specimen, which subsequentlymandates the increment of the exciting frequency to ensure a goodsignal-to-noise ratio [17,18], reduces wavelength, and poses challengesin maintaining the wavelength ratio (Rd) requirement (Rd > 2) neededto minimize the near-field effect in< 24 h [19,20]. This is the majorreason that existing studies using traditional piezoceramic material-based tools, such as the traditional bender element (BE) [21] and pie-zoelectric ring actuator [7], provide only partial Vs evolution data(< 15 h) for cementitious materials generally with longer curing pro-cess (normally> 24 h). However, in view of its advantages, such as in-situ and laboratory experimental capabilities and well-established ap-proaches for soils, the bender element technique could be suitable toevaluate the stiffness of cement-based materials at early age.
This study aims at modifying the traditional bender element toobtain Vs evolution curves of mortar at early-age spanning from 0to> 24 h. The study also seeks to determine the initial and final settingtimes based on Vs evolution results. The following objectives are pro-posed accordingly: (1) modify the geometry of mortar specimen andchange the geometry, alignment and coating of a traditional benderelement used for soils to cover Vs variations at early-age of cement-based materials; and (2) measure the evolution of shear wave velocityof mortar specimens at early age (up to 96 h) with the modified benderelement testing system. Six mortar mixtures of different water-to-ce-ment ratios (w/c), including one with a set accelerator and two with setretarders were prepared to embrace a broad range of setting times. Theevolution of Vs with time was analyzed to evaluate setting times, whichwere compared to values measured by ASTM standard penetration re-sistance test. In addition, a calorimetry test-based method was alsoevaluated and used to correlate to setting times determined from pe-netration resistance test.
2. Materials
A Type I portland cement was used. Missouri River sand. A wellgraded river-bed sand was used. The sand was sieved through No. 4sieve with D50 of 0.7 mm and Cu (coefficient of uniformity, D60/D10) of2.74. The grain-size distribution of the sand is shown in Fig. 1 and is
close to the lower limit of the specification for aggregate used to makemasonry mortar (ASTM C144). Two chemical admixtures were in-troduced to alter the range of setting times: a hydration controllingadmixture that retards setting times by controlling the hydration of thecement, and a non-chloride accelerating admixture that acceleratescement hydration.
3. Mixing design
Six mortar mixtures were used, as shown in Table 1. Mortar mix-tures with w/c of 0.50, 0.43, and 0.37 are referred to as Mix 1, Mix 2,and Mix 3, respectively. The dosage rates of the admixtures (i.e., setaccelerator and set retarder) were selected based on the criteria inASTM C 494: Normal variation of delaying in the initial setting time isbetween 1 and 3.5 h when using a set retarder, or between 1 and 3.5 hearlier when using an accelerator. Mix 4 and Mix 6, modified from Mix2 (w/c of 0.43), contained 3 fl oz./cwt (fluid ounce/cement hundred-weight) (195ml/100kgc) and 3.4 fl oz./cwt (220ml/100kgc) hydrationcontrolling admixture, respectively. Mix 5 was modified from Mix 2with w/c of 0.43, and incorporated 23 fl oz./cwt (1500ml/100 kg) ac-celerating admixture. The procedure used for mixing mortar is incompliance with ASTM C 305. A mechanical mixer was used. In eachtest, a batch of 25 l of mortar was prepared, and 21 l was placed in theformwork.
4. Bender element testing system
A bender element (BE) testing system for measuring Vs of ce-mentitious materials was used. The BE system consisted of three pairs ofbender elements, a signal generation and acquisition system, and awooden formwork measuring 0.61× 0.305×0.14m3
(length×width× height, inner geometry) (Fig. 2). The system wasdeveloped with modifications on a traditional bender element system.The details of each component and the rationale behind the corre-sponding modifications are discussed below.
5. Bender element test setup
Two-layered brass-reinforced piezo actuators were cut into benderelement plates with dimension of 23×11.5×2mm3
(length×width× thickness). This size is larger than typical sizesranging from 12×5×0.5mm3 to 20×12.7×2mm3 [22] used insoil testing. The selected larger size is expected to enhance signalstrength given the long travel distance in a large specimen and theinitially paste-type materials (possibly weak signal due to the fewcontacting points for Vs propagation). A parallel-type connection wasalso adopted over series-type connection for stronger received signals[23].
From inside out, coatings of a bender element that is typically usedfor geotechnical applications follow the order of polyurethane, silverconductive paint, and epoxy coatings (Fig. 2b) [15,17,23,24]. Mod-ifications were made to these coatings to accommodate testing of ce-mentitious materials, which are corrosive with high pH. For the
0
10
20
30
40
50
60
70
80
90
100
0.01 0.1 1 10
Cum
ulat
ive
Pass
ing
(%)
Sieve Size (mm)
Missouri River Sand
ASTM C144 lower limit
ASTM C144 upper limit
Fig. 1. Grain-size distribution of sand used in this study.
Table 1Mixture proportioning of tested mortars.
Mixture Mix 1a Mix 2 Mix 3 Mix 4 Mix 5 Mix 6
w/c 0.50 0.43 0.37 0.43 0.43 0.43Cement (kg/m3) 673 713 751 713 713 713Sand (kg/m3) 1137 1203 1267 1203 1203 1203Water (kg/m3) 337 313 277 313 313 313Set retarder (ml/100kgc) – – – 195 – 220Set accelerator (ml/100kgc) – – – – 1500 –Unit weight (kN/m3) 21.34 22.28 22.63 22.08 21.78 22.08
a Repeated three times to verify the repeatability of material properties.
J. Zhu et al. Cement and Concrete Research 106 (2018) 1–11
2

modified BE system, polyurethane was still used in direct contact withthe piezoceramic plate as the insulation and waterproofing coating.Three to five polyurethane layers were painted onto the piezoceramicplate to strengthen the coating and to avoid possible electricity shortingpath. Outside the polyurethane coating, however, the following mod-ifications to the traditional coatings were made:
(1) Silver paint coating was not used in this study, despite its electricalshielding ability that prevents cross-talking [23]. This is because: (i)no obvious improvement in the quality of signals was observedusing silver painting in a side-by-side comparison test on dry sandsusing bender elements with and without silver conductivity coating;(ii) the BEs are more prone to electrical short-circuiting during thesilver coating procedure, which leads to low success rate of BEfabrication; and (iii) a sufficient electrical shield seemed to beprovided by parallel BE made with twisted coaxial cable with
grounding (drain wire embedded into the testing material) [23,24].(2) PVC cement was used instead of epoxy due to its higher moisture
resistance, good flexibility, chemical resistance and durability. Alayer of Oatey purple primer was used to roughen up the surface ofthe polyurethane-coated piezoceramic plate, and to provide bettermechanical bonds between the polyurethane and PVC cement [19](Fig. 2b).
(3) Outside of the previously mentioned coatings, a plastic sheet wastightly wrapped around bender element unit to further protect theunit in a corrosive environment.
To sum up, the coatings on a BE unit follow the order of (from insideto outside): polyurethane; purple primer; PVC cement; and plastic wrap(Figs. 2a–b).
Several bender element tests were performed on three individualspecimens with Mix 1 to evaluate repeatability.
traditional coating modified coating
purple primer
PVC cement 3 days later
Installed on a socket
Fig. 2. Bender element testing system for monitoring of early age stiffening of cementitious materials: (a) bender element coatings, (b) coating comparison, (c) signal generation andreceiving system, and (d) mortar specimen and formwork.
0
1000
2000
3000
4000
5000
6000
7000
100 200 300 400 500 600 700 800
Pene
trat
ion
Res
ista
nce
(psi
)
Elapsed Time (min)
Mix-1 (w/c=0.50) Mix-2 (w/c=0.43) Mix-3 (w/c=0.37) Mix-4 (w/c=0.43+1.95 mL/kg retarder) Mix-5 (w/c=0.43+ accelerator) Mix-6 (w/c=0.43+2.20 mL/kg retarder)
Fig. 3. Penetration resistance evolution with time for thesix investigated mortars.
J. Zhu et al. Cement and Concrete Research 106 (2018) 1–11
3
6. Formwork
There are a few considerations in choosing the dimensions of theformwork. (1) There is inherent system time lag due to the bender ele-ment plate, coatings, wiring, and the electrical equipment [19,20]. Kanget al. [20] determined the system lag of the same bender element testingsystem with a smaller BE (12.7× 8.0× 0.6mm,length×width× thickness) to be 6–11 μs. (2) The stiffness of hardenedcementitious materials, such as mortar in this study, is usually higherthan that of common soils. Therefore, long wave travel distance is
required to ensure the travel time sufficiently larger than the system lag.(3) On the other hand, in order to receive clear signals, travel distanceshould not be too long. (4) To avoid near-field effect, the travel distanceto wavelength ratio (Rd ratio) should be no less than two [25]. In thisstudy, the tip-to-tip travel distance was chosen to be 0.27m, which gavea travel time at least 8 times greater than the system lag while satisfyingthe wavelength ratio requirement for the majority of the time (resonantfrequency and wavelength evolve over time, see also the last paragraphof this section). Subsequently, the inner dimensions of the formworkwere 0.61× 0.305× 0.14m3 (length×width× height) (Fig. 2d).
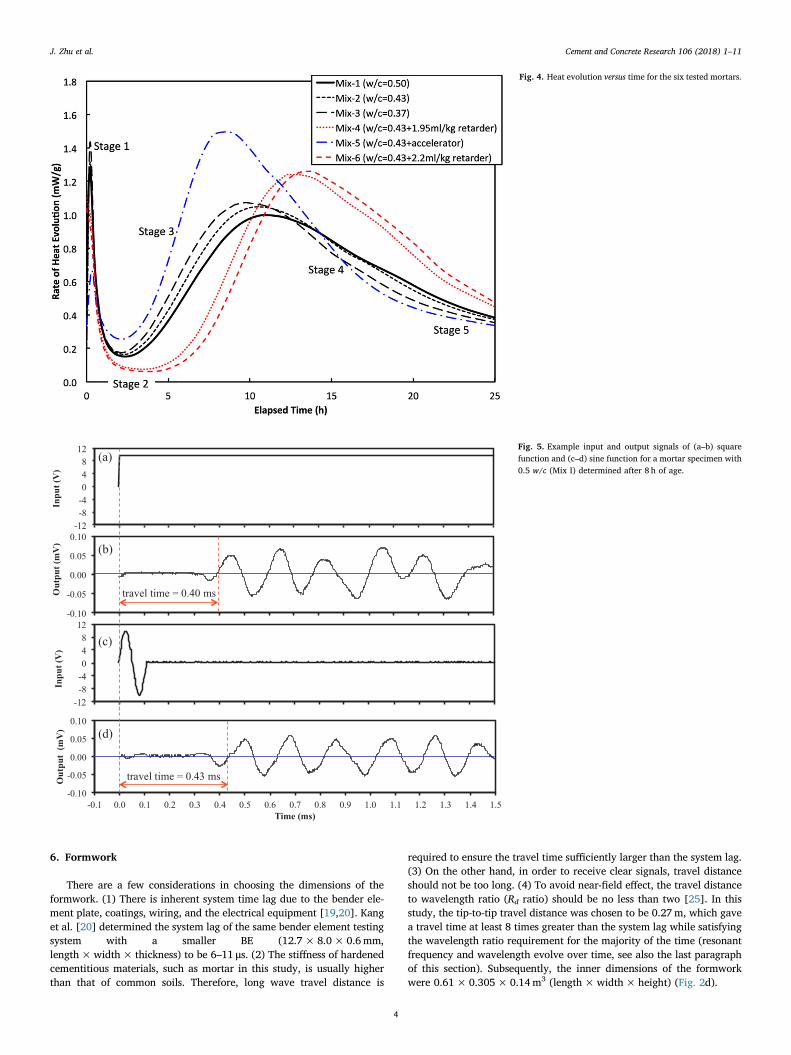
Fig. 4. Heat evolution versus time for the six tested mortars.
-12
-8
-4
0
4
8
12
Inpu
t (V
)
-0.10
-0.05
0.00
0.05
0.10
Out
put (
mV
)
-12
-8
-4
0
4
8
12
Inpu
t (V
)
-0.10
-0.05
0.00
0.05
0.10
-0.1 0.0 0.1 0.2 0.3 0.4 0.5 0.6 0.7 0.8 0.9 1.0 1.1 1.2 1.3 1.4 1.5
Out
put
(mV
)
Time (ms)
travel time = 0.40 ms
travel time = 0.43 ms
(a)
(b)
(c)
(d)
Fig. 5. Example input and output signals of (a–b) squarefunction and (c–d) sine function for a mortar specimen with0.5 w/c (Mix I) determined after 8 h of age.
J. Zhu et al. Cement and Concrete Research 106 (2018) 1–11
4

Thick (0.038m in thickness) wooden board was chosen as theformwork material for the following two reasons: (1) it is rigid enoughto resist any lateral movement due to the lateral pressure exerted by thefresh mortar; (2) its thickness can ensure tight fixation of the BEs on thewall and provided good contacts between the bender and mortar.Wooden boards were assembled together by screws, which is easilyremoved after each test. Oil lubrication along the inside wall of theformwork, together with screw connections, enabled the reuse ofwooden formwork.
Three pairs of BEs were installed in pre-drilled holes (diameter,0.022m), aligning perpendicularly to the bottom of the formwork toprevent possible voids immediately underneath the benders duringmortar placement. The vertical alignment of the benders also avoidedinterference by compressive waves reflected from sidewalls because oftheir elongated travel path [20]. The distance between the center of aBE and the mortar surface was 0.038m.
The signal generation and acquisition system consisted of a 1 mHz-
10MHz signal generator, a linear amplifier, a 4 pole LP/HP filter, and a100MHz oscilloscope. The stiffness and attenuation (energy dissipa-tion) of cement paste, mortar, and concrete at early age (up to 72 h)evolve rapidly as they change from slurry state to a semi-solid state.Consequently, their resonant frequencies increase drastically (estimatedto be from 100 Hz to 14,000 Hz), while the attenuation of the receivedelectrical signals likely decrease over time. To receive strong signal andweak noise, the exciting frequency of the input sine wave was alsoadjusted to be close to the resonant frequencies. Square wave, con-taining a wide frequency range that covers the evolving natural fre-quency of the mortar, was also used. Cutoff frequencies were 1 Hz (highpass) and 50 kHz (low pass), respectively. The amplitude of the wave-form generator was 10 V.
7. Penetration resistance test
To determine the initial and final setting times of mortar, penetra-tion resistance test was performed in accordance to ASTM C403 andAASHTO T197. Loading apparatus, penetration needles with bearingareas of 645, 323, 161, 65, 32, and 16mm2, and tamping rod wereused. The penetration resistance was calculated by dividing the re-corded force by the needle bearing area. Six to nine undisturbed pe-netration readings of penetration resistance were recorded at differentelapsed times for each test. The time taken to penetrate 25.4mm depthwas about 10 ± 2 s. Elapsed time was calculated from the time whenwater was added to cement. Initial and final setting times are de-termined to be the elapsed times at penetration resistance of 3.5MPaand 27.6MPa, respectively.
8. Calorimetry test
A calorimetry test was carried out, in compliance with ASTM C1679to evaluate the heat flow generated by the hydration reaction of cementover time. I-Cal 8000 Isothermal Calorimeter and the accompanyingCalCommander software were used. Fifty to 150 g of mortar sample wasplaced in a clean reusable plastic cup. The lid was closed until testing tominimize heat exchange with the surrounding air. TheArrhenius' law(Eq. 1) was used to describe the temperature dependency of the hy-dration rate of cement:
Fig. 6. Shear wave velocity versus elapsed time curves from bender element tests on threeindividual mortar specimens with Mix 1.
Fig. 7. Shear wave velocity versus elapsed time curves.
J. Zhu et al. Cement and Concrete Research 106 (2018) 1–11
5

Fig. 8. Vs evolution over time of mortars with different w/c.Legends beginning with “Carette”, “Liu” and “Soliman”refer to Carette and Staquet [11], Liu et al. [21], and So-liman et al. [7], respectively.
Table 2Initial and final setting times determined from different methods.
Mortar Initial setting time (h) Final setting time (h)
Penetration resistance BE (tpeak″) BE (a) Calorimetry Penetration resistance BE (tpeak′) Calorimetry
Mix-1 5.00 4.59 5.16 4.48 6.42 6.50 6.56Mix-2 4.33 5.32 4.20 4.14 5.67 6.20 5.78Mix-3 3.28 3.03 3.85 3.46 4.83 5.10 5.07Mix-4 6.53 6.78 6.36 7.75 8.08 8.50 9.30Mix-5 3.28 3.13 2.88 3.46 4.38 3.80 3.83Mix-6 9.58 9.17 9.56 8.71 11.50 11.50 10.34R2 – 0.950 0.981 0.910 – 0.979 0.908
Fig. 9. The rate of heat evolution curve and its first-order de-rivative curve for Mix 1.
J. Zhu et al. Cement and Concrete Research 106 (2018) 1–11
6
= −k Ze E RTa (1)
where k is the hydration rate constant, Z is a proportionality constant,Ea is the activation energy for the reaction, R is the ideal gas constant inJ/(mol.K), and T is the temperature in Kelvin. Eq. 1 suggests that thewarmer the mortar, the faster the hydration reaction is. Therefore, a
constant temperature (20.0 °C) was maintained during all calorimetrytests to avoid inconsistent results induced by temperature variation.
9. Results
The penetration resistance versus elapsed time curves for six mix-tures is shown in Fig. 3.
The rate of heat evolution versus elapsed time relationship for the sixfresh mortars measured by calorimetry test is shown in Fig. 4. Theprocess of cement hydration can be broken down into five stages. In thefirst stage, a large amount of heat is rapidly generated after cementcontacts with water. Hydration activity slows down in Stage 2, which isalso known as the dormant period. Mortars with set retarder (Mix 4 andMix 6) have longer dormant periods. In Stage 3, heat release acceleratesfollowed by a rapid reaction between calcium hydrate (CH) and cal-cium silicate hydrate (CSH) [7]; both the initial setting (beginning ofsolidification) and final setting (complete solidification and beginningof hardening) occur in Stage 3. Hydration products are formed at slowerrates during Stage 4 (deceleration) and Stage 5 (diffusion limited).
The received BE signals from both the sine and square wave formsare plotted in Fig. 5. The time of arrival of the received shear wave wasdetermined using the zero-crossing point with the x-axis of the halfpeak before the first major peak (Fig. 5b and d). Then, the travel timewas determined from time zero to the time of arrival, and the shearwave velocity was calculated by dividing the tip-to-tip distance by thetravel time. The travel times determined from square and sine waveforms should be the same [17,26]. In practice, however, minor differ-ences (< 10% in this study) in the travel time by different wave formsexist. For instance, in the case of the Mix 1 mortar made with 0.5 w/c, a7% difference in travel time was observed between square and sinewave forms at 8 h of age. In such a case, an average shear wave velocitywas reported.
Three repeated Vs versus time relationships for Mix 1 agrees wellwith each other (Fig. 6), which suggests good repeatability of the BEsystem. The variations of shear wave velocity with elapsed time for thesix mortar mixtures are illustrated in Figs. 7 and 8. The results showthat: (1) shear wave velocity increased monotonically with time duringthe first 24 h. Three phases of the Vs evolution curve can be observed: agentle slope before approximately 5 to 8 h, a steep increment fromabout 5 to 15 h, and a gentle slope approximating to a plateau valueafter about 10 to 15 h. (2) Shear wave velocity of hardened (> 20 h)mortar ranged from 1700 to 2100m/s. (3) At the same elapsed time inmortar made without a set accelerator or retarder, Vs of fresh mortarwith low w/c was higher. The use of a set retarder significantly delayedhydration reaction of cement by approximately 3 h and 5 h when in-corporated of dosage rates of 195ml/100 kg and 220ml/100 kg, re-spectively (Table 2). (5) The use of a set accelerator increased Vs in theinitial 9 h, and then registered a lower Vs value than the mortar madewithout any set accelerator did (Fig. 7), which suggests that the use ofset accelerator decreased the Vs of the hardened mortar.
10. Discussion
10.1. Comparison of Vs evolution at early age to previous studies
Compared to the shear wave velocity (Vs) measurements of mortarmixtures previously reported by Soliman et al. [7], Liu et al. [21], andCarette and Staquet [11], it can be observed that for the same curingtime, the range of the magnitude of Vs in this study (0–2100m/s) issimilar to that in previous studies, and that the variations of Vs withelapsed time curves in this study share the same S-shaped feature asthose in the literature (Fig. 8). It can also be noted that Vs of the mortarmade with w/c of 0.50 (1697m/s) after 24 h of curing in this study islower than that of a hardened mortar at the same w/c (2260m/s) re-ported by Vipulanandan and Garas [27]. In addition to the longercuring time in the latter study, a higher Vs value could also originate
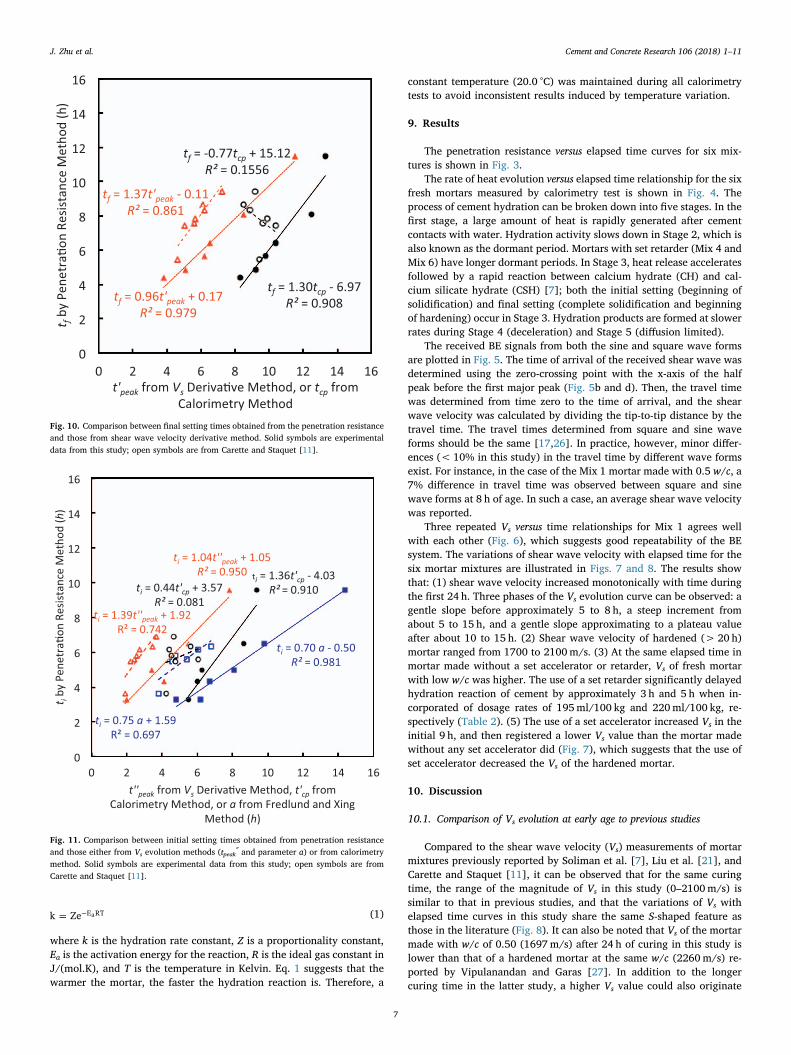
Fig. 10. Comparison between final setting times obtained from the penetration resistanceand those from shear wave velocity derivative method. Solid symbols are experimentaldata from this study; open symbols are from Carette and Staquet [11].
Fig. 11. Comparison between initial setting times obtained from penetration resistanceand those either from Vs evolution methods (tpeak″ and parameter a) or from calorimetrymethod. Solid symbols are experimental data from this study; open symbols are fromCarette and Staquet [11].
J. Zhu et al. Cement and Concrete Research 106 (2018) 1–11
7

from the larger maximum size of the aggregate, better quality cementand mixing, as well as the systematic shift in the measurement methodand first arrival time determination [20].
In the following sections, the initial and final setting times are de-termined from the penetration resistance, calorimetry test method, andshear wave velocity (Vs) test. The ti and tf values deducted from thecalorimetry and Vs tests are compared to those obtained from the pe-netration resistance test, which was used as a benchmark.
10.2. ti and tf determined from penetration resistance test
The initial and final setting times determined from penetration re-sistance test (ASTM C403) ranged from 197 to 575min and from 263 to690min, respectively as shown in Table 2 and Fig. 3.
10.3. ti and tf determined from calorimetry test
Ge et al. [3] proposed that the initial setting time correlates to thepeak time (tcp′) of the first-order derivative curve of Stage 3 of the rateof heat evolution versus elapsed time curve, while the final setting timecorrelates to the peak (tcp) of Stage 3 of the rate of heat evolution versuselapsed time curve. Instead of curve fitting, differences between two
subsequent time steps can be taken directly from the calorimetry testresults to achieve sufficient accuracy since approximately 500 timesteps were recorded between the valley of Stage 2 and the peak of Stage3. The rate of heat evolution versus elapsed time curve and its first orderderivative curve for Mix 1 is shown in Fig. 9 as an example. The initialand final setting times of all six mortar specimens obtained using the Geet al. [3] method are presented in Table 2, and were correlated to thosemeasured from the penetration resistance test, as shown in Figs. 10 and11, respectively. For the calorimetry measurement in this study, both tcpand tcp′ values correlate to the final and initial setting times obtainedfrom standard penetration tests reasonably well (with R2 of 0.910 and0.908, respectively). These good correlations seem to suggest that thecalorimetry method, albeit yielding slightly lower R2 values(0.908–0.910) than those (0.950–0.981) from the proposed Vs-basedmethod in this study, is viable. For the calorimetry measurement inCarette and Staquet [11], however, both tcp and tcp′ values correlatepoorly to tf and ti values obtained from standard penetration tests(Figs. 10–11). It is not clear whether the poor correlations origin fromthe narrow range of the initial and final setting times for the mortars inCarette and Staquet [11] or the calorimetry method proposed by Geet al. [3]. Further calorimetry testing and analysis are warranted beforeconclusions can be drawn regarding the validity and limitations of thecalorimetry method.
10.4. ti and tf determined from Vs evolution curves
The evolution of Vs versus elapsed time could be used to determinethe initial and final setting times [7]. Soliman et al. [7] plotted the firstderivative of Vs (dVs/dt) versus time curve, and defined the times cor-responding to the “lower concave point” and the “highest convex point”in the major Vs increment portion of the dVs/dt versus time curve as theinitial and final setting times, respectively. However, it is not alwayspossible to obtain the ‘lower concave point’ and the ‘highest convexpoint’ because dVs/dt versus time curve is often monotonic in the majorVs increment portion (see also Fig. 13). This is because the dVs/dt versustime curves in this study and that reported by Carette and Staquet [11]do not have such local peak or valley points (Fig. 13) and noise (orfluctuation due to the variation of measured Vs values) could be mis-interpreted as such local points due to the discrete nature of the dVs/dtversus time curves.
Fig. 12. Fitting curves using Weibull, the lognormal, andGamma cumulative distributions, and modified Fredlund andXing equation. Data labeled “measured” refers to the measuredVs data in this study.
Table 3Parameters of Weibull, lognormal, and Gamma cumulative distributions, and Fredlundand Xing equation.
Equation Parameters Mix 1 Mix 2 Mix 3 Mix 4 Mix 5 Mix 6
Weibull α 2.178 2.651 2.303 3.018 1.773 3.384β 9.953 8.933 8.124 11.286 6.955 14.083R2 0.996 0.995 0.994 0.998 0.992 0.999
Lognormal μ 2.097 2.031 1.904 2.285 1.695 2.511σ 0.516 0.416 0.486 0.411 0.637 0.331R2 0.998 0.996 0.998 0.994 0.997 0.996
Gamma α 3.934 5.795 4.422 6.447 2.707 9.227β 2.295 1.405 1.665 1.617 2.341 1.396R2 0.998 0.996 0.997 0.996 0.995 0.998
ModifiedFredlundand Xing
a 8.068 6.696 6.190 9.778 4.817 14.346n 3.015 5.019 3.464 3.683 2.677 4.047m 2.266 1.656 1.921 2.162 1.825 3.707R2 0.999 0.995 0.999 0.997 0.998 0.999
J. Zhu et al. Cement and Concrete Research 106 (2018) 1–11
8

To solve the above challenges, new methods have been proposed todetermine the initial and final setting times, as elaborated below. Thefitted Vs versus elapsed time curves with commonly seen S-shaped cu-mulative distribution equations, such as the Weibull cumulative eq.[28] (Eq. 2), the lognormal cumulative equation [29] (Eq. 3), or theGamma cumulative equation [30] (Eq. 4). The modified Fredlund andXing [31] equation (Eq. 5) is also used because it's a parameter char-acterizes the onset of the major increment of Vs from the initial gentleslope (dormant period), and therefore can be used to estimate the initialsetting time (see below for details).
= −−⎛
⎝⎞⎠y e1
xβ
α
(2)
= − −y
xσ πe1
2
x μσ
(ln )2
2
2(3)
=yΓ α
γ α βx1( )
( , )(4)
= − ⎡⎣⎢ +
⎤⎦⎥
y θ θe a
1ln( (x/ )s s n
m
(5)
where α, β, μ, σ, a, n and m are fitting coefficients for Eqs. 2–5.The fitted curves are shown in Fig. 12, and the fitting parameters
and the coefficient of determination (R2) are listed in Table 3. All of the
above-mentioned equations give satisfactory accuracy with high R2
values of 0.992 to 0.999 (Table 3).Furthermore, it is recommended to calculate the first and second
derivatives of the fitted cumulative equations. Take lognormal cumu-lative equations for example (Fig. 13), the time at the peak (tpeak′) of thefirst derivative curve (Vs
′), i.e. the inflection point of the original Eq. 3,was used to correlate to the final setting time (tf) measured from thestandard penetration resistance test:
= ′ +t t0.96 0.17f peak (6)
with R2=0.979 (Fig. 10). A similar procedure for modified Fredlundand Xing equation gives:
= ′ −t t0.96 0.09f peak (7)
with R2=0.982 (Fig. 10). Applying the same methods to the Vs evo-lution curves reported by Carette and Staquet [11] yielded reasonablegood fitting results, with R2=0.861. The fitting results shown heresuggest that the proposed inflection point method is valid to estimatethe final setting time.
The time (tpeak″) corresponding to the peak of second derivative (Vs″)
of lognormal distribution correlates to the initial setting time (ti) de-termined from standard penetration resistance test as follows (Fig. 11):
= ′′ +t 1.04t 1.05i peak (8)
Fig. 13. Original, first, and second derivatives of Vs versuselapsed time curves.
Table 4Fitting parameters of lognormal and modified Fredlund and Xing equations for experimental data of mortars with clinkers (REF), municipal solid waste incineration electrostaticprecipitator fly ash at different ratios (EFA-1 and EFA-2), thermal power station fly ash at different ratios (TFA-1 and TFA-2), reduced water/binder ratio of 0.4 (R-0.4), and air entrainingagent (R-AEA) in Carette and Staquet [11].
Equation Parameters REF TFA-1 TFA-2 EFA-1 EFA-2 R-0.4 R-AEA
Lognormal Vs,max 1782 1784 1666 1803 1538 2075 1682Vs,min 66 67 85 64 83 66 44Μ 1.996 2.173 2.257 2.072 2.043 1.966 2.094Б 0.613 0.598 0.533 0.596 0.456 0.654 0.597R2 0.9999 0.9998 0.9994 0.9999 0.9997 0.9992 0.9997
Modified Fredlund and Xing Vs,max 3907 2817 1539 2968 1741 95,670 8140Vs,min 57 52 62 50 70 72 40a 4.575 6.062 10.959 5.388 6.777 3.799 4.756n 3.079 2.947 2.855 2.993 3.583 3.271 3.328m 0.383 0.686 4.002 0.629 1.548 0.012 0.140R2 0.9999 0.9999 0.9998 0.9999 0.9999 0.9996 0.9998
J. Zhu et al. Cement and Concrete Research 106 (2018) 1–11
9

with R2=0.950. Similarly, for modified Fredlund and Xing equationwe have
= ′′ +t 1.03t 1.09i peak (9)
with R2=0.937. Besides, the parameter a in modified Fredlund andXing equation correlates to ti as
= −at 0.70 0.50i (10)
with R2=0.981.Applying the same approach to the measured shear wave velocity
versus elapsed time curves in Carette and Staquet [11] resulted in cor-relations shown in Fig. 11 with R2 values of 0.742 and 0.697 for thelognormal and modified Fredlund and Xing equation, respectively(Table 4). It should be noted that one of the mixtures in the Carette andStaquet [11] evaluation was removed from the fitting of modifiedFredlund and Xing equation because the initial fluctuating segment ofthe measured Vs evolution curve resulted in fitting disagreeable withthe visual judgment (e.g., the two tangent line method) and gave anunreasonably high a value. Two reasons accounting for the low R2
values are postulated. Firstly, the initial fluctuating segment of themeasured Vs evolution curves by Carette and Staquet [11] caused alarge variation in initial setting time estimation (e.g. the R-0.4 sample);Secondly, the range of initial setting times was narrower than thatmeasured in this study, causing a larger variation. That said, both tpeak″
and parameter a from the shear wave velocity evolution monitoringmethod can give reasonable estimation of the initial setting time(Table 5). The above results and analysis also suggest Vs evolution curvemeasured by the BE method in this study can offer more reliable pre-dictions of both the initial and final setting times than that measured bythe method used in Carette and Staquet [11] does.
11. Summary
In this study, a method is proposed for the use of the shear wavevelocity (Vs) evolution curves of freshly cast mortar to estimate theinitial and final setting times using a specially designed bender elementsystem. The traditional bender element testing system used in geo-technical engineering was modified to obtain Vs versus elapsed timerelationship of the cement-based materials, whose stiffness increasedquickly at early age (from 0 to>24 h). Details of the modifications ofthe bender element system and their rationales were elaborated.
Cumulative distribution equations, such as the lognormal equationand modified Fredlund and Xing equation were used to fit the measuredVs evolution curves determined in this study as well as data reported byCarette and Staquet [11] for mortars made with w/c of 0.4 to 0.5. Thetest results were compared to the initial and final setting times obtainedfrom the standard penetration resistance test. Test results indicated thatthe time corresponding to the first inflection point of the Vs evolutioncurve can correlate well to the final setting time (R2=0.979). Theinitial setting time was found to correlate well either to the peak time ofthe second derivative of the Vs evolution curve or to the parameter a inthe modified Fredlund and Xing equation (R2=0.950 and 0.981, re-spectively). Correlation results also suggested that the modified benderelement used in this study can yield a more reliable estimation of the
setting time than the experimental method used in Carette and Staquet[11]. With the non-destructive nature and reliable results, the proposedbender element is a promising tool to determine initial and final settingtimes and to monitor early age characteristics of mortars as well asother cementitious materials.
Acknowledgement
The authors would like to thank the United States Department ofTransportation and the Center for Infrastructures Engineering Studiesfor the financial support to Mr. Jianfeng Zhu for his master studies. Theauthors would also like to thank the One-Thousand-Young-TalentsProgram of the Organization Department of the CPC Central Committeeas well as the 100-Talents Program of Zhejiang University for their fi-nancial support. This work is also partially sponsored by the NationalNatural Science Foundation of China (Award No.: 51779219). In ad-dition, the Key Laboratory of Soft Soils and GeoenvironmentalEngineering of the Ministry of Education is acknowledged.
References
[1] V. Garnier, G. Corneloup, J.M. Sprauel, J.C. Perfumo, Setting time study of rollercompacted concrete by spectral analysis of transmitted ultrasonic signals, NDT&EInt. 28 (1995) 15–22.
[2] Z. Li, L. Xiao, X. Wei, Determination of concrete setting time using electrical re-sistivity measurement, J. Mater. Civ. Eng. 19 (2007) 423–427.
[3] Z. Ge, K. Wang, P.J. Sandberg, J.M. Ruiz, Characterization and performance pre-diction of cement-based materials using a simple isothermal calorimeter, J. Adv.Concr. Technol. 7 (2009) 355–366.
[4] M.P. Hofmann, S.N. Nazhat, U. Gbureck, Real-time monitoring of the setting re-action of Brushite-forming cement using isothermal differential scanning calori-metry, J. Biomed. Mater. Res. 79B (2006) 360–364.
[5] V. Rahhal, R. Talero, Calorimetry of Portland cement with silica fume, diatomiteand quartz additions, Constr. Build. Mater. 23 (2009) 3367–3374.
[6] J.P. Sandberg, S. Liberman, Monitoring and Evaluation of Cement Hydration bySemi-Adiabatic Field Calorimetry, Concrete Heat Development: Monitoring,Prediction, and Management, vol. 241, Curran Associates. Inc., NY, 2007, pp.13–24.
[7] N.A. Soliman, K.H. Khayat, M. Karray, A.F. Omran, Piezoelectric ring actuatortechnique to monitor early-age properties of cement-based materials, Cem. Concr.Compos. 63 (2015) 84–95.
[8] G. Zhang, J. Zhao, P. Wang, L. Xu, Effect of HEMC on the early hydration ofPortland cement highlighted by isothermal calorimetry, J. Therm. Anal. Calorim.119 (2015) 1833–1843.
[9] C.-W. Chung, P. Suraneni, J.S. Popovics, L.J. Struble, Setting time measurementusing ultrasonic wave reflection, ACI Mater. J. 101 (2012) 109–118.
[10] G. Trtnik, G. Turk, F. Kavčič, V.B. Bosiljkov, Possibilities of using the ultrasonicwave transmission method to estimate initial setting time of cement paste, Cem.Concr. Res. 38 (2008) 1336–1342.
[11] J. Carette, S. Staquet, Monitoring the setting process of mortars by ultrasonic P andS-wave transmission velocity measurement, Constr. Build. Mater. 94 (2015)196–208.
[12] S. Amziane, Setting time determination of cementitious materials based on mea-surements of the hydraulic pressure variations, Cem. Concr. Res. 36 (2006)295–304.
[13] J. Silva, M. Azenha, A.G. Correia, C. Ferreira, Continuous stiffness assessment ofcement-stabilised soils from early age, Geotechnique 63 (2013) 1419–1432.
[14] J. Silva, M. Azenha, A.G. Correia, J. Granja, Continuous monitoring of sand–cementstiffness starting from layer compaction with a resonant frequency-based method:issues on mould geometry and sampling, Soils Found. 54 (2014) 56–66.
[15] X. Kang, G.C. Kang, B. Bate, Measurement of stiffness anisotropy in kaolinite usingbender element tests in a floating wall consolidometer, Geotech. Test. J. 37 (2014)1–16.
[16] J.M. Larrahondo, H. Choo, S.E. Burns, Laboratory-prepared iron oxide coatings on
Table 5Fitting coefficients and R2 values of the proposed correlation between initial and final setting times to and the fitted parameters in the Vs evolution methods.
Fitting method Correlation to ti/tf Data in this study Data from Carette and Staquet [11]
k b R2 k b R2
Cumulative lognormal tf= k ⋅ tpeak′+ b 0.96 0.17 0.979 1.37 −0.11 0.861Modified Fredlund and Xing 0.96 −0.09 0.982 1.13 1.09 0.836Cumulative lognormal ti= k ⋅ tpeak″+ b 1.04 1.05 0.950 1.39 1.92 0.742Modified Fredlund and Xing 1.03 1.09 0.937 1.45 1.25 0.648Modified Fredlund and Xing ti= k ⋅ a+ b 0.70 −0.50 0.981 0.75 1.59 0.697
J. Zhu et al. Cement and Concrete Research 106 (2018) 1–11
10

sands: submicron-scale small-strain stiffness, Eng. Geol. 121 (2011) 7–17.[17] X. Kang, B. Bate, Shear wave velocity and its anisotropy of polymer modified high
volume class F fly ash-kaolinite mixtures, J. Geotech. Geoenviron. 142 (12) (2016),http://dx.doi.org/10.1061/(ASCE)GT.1943-5606.0001562, 04016068 ASCE(IF=2.464).
[18] J. Zhu, Determination of Setting Times by Shear Wave Velocity Evolution in FreshMortar Using Bender Element Method, Department of Civil, Architectural, andEnvironmental Engineering, Missouri University of Science and Technology, Rolla,MO, USA, 2015.
[19] B.M. Montoya, R. Gerhard, J.T. DeJong, D.W. Wilson, M.H. Weil, B.C. Martinez,L. Pederson, Fabrication, operation, and health monitoring of bender elements foraggressive environments, Geotech. Test. J. 35 (2012).
[20] X. Kang, G.-C. Kang, B. Bate, Closure to "discussion of "measurement of stiffnessanisotropy in kaolinite using bender element tests in a floating wallConsolidometer" by X. Kang, G.-C. Kang, and B. Bate" by Coffman, Salazar andZhao, Geotech. Test. J. 39 (2016) 1079–1083.
[21] S. Liu, J. Zhu, S. Seraj, R. Cano, M. Juenger, Monitoring setting and hardeningprocess of mortar and concrete using ultrasonic shear waves, Constr. Build. Mater.72 (2014) 248–255.
[22] S. Yamashita, T. Kawaguchi, Y. Nakata, T. Mikami, T. Fujiwara, S. Shibuya,Interpretation of international parallel test on the measurement of G max using
bender elements, Soils Found. 49 (2009) 631–650.[23] J.-S. Lee, J.C. Santamarina, Bender elements: performance and signal interpreta-
tion, J. Geotech. Geoenviron. 131 (2005) 1063–1070.[24] B. Bate, H. Choo, S.E. Burns, Dynamic properties of fine-grained soils engineered
with a controlled organic phase, Soil Dyn. Earthq. Eng. 53 (2013) 176–186.[25] J. Marjanovic, J. Germaine, Experimental study investigating the effects of setup
conditions on bender element velocity results, Geotech. Test. J. 36 (2013) 187–197.[26] J.C. Santamarina, K.A. Klein, M.A. Fam, Soils and Waves: Particulate Materials
Behavior, Characterization and Process Monitoring, John Wiley & Sons Ltd, NewYork, NY, USA, 2001.
[27] C. Vipulanandan, V. Garas, Electrical resistivity, pulse velocity, and compressiveproperties of carbon fiber-reinforced cement mortar, J. Mater. Civ. Eng. 20 (2008)93–101.
[28] W. Weibull, A statistical distribution function of wide applicability, J. Appl. Mech.Trans. 18 (1951) 293–297.
[29] L.H. Ahrens, The lognormal distribution of the elements (a fundamental law ofgeochemistry and its subsidiary), Geochim. Cosmochim. Acta 5 (1954) 49–73.
[30] P.G. Moschopoulos, The distribution of the sum of independent gamma randomvariables, Ann. Inst. Stat. Math. 37 (1984) 541–544.
[31] D.G. Fredlund, A. Xing, Equations for the soil-water characteristic curve, Can.Geotech. J. 31 (1994) 521.
J. Zhu et al. Cement and Concrete Research 106 (2018) 1–11
11


![Engineering Behavior and Characteristics of Water …web.mst.edu/~bateba/Bate_Js/Bate2016Sustainability.pdfenhanced oil recovery [39–41]. Considering their lower cost and higher](https://img.pdfslide.net/doc/110x75/5f7ee071038f5d0c0c35d3b6/engineering-behavior-and-characteristics-of-water-webmstedubatebabatejsba.jpg)