Embed Size (px)
Citation preview
Cement & Concrete Composites 32 (2010) 783–793
Contents lists available at ScienceDirect
Cement & Concrete Composites
journal homepage: www.elsevier .com/locate /cemconcomp
Influence of curing time on the chloride penetration resistance of concretecontaining rice husk ash: A technical and economical feasibility study
A.L.G. Gastaldini *, G.C. Isaia, A.P. Saciloto, F. Missau, T.F. HoppeFederal University of Santa Maria, 97105-900 Rio Grande do Sul, Brazil
a r t i c l e i n f o a b s t r a c t
Article history:Received 21 January 2010Received in revised form 2 August 2010Accepted 3 August 2010Available online 10 August 2010
Keywords:ConcreteRice husk ashMineral additionsChloride penetration
0958-9465/$ - see front matter � 2010 Elsevier Ltd. Adoi:10.1016/j.cemconcomp.2010.08.001
* Corresponding author. Tel.: +55 55 3220 8144; faE-mail addresses: [email protected], algg
Gastaldini).
This study investigates the influence of the curing time on the chloride penetration behavior of concreteproduced with different concentrations of rice husk ash. Compressive strength and chloride penetrationat 91 days were assessed according to ASTM C1202. Concentrations of 10%, 20% and 30% of rice husk ashwere used and the results were compared with a reference mix with 100% Portland cement and with twoother binary mixes with 35% fly ash and 50% ground blast furnace slag. Increases in rice husk ash contentproduced lower Coulomb charge values. Longer curing times reduced Coulomb charges values for allmixes investigated. However, the extent of the effect of curing times on compressive strength and chlo-ride penetration in concrete is related to the type of mineral addition, the concentration of the substitu-tions used, the w/b ratio and the curing time used. This behavior points at an optimal curing period foreach type of binder to meet specific technical and economical criteria, namely durability and compressivestrength specifications for the structure.
� 2010 Elsevier Ltd. All rights reserved.
1. Introduction
The partial substitution of mineral additions such as rice huskash, blast furnace slag and fly ash for cement helps lower CO2 emis-sions [1] and reduces the need for fresh materials. This can alsolower the cost of final products and provide an end-use for indus-trial waste, thus contributing towards sustainable developmentpractices [2].
The physical benefits resulting from the addition of these mate-rials to concrete make their use mandatory in many cases [3],regardless of any economical and environmental considerations,given the fact that concrete is a structural material and as suchshould provide safety and meet its projected working life [4].When structures are designed and built to last, the need for main-tenance or replacement is reduced, which means the use of naturalresources and the production of waste are also reduced.
It follows that the design of a concrete structure should start byestablishing the environmental conditions to which the concretewill be exposed and in this way determine the concrete composi-tion and the building techniques that should be used to achievethe intended service life for a given structure. When concrete issubjected to external chemical attack, concrete porosity and per-meability should be reduced to decrease the rate of penetrationof aggressive agents and mitigate the effects of this aggression [5].
ll rights reserved.
x: +55 55 3220 [email protected] (A.L.G.
The penetration of aggressive agents, which is processedthrough different mechanisms, can be managed by the use of asuitably thick concrete layer made with a suitable composition.To ensure good chloride resistance, concrete with low ion diffusiv-ity should be used [4] and the pore structure of the concrete shouldhinder chloride penetration. The pore structure, in turn, is affectedby the type of the cement, the water/binder ratio, the degree ofhydration and the presence of mineral additions and chemical acti-vators, which can change the microstructure of the paste and thepaste-aggregate transition zone [6] and affect durability [7,8].
It is a well-known fact that the curing process contributes toimprove cement hydration and pozzolanic reactions while pre-venting the early water release from the pore interior [4]. This pro-cess creates a denser microstructure, with a smaller volume ofcapillary pores and results in concrete with lower permeability[5]. However, researchers do not yet agree on how long the curingprocess in concretes mixes with mineral additions should last [9].This period will depend on factors such as the curing type and tem-perature but also the type of addition used, the concentrations ofthe substitution for Portland cement, w/b ratios, weather condi-tions, building techniques and the desired properties (carbonation,chloride and sulfate resistance, mechanical strength).
The changes to chloride penetration promoted by the use ofmineral additions in concrete are related to factors such as thetype, content, thickness and curing conditions [10–18], on changesin pore solution composition and, therefore, in electrical conduc-tivity [19–22], in pore size [12,23,24] and capacity of combination,resulting in lower free chloride content [25–27].
784 A.L.G. Gastaldini et al. / Cement & Concrete Composites 32 (2010) 783–793
In addition to the technical benefits, the use of partial substitu-tions of mineral additions for cement also affects production costsbecause of their lower cost when compared with cement. In somecases, larger amounts of an admixture are required to achieve thesame consistency of a concrete without mineral addition.
The choice of a specific type of cementitious material such asrice husk ash, slag, fly ash, silica fume is guided chiefly by concernsof availability and the performance features specified for the con-crete at a given age, as well as production costs. The performanceof concrete with rice husk ash has been studied by several authors.However, only a few studies discuss the effects of curing time oncompressive strength, chloride penetration and cost of concrete.There are no comparative performance studies using mixtures withthe same compressive strength and concrete with fly ash and slag,which are which are often used in concrete.
The chloride penetration resistance of concrete mixtures withdifferent contents of rice husk ash submitted to different curingtimes was investigated according to ASTM C1202, [28]. Resultswere compared with a reference concrete (100% Portland cement)and with mixtures with substitutions of 35% fly ash or 50% slag forcement. These concentrations represent standard values of theseadditions in pozzolanic Portland cement and blast furnace Portland
Table 1Properties of cementitious materials.
Constituent/property Portlandcement
Rice huskash
Fly ash Slag
Loss on ignition (%) 2.09 5.0 1.16 0.71SiO2 (%) 19.59 90 64.57 34.98Al2O3 (%) 4.79 0.28 27.27 13.06Fe2O3 (%) 3.07 0.14 2.21 1.11CaO (%) 64.35 0.45 1.51 42.28MgO (%) 1.69 0.28 0.76 6.01SO3 (%) 2.75 0.02 0.06 0.11Na2O (%) 0.07 0.08 0.15 0.17K2O (%) 0.98 1.55 1.50 0.40Specific gravity (kg/dm3) 3.11 2.17 2.19 2.89BET – specific surface (m2/g) 1.48 4.0 2.32 1.07Compressive strength (MPa) – – –1 day 22.5 – – –3 days 35.1 – – –7 days 41.2 – – –28 days 49.6
Table 2Composition of the concrete mixtures.
Mixture w/b Rice husk ash (kg/m3) Portland cement (kg/m3) Slag (kg/m3)
10RHA 0.35 439 49 –0.50 323 36 –
REF 0.35 488 – –0.50 359 – –0.65 284 – –
10RHA 0.35 439 49 –0.65 255 28 –
20RHA 0.35 390 98 –0.50 287 72 –0.65 227 57 –
30RHA 0.35 342 146 –0.50 251 108 –0.65 199 85 –
35FA 0.35 317 – –0.50 233 – –0.65 184 – –
50S 0.35 244 – 2440.50 179 – 1790.65 142 – 142
Note: SP = superplastizer, slump of the concrete = 80 ± 10 mm.
cement manufactured in Brazil. According to Bryant et al. [29]specifications based on ASTM C1202 are common in the US con-crete construction industry. He states that the Virginia Departmentof Transportation is presently conducting a pilot program usingASTM C1202 as an end-use performance specification, whereasthe Port Authority of New York and New Jersey also uses ASTMC1202 in their concrete performance specifications.
This study also presents a comparative analysis of durability,resistance to chloride penetration and concrete costs with andwithout mineral additions, rice husk ash, fly ash and blast furnaceslag. This analysis was based on each mixture’s compressivestrength values, which is often used as a reference for designerswhen planning concrete structures. Therefore, mixtures with thesame compressive strength values (40 MPa, 50 MPa and 60 MPa)were analyzed.
2. Experimental program
2.1. Materials
The cementitious materials used in this paper were high-earlystrength Portland cement, rice husk ash produced in a thermalpower plant under controlled burning conditions, blast furnaceslag produced in a local steel mill plant and cooled using a wet pro-cess, and untreated fly ash from coal burned in a thermal powerplant. Their chemical compositions and physical properties ofthese materials are shown in Table 1.
The fine aggregate was natural sand with maximum character-istic size 2.36, fineness modulus of 2.06 and specific gravity of 2.60.The coarse aggregate was crushed basaltic rock with a maximumcharacteristic size of 19 mm, fineness modulus 6.67 and specificgravity of 2.50.
2.2. Mixture proportions
Six binder mixtures were investigated. The first with 100% Port-land cement (labeled reference mixture – REF), and the others withrice husk ash in concentrations of 10%, 20% and 30% (labeled10RHA, 20RHA, 30RHA, respectively), 35% fly ash (35FA) and 50%ground-granulated blast furnace slag (50S) by weight of cement.The substitution concentrations of the last two mixtures were
Fly ash (kg/m3) Water Fine agg. (kg/m3) Coarse agg (kg/m3) SP (%)
– 171 614 1076 0.50– 179 726 1055 0.20– 171 632 1076 0.20– 179 739 1055 –– 184 802 1043 –
– 171 614 1076 0.50– 184 791 1043 –
– 171 596 1076 0.95– 179 713 1055 0.50– 184 781 1043 0.30
– 171 579 1076 1.95– 179 700 1055 1.05– 184 771 1043 0.70
171 171 572 1076 0.25126 179 695 1055 0.1099 184 767 1043 –
– 171 616 1076 0.17– 179 728 1055 –– 184 793 1043 –

A.L.G. Gastaldini et al. / Cement & Concrete Composites 32 (2010) 783–793 785
chosen from the mean values used in the industrial production ofpozzolanic Portland cement and blast furnace Portland cement.Water/binder ratios were set at 0.35; 0.50 and 0.65 with ratios ofbinder: fine aggregate: coarse aggregate set at 1:3.5; 1:5.0 e1:6.5, respectively.
Table 2 presents the mass of materials used (kg/m3) in each ofthe binder mixtures tested. The amount of fine aggregate was ad-justed to compensate for the substitutions of Portland cement bymineral additions and to keep mortar content constant at 51%.The desired slump (80 ± 10 mm) of the different compositionswas obtained with the aid of a superplasticizer (modified carbox-ylic ether). RHA, because of its irregularly shaped particles and por-ous cellular surface, called for the use of larger amounts of SP.
The test specimens were prepared in a period of low tempera-ture and therefore the casting temperature was set at 18 �C. Tocontrol the temperature of the concrete, the mix water was heatedto match the temperature of the other materials [30].
2.3. Test details
Compressive strength values were determined in cylindricaltest specimens (100 � 200 mm) molded in a vibration table andtested according to the procedures listed in Brazilian standardsABNT NBR 5738 and 5739. The test specimens were stored in awet chamber, with temperature set at 23 ± 2 �C and relativehumidity greater than 95% for the curing times of the test (3, 7and 28 days). They were then stored in the laboratory until the testperiod of 91 days was reached. Four specimens from each mixturewere tested at each testing age.
Chloride-ion penetration was measured according to ASTMC1202 [28] using cylindrical concrete test specimens measuring95 mm � 150 mm, which were cast and cut to standard sizes(95mm � 51 mm) using a diamond saw. For each of the six bindermixtures, water/binder ratios (0.35, 0.5, 0.60) and curing times,
Table 3Compressive strength at 28 and 91 days for different curing times in wet chamber and co
Mixture Curing time(days)
Compressive strength (MPa) Cost/m3 US($)
28 days
w/b w/b
0.35 0.50 0.65 0.35 0.50
REF 3 40.2 32.8 20.4 126.12 94.987 45.8 40.7 24.1 C ¼ 2
4:28 53.7 47.3 27.6
R2 = 0
10RHA 3 49.9 34.2 19.6 136.31 100.27 60.1 43.2 26.0 C ¼ 2
5:28 68.1 46.9 31.7
R2 = 0
20RHA 3 62.0 42.3 20.1 151.08 107.77 68.2 47.7 24.5 C ¼ 2
6:28 72.0 52.3 33.2
R2 = 0
30RHA 3 58.7 41.2 21.9 182.61 120.87 61.3 44.9 23.2 C ¼ 3
8:28 67.4 50.1 29.9
R2 = 0
35FA 3 54.9 23.8 13.8 99.73 76.697 55.1 28.5 14.2 C ¼ 1
4:28 58.2 36.6 16.7
R2 = 0
50S 3 46.3 30.8 20.2 97.00 74.247 49.3 32.8 21.8 C ¼ 1
3:28 52.8 35.2 23.2
R2 = 0
A = A and B are coefficients of equations compressive strength = A/Bw/b. r2 = coefficients o
two specimens at the age of 91 days were tested, and their meanwas used as a representative value as long as the standards con-cerning the difference in those results were met.
3. Results and discussion
3.1. Compressive strength
Table 3 shows the results of compressive strength for differentcuring times, and the equations Cs = A/Bw/b, which were obtainedfrom the correlations between the compressive strength valuesand w/b ratios and their corresponding coefficients of determina-tion R2 at the age of 28 and 91 days.
The results confirm the observations of other researchers[17,31,32]. Rice husk ash is considered a highly reactive pozzolan,since all the mixtures in which the cement was replaced with thismineral addition showed better performance than the referencemixture in the three substitutions used and in the three w/b ratios,at 28 and 91 days. Other researchers have found higher values at7 days [33,34] and at 3 days [31], when compared with the refer-ence mixture. The higher compressive strength of RHA concretewhen compared with the reference sample can be attributed to areduction in porosity, lower CH and reduced width of the interfacebetween the paste and the aggregate [35].
When compared with the mixture with 30% FA, compressivestrength values for the mixture with 35% RHA are 7–79% higherat 28 days and 11–55% higher at 91 days. This can be explainedby the greater fineness and the larger amounts of amorphous silicafound in RHA when compared with fly ash.
An increase in compressive strength from 28 to 91 days is ob-served. However, the rate of increase is related to several factors,such as the reactivity of each addition, the concentration of thesubstitution, the w/b ratio and the curing time used in the concrete,as other researchers also observed [36–38].
st/m3 for w/b ratios equal to 0.35, 0.50 and 0.65.
Compressive strength (MPa)
91 days
w/b CoefficientsA
0.065 0.35 0.50 0.65 A B r2
80.41 59.2 40.3 30.3 127.20 9.32 0.984509:10539483113w=b
64.3 48.9 33.9 137.80 8.45 0.999967.9 51.4 35.0 149.73 9.11 0.9957
.9787
3 81.02 60.5 44.0 31.7 128.80 8.62 0.996446:18694663935w=b
71.5 54.2 32.9 183.52 13.30 0.998276.4 62.1 38.6 177.19 9.73 0.9903
.9848
3 86.95 71.8 49.3 29.9 203.69 18.54 0.999181:946510306542w=b
81.4 55.4 35.6 215.68 15.75 0.996985.6 62.9 41.7 201.52 10.99 0.9998
.9799
3 94.65 63.0 48.4 29.0 162.34 13.28 0.996782:19049940184w=b
66.7 55.1 31.7 168.74 11.94 0.981578.9 65.1 37.3 200.94 12.15 0.9816
.9738
64.17 57.0 31.6 20.8 179.57 28.80 0.973964:48330348230w=b
60.0 43.7 22.8 196.13 25.16 0.997466.8 44.6 24.1 227.32 29.91 0.9997
.9857
64.02 54.7 40.6 25.7 135.59 12.40 0.999854:407561995031w=b
58.0 44.2 27.0 146.84 12.79 0.998061.8 46.1 29.0 153.70 12.45 0.9996
.9767
f determination.
786 A.L.G. Gastaldini et al. / Cement & Concrete Composites 32 (2010) 783–793
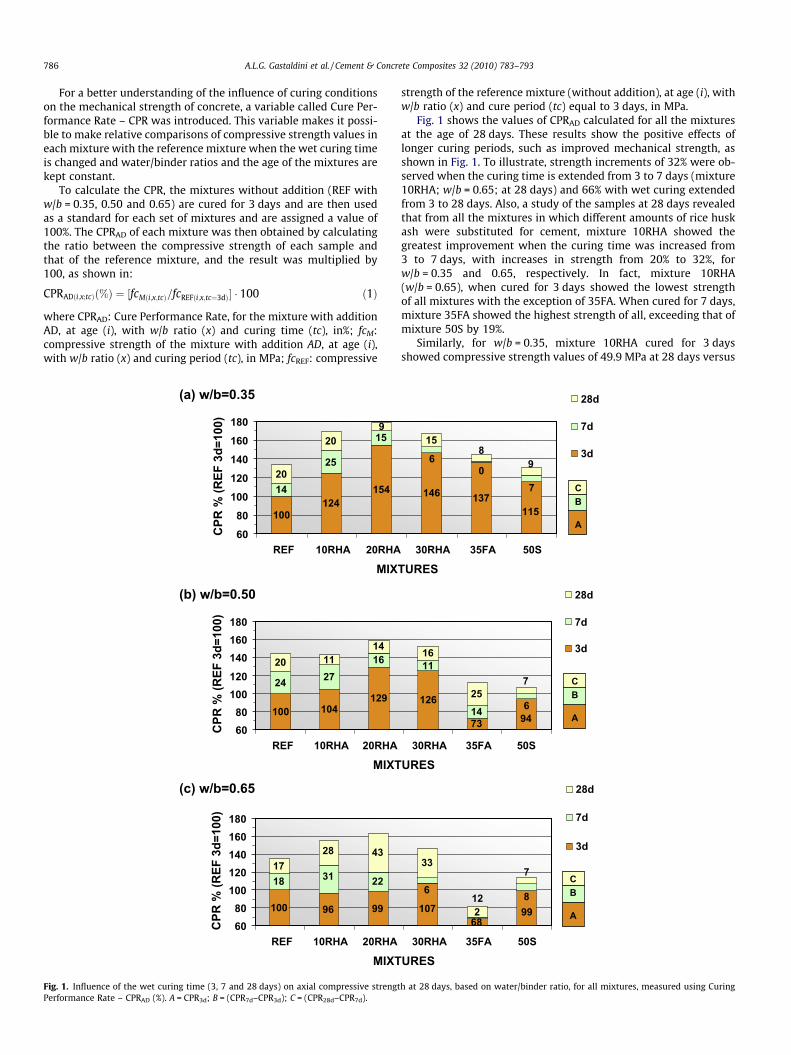
For a better understanding of the influence of curing conditionson the mechanical strength of concrete, a variable called Cure Per-formance Rate – CPR was introduced. This variable makes it possi-ble to make relative comparisons of compressive strength values ineach mixture with the reference mixture when the wet curing timeis changed and water/binder ratios and the age of the mixtures arekept constant.
To calculate the CPR, the mixtures without addition (REF withw/b = 0.35, 0.50 and 0.65) are cured for 3 days and are then usedas a standard for each set of mixtures and are assigned a value of100%. The CPRAD of each mixture was then obtained by calculatingthe ratio between the compressive strength of each sample andthat of the reference mixture, and the result was multiplied by100, as shown in:
CPRADði;x;tcÞð%Þ ¼ ½fcMði;x;tcÞ=fcREFði;x;tc¼3dÞ� � 100 ð1Þ
where CPRAD: Cure Performance Rate, for the mixture with additionAD, at age (i), with w/b ratio (x) and curing time (tc), in%; fcM:compressive strength of the mixture with addition AD, at age (i),with w/b ratio (x) and curing period (tc), in MPa; fcREF: compressive
(a) w/b=0.35
124154
15209
100
14
2520
6080
100120140160180
REF 10RHA 20RHA
MIX
CPR
% (R
EF 3
d=10
0)
(b) w/b=0.50
104129
24 271620 1114
100
6080
100120140160180
REF 10RHA 20RHA
MIXT
CPR
% (R
EF 3
d=10
0)
(c) w/b=0.65
96 99
18 2217
43
100
31
28
6080
100120140160180
REF 10RHA 20RHA
MIXT
CPR
% (R
EF 3
d=10
0)
Fig. 1. Influence of the wet curing time (3, 7 and 28 days) on axial compressive strengtPerformance Rate – CPRAD (%). A = CPR3d; B = (CPR7d–CPR3d); C = (CPR28d–CPR7d).
strength of the reference mixture (without addition), at age (i), withw/b ratio (x) and cure period (tc) equal to 3 days, in MPa.
Fig. 1 shows the values of CPRAD calculated for all the mixturesat the age of 28 days. These results show the positive effects oflonger curing periods, such as improved mechanical strength, asshown in Fig. 1. To illustrate, strength increments of 32% were ob-served when the curing time is extended from 3 to 7 days (mixture10RHA; w/b = 0.65; at 28 days) and 66% with wet curing extendedfrom 3 to 28 days. Also, a study of the samples at 28 days revealedthat from all the mixtures in which different amounts of rice huskash were substituted for cement, mixture 10RHA showed thegreatest improvement when the curing time was increased from3 to 7 days, with increases in strength from 20% to 32%, forw/b = 0.35 and 0.65, respectively. In fact, mixture 10RHA(w/b = 0.65), when cured for 3 days showed the lowest strengthof all mixtures with the exception of 35FA. When cured for 7 days,mixture 35FA showed the highest strength of all, exceeding that ofmixture 50S by 19%.
Similarly, for w/b = 0.35, mixture 10RHA cured for 3 daysshowed compressive strength values of 49.9 MPa at 28 days versus
146 137
15
115
6
70
89
30RHA 35FA 50S
TURES
28d
7d
3d
A
BC
126
11
14
16
25
73 946
7
30RHA 35FA 50S
URES
28d
7d
3d
A
BC
68
33
107 9986
2
7
12
30RHA 35FA 50S
URES
28d
7d
3d
A
BC
h at 28 days, based on water/binder ratio, for all mixtures, measured using Curing
A.L.G. Gastaldini et al. / Cement & Concrete Composites 32 (2010) 783–793 787
58.7 MPa for mixture 30RHA. However, these mixtures showedsimilar strength when cured for 7 days (60.1 MPa for 10RHA and61.3 MPa for 30RHA). A similar behavior is observed for w/b = 0.50.
When the concrete is cured for a longer time (28 days), thestrength of mixture 10RHA shows again the greatest increases forw/b = 0.35 and 0.50. However, for w/b = 0.65, mixture 20RHA wasthe one with the greatest increase after the extended curing time,with a rise of 66% in strength. For the same w/b ratio, sample10RHA also presents a large increase in strength (approximately61%), and this was also observed in samples 30RHA, with an in-crease of 36% when the curing period was extended from 3 to28 days.
For mixtures 35FA and 50S the increase in strength at 28 days isnot as great due to the specimens being stored longer in saturatedenvironments. The sole exception is mixture 35FA with w/b = 0.50,whose compressive strength values showed increases of 19% and
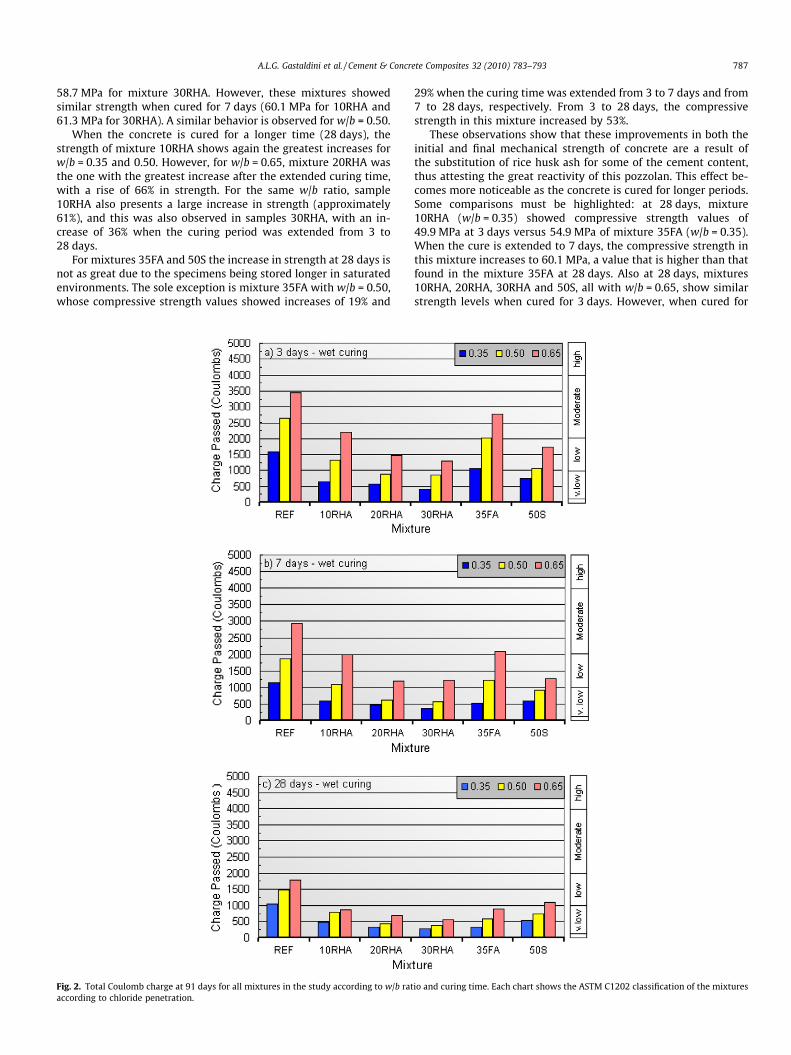
Fig. 2. Total Coulomb charge at 91 days for all mixtures in the study according to w/b rataccording to chloride penetration.
29% when the curing time was extended from 3 to 7 days and from7 to 28 days, respectively. From 3 to 28 days, the compressivestrength in this mixture increased by 53%.
These observations show that these improvements in both theinitial and final mechanical strength of concrete are a result ofthe substitution of rice husk ash for some of the cement content,thus attesting the great reactivity of this pozzolan. This effect be-comes more noticeable as the concrete is cured for longer periods.Some comparisons must be highlighted: at 28 days, mixture10RHA (w/b = 0.35) showed compressive strength values of49.9 MPa at 3 days versus 54.9 MPa of mixture 35FA (w/b = 0.35).When the cure is extended to 7 days, the compressive strength inthis mixture increases to 60.1 MPa, a value that is higher than thatfound in the mixture 35FA at 28 days. Also at 28 days, mixtures10RHA, 20RHA, 30RHA and 50S, all with w/b = 0.65, show similarstrength levels when cured for 3 days. However, when cured for
io and curing time. Each chart shows the ASTM C1202 classification of the mixtures

Table 4Coefficients C and D of equations Q = C/Dw/b and the coefficient of determination (r2)calculated according to the correlation between the total Coulomb charge (Q) and thew/b ratio of each mixture investigated and curing time in wet chamber.
Mixture Curing time (days) Total charge passed (Coulombs)
CoefficientsA
C D r2
REF 3 668.35 0.075 0.99787 387.09 0.044 0.994028 571.14 0.167 0.9939
10RHA 3 155.19 0.016 0.99697 142.08 0.017 0.986428 246.53 0.127 0.9425
20RHA 3 177.55 0.039 0.98797 142.33 0.041 0.952028 127.15 0.075 0.9816
30RHA 3 117.51 0.023 0.997 88.72 0.019 0.951028 113.28 0.085 0.9895
35FA 3 365.10 0.041 0.99767 109.23 0.010 0.998028 114.45 0.041 0.9980
50S 3 272.17 0.059 0.98027 258.24 0.085 0.999328 236.64 0.096 0.9859
A = C and D are coefficients of equations Q = C/Dw/b, r2 = coefficients ofdetermination.
788 A.L.G. Gastaldini et al. / Cement & Concrete Composites 32 (2010) 783–793
7 days, mixture 10RHA shows strength values of 8% to 19% higherthan the other mixtures. When the curing time is extended to28 days, mixture 20RHA shows the best performance, withstrength values now 5% higher than those of mixture 10RHA and33% higher than mixture 50S.
The results of these studies are not exhaustive in relation to theeffects of wet cure in the compressive strength of concrete mix-tures containing mineral additions. Concrete samples with fly ash(25% and 58%) and blast furnace slag (25% and 50%) seem to bemore sensitive to the absence of a wet cure than the concrete with-out additions, and the sensitivity of the concrete with mineraladditions to the elimination of a curing process is greater for highersubstitution contents [12]. However, experiments with concretewith 10% silica fume showed that the compressive strength of con-crete made with this pozzolan is not readily affected by a poor cure[39]. Other studies indicate that when a wet cure is used instead ofa dry cure, strength increases are higher in concrete mixtures withfly ash and blast furnace slag than in those with plain cement.
An overall view of the results of compressive strength in themixtures investigated shows that the reference mixtures and thosewith RHA are more sensitive to changes in wet curing conditions.However, the mechanical strength of mixtures 35FA and 50Sshows small variations when the period of cure is extended, withthe exception of mixture 35FA with w/b = 0.50.
It should be pointed out that while increases in the wet curingtime resulted in higher values of axial compressive strength in allmixtures in the study, the changes in the curing periods affect eachmixture differently. The increase in strength as a result of an ex-tended curing time is more visible in concretes with higher w/b ra-tios at 28 days.
Such behavior suggests the existence of an optimal curing timefor each type of addition. This should take into account technicaland economical criteria and will depend on the amount of substi-tution, the w/b ratio used and the specific age at which the con-crete mixture is to reach the desired strength threshold.
3.2. Chloride penetration resistance
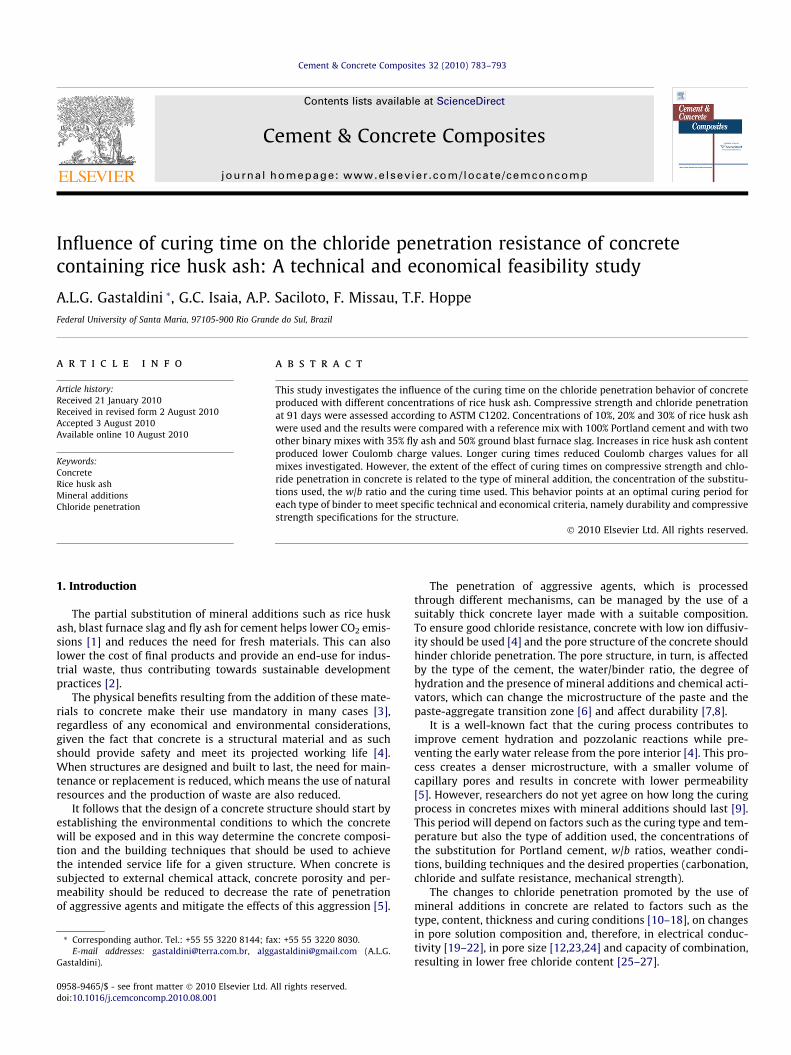
Fig. 2 presents the results of resistance to chloride penetrationand Table 4 the coefficients C and D of equations Q = C/Dw/b andthe coefficient of determination (r2) calculated according to thecorrelation between the total Coulomb charge (Q) and the w/b ratioof each mixture investigated.
Overall, the total Coulomb charge values show wide variabilitybetween the concretes with different compositions, w/b ratios andcuring times in the wet chamber. However, these results are in linewith the finding of other researchers about the reduction in Cou-lomb charge observed when mineral additions are substituted forcement [15,22,40].
The mixtures with RHA usually displayed Coulomb charge val-ues lower than those of the other mixtures in this study, and valuestended to decrease as the cement content decreases (i.e. with high-er substitution contents). The improved performance of RHA mix-tures was also observed by other researchers [17,41,42].
Longer curing times improved the quality of the concretes inthis study, according to the ratings proposed by ASTM C1202.Fig. 2 shows that the REF mixture (w/b = 0.50) falls within the mod-erate chloride penetration rating when cured for 3 days. When thecure is extended to 7 days, the same mixture is classified as ‘‘lowchloride penetration concrete”. Another good example is mixture10RHA, with w/b = 0.65. With a cure of 3 days, chloride penetrationis moderate but when the cure is 7 days, chloride penetration isclassified as low. When the cure is extended to 28 days, this mix-ture displays features of concretes with very low chloride penetra-tion. An identical case is mixture 35FA, with w/b = 0.50. Formixtures 20RHA and 30RHA and w/b = 0.65, the resistance to chlo-
ride penetration also increased when the curing time was extendedfrom 7 to 28 days, with their chloride penetration rating changingfrom low to very low.
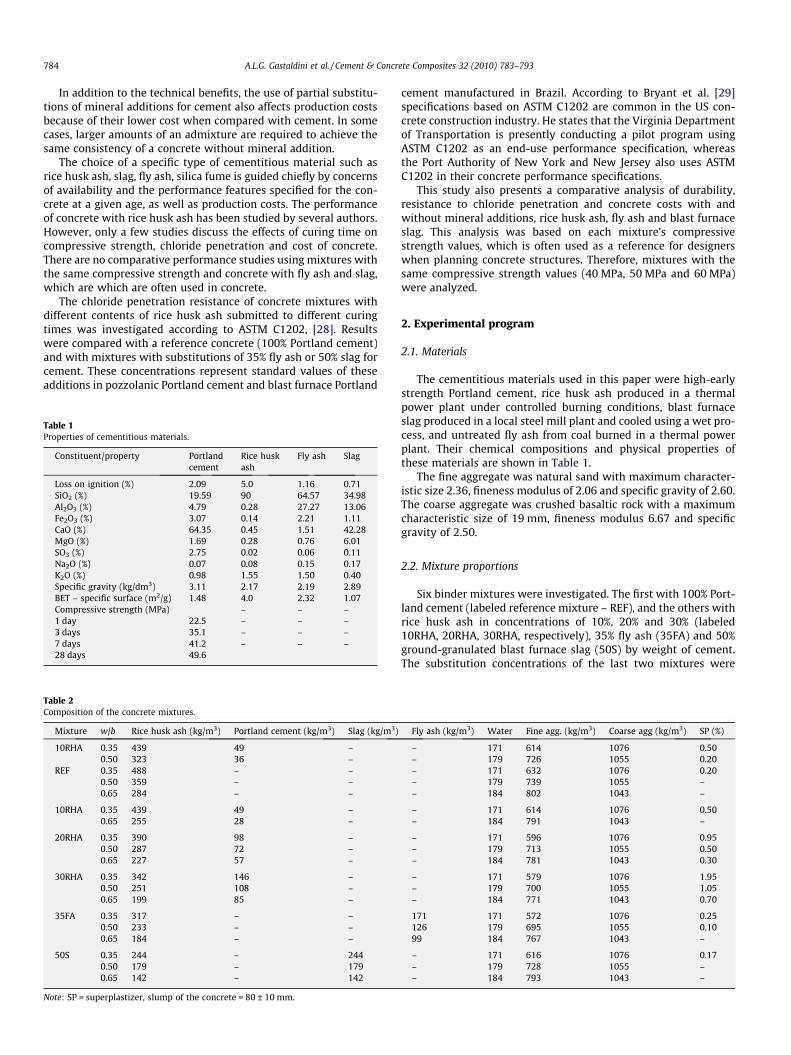
Fig. 3 shows the curves that correlate the total Coulomb charge(Q) versus the curing time adopted for all mixtures in this study.The displacement of the curves towards the smaller values of Qas the curing time is extended from 3 to 7 or 28 days can be clearlyseen. It can also be noted that this displacement follows the in-crease in water content in the mixture (as shown by the w/b ratio).A similar behavior was observed by other researchers [9].
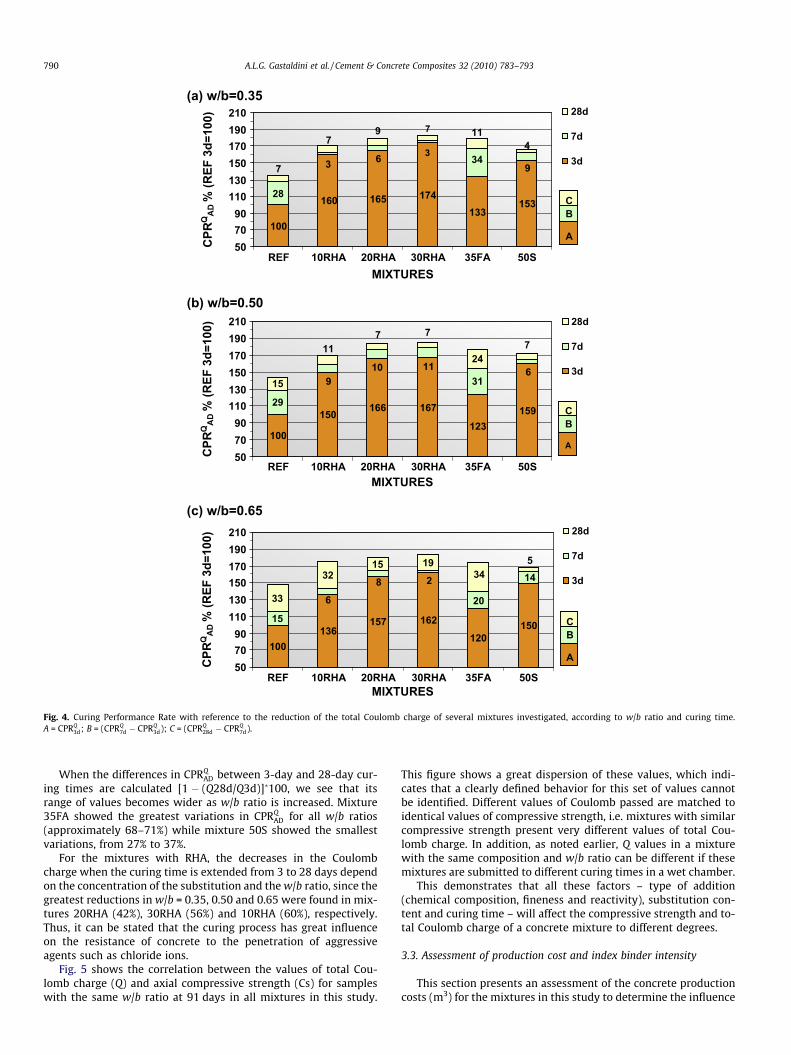
To better assess the influence of the wet curing time in the chlo-ride penetration resistance of concrete mixtures containing min-eral additions, the performance of each mixture is comparedwith the reference or control concrete. The variable Cure Perfor-mance Rate, related to the decrease in Coulomb charge (Q) andmeasured according to ASTM C 1202, offers a quantitative measureof the percent changes in the Coulomb charge as curing times areextended for each mixture at 91 days. Eq. (2) defines this variableas follows.
CPRQADði;x;tcÞð%Þ ¼ f�½ðQADði;x;tcÞ=QREFði;x;tc¼3dÞÞ � 1� � 100g þ 100 ð2Þ
where CPRQAD: Cure Performance Rate, related to the decrease in the
total Coulomb charge of the concrete with addition AD, at age (i),with w/b ratio (x) and curing time (tc), in%; QAD: Cure PerformanceRate of the concrete with addition AD, at age (i), with w/b ratio (x)and curing time (tc), in Coulombs; QREF: Total Coulomb charge ofthe reference concrete (without addition) at age (i), with w/b ratio(x) and curing time (tc) equal to 3 days. The negative sign at thebeginning of the equation means that the nominal value of the per-formance rate can better represent its technical meaning, i.e., theCoulomb charge values (QAD) below QREF indicate a good perfor-mance by the mixture with mineral addition AD in relation to theREF mixture, and CPRQ
AD should therefore be positive.Fig. 4 shows the cure performance rates calculated for each
mixture, according to their w/b ratio. It should be noted that inthe concrete mixtures with w/b = 0.35, mixture 35FA showed thegreatest improvement with the increase in curing time from 3 to

Fig. 3. Variation of total charge passed of each mixture investigated at 91 days based on w/b ratio and wet curing time.
A.L.G. Gastaldini et al. / Cement & Concrete Composites 32 (2010) 783–793 789
7 days, with a decrease of 51% in Coulomb charge. Nevertheless, fora cure of 28 days and the same w/b ratio, mixtures 20RHA and30RHA showed the greatest increase (approximately 14% whencompared with a curing time of 7 days).
For w/b = 0.50, when the curing time was extended from 3 to7 days, mixture 35FA again showed the greatest decrease in Cou-lomb charge (40%), followed by mixtures REF (29%), 30RHA (35%)and 20RHA (30%). When the curing time was extended from 7 to28 days, mixture 35FA showed a decrease of 51% in the Coulomb
charge and the mixtures with RHA in the three concentrations inthe test showed a mean decrease of 29%.
Of all mixtures with w/b ratio = 0.65, mixture 50S showed thegreatest decrease in Coulomb charge (approximately 27%) whenthe curing time was increased from 3 to 7 days. However, whenthe curing time was extended from 7 to 28 days, more signifi-cant decreases were observed in mixture 35FA (57%), followedby mixtures 10RHA (56%), 30RHA (54%), 20RHA (42%) and REF(39%).
(a) w/b=0.35
153133
174165160
100
3
28
6 9
343
7
4119
7
7
507090
110130150170190210
REF 10RHA 20RHA 30RHA 35FA 50SMIXTURES
CPR
QA
D % (R
EF 3
d=10
0) 28d
7d
3d
A
BC
(b) w/b=0.50
150 166 167
123159
29
15
100
6319
10 1111
7 7 7
24
507090
110130150170190210
REF 10RHA 20RHA 30RHA 35FA 50SMIXTURES
CPR
QA
D % (R
EF 3
d=10
0) 28d
7d
3d
A
BC
(c) w/b=0.65
136157 162
12015015
33
3219
100
86
2
20
1415
34 5
507090
110130150170190210
REF 10RHA 20RHA 30RHA 35FA 50SMIXTURES
CPR
QA
D % (R
EF 3
d=10
0) 28d
7d
3d
A
BC
Fig. 4. Curing Performance Rate with reference to the reduction of the total Coulomb charge of several mixtures investigated, according to w/b ratio and curing time.A = CPRQ
3d; B = (CPRQ7d � CPRQ
3d); C = (CPRQ28d � CPRQ
7d).
790 A.L.G. Gastaldini et al. / Cement & Concrete Composites 32 (2010) 783–793
When the differences in CPRQAD between 3-day and 28-day cur-
ing times are calculated [1 � (Q28d/Q3d)]�100, we see that itsrange of values becomes wider as w/b ratio is increased. Mixture35FA showed the greatest variations in CPRQ
AD for all w/b ratios(approximately 68–71%) while mixture 50S showed the smallestvariations, from 27% to 37%.
For the mixtures with RHA, the decreases in the Coulombcharge when the curing time is extended from 3 to 28 days dependon the concentration of the substitution and the w/b ratio, since thegreatest reductions in w/b = 0.35, 0.50 and 0.65 were found in mix-tures 20RHA (42%), 30RHA (56%) and 10RHA (60%), respectively.Thus, it can be stated that the curing process has great influenceon the resistance of concrete to the penetration of aggressiveagents such as chloride ions.
Fig. 5 shows the correlation between the values of total Cou-lomb charge (Q) and axial compressive strength (Cs) for sampleswith the same w/b ratio at 91 days in all mixtures in this study.
This figure shows a great dispersion of these values, which indi-cates that a clearly defined behavior for this set of values cannotbe identified. Different values of Coulomb passed are matched toidentical values of compressive strength, i.e. mixtures with similarcompressive strength present very different values of total Cou-lomb charge. In addition, as noted earlier, Q values in a mixturewith the same composition and w/b ratio can be different if thesemixtures are submitted to different curing times in a wet chamber.
This demonstrates that all these factors – type of addition(chemical composition, fineness and reactivity), substitution con-tent and curing time – will affect the compressive strength and to-tal Coulomb charge of a concrete mixture to different degrees.
3.3. Assessment of production cost and index binder intensity
This section presents an assessment of the concrete productioncosts (m3) for the mixtures in this study to determine the influence

0
500
1000
1500
2000
2500
3000
3500
4000
10 20 30 40 50 60 70 80 90 100Compressive strength (MPa)
Cha
rge
pass
ed (C
oulo
mb)
REF 10RHA 20RHA 30RHA 35FA 50S
Fig. 5. Total Coulomb charge versus compressive strength at 91 days for the samew/b ratio, for all mixtures and curing times in the study.
A.L.G. Gastaldini et al. / Cement & Concrete Composites 32 (2010) 783–793 791
of RHA content and curing time on compressive strength forstrength levels of 40 MPa, 50 MPa and 60 MPa, and chloride-ionpenetration resistance for use in civil construction. This behavioris compared with the reference mixture (100% Portland cement)and mixtures with fly ash and blast furnace slag. Compressivestrength is used as a standard by engineers and architects whendesigning concrete structures.
The total cost of one cubic meter of concrete as shown in Table 3was calculated using the cost for 1 metric ton of each component.The compressive strength and age of the concrete mixtures wereset at a fixed value and w/b ratios were calculated from equationsCS = A/Bw/b, whose coefficients for each mixture and curing timeare given in Table 3. Using the w/b ratios, the values of theCoulomb charge were calculated using equations B = C/Dw/b pre-sented in Table 4 and the cost/m3 was calculated using equationsC = G/Fw/b presented in Table 3.
When compared with the reference mixture (100% Portland ce-ment), the cost/m3 increases in mixtures 10RHA, 20RHA and30RHA and 3-day curing time for strength levels 40 MPa, 50 MPaand 60 MPa ranged from 1% to 22% (10RHA), 3% to 28% (20RHA)and 3.5% to 30% (30RHA), as shown in Table 5.
Table 5w/b ratio, total charge passed (C) and cost/m3 for levels of compressive strength of 40 MP
Compressivestrength
Curing time 3 days Cost (m3) Curing time 7 da
Mixture w/b Chargepassed (C)
Mixture w/b
40 MPa REF 0.52 2567 95.84 REF 0.5810RHA 0.54 1446 96.51 10RHA 0.5920RHA 0.56 1096 100.53 20RHA 0.6130RHA 0.54 906 117.10 30RHA 0.5835FA 0.44 1493 86.15 35FA 0.4950S 0.48 1056 79.42 50S 0.51
50 MPa REF 0.42 1982 111.35 REF 0.4710RHA 0.44 956 114.79 10RHA 0.5020RHA 0.48 845 116.48 20RHA 0.5330RHA 0.45 644 142.62 30RHA 0.4935FA 0.38 1232 94.09 35FA 0.4250S 0.40 842 88.73 50S 0.42
60 MPa REF 0.33 1570 127.45 REF 0.3910RHA 0.36 687 131.87 10RHA 0.4320RHA 0.42 695 130.10 20RHA 0.4630RHA 0.38 495 166.25 30RHA 0.4235FA 0.32 1017 102.77 35FA 0.3650S 0.32 672 99.12 50S 0.35
For the 7-day cure and the same levels of compressive strength,the increase in cost in relation to the reference mixture (100% Port-land cement) ranged from 0% to 1% (10RHA), 2.8% to 4.7% (20RHA)and 22.5% to 30.7% (30RHA). For the 28-day cure, only mixture30RHA showed cost increases ranging from 8.2% to 18%. Mixtures10RHA and 20RHA showed cost decreases from 4% to 6.2% and0.7% to 4.5% respectively.
Mixture 50S for the same strength levels (40, 50 and 60 MPa)and curing times (3, 7 and 28 days) showed cost decreases rangingfrom 17% to 22% for a 3-day cure and from 13% to 18% for the 7-and 28-day cure. For these same conditions mixture 35FA showscost reductions ranging from 10% to 22% (3-day cure), 8.6% to16.8% (7-day cure) and 8.6% to 18% (28-day cure). The increasesin cost observed in RHA mixtures can be explained by the cost ofthis ash and the need for larger amounts of superplasticizer addi-tive to achieve the required slump values, 80 ± 10 mm.
If the cost/m3 of the RHA mixture for a given strength level of amixture cured for 3 days is used as a standard and comparing thecost/m3 of the same mixture for the same compressive strengthlevels when the curing time is extended to 7 days, a reduction of8% is observed in the three concentrations of this substitution(10%, 20% and 30%). When the cure is extended from 7 to 28 days,there is a decrease in cost ranging from 7% to 10% in mixtures10RHA and 20RHA for the three levels of mechanical strengthinvestigated and from 12% to 14% for mixture 30RHA.
For the reference and 35FA mixtures, the reduction ranged from3% to 4% and for mixture 50S it was 2.7% for the three levels ofcompressive strength in the study. Thus, the cost reduction bym3 when the curing time is extended from 7 to 28 days for the ref-erence, fly ash or slag mixtures does not make up for the additionalamount that would be required for extending the curing time.
Mixture 50S presented Coulomb charge values similar to mix-ture 20RHA but at a lower cost/m3 for strength levels of 40 MPa,50 MPa and 60 MPa and curing times of 3, 7 and 28 days. Thereduction averaged 23% for a 3-day cure, 19% for a 7-day cureand 13% for the 28-day cure.
ACI 318 [43] states that for concrete exposed to freezing andthawing, the maximum w/b ratio is 0.45 and minimum f 0c P31 MPa. In contact with water requiring low permeability concrete(max w/b = 0.50 and min f 0c = 35.0 MPa) for sulfate exposure (maxw/b = 0.45–0.50 and min f 0c ¼ 27:6� 31:0 MPa); conditions requir-ing corrosion protection of reinforcement (max w/cm = 0.40 andmin f 0c = 35.0 MPa). Thus, mixture 50S (US$ = 88.73/m3) with a
a, 50 MPa and 60 MPa, and wet cure of 3, 7 and 28 days.
ys Cost (m3) Curing time 28 days Cost (m3)
Chargepassed (C)
Mixture w/b Chargepassed (C)
2366 87.59 REF 0.60 1668 85.01557 88.50 10RHA 0.65 950 79.75
997 91.68 20RHA 0.67 729 82.09874 107.28 30RHA 0.65 558 92.02
1046 80.05 35FA 0.51 564 77.73910 76.19 50S 0.53 829 74.11
1679 103.30 REF 0.50 1391 98.761081 103.44 10RHA 0.55 776 94.85
773 106.24 20RHA 0.58 573 96.89613 130.65 30RHA 0.56 447 112.08758 88.72 35FA 0.45 460 84.89728 86.30 50S 0.44 673 83.95
1308 116.48 REF 0.41 1200 113.04813 116.79 10RHA 0.48 658 107.09618 120.85 20RHA 0.50 470 112.27465 152.30 30RHA 0.48 374 133.55574 96.90 35FA 0.39 389 92.72613 95.09 50S 0.37 568 92.49

Table 6Consumption of binder materials and index binder intensity for levels of compressive strength 40 MPa, 50 MPa e 60 MPa and wet cure of 3, 7 and 28 days.
Compressivestrength
Curing time 3 days Binderintensity
Curing time 7 days Binderintensity
Curing time 28 days Binderintensity
Mixture w/b Binder(kg/m3)
Mixture w/b Binder(kg/m3)
Mixture w/b Binder (kg/m3)
40 MPa REF 0.52 355 8.9 REF 0.58 318 8.0 REF 0.60 307 7.710RHA 0.54 342 8.6 10RHA 0.59 313 7.8 10RHA 0.65 281 7.020RHA 0.56 330 8.3 20RHA 0.61 302 7.6 20RHA 0.67 271 6.830RHA 0.54 342 8.6 30RHA 0.58 318 8.0 30RHA 0.65 281 7.035FA 0.44 410 10 35FA 0.49 375 9.4 35FA 0.51 361 9.050S 0.48 381 9.5 50S 0.51 361 9.0 50S 0.53 348 8.7
50 MPa REF 0.42 425 8.5 REF 0.47 388 7.8 REF 0.50 368 7.410RHA 0.44 410 8.2 10RHA 0.50 368 7.4 10RHA 0.55 336 6.720RHA 0.48 381 7.6 20RHA 0.53 348 7.0 20RHA 0.58 318 6.430RHA 0.45 402 8.0 30RHA 0.49 375 7.5 30RHA 0.56 330 6.635FA 0.38 457 9.1 35FA 0.42 425 8.5 35FA 0.45 402 8.050S 0.40 441 8.8 50S 0.42 425 8.5 50S 0.44 410 8.2
60 MPa REF 0.33 500 8.3 REF 0.39 449 7.5 REF 0.41 433 7.210RHA 0.36 474 7.9 10RHA 0.43 417 7.0 10RHA 0.48 381 6.420RHA 0.42 425 7.1 20RHA 0.46 395 6.6 20RHA 0.50 368 6.130RHA 0.38 457 7.6 30RHA 0.42 425 7.1 30RHA 0.48 381 6.435FA 0.32 509 8.5 35FA 0.36 474 7.9 35FA 0.39 449 7.550S 0.32 509 8.5 50S 0.35 482 8.0 50S 0.37 465 7.8
792 A.L.G. Gastaldini et al. / Cement & Concrete Composites 32 (2010) 783–793
3-day cure, 50 MPa strength and w/b = 0.40 meets all requirementsfor freezing and thawing exposure, including maximum percent-age of total cementitious materials by weight. This mixture has a20% lower cost/m3 than the reference mixture, 100% Portlandcement, and it is given a ‘‘very low probability of chloride penetra-tion” rating by ASTM C 1202.
Table 6 shows the amount of cementitious materials and thebinder intensity index (bics) proposed by Damineli et al. [44] forcompressive strength values of 40 MPa, 50 MPa and 60 MPa andcuring times of 3, 7 and 28 days. The amount of cementitious mate-rials was calculated using equation CM = H/Iw/b, where H and I werecalculated from the correlation between the amounts of cementi-tious materials (488, 359 and 284) and w/b ratios (0.35, 0.50 and0.65).
The binder intensity index (bics) proposed by Damineli et al.[44] allows measuring the amount of binder necessary to delivera unit of strength, and consequently the efficiency of the use ofbinders. It is calculated using equation bics = b/p where b is the to-tal consumption of binder materials (kg m�3) and p is the perfor-mance requirement, compressive strength in this case.
This table shows that increases in compressive strength andcuring times resulted in lower bics in all mixtures in the study.The mixtures with RHA showed lower bics when compared withthe reference mixture for the three curing periods and compressivestrength values investigated, with the lowest bics observed in thesample with 20% RHA. The opposite behavior was observed in mix-tures 35FA and 50S, which showed higher bics when comparedwith the reference mixture for the three curing periods and com-pressive strength values investigated.
4. Conclusions
For the concrete tested in this study it was found that:In all the mixtures in which rice husk ash was substituted for
cement, compressive strength values were either equal to or higherthan those of the reference mixtures at both 28 and 91 days, attest-ing the great reactivity of this pozzolan. In slag and fly ash mix-tures, only those with w/b ratio = 0.35 at 28 days presented equalor better performance than the REF mixture.
The use of longer curing times resulted in higher compressivestrength values (28–91 days) for all the mixtures investigated.With the exception of mixtures with slag, all displayed significantstrength improvements. In the RHA mixtures, the increases accom-
panied the increase in w/b ratios. At 28 days, mixture 20RHA, curedfor 7 days, showed compressive strength values 32% higher thanthe mixture cured for 3 days. When the curing time of this mixturewas extended from 3 to 28 days an increase of 61% in compressivestrength followed.
Mixture 20RHA displayed the highest compressive strengthsvalues, while mixture 35FA displayed the lowest, at both 28 and91 days.
Longer curing times reduced Coulomb charge values for all mix-tures in the study, and again the reduction increased as w/b ratioswere increased. Mixtures REF and 35FA showed the highest reduc-tions in Coulomb charge values when the curing period was ex-tended from 3 to 28 days. In all RHA mixtures, the decreases inCoulomb charge values as the cure period was extended from 3to 28 days were 20%, 30% and 38% on average for w/b equal to0.35, 0.50 and 0.65, respectively.
The increase in the content of rice husk ash reduced Coulombcharge values, resulting in concrete with higher resistance to chlo-ride penetration.
In the present study, both the mixtures with additions andthose with Portland cement only were influenced by longer wetcuring times. However, the magnitude of the curing effects uponmechanical strength and resistance to chloride penetration de-pended on the type of mineral addition, the amount of substitu-tion, the w/b ratio and the curing time used. This behavior pointsat the existence of an optimal curing time for each type of binder(cement + addition) to meet technical and economic criteria, whichdepend on the designed durability and mechanical strength for agiven structure.
For a given compressive strength level, longer curing times re-sulted in lower cost/m3 and increased chloride penetration resis-tance in all mixtures in the study. The mixtures with RHAdisplay better performance but depending on the curing timeused and level of compressive strength desired, higher w/b ratiosmay be necessary, which would adversely affect durability. For acompressive strength value of 50 MPa, mixture 50S cured for3 days showed lower cost/m3 when compared with mixturesRHA and REF and meets all ACI 318 requirements for durableconcrete.
The mixtures with 10%, 20% and 30% RHA showed lower binderintensity indexes when compared with the reference mixture. Themixture with 20% RHA showed the lowest binder intensity index ofall mixtures.

A.L.G. Gastaldini et al. / Cement & Concrete Composites 32 (2010) 783–793 793
Acknowledgements
The authors wish to thank CNPq (National Council for Scientificand Technological Development), CAPES (Coordination for theImprovement of Higher Education Personnel) and FAPERGS (Re-search Support Foundation of the State of Rio Grande do Sul) for re-sources and undergraduate research grants and also the companiesCimento Mizu, Cimento Itambé, Reitex, BK Energia and MBT fordonating the materials used in this study.
References
[1] Roskovic R, Bjegovic D. Role of mineral additions in reducing CO2 emission.Cem Concr Res 2005;35:974–8.
[2] Mehta PK. Role of pozzolanic and cementitious material in sustainabledevelopment of the concrete industry. In: Proceedings of the internationalconference on the fly ash, silica fume, slag and natural pozzolans. FarmigtonHilss: American Concrete Institute; 1998. p. 1–20 [SP 178].
[3] Bilodeau A, Malhotra VM. High-volume fly ash system: concrete solution forsustainable development. ACI Mater J 2000;97(1):41–8.
[4] Neville AM. Propriedades do concreto. 2nd ed. São Paulo: Pini; 1997. 828p.[5] Aïtcin PC. Concreto de alto desempenho. São Paulo: Pini; 2000. 667p.[6] Jambor J. Pore structure and strength development of cement composites. Cem
Concr Res 1990;20:948–54.[7] Saraswathy V, Muralidharan S, Thangavel K, Srinivasan S. Influence of activated
fly ash on corrosion-resistance and strength of concrete. Cem Concr Compos2003;25:673–80.
[8] Gastaldini ALG, Isaia GC, Gomes NS, Sperb JEK. Chloride penetration andcarbonation in concrete with rice husk ash and chemical activators. Cem ConcrCompos 2007;29(3):176–80.
[9] Battagin AF et al. Influência das condições de cura em algumas propriedadesdos concretos convencionais e de alto desempenho. In: Congresso Brasileiro doConcreto-IBRACON, 44, 2002. Brasília-DF. Anais. Brasília: Instituto Brasileiro doConcreto; 2002. p. 1 [CD-ROM].
[10] Mehta PK, Schiessl P, Raupach M. Performance and durability of concretessystems. In: Proceedings of the 9th international congress on the chemistry ofcements, vol. 1, New Delhi; 1992. p. 571–659.
[11] Sivasundaram V, Malhotra VM. Properties of concrete incorporating lowquantity of cement and high volumes of ground granulated slag. ACI Mater J1992;89(6):554–63.
[12] Ramezanianpour AA, Malhotra VM. Effect of curing on the compressivestrength, resistance to chloride ion penetration and porosity of concretesincorporating slag, fly ash or silica fume. Cem Concr Compos1995:125–33.
[13] Bijen J. Benefits of slag and fly ash. Constr Build Mater 1996(10):309–14.[14] Ampadu KO, Torii K, Kawamura M. Beneficial effect of fly ash on chloride
diffusivity of hardened cement paste. Cem Concr Res 1999;29:585–90.[15] Zhang MH, Bilodeau A, Malhotra VM, Kim KS, Kim JC. Concrete incorporating
supplementary cementing materials: effect on compressive strength andresistance to chloride-ion penetration. ACI Mater J 1999;96(2):181–9.
[16] Aldea CM, Young F, Wang F, Shah SP. Effects of curing conditions on propertiesof concrete using slag replacement. Cem Concr Res 2000;30:465–72.
[17] Nehdi M, Duquette J, El Damatty A. Performance of rice husk ash producedusing a new technology as a mineral admixture in concrete. Cem Concr Res2003;33:1203–10.
[18] Chindaprasirt P, Jaturapitakkul C, Sinsiri T. Effect of fly ash fineness oncompressive strength and pore size of blended cement paste. Cem ConcrCompos 2005;27:425–8.
[19] Shi C, Stegemann JA, Caldwell RJ. Effect of supplementary cementing materialson the specific conductivity of pore solution and this implications on the RapidChloride Permeability Test (AASHTO T277 and ASTM C1202) results. ACI MaterJ 1998;95(4):389–94.
[20] Shehata MH, Thomas MDA, Bleszynski RF. The effects of fly ash composition onthe chemistry of pore solution in hydrated cement pastes. Cem Concr Res1999;29:1915–20.
[21] Shi C. Effect of mixing proportions of concrete on its electrical conductivity andrapid chloride permeability test (ASTM C1202 or ASSHTO T277) results. CemConcr Res 2004;34:537–45.
[22] Wee TH, Suryavanshi AK, Tin SS. Evaluation of Rapid Chloride PermeabilityTest (RCPT) results for concrete containing Mineral Admixtures. ACI Mater J2000;97(2):221–32.
[23] Torii K, Kawamura, M. Pore structure and chloride permeability of concretescontaining fly ash, blast-furnace slag and silica fume. In: Malhotra VM, editor.Proceedings of the 4th international conference on fly ash, silica fume, slag andnaturals pozzolans in concrete, vol. 1, Istanbul. Detroit: American ConcreteInstitute; 1993. p. 135–50 [SP-132].
[24] Gastaldini ALG, Isaia GC. Chloride permeability of high performance concretewith mineral addition: binary and ternary mixtures. In: Internationalconference on high-performance concrete and performance quality ofconcrete, Gramado-RS. Proceedings of the 2nd cammet/aci internationalconference on HPC, vol. 1. Farmington Hils, Mi: American Concrete Institute;1999.
[25] Dhir RK, Mohr MAK, Dyer TD. Developing chloride resisting concrete usingPFA. Cem Concr Res 1997;27:1633–9.
[26] Wiens U, Breit W, Schiessl P. Influence of high silica fume and high fly ashcontents on alkalinity of pore solution and protection of steel againstcorrosion. In: Malhotra VM, editor. Proceedings of the internationalconference on the use of fly ash, silica fume, slag and other mineral by-products in concrete, 5th, Wisconsin. Detroit: American Concrete Institute;2v.v.1; 1997. p. 741–61 [SP-153].
[27] Luo R, Cai Y, Wang C, Huang X. Study of chloride binding and diffusion in GGBSconcrete. Cem Concr Res 2003;33:1–7.
[28] American Society for Testing Materials. Annual Book of ASTM Standards.Standard test method for electrical indication of concrete’s ability to resistchloride ion penetration: ASTM C 1202, Philadelphia; 2005.
[29] Bryant Jr JW, Weyers RE, Garza JM. In-place resistivity of bridge deck concretemixtures. ACI Mater J 2009;106(2):114–22.
[30] Mehta PK, Monteiro PJM. Concreto: microestrutura, propriedades e materiais.3rd ed. São Paulo: IBRACON; 2008. 674p.
[31] Hassan KE, Cabrera JG, Maliehe RS. The effect of mineral admixtures on theproperties of high-performance concrete. Cem Concr Compos2000:267–71.
[32] Yeau KY, Kim EK. An experimental study on corrosion resistance of concretewith ground granulate blast-furnace slag. Cem Concr Res 2005(35):1391–9.
[33] Güneyisi E, Özturan T, Gesoglu M. A study on reinforcement corrosion andrelated properties of plain and blended cement concretes under differentcuring conditions. Cem Concr Compos 2005(27):449–61 [Acho que não vaiservir].
[34] Feng Q et al. Efficiency of highly active rice husk ash on the high-strengthconcrete. In: Proceedings of the international congress on the chemistry ofcement, 11, 2003. Durban-South Africa. Durban: The Cement and ConcreteInstitute of South Africa; 2003. p. 816–22 [1 CD-ROM].
[35] Rodriguez de Sensale G, Reina D. Influencia de la incorporación deceniza de cáscara de arroz residual uruguaya como material cementíceosuplementario en hormigones de alto desempeño. In: Jornadas Sud-Americanas de Ingenieria Estructural, 31, 2004, Mendoza-Argentina. Anais.Mendoza, Argentina: Facultad de Ingeniería, Universidad Nacional de Cuyo;2004 [1 CD-ROM].
[36] Bouzoubaâ N, Fournier B. Concrete incorporating rice-husk ash: compressivestrength and chloride-ion penetrability. Materials Technology Laboratory,Ottawa, Canada; 2001. <http://www.ecosmartconcrete.com/>.
[37] Saraswaty V, Song Há-Won. Corrosion performance of Rice-husk ash blendesconcrete. Constr Build Mater 2007;21:1779–84.
[38] Zhang MH, Lastra R, Malhotra VM. Rice-husk ash paste and concrete: someaspects of hydration and the microstructure of the interfacial zone theaggregate and paste. Cem Concr Res 1996;26(6):963–77.
[39] Tan K, Gjörv OE. Performance of concrete under different curing conditions.Cem Concr Res 1996(26):355–61.
[40] Naik TR, Sing S, Ramme B. Mechanical properties and durability of concretemade with blended fly ash. ACI Mater J 1998;95(4).
[41] Coutinho JS. The combined benefits of CPF and RHA in improving thedurability of concrete structures. Cem Concr Compos 2003;25:51–9.
[42] Zhang MH, Malhotra VM. High-performance concrete incorporating rice-huskash as a supplementary cementing material. ACI Mater J 1996;93(6).
[43] ACI 318-08, Building code requirements for structural concrete andcommentary.
[44] Damineli BL, Kemeid FM, Aguiar PS, John VM. Measuring the eco-efficiency ofcement use. Cem Concr Compos 2010;32(8):555–62.