Embed Size (px)
Citation preview

ABSTRACT
The Qaidam basin is the largest topo-graphic depression inside the Tibetan plateau. Because of its central position, understanding the tectonic origin of the Qaidam basin has important implications for unraveling the formation mechanism and growth history of the Tibetan plateau. In order to achieve this goal, we analyzed regional seismic-refl ec-tion profi les across the basin and a series of thickness-distribution patterns of Cenozoic strata at different time slices. The fi rst-order structure of the basin is a broad Cenozoic syn-clinorium, which has an amplitude ranging from >16 km in the west to <4 km in the east. The synclinorium has expanded progressively eastward across the Qaidam region: from the western basin against the Altyn Tagh fault at 65–50 Ma to the eastern basin at 24 Ma. The half-wavelength of the regional fold complex changes from ~170 km in the west to ~50 km in the east. The formation of the synclinorium was induced by an older thrust system initi-ated ca. 65–50 Ma in the northern margin and a younger thrust system initiated ca. 29–24 Ma in the southern basin margin. Cenozoic upper-crustal shortening decreases eastward across basin from >48% in the west to <1% in the east; the associated strain rates vary from
3.2 × 10⁻¹⁵ s–1 to 1.3 × 10⁻¹⁷ s–1. The eastward decrease in upper-crustal shortening requires a progressive shift in crustal-thickening mech-anisms across Qaidam basin, from domi-nantly upper-crustal shortening in the west to dominantly lower-crustal shortening in the east. Although sedimentation began synchro-nously at 65–50 Ma across the entire basin, the initiation ages of the southern and northern basin-bounding structures are signifi cantly different; deformation started at 65–50 Ma in the north and at 29–24 Ma in the south. This information and the existing inference that the uplift of the Eastern Kunlun Range south of Qaidam basin began after 30–20 Ma imply that the Paleogene (65–24 Ma) Qaidam and Hoh Xil basins on both sides of the East-ern Kunlun Range may have been parts of a single topographic depression, >500 km wide in the north-south direction between the Qil-ian Shan and Fenghuo Shan thrust belts in the north and south. The development of this large Paleogene basin in central Tibet and its subsequent destruction and partitioning by the Neogene uplift of the Eastern Kunlun Range requires a highly irregular sequence of deformation, possibly controlled by preexist-ing weakness in the Tibetan lithosphere.
Keywords: Qaidam basin, Tibetan plateau, Eastern Kunlun Range, tectonics, deformation, upper crust, Cenozoic.
INTRODUCTION
With an average elevation of ~2800 m, the Cenozoic Qaidam basin is the largest topo-graphic depression inside the 5000-m-high Tibetan plateau (Figs. 1 and 2). Despite its cen-tral position in Tibet, the tectonic origin of the basin has been debated. Bally et al. (1986) sug-gested that the basin formed over a large Ceno-zoic synclinorium. Burchfi el et al. (1989) postu-lated a basement-involved thrust belt across the basin. Métivier et al. (1998) proposed that the Qaidam basin developed via stepwise jumping of the northern Tibetan plateau margin in the Miocene (i.e., the bathtub-fi lling model; also see Meyer et al., 1998; Tapponnier et al., 2001; Sobel et al., 2003). Yin et al. (2002) inferred that the Qaidam basin has become an internally drained basin since the Oligocene; the trapping of Qaidam sediments was accomplished by pro-gressive southward translation of the Altyn Tagh Range along the Altyn Tagh fault and the devel-opment of the Eastern Kunlun and Qilian Shan thrust belts (i.e., the sliding-door model). Wang et al. (2006) speculated that the Qaidam basin was extruded eastward from the Pamirs in west-ern Tibet to its present position, during which a longitudinal river was developed along the basin axis between ca. 31 and 2 Ma.
The above tectonic models make specifi c predictions regarding the deformation his-tory of the Qaidam basin and its relationship
For permission to copy, contact [email protected]© 2008 Geological Society of America
847
Cenozoic tectonic evolution of the Qaidam basin and its surrounding regions (Part 3): Structural geology, sedimentation, and regional
tectonic reconstruction
An Yin*
Structural Geology Group, School of Earth Sciences and Resources, China University of Geosciences, Beijing 100083, ChinaPermanent Address: Department of Earth and Space Sciences and Institute of Geophysics and Planetary Physics, University of California, Los Angeles, California 90095-1567, USA
Yu-Qi DangMin ZhangQinghai Oilfi eld Company, Dunhuang, Gansu Province, People’s Republic of China
Xuan-Hua ChenInstitute of Geomechanics, Chinese Academy of Geological Sciences, Beijing, People’s Republic of China
Michael W. McRivetteDepartment of Earth and Space Sciences and Institute of Geophysics and Planetary Physics, University of California, Los Angeles, California 90095-1567, USA
*Email: [email protected]
GSA Bulletin; July/August; v.120; no. 7/8; p. 847–876; doi: 10.1130/B26232.1; 19 fi gures; 1 table.

Yin et al.
848 Geological Society of America Bulletin, July/August 2008
050
0 km
Sou
th T
ian
Sha
n
thru
st b
elt
Talu
s-Fe
rgan
a
faul
t
Ku
nlu
n f
ault
Xiangshuihe-Xiaojiang
f
ault system
Kar
akax
faul
t
Karakoram fa
ult
Jial
i fau
lt
Ind
us-
Yalu
Su
ture
Jins
ha S
utur
e
Fau
lt; s
olid
wh
ere
kno
wn
,d
ash
ed w
her
e in
ferr
ed
Th
rust
fau
lt
Str
ike-
slip
fau
lt
No
rmal
fau
lt
Su
ture
Gan
zi fa
ult
Nam
che
Bar
awa
Red River fault
40
°N
Lak
e
Mai
n Fr
onta
l Thr
ust
Qia
ng
tan
g
terr
ane
Lh
asa
terr
ane
Qin
gh
aiL
ake
Xin
ing
bas
in
35
°N
30°N
80
°E8
5°E
90
°E9
5°E
10
0°E
Qai
dam
Bas
inH
oh
Xil
Basi
n
F
engh
uo
Sha
n th
rust
bel
t
Qil
ian
Sha
n-N
an S
han
thru
st belt
Ban
gong
-Nuj
iang
Sut
ure
Nor
th Q
aida
m T
hrus
t Sys
tem
Stu
dy A
rea
Lon
gsho
u Sh
an th
rust
Him
alay
a
R
an
ge
Pam
irs
Ind
ian
cra
ton
Nor
th C
hina
crat
on
Ta
rim
Ba
sin
Alty
n Ta
gh fa
ult
Tia
n S
han
Nan
ga P
arba
t
W. K
unlu
n S
han
K
Eas
tern
Ku
nlu
n
Sh
an
La
Qili
an S
han
Fig
. 2
Fig
ure
1. C
enoz
oic
tect
onic
map
of
the
Tib
etan
pla
teau
, mod
ifi ed
fro
m T
aylo
r et
al.
(200
3).
Cenozoic evolution of Qaidam Basin
Geological Society of America Bulletin, July/August 2008 849
to basin-bounding structures. For example, the models of Métivier et al. (1998) and Wang et al. (2006) treat the Qaidam basin as a rigid block, while the models of Bally et al. (1986) and Burchfi el et al. (1989) require the Qaidam basin to be highly deformable. With regard to the basin-bounding structures, the stepwise-jump model of Métivier et al. (1998) predicts the southern basin-bounding thrust belt to have initiated before the northern basin-bounding thrust belt. In contrast, the extrusion model of Wang et al. (2006) requires the basin-bounding faults to have initiated synchronously and that the central Qaidam basin contains an eastward propagating sequence of alluvial and fl uvial deposits between 33 and 3 Ma.
To evaluate the above models, we system-atically analyzed seismic-refl ection profi les and thickness-distribution patterns of Cenozoic strata across the Qaidam basin. The work presented here complements our three other companion studies surrounding the Qaidam basin, dealing with the Cenozoic southern Qilian Shan–Nan Shan thrust belt and early Paleozoic North Qai-dam ultrahigh pressure metamorphic belt to the north (Yin et al., 2008a, 2007b) and the Ceno-zoic Qimen Tagh thrust belt to the south (Yin et al., 2007a). The studies in Yin et al. (2008, 2007a) emphasize the interaction between basin development and the evolution of its bounding thrust systems. In contrast, the study presented in this paper discusses the structural evolution of the basin. We fi rst outline the geologic frame-work of the Qaidam basin. We then present our structural and sedimentological observations across the basin, and discuss the implications of our new observations for the Cenozoic tec-tonic reconstruction of the Qaidam basin and its relationship to the overall development of the Tibetan plateau. The Qaidam basin as discussed in this study is defi ned by its present morpholog-ical expression. Its boundaries in the Cenozoic may have changed through time, as implied in our study. All the shortening strain and the strain history obtained by this study are geographically specifi c for the present-day basin.
GEOLOGY OF THE QAIDAM BASIN
The Qaidam basin has a triangular geometry in map view, with an ~650 km northern margin, an ~700 km southern margin, and an ~300 km western margin (Fig. 1). Morphologically, the basin is bounded by the Qilian Shan, Altyn Tagh Range, and the Eastern Kunlun Range to the north, west, and south, respectively. Tectoni-cally, the basin is bounded by the Qilian Shan–Nan Shan thrust belt (Burchfi el et al., 1989; Tapponnier et al., 1990) in the north, the left-slip Altyn Tagh fault in the west (e.g., Meyer et
al., 1998; Yin et al., 2002; Cowgill et al., 2000, 2003, 2004a, 2004b; Cowgill, 2007), and the Eastern Kunlun thrust belt in the south (Jolivet et al., 2003; Yin et al., 2007a) (Figs. 1 and 2). The basement of the Qaidam basin is composed of Precambrian–Silurian metamorphic rocks, which were overlain by Devonian–Cenozoic sedimentary strata (Huang et al., 1996). The metamorphic rocks are exposed along the rims of the basin, including the early Paleozoic North Qaidam ultrahigh pressure metamorphic gneiss (e.g., Yang et al., 2001; Song et al., 2005; Zhang et al., 2005; Yin et al., 2007b).
Despite a relatively high geothermal gradi-ent in the uppermost part of the Qaidam basin, with values ranging from 31 to 70 mW/m, and a general decrease in heat fl ow from west to east (Nansheng, 2003), the mechanical strength of Qaidam lithosphere appears to be exceptionally strong, with an effective elastic thickness (Te) of ~70 km (Braitenberg et al., 2003). This Te value is signifi cantly greater than that of 10–30 km for the rest of the Tibetan plateau (Braitenberg et al., 2003). The unusual strength of the Qaidam basin may be attributed to a signifi cantly differ-ent lithospheric composition or the lack of fl uid in the lower crust. For example, the basement of Qaidam crust may be oceanic in composition (Hsü, 1988; Gehrels et al., 2003a, 2003b), or the lower crust may be fl uid poor (Jackson et al., 2004), making it exceptionally strong. Despite the unusually high strength, Qaidam crust is the thinnest in Tibet at ~45 km, as determined by several seismic studies (Zhu and Helmberger, 1998; Zhao et al., 2006; S.L. Li et al., 2006; Y.H. Li et al., 2006). The apparently high heat fl ow across the Qaidam basin could have been induced by hydrothermal circulation driven by the high topographic relief between the basin and its surrounding high mountain ranges (e.g., Person et al., 1996).
Cenozoic deformation of the Qaidam basin has been investigated in the past fi ve decades since the initial work of Sun and Sun (1959) (also see a review on the history of geologic research in the Qaidam basin by Huang et al., 1996). Paleomagnetic studies across the basin indicate no rotation along its northern margin and ~16º–20° clockwise rotation in the south-western basin in the Cenozoic (Dupont-Nivet et al., 2002; Chen et al., 2002; Halim et al., 2003; Sun et al., 2006). The variable rotation across the basin has been attributed to heterogeneous Cenozoic deformation (Yin et al., 2008). Ini-tiation of deformation across the basin appears to be diachronous. Bally et al. (1986) showed that the Altyn Tagh fault and the structures along the western edge of the Qaidam basin were active since the middle Eocene. In con-trast, Song and Wang (1993) inferred Neogene
initiation of thrusting in the southwestern the Qaidam basin.
The Qaidam basin preserves a complete record of Cenozoic sedimentation and has been the focus of numerous sedimentological and stratigraphic studies (Bally et al., 1986; Wang and Coward, 1990; Song and Wang, 1993; Huang et al., 1996; Zhang, 1997; Métivier et al., 1998; Xia et al., 2001; Yin et al., 2002; Sobel et al., 2003; Sun et al., 2005; Rieser et al., 2005, 2006a, 2006b; Zhou et al., 2006). For example, Cenozoic basin history has been established by analyzing thickness distribution (Huang et al., 1996), paleocurrent analysis (Hanson, 1998), lithofacies patterns (e.g., Zhang, 1997), sandstone petrology (Rieser et al., 2005), and 40Ar/39Ar detrital-mica ages (Rieser et al., 2006a, 2006b). In addition, Cenozoic chronos-tratigraphy of the basin has been investigated in detail by using fossils (i.e., spores, ostracods, and pollen), basin-wide seismic stratigraphic correlation, magnetostratigraphic studies, and fi ssion-track dating of detrital grains (Huo, 1990; Qinghai Bureau of Geology and Mineral Resources, 1991; Yang et al., 1992, 1997, 2000; Song and Wang, 1993; Huang et al., 1996; Xia et al., 2001; Nansheng, 2002; Sun et al., 1999, 2005). These studies suggest that Cenozoic sed-imentation in the Qaidam basin expanded east-ward from the Paleocene and early Eocene in the west and Miocene–Pliocene in the east, with its main depositional center consistently located along the central axis of the basin.
Early structural studies of the Qaidam basin based on interpretation of seismic profi les did not consider the role of thrust-related folding and the complexity of thrust-system geometry. This has led to relatively small amounts of total esti-mated shortening across the basin (i.e., ~10 km; Huang et al., 1996; Dang et al., 2003; Zhou et al., 2006). There has also been a lack of effort in evaluating relationships between syntectonic growth strata and Cenozoic contractional struc-tures that has hindered our understanding of the temporal development of the basin.
In this paper we present seven regional geo-logic cross sections and eight Cenozoic isopach maps (Fig. 3). Using these data, we show that Cenozoic sedimentation occurred synchro-nously across the basin since the Paleocene–early Eocene (65–50 Ma). However, initiation of deformation across the basin is diachronous, starting fi rst in the northwest at 65–50 Ma and subsequently propagating to the southern and eastern margins of the basin at 29–24 Ma.
STRUCTURAL GEOLOGY
In order to construct true-scale geologic cross sections, we fi rst interpreted seismic-refl ection

Yin et al.
850 Geological Society of America Bulletin, July/August 2008
86
°E9
2°E
10
0°E
98
°E4
0°N
36
°N
88
°E9
0°E
94
°E9
6°E
38
°N
34
°N
Alt
yn T
agh f
ault
Tu
la Eas
tern
Kunlu
n Go
lum
d-L
has
a
Hig
hw
ay
Hoh X
il B
asin
Bay
anha
r
Thr
ust
B
elt
Qim
en T
agh
Thr
ust
B
elt
Qili
an S
ha
n-
Nan
Sha
n T
hrus
t B
elt
Del
ingh
a B
asin
Qai
dam
Bas
inA
ntic
linor
ium
Nor
th Q
aida
m T
hrus
t Sys
tem
Suga
n B
asin
(sin
ce 4
9 M
a)
(sin
ce 6
5 M
a)
(sin
ce 1
59 M
a)(2
c)
Go
lmu
d
You
sha
Shan
Ran
ge
Ku
nlu
n f
ault
Yie
niu
gou
fault
(1a)
(4)
(sin
ce 2
3 M
a)
(sin
ce 4
9 M
a)
(sin
ce 1
59 M
a)
Adat
an t
hru
stN
arin
thr
ust
Qim
enta
gh t
hrus
t
(1b
)
(2b
/3)
Ayak
um
thru
st
(2a)
(5)
(sin
ce 3
1 M
a)
(sin
ce 1
59 M
a)(2
c)
Mag
nitu
de (
arro
w d
epar
ting
fro
m
nort
h), t
imin
g an
d so
urce
of
refe
renc
es fo
r ro
tati
on
01
00
50
Fig
ure
2. C
enoz
oic
tect
onic
map
of n
orth
ern
and
cent
ral T
ibet
, aft
er Y
in e
t al.
(200
7a, 2
007b
). T
he m
agni
tude
and
tim
ing
of r
otat
ion
rela
tive
to E
uras
ian
refe
renc
e po
le a
cros
s Q
aida
m a
nd H
oh X
il ba
sins
are
als
o sh
own.
Dat
a po
ints
: 1a
—no
clo
ckw
ise
rota
tion
rec
orde
d in
the
mid
dle
Eoc
ene–
earl
y O
ligoc
ene
stra
ta (
49–2
8.5
Ma)
(fr
om D
upon
t-N
ivet
et
al.,
200
2);
1b—
no c
lock
wis
e ro
tati
on r
ecor
ded
in t
he m
iddl
e E
ocen
e–ea
rly
Olig
ocen
e st
rata
(49
–28.
5 M
a) (
from
Dup
ont-
Niv
et, 2
002)
; 2a
—~1
4° c
lock
wis
e ro
tati
on s
ince
th
e en
d of
the
Pal
eoge
ne (
ca. 2
3 M
a) (
from
Che
n et
al.,
200
2);
2b/3
—to
~29
° cl
ockw
ise
rota
tion
sin
ce t
he L
ate
Jura
ssic
(fr
om C
hen
et a
l., 2
002;
Hal
im e
t al
., 20
03);
2c—
~15°
cl
ockw
ise
rota
tion
sin
ce t
he la
te O
ligoc
ene
(28.
5–23
Ma)
(fr
om C
hen
et a
l., 2
002)
; 4—
no r
otat
ion
thro
ugho
ut t
he C
enoz
oic
(fro
m S
un e
t al
., 20
06);
5—
~29°
clo
ckw
ise
rota
tion
si
nce
ca. 3
1 M
a.

Cenozoic evolution of Qaidam Basin
Geological Society of America Bulletin, July/August 2008 851
profi les in the time domains and then converted them to the depth domains using known veloc-ity values. The zero depth in all sections corre-sponds to a reference elevation of 2750 m. In general, the top 16–18 km of the interpreted sections were constructed based on seismic profi les (i.e., two-way traveltime equal to ~6 s), whereas sections below 16–18 km are drawn by downward projection of the structures imaged in the seismic profi les. The locations of the inter-preted seismic sections are shown in Figure 3 and examples of the seismic profi les analyzed in this study and their interpretations are shown in Figure 4. The age assignments of Cenozoic stratigraphic units and regionally correlative seismic refl ectors are shown in Table 1 (Yin et al., 2008, 2007a).
Interpreted Seismic Section 1
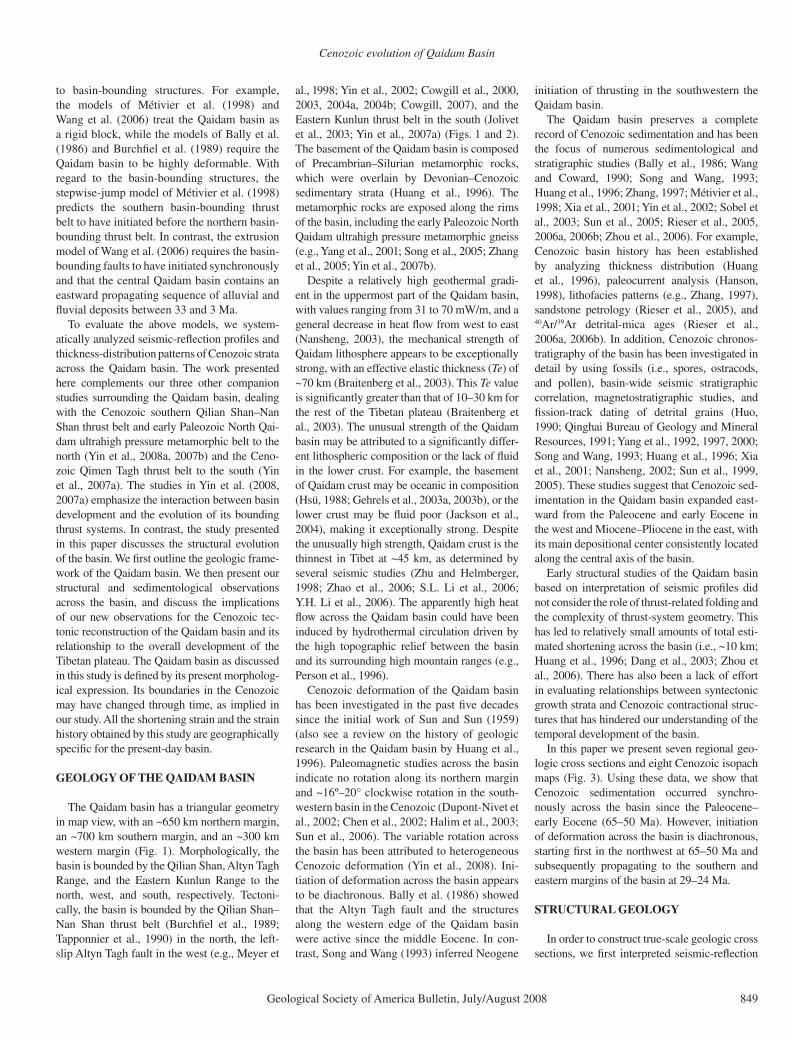
Structural GeologyThe overall architecture of section 1 is a
large-scale synclinorium that spans more than 170 km in the northeast-southwest direc-tion (i.e., the half-wavelength of the fold) and has >16 km amplitude (Fig. 5). The fold is expressed by broadly folded Pliocene and Quaternary strata in the top, with complex con-tractional structures in the Paleocene–Miocene strata below the fold limbs: in the south is a south-directed fault-bend-fold system and in the north is a passive-roof thrust duplex, part of the North Qaidam triangle zone (Fig. 5). The duplex system repeats Jurassic and Paleogene strata (Jr to E3–2) with its leading-edge thrust exposed in the North Qaidam thrust system (Yin et al., 2008). The Yousha Shan backthrust is a blind fault, terminating at a north-verging fault-propagation fold (Fig. 5); its maximum slip is ~2.5 km. Though counterintuitive, south-directed thrusts dominate the Qimen
Tagh Range, which bounds the Qaidam basin to the southwest (Yin et al., 2007a).
Tilting of the northern synclinorium limb can be explained easily by the development of a triangle zone in the northern basin. However, explaining the northward tilting of the southern synclinorium limb is more diffi cult. One possi-bility is that tilting was produced by motion on a north-dipping thrust ramp in the southern sec-tion. The tilting could alternatively be caused by thrusting on a deep-seated south-dipping fault (i.e., the inferred deep-seated Eastern Kunlun thrust in Fig. 5).
When considering cross-section balancing, the observed Cenozoic folds and thrusts may be explained by the presence of a basal thrust in the pre-Jurassic basement, which we refer to as the Main Qaidam detachment (Fig. 5). This fault consists of three ramps connected by two fl ats at depths of 12 and 28 km, respectively. Our proposed mid-crustal Main Qaidam detachment is broadly compatible with the similar concept proposed by Burchfi el et al. (1989) for the style of contractional deformation across the Qaidam basin. The difference between our fault and that postulated by Burchfi el et al. (1989) is that our detachment has a considerable variation of geometry in the basement from a simple sub-horizontal décollement.
It is also possible that the basement-involved thrusts in the Qaidam basin sole into the lower crust where the crustal strength is weakest, if it follows wet quartz rheology (Chen and Mol-nar, 1983). Alternatively, the Qaidam crust could have a mafi c composition or the lower crust may lack fl uid activity, making it strong enough to localize shear deformation (Jackson et al., 2004).
Growth-Strata Relationships and Timing of Deformation
Unit E1+2 was deposited across the entire Qaidam basin and exhibits growth-strata rela-tionships above the northern triangle zone (Fig. 5), suggesting the onset of deformation at 65–50 Ma in the northern section. The age of south-directed thrusting in the southern Qaidam basin is much younger, starting ca. 29 Ma, as indicated by growth strata of unit N1 associated with development of the south-verging fault-bend fold (Fig. 5).
Cenozoic Strain and Strain RateLine balancing of unit E1+2 yields 84 km
shortening (lower diagram of Fig. 5) and a short-ening strain of 32.3%. The strain was accommo-dated over 65–50 m.y., which yields an average strain rate of 1.5–2.0 × 10⁻¹⁶ s–1.
Y-08b
Fig. 4A SW-93
0 20 40 60 80 km
Golmud
Da Qaidam
Eastern Kunlun Range
Qilian Shan
98°E
38°N
96°E92°E
36°N
94°E
37°N
(1)(2)
(3)
(4)
(5)
90°E
Altyn Tagh fault
(6)
(7)
Northern margin of Qaidam
basin
m
e
Northern margin of Qaidam
basin
Southern margin of Qaidam basin
Qaidam Basin
Figure 3. Locations of seven seis-mic lines discussed in the text. Also shown are three seismic lines in Figure 4. Thick dashed lines show the present-day northern and southern margins of the Qaidam basin. SW-93—location of seismic line from Song and Wang (1993); Y-08b—location of geologic cross section from Yin et al. (2007a).
TABLE 1. MESOZOIC AND CENOZOIC STRATIGRAPHY OF QAIDAM BASINUnit names Symbol Geologic time AgeDabuxun Yanqiao Formation Q2 Holocene 0.01 Ma–present Qigequan Formation Q1 Pleistocene 1.8–0.01 Ma Shizigou Formation N2-3 Pliocene 5.3–1.8 Ma Shangyoushashan Formation N2-2 late Miocene 11.2–5.3 Ma Xiayoushashan Formation N2-1 early and middle Miocene 23.8–11.2 Ma Shangganchaigou Fm N1 late Oligocene 28.5–23.8 Ma Upper Xiaganchaigou Fm E3-2 early Oligocene 37–28.5 Ma Lower Xiaganchaigou Fm E3-1 middle Eocene–late Eocene 49–37 Ma Lulehe Fm E1+2 Paleocene–Early Eocene >54.8–49 Ma (Jurassic strata, locally overlain by Cretaceous beds)
Jr Jurassic-Cretaceous 206–65 Ma

Yin et al.
852 Geological Society of America Bulletin, July/August 2008
0.0
1.0
2.0
3.0
4.0
10
km
10
km
B
A C
Yoush
a S
han
bas
al t
hru
st
10
km
Fig
ure
4. E
xam
ples
of s
eism
ic li
nes
used
in th
is s
tudy
. (A
) Sec
tion
7. (
B) S
outh
ernm
ost s
egm
ent o
f sec
tion
3. (
C) N
orth
ernm
ost s
egm
ent o
f sec
tion
4. S
ee F
igur
e 3
for
loca
tion
s.
T0
to T
6 ar
e re
gion
ally
cor
rela
tive
sei
smic
refl
ect
ors;
the
ir r
elat
ions
hips
to
Mes
ozoi
c an
d C
enoz
oic
stra
tigr
aphi
c un
its
are
show
n in
Tab
le 1
. TW
TT
—tw
o-w
ay t
rave
ltim
e. T
0 to
T6
are
regi
onal
ly c
orre
lati
ve r
efl e
ctor
s. T
0 at
the
top
of th
e Sh
izig
ou fo
rmat
ion,
T1
at th
e to
p of
the
Shan
gyou
shas
han
form
atio
n, T
2 at
the
top
of th
e X
iayo
usha
shan
form
a-ti
on, T
3 at
the
top
of
the
Shan
ggan
chai
gou
form
atio
n, T
4 at
the
top
of
the
Upp
er X
iaga
ngch
aigo
u fo
rmat
ion,
T5
at t
he t
op o
f th
e L
ower
Xia
ganc
haig
ou f
orm
atio
n, T
R a
t th
e to
p of
the
Lul
ehe
form
atio
n, a
nd T
6 at
the
top
of
the
Jura
ssic
-Cre
tace
ous
stra
ta.
Cenozoic evolution of Qaidam Basin
Geological Society of America Bulletin, July/August 2008 853
Res
tore
d cr
oss
sect
ion
E3-1
E3-2
N1
JrN2-1
N2-2
Q1
E1+
2
pre
-Jr
04
812
16
20
km
E3-1
E3-2
N1
Jr
N2-1
N2-2
Q1
E1+
2
pre
-Jr
0 4 8 12
16
20
24
km
28
32
36
Yo
ush
a S
han
anti
clin
eN
ort
h Q
aid
am t
rian
gle
zo
ne
Qai
dam
sy
ncl
ino
riu
mG
row
th s
trat
a
N2-3
N2-3
Yo
ush
a S
han
bas
al t
hru
stY
ou
sha
Sh
an
bac
kth
rust
No
rth
Qai
dam
pas
sive
roo
f th
rust
Mai
n Q
aid
am d
etac
hm
ent
Tri
ang
le-z
on
e
bas
al t
hru
st
Dee
p-s
eate
d E
aste
rn
Ku
nlu
n t
hru
st (
?)
Fin
al s
ecti
on l
ength
= 1
73 k
m
Ori
gin
al s
ecti
on l
ength
= 2
57 k
m
Short
enin
g =
84 k
m
Short
enin
g s
trai
n =
32.3
%
SEC
TIO
N 1
0 4 8 12
16
20
24
km
28
32
36 Fig
ure
5. G
eolo
gic
cros
s se
ctio
n of
line
1 (
uppe
r di
agra
m)
and
the
rest
ored
sec
tion
(lo
wer
dia
gram
). S
ee F
igur
e 3
for
loca
tion
. The
tot
al a
mou
nt o
f sh
orte
ning
is 8
4 km
, wit
h a
shor
teni
ng s
trai
n of
32.
3%. J
r—Ju
rass
ic. S
ee T
able
1 f
or d
efi n
itio
n of
lith
olog
ic u
nits
.

Yin et al.
854 Geological Society of America Bulletin, July/August 2008
Mesozoic DeformationJurassic sedimentary strata are highly dis-
continuous with variable thickness along sec-tion 1. The sediments exhibit growth-strata geometry in half-grabens bounded by exten-sional faults with normal separation varying from 2 to 9 km. Because there are no matching cutoffs in the footwall basement rocks below the extensional structures, the above estimates are likely minimum values.
Interpreted Seismic Section 2
Structural GeologyThis section, located 40 km east of section 1,
exhibits a large synclinorium that has a smaller amplitude (~12 km) and broader fold geometry than that in section 1. In addition, the North Qaidam triangle zone changes from having dominantly north-directed thrusts in section 1 to dominantly south-directed thrusts in section 2.
Slip on the Yousha Shan backthrust is ~7 km, which is signifi cantly greater than ~2 km in sec-tion 1; the fault cuts the whole Cenozoic section rather than casting as a blind structure as in sec-tion 1 (Fig. 6; cf. Fig. 5). The backthrust could root below the Eastern Kunlun Range to the south, but continuous refl ectors across its down-ward projection preclude this possibility (Fig. 6).
Cenozoic strata are subhorizontal in the cen-tral part of the section and dip gently north-ward in the south (Fig. 6). Similar to section 1, Cenozoic deformation in the upper crust can be explained by the basement-involved thrusts soling into a basal décollement that has two fl ats and three ramps (i.e., the Main Qaidam detachment; Fig. 6), similar to those in section 1. Although the main thrust fl ats in both sec-tions lie at a depth of ~28 km, the main fl at in section 2 is signifi cantly longer and implies the trends of the connected thrust ramps in the Qai-dam basement are oblique to the thrust transport direction. As in section 1, a deep-seated south-dipping thrust may be below the Eastern Kunlun Range and the southern Qaidam basin (i.e., the deep-seated Eastern Kunlun thrust; Fig. 6).
Growth-Strata Relationships and Timing of Deformation
Unit E1+2 is only present on top of an anti-cline in the northern part of section 2 (Fig. 6). This relationship alone suggests that deposition of unit E1+2 predates the anticline. The lateral pinch-out geometry of unit E1+2 could have resulted from early synclinal folding that was later inverted into an anticline. This interpreta-tion suggests that the deformation in the north-ern part of the section started ca. 65–50 Ma dur-ing deposition of unit E1+2. Alternatively, the pinch-out geometry of unit E1+2 may have been
Yoush
a S
han
bas
al t
hru
st
0 4 8 12
16
20
24
km
0 4 8 12
16
20
24
km
28
32
36
04
812
16
20
km
28
32
36
E3-1
E3-2
N1
JrE
1+
2N
2-1
N2-2
Q1
Fin
al s
ecti
on l
ength
= 2
02 k
m
Ori
gin
al s
ecti
on l
ength
= 2
70 k
m
Short
enin
g =
68 k
m
Short
enin
g s
trai
n =
35.1
%
Res
tore
d cr
oss
sect
ion
N2-3
Yoush
a S
han
bac
kth
rust
Nort
h Q
aidam
pas
sive
roof
thru
st f
ault
-1
Mai
n Q
aidam
det
achm
ent
Tri
angle
-zone
bas
al t
hru
st
fault
-2
Dee
p-s
eate
d E
aste
rn K
unlu
n t
hru
st (
?)N
ort
h Q
aidam
tri
angle
zone
Qai
dam
syncl
inori
um
SEC
TIO
N 2
E3-1
E1+
2
pre
-Jr
pre
-Jr
pre
-Jr
Jr
E3-2
N1
N2-1
N2-2
Q1
N2-3
Fig
ure
6. G
eolo
gic
cros
s se
ctio
n of
line
2 (
uppe
r di
agra
m)
and
the
rest
ored
sec
tion
(lo
wer
dia
gram
). S
ee F
igur
e 3
for
loca
tion
. The
tot
al a
mou
nt o
f sh
orte
ning
is 6
8 km
, wit
h a
shor
teni
ng s
trai
n of
35%
. Jr—
Jura
ssic
. See
Tab
le 1
for
defi
nit
ion
of li
thol
ogic
uni
ts.

Cenozoic evolution of Qaidam Basin
Geological Society of America Bulletin, July/August 2008 855
induced by post-E1+2 synclinal folding and subsequent erosion of its limbs. This interpre-tation would imply a younger initiation age of deformation in the northern part of the section.
The thickness of unit E3–1 exhibits minor variation in section 2, the central portion being slightly thicker than that in the southern and northern parts of the section. This relationship suggests that a broad syncline with amplitude <1 km was developed during deposition of unit E3–1. Because the thickness of E3–1 does not change across the hanging wall of the basal thrust of the North Qaidam triangle zone, the initiation of this structure must postdate deposition of unit E3–1 (i.e., postdating late Eocene; see Table 1).
Thickness variation is more pronounced for unit E3–2 in section 2, which thickens at the synclinorium core in the section and thins toward the fold limbs. This suggests that the synclinal folding was still active during depo-sition of unit E3–2 (early Oligocene; see Table 1). A prominent change in the thickness of unit E3–2 occurs in the hanging wall of the triangle-zone basal thrust in the northern part of the section (Fig. 6), indicating initiation of the triangle zone during its deposition. This timing of deformation is signifi cantly younger than the initiation age of the triangle-zone structures in sections 1 and 3 at 65–50 Ma (see Figs. 5 and 7 and related discussion).
The passive-roof thrust of the triangle zone in the northern part of the section was initiated during deposition of unit N1 (late Oligocene; see Table 1). This is refl ected by a prominent change in the unit thickness across the fault: thinner in its hanging wall and signifi cantly thicker in its footwall (Fig. 6). The inferred Oligocene age is consistent with the growth-strata relationship across a minor north-dipping thrust (fault 1 in Fig. 6) that merges with the passive-roof fault; across the fault unit N1 is thicker in its footwall than in its hanging wall, suggesting motion on fault 1 and thus its kine-matically linked passive-roof fault was coeval with deposition of unit N1.
There is no observable thickness change across the Yousha Shan backthrust for units E3–1 and E3–2 in the southern part of the sec-tion (Fig. 6). Because unit N1 is only partially exposed in the hanging wall of the Yousha Shan backthrust, it is not possible to compare thickness variation across the fault. However, the constant thickness of units E3–1 and E2–3 across the backthrust suggests its initiation postdates their deposition (i.e., the backthrust is younger than early Oligocene). The exact age of initiation for the Yousha Shan backthrust may be obtained from the age of fault 2, which merges with the backthrust. Thinning of unit N1 at the crest of a fault-bend fold anticline associated
with fault 2 indicates that motion on this fault started during deposition of unit N1 (29–24 Ma) and has remained active (Fig. 6).
Strain and Strain RateThe total amount of shortening over the
~200 km section is 68 km, which yields a total shortening strain of 35%. Because most of this deformation occurred over a period of 29 m.y., it yields an average strain rate of 3.8 × 10⁻¹⁶ s–1.
Mesozoic StructuresThe overall Jurassic structure is a symmetric
graben, with Jurassic strata being thickest inside the graben and thinnest outside the graben. The section shows no evidence for reactivation of the early extensional faults by later thrusts, as they generally dip in the opposite directions (Fig. 6).
Interpreted Seismic Section 3
Structural GeologyThis section lies 46 km east of section 2
(Fig. 7). In sharp contrast to section 2, the domi-nant structures are north-directed thrusts rather than south-directed thrusts. The most prominent north-directed thrust is the North Qaidam passive-roof thrust, which cuts upward from the basement and fl attens into unit E3–1; its maximum dis-placement is <2 km (Fig. 7). Other north-directed thrusts either die out into fault-propagation folds of the Suppe and Medwedeff (1990) type or fault-bend folds of the Suppe (1983) type.
Like sections 1 and 2, the fi rst-order structure along section 3 is a large synclinorium. The fold amplitude is ~10 km, slightly less than that in section 2 (~12 km) and signifi cantly less than that in section 1 (>16 km). The magnitude of slip on individual faults cutting across the base of the Cenozoic strata is <2 km, which is insuf-fi cient to explain the observed fold amplitude. Thus, either deep-seated thrusts or distributed contraction is required in the middle and lower crust in the southern Qaidam basin to create the observed structural relief. To be consistent with the structural style observed in sections 1 and 2, we hypothesize a north-dipping thrust ramp below the northern edge of the Qaidam basin in the middle crust, which is equivalent to the triangle-zone basal thrust seen in sections 1 and 2 (Fig. 7A; cf. Figs. 5 and 6). The rest of the north-directed thrusts could either sole into a south-directed basal thrust as in sections 1 and 2 (i.e., the Main Qaidam detachment) (Fig. 7A), or into a north-directed and south-dipping thrust extending below the Eastern Kunlun Range (i.e., the Eastern Kunlun thrust) (Fig. 7C; cf. Fig. 5). In the fi rst interpretation (Fig. 7A), it is possible that the deep-seated south-dipping Eastern Kunlun thrust lies below the Main
Qaidam detachment; in this case the detachment transport direction is south directed. The second interpretation implies that the Qaidam lower crust has been subducted below the Eastern Kunlun Range and the Qilian Shan, predicting a top-north sense of shear on the detachment. In any case, both interpretations in Figures 7A and 7C require the presence of a subhorizontal detachment at a depth of ~28 km, but there is no need for a south-dipping basin-bounding thrust exposed at the surface along the southern Qai-dam basin margin.
Growth-Strata Relationships and Timing of Deformation
Unit E1+2 is thickest over the Qaidam syn-clinorium axis and thins southward to the Eastern Kunlun Range and northward over a fault-bend fold above the North Qaidam passive-roof thrust (Fig. 7A). The unit pinches out before reaching to the southern end of the section. The above rela-tionship suggests that the synclinorium and the triangle zone were both developed during deposi-tion of unit E1+2. This timing of deformation is similar to that for the northern part of section 1 at 65–50 Ma, but older than that for the northern part of section 2 at 29–24 Ma. Like in sections (1) and (2), the initiation age of deformation in the southern part of section 3 is younger at 29–24 Ma. This is indicated by the growth-strata relationship between unit N1 and the underlying anticline above the Adatan thrust (Fig. 7).
Strain and Strain RateThe total amount of shortening calculated by
line balancing of unit E3–1 is 41 km across the 190-km-long cross section. This yields a total shortening strain of 17%. Because this strain was accomplished since 65–50 Ma, it leads to an estimated average strain rate between 0.8 and 1.0 × 10⁻¹⁶ s–1.
Mesozoic StructuresSection 3 exhibits a horst structure in the cen-
ter bounded by listric normal faults with Jurassic strata deposited above the horst and in the fl ank-ing half-grabens (Fig. 7). The magnitude of nor-mal separation is ~3–4 km. The fanning geome-try of growth strata above extensional faults can be recognized in the section (Fig. 7A).
Interpreted Seismic Section 4
Structural GeologyThis section, located ~84 km east of section
3, exhibits a broad synclinorium with a much smaller amplitude (<5 km) than those in sec-tions 1 (>16 km), 2 (~12 km), and 3 (~10 km) (Fig. 8). In the north, section 4 is dominated by a south-directed imbricate thrust system,

Yin et al.
856 Geological Society of America Bulletin, July/August 2008
whereas in the south across the Qaidam syn-clinorium axis Jurassic and Cenozoic strata are essentially undeformed. The north-dipping basin fl oor in the south can be explained by the presence of a gentle north-dipping thrust ramp in the middle crust that links with a sub-horizontal detachment at a depth of ~24 km.
Growth-Strata Relationships and Timing of Deformation
There is no appreciable thickness variation for units E1+2 to N1, but unit N2–1 and younger strata thicken toward the axial region of the Qai-dam synclinorium. This suggests folding started during deposition of unit N2–1 (24 Ma). This age of synclinal folding is signifi cantly younger than the initiation age for the Qaidam synclino-rium at 65–50 Ma in sections 1 and 3, suggest-ing that the synclinorium grew eastward and reached section 4 ca. 24 Ma.
Strain and Strain RateThe total amount of shortening across the
167-km-long section 4 is 20 km, which yields a total shortening strain of 11%. Over 24 m.y., the average strain rate is 0.5–0.7 × 10⁻¹⁶ s–1.
Mesozoic StructureJurassic strata are restricted to the central and
northern parts of section 4 and are distributed discontinuously in small grabens (Fig. 8). Nor-mal separation on extensional faults is between 1 and 4 km. The estimates are likely minimum values because some faults place Jurassic strata over pre-Jurassic basement.
Interpreted Seismic Section 5
Structural GeologyThis section is 62 km east of section 4
(Fig. 9). The Qaidam synclinorium has ampli-
tude of 3–4 km in this section. Two south-directed thrusts are below the northern limb of the synclinorium: the southern fault (fault 2 in Fig. 9) produces a fault-propagation fold, and the northern fault (fault 1 in Fig. 9) forms the basal thrust of a small triangle zone. Except a minor south-dipping thrust with hundreds of meters of slip (fault 3), the southern section is undeformed. The basement of the southern Qaidam basin tilts northward at an angle of ~4º–5°, which cannot be explained by motion on fault 3 in Figure 9. Because of this, we infer the presence of a gently north dipping décollement at depths of ~15–22 km; a deep-seated south-dipping thrust may be below the southern Qaidam basin that merges upward with the thrust décollement (Fig. 9). A key difference between the geometry of the Main Qaidam detachment shown in this section and that in sections 1–4 is that the upper-crustal
E3-1E3-2
N1
JrE1+2
N2-1N2-2
Q1
pre-Jr
Inferred thrust ramp to explain
basement structural relief
0
4
8
12
16
20
24
km
0
4
8
12
16
20
24
km
0 4 8 12 16 20
kmpre-Jr
E3-1
E3-2N1
Jr
E1+2
N2-1N2-2
Q1
Growth strata
in extensional
basin
Main Qaidam detachment
Paleocene to Quaternary
syncontractional growth strata
Final section length = 190 km
Original section length = 231 km
Shortening = 41 km
Shortening strain = 17.7%
28
32
36
28
32
36
Restored section
N2-3
N2-3
Adatan thrust
Qimen Tagh anticlineNorth Qaidam
passive roof thrust
Inferred thrust ramp to explain
basement structural relief
0
4
8
12
16
20
24
km
0
4
8
12
16
20
24
km
0 4 8 12 16 20
kmpre-Jr
E3-1
E3-2N1
Jr
E1+2
N2-1N2-2
Q1
Growth strata
in extensional
basin
Main Qaidam detachment
Syncontractional growth strata
(Paleocene-Quaternary)
28
32
36
28
32
36
N2-3
Adatan
thrust
Qimen Tagh anticlineNorth Qaidam
passive roof thrust
Southward subduction of Qaidam lower
crust below Eastern Kunlun RangeNorthward subduction of Qaidam
lower crust below Qilian Shan
Deep-seated Eastern Kunlun thrust (?)
Deep-seated Eastern Kunlun thrust (?)
A
B
C
North Qaidam
triangle zone
Qaidam synclinorium
Qaidam synclinorium
Restored cross section
SECTION 3
Figure 7. Geologic cross section of line 3 (upper diagram) and the restored section (lower diagram). See Figure 3 for location. The total amount of shortening is 41 km, with a shortening strain of 17%. Jr—Jurassic. See Table 1 for defi nition of lithologic units.

Cenozoic evolution of Qaidam Basin
Geological Society of America Bulletin, July/August 2008 857
0
4
8
12
16
20
24
km
28
32
36
Inferred Main Qaidam detachment200 4 8 12 16
km
Final section length = 167 km
Original section length = 187
Shortening = 20 km
Shortening strain = 10.7%
E3-1 E3-2
N1
pre-Jr
JrE1+2
N2-1N2-2N2-3
Q10
4
8
12
16
20
24
km
28
32
36
E3-1E3-2
N1
Jr
E1+2
N2-1N2-2N2-3
Q1
pre-Jr
Restored cross section
Basement reflectorsBasement reflectors
Deep-seated Eastern Kunlun thrust (?)
Deep-seated Eastern Kunlun thrust (?)
Qaidam synclinorium
SECTION 4
Figure 8. Geologic cross section of line 4 (upper diagram) and the restored section (lower diagram). See Figure 3 for location. The total amount of shortening is 20 km, with a shortening strain of 11%. Jr—Jurassic. See Table 1 for defi nition of lithologic units.
0
4
8
12
16
20
24
km
28
32
36
Main Qaidam detachment
Final section length = 130 km
Original section length = 147 km
Shortening = 17 km
Shortening strain = 17/140 =12.1%
200 4 8 12 16
km
pre-Jr
N2-3
Q1
N2-1N2-2 N1 E3-1E3-20
4
8
12
16
20
24
km
28
32
36
Restored cross section
E1+2
E3-2
pre-Jr E1+2
N1 E3-1E3-2N2-3 N2-3N2-2
Q1
fault 1fault 2fault 3
Deep-seated Eastern Kunlun thrust (?)
Deep-seated Eastern Kunlun thrust (?)
Qaidam synclinorium
SECTION 5
Figure 9. Geologic cross section of line 5 (upper diagram) and the restored section (lower diagram). See Figure 3 for location. The total amount of shortening is 17 km, with a shortening strain of 12%. Jr—Jurassic. See Table 1 for defi nition of stratigraphic units.

Yin et al.
858 Geological Society of America Bulletin, July/August 2008
ramp linking the Main Qaidam detachment at its northern and southern ends is missing. This may be explained by the upper-crustal ramp located below the Eastern Kunlun Range out-side the section.
Growth-Strata Relationships and Timing of Deformation
At this section younger Paleogene units pro-gressively overlap underlying older unit south-ward (Fig. 9), suggesting southward expan-sion of deposition in the Qaidam basin. The generally northward thickening of units E1+2, E3–1, and E3–2 is indicative of a foreland basin bounded by a north-dipping thrust along the northern Qaidam margin. The inferred thrust is exposed at the surface as the north-dipping Xitie Shan thrust (Fig. 3) (Yin et al., 2008). Unit N1 (29–24 Ma) thickens slightly toward the northern and southern margins of the basin, suggesting that Qaidam basement was warped upward during its deposition. Unit N2–1 (24–10 Ma) shows little variation in thickness, whereas units N2–2 (10–5 Ma) and N2–3 (5–2 Ma) display gradual northward thickening, suggesting the basin was progres-sively tilting northward during deposition of these units. Unit Q1 thickens at the core of the synclinorium, indicating that the Qaidam syn-clinorium was developed in the past 2–1 m.y. and remains active. Except unit Q1, all other Cenozoic units maintain their thickness across the triangle zone in the northern Qaidam basin. Thus, the development of that triangle zone must have started in the Quaternary coeval with formation of the Qaidam synclinorium.
In summary, the growth-strata relationships in section 5 indicate fi ve stages of basin devel-opment: (1) protracted northward tilting at 65–29 Ma, (2) upward warping between 29 and 24 Ma, (3) no basin tilting or detectable defor-mation between 24 and 10 Ma, (4) resumed northward tilting between 10 and 2 Ma, and (5) formation of the Qaidam synclinorium and the triangle zone in the northern Qaidam basin in the past 2 m.y.
Strain and Strain RateThe total amount of shortening is 17 km,
which yields a total shortening strain of 12%. The magnitude of shortening is relatively small compared to those estimated for sections 1–4. However, the duration of deformation that gen-erated most of the observed shortening is only ~2 m.y., which yields a rather fast strain rate of 3.2 × 10⁻¹⁵ s–1.
Mesozoic StructuresJurassic strata are completely absent in sec-
tion 5. Because Paleocene and Eocene units
E1+2 and E3–1 are pinched out in the northern part of the section, it is possible that Jurassic strata were originally deposited in the northern part of the section but were later eroded away during northward tilting of the basin.
Interpreted Seismic Section 6
Structural GeologyThis section is ~110 km east of section 5 and
extends into the southernmost part of the Qilian Shan–Nan Shan thrust belt (Fig. 10). Along this section the Qaidam basin is bounded in the north by the north-dipping Aimunik frontal thrust and in the south by a north-dipping unconformity. The slip magnitude of the Aimunik frontal thrust is ~6 km. The southern section displays a minor south-dipping thrust system (Huobuxun thrust system) with a total fault slip <2 km. The basin fl oor dips ~5° to the north. The small fault slip across the Huobuxun thrust system cannot explain the northward tilt of the southern Qai-dam basement (Fig. 10). Thus, we suggest that the tilt was induced by thrust loading due to motion on the Aimunik frontal thrust. It is also possible that the northward tilting was caused by a deep-seated south-dipping thrust below the southern Qaidam basin (Fig. 10). Other mecha-nisms such as channel fl ow or distributed ductile shortening in the lower crust are also possible (see discussion below).
Growth-Strata Relationships and Timing of Deformation
In the northern margin of the Qaidam basin, the north-dipping basin-bounding fault system started to develop after deposition of unit N2–1 (Fig. 10). This is indicated by the presence of units N2–2 and N2–3 in the footwall and their absence in the hanging wall of the Aimunik frontal thrust. Although most Cenozoic units exhibit a southward transgressional relation-ship, unit N1 is an exception that shows a north-ward regressional relationship. This observation may be explained by an increase in sediment supplies to a northward-sloping foreland basin during deposition of unit N1. Alternatively, the regressional relationship for unit N1 could be attributed to motion on the northern branch of the Huobuxun thrust system (fault 1 in Fig. 10), which was associated with the development of a fault-propagation fold above and deposition of growth strata over its forelimb. Motion on fault 1 and the development of the fault-propagation fold may have eroded unit N1 over the crest of the anticline, resulting in its southward pinch-out geometry. This interpretation implies that deformation across the Huobuxun thrust system occurred after the end of the late Oligocene (i.e., after ca. 24 Ma).
Because there is no change in bed thickness across fault 2 in the Huobuxun thrust system, motion on fault 2 must have started after depo-sition of unit E3–2. However, it is not clear whether units N2–1 to N2–3 were deposited prior to motion on fault 2 and were subsequently eroded away, or if they were only deposited in the footwall of the fault. The fi rst scenario implies that the fault started to move after depo-sition of unit N2–3 (i.e., the Pliocene), while the second scenario requires that the fault initiated during deposition of unit N2–1 (early to middle Miocene). In any case, the above observations suggest that deformation in section 6 started at or after the early Miocene (ca. 24 Ma).
Strain and Strain RateThe shortening strain is highly inhomoge-
neous in the section. Shortening across the southern part of the section in the Qaidam basin proper is only ~2 km, which yields a shortening strain <1%. In contrast, shortening in the north-ern part of the section across the basin-bound-ing structures (i.e., the Aimunik thrust zone) is ~12 km, which yields a 30% strain. Using 24 m.y. as the duration of deformation, the aver-age strain rate along line 6 is 0.13 × 10⁻¹⁶ s–1.
Mesozoic StructuresJurassic strata generally maintain a constant
thickness in the northern part of the section, but they pinch out with Cenozoic units E3–2 to N2–3 at the southern part of the section, and were overlain by Quaternary deposits (Fig. 10). This relationship suggests that erosion of the Jurassic strata occurred in the Cenozoic, pos-sibly resulting from northward tilting of the Eastern Kunlun Range that bounds the Qaidam basin. An extensional fault with ~2 km normal separation and an associated half-graben are present in the southern part of the section.
Interpreted Seismic Section 7
Structural GeologyThis section traverses the southern part of
the Yousha Shan anticline in the southwestern Qaidam basin (Fig. 11). The structural geometry and kinematic evolution of the anticline were discussed in detail in Yin et al. (2007a). Here we expand that study by considering an additional seismic refl ection profi le west of the sections discussed by Yin et al. (2007a) and Song and Wang (1993) (Fig. 3). Section 7 mainly exhib-its two sets of thrusts: (1) south-dipping thrusts in the southern part of the section placing the pre-Jurassic basement over Neogene strata, and (2) north-dipping thrusts in the northern section placing pre-Jurassic basement over Paleogene strata and structurally below the south-dipping

Cenozoic evolution of Qaidam Basin
Geological Society of America Bulletin, July/August 2008 859
0 2 6 84 10
12
14
16
0 2 6 84 10
12
14
16
km
Sout
hern
Qili
an S
han
Thr
ust
Bel
tQ
aida
m B
asin
Nort
hw
ard t
ilte
d b
asin
flo
or
Jr pre
-Jr
E3-2
N1
N2-1
N2-2
Q N2-3
Jr
pre
-Jr
N1
QN
2-3
E3-2
N2-2
N2-1
JrN
1E
3-2
N2-1
04
812
km
JrE
3-2
Fin
al s
ecti
on l
ength
= 5
0 k
m
Ori
gin
al s
ecti
on l
ength
= 5
2 k
m
Short
enin
g a
cross
Qai
dam
bas
in =
2 k
m
Short
enin
g s
trai
n a
cross
Qai
dam
bas
in =
~1%
Fin
al s
ecti
on l
ength
= 4
0 k
m
Ori
gin
al s
ecti
on l
ength
= 2
8 k
m
Short
enin
g =
12 k
m
Short
enin
g =
30%
JrE
3-2
N1
N1
N2-1
N2-2
N2-3
N2-1
N1
N2-1
N1
E3-2
E3-2
JrJr
QN
2-3
Aim
unik
fro
nta
l th
rust
Aim
un
ik b
ackth
rust
Huobuxun t
hru
st s
yst
em
Infe
rred
bas
al t
hru
st t
hat
surf
aces
in t
he
Eas
tern
Kunlu
n R
ange
Eas
tern
Kunlu
n R
ange
fault
1
fault
2
Dee
p-s
eate
d E
aste
rn K
unlu
n t
hru
st (
?)
Dee
p-s
eate
d E
aste
rn K
unlu
n t
hru
st (
?)
Qai
dam
syncl
inori
um
SEC
TIO
N 6
Res
tore
d cr
oss
sect
ion
Fig
ure
10. G
eolo
gic
cros
s se
ctio
n of
line
6 (t
he u
pper
dia
gram
) and
the
rest
ored
sec
tion
(low
er d
iagr
am).
See
Fig
ure
3 fo
r lo
cati
on. T
his
sect
ion
cros
ses
the
boun
dary
be
twee
n th
e Q
aida
m b
asin
and
sou
ther
n Q
ilian
Sha
n th
rust
bel
t. T
he t
otal
am
ount
of
shor
teni
ng a
cros
s th
e ba
sin
is ~
2 km
, whi
ch y
ield
s a
shor
teni
ng s
trai
n of
~1%
ov
er a
n or
igin
al s
ecti
on ~
52 k
m lo
ng. I
n co
ntra
st, t
he a
mou
nt o
f sh
orte
ning
acr
oss
the
sout
hern
Qili
an S
han
thru
st b
elt
is 3
0% (
i.e.,
12 k
m s
hort
enin
g ov
er a
40
km
orig
inal
sec
tion
leng
th).
Jr—
Jura
ssic
. See
Tab
le 1
for
defi
nit
ion
of s
trat
igra
phic
uni
ts.

Yin et al.
860 Geological Society of America Bulletin, July/August 2008
thrusts. Both fault sets may sole into a common décollement linked with south-directed thrusts in the Qimen Tagh Range to the south (Yin et al., 2007a) (Fig. 2).
Growth-Strata Relationships and Timing of Deformation
A growth-strata sequence is developed over the forelimb of the Yousha Shan anticline, which started during deposition of unit N1 (29–24 Ma) and became most prominent during the deposi-tion of Quaternary strata (Fig. 11). This relation-ship indicates that the initiation of the Yousha Shan anticline occurred in the late Oligocene and the structure has remained active. A similar conclusion on the initiation age of deformation in the Yousha Shan region was reached by Yin et al. (2007a), based on reinterpretation of a seismic section by Song and Wang (1993) (see Fig. 3 for line location).
Strain and Strain RateThe total amount of crustal shortening across
section 7 is ~25 km, not counting slip on the inferred Qimen Tagh basal thrust. This yields ~30% shortening strain. This shortening strain is smaller than that estimated from a longer cross section to the east (Yin et al., 2007a), which yields a minimum shortening strain of 48%. This discrepancy can be explained by the different coverage of the two sections. The cross section of Yin et al. (2007a) extends across the entire Yousha Shan anticline and covers two additional major structures to the north: the north-dipping Yiematan and Chaishiling thrusts. In contrast, section 7 is much shorter and only covers the forelimb of the Yousha Shan anticline. Thus, we consider the estimated >48% shortening strain from Yin et al. (2007a) to be more representative of the overall shortening across the southwest-ern part of the Qaidam basin. The average short-ening strain rate over a period of 29 m.y. (i.e., since the late Oligocene) is 5.1 × 10⁻¹⁶ s–1.
Mesozoic StructuresJurassic strata are restricted to the northern
part of the section (Fig. 11). Two north-dipping normal-separation faults are present in the sec-tion. The southern fault has >~1.5 km normal separation and the northern fault has ~2 km normal separation. Half-grabens are associated with both faults (Fig. 11).
CENOZOIC SEDIMENTATION
In order to elucidate the Cenozoic develop-ment of the Qaidam basin, we summarize below the thickness-distribution history of Ceno-zoic strata in eight time slices (Fig. 12). The main data source is Huang et al. (1996), who
Fig
ure
11. G
eolo
gic
cros
s se
ctio
n of
line
7 (t
he u
pper
dia
gram
) and
the
rest
ored
sec
tion
(low
er d
iagr
am).
See
Fig
ure
3 fo
r lo
cati
on. T
he to
tal a
mou
nt o
f sho
rten
ing
is >
25 k
m (
not
coun
ting
slip
on
the
basa
l thr
ust)
, wit
h a
shor
teni
ng s
trai
n of
>30
%. S
ee T
able
1 f
or d
efi n
itio
n of
str
atig
raph
ic u
nits
. Not
e th
at u
nits
N2-
1 an
d Q
ar
e pr
omin
ent g
row
th-s
trat
a se
quen
ces,
whe
reas
N2-
2 an
d N
2-3
mai
ntai
n co
nsta
nt th
ickn
ess.
Thi
s re
lati
onsh
ip s
ugge
sts
that
the
You
sha
Shan
ant
iclin
e w
as a
ctiv
e ep
isod
ical
ly: a
ctiv
e de
form
atio
n du
ring
dep
osit
ion
of u
nits
N2-
1 an
d Q
wit
h an
inte
rven
ing
peri
od o
f ina
ctiv
ity
duri
ng d
epos
itio
n of
uni
ts N
2-2
and
N2-
3.
Yoush
a S
han
anti
clin
ori
um
10 k
m
Jr
E1
+2
E3-2
E1+
2E
3-1
E3-2
0 12
108642km
N2-1
N1
E3-2
E3-1
E1+
2E
3-1
N2-2
pre
-Mz
pre
-Mz
pre
-Jr
0 12
108642km
Q1
Ori
gin
al s
ecti
on l
ength
= 7
4 k
m
Fin
al s
ecti
on l
ength
= 4
8 k
m
Short
enin
g >
25 k
m (
not
counti
ng s
lip o
n t
he
bas
al t
hru
st)
Short
enin
g s
trai
n >
30 %
Growth Strata
Qim
en T
agh t
hru
st
N2-3
Yoush
a S
han
bas
al t
hru
st
E3-2
N1
Jr
SEC
TIO
N 7
Res
tore
d cr
oss
sect
ion
Jr
N2-1
N1
E3-2
E3-1
N2-2
pre
-Jr
Q1
N2-3
E1+
2
N1

Cenozoic evolution of Qaidam Basin
Geological Society of America Bulletin, July/August 2008 861
compiled information from more than 1000 drill holes and a dense network of seismic profi les. We modify their maps across our sections where appropriate. To highlight the fi rst-order depo-sitional patterns, we also remove the effect of thrusts on isopachs (Fig. 12). This simplifi cation has little impact on the thickness distributions because major thrusts tend to concentrate along the basin margins and the largest fault slips tend to be localized in the Jurassic strata or basal part of the Cenozoic section such as in the North Qaidam triangle zone.
Early Eocene (E1+2, Lulehe Formation)
The east-west extent of the Paleocene–early Eocene Qaidam basin is much smaller than its present size, with its eastern boundary located west of Golmud (Fig. 12A). The largest depo-center for unit E1+2 is located in the northwest-ern basin (subbasin A in Fig. 12A), occupying an area of 150 km × 70 km. The thickest part of the depocenter is located ~80 km south of the present-day northern basin margin. Four smaller depocenters are also scattered in the northern Qaidam basin. The structural setting of the above depocenters can be understood by exam-ining the northern parts of sections 1, 2, and 3, in which the thickest and largest depocenter (sub-basin A) is located in the core of the Qaidam synclinorium, whereas the smaller depocenters are located in over smaller synclines. Two minor depocenters are located in the southern Qaidam basin (subbasins B and C in Fig. 12A): one near Yousha Shan anticline (subbasin B) and the other in the south-central Qaidam basin (sub-basin C). The latter is located in the core of a small syncline (Fig. 7), whereas the origin of the former is not clear due to lack of seismic data in the area complex. Several short-wavelength (<30 km), shallow (<500 m), and circular sub-basins were developed along the eastern margin of the basin.
Middle to Late Eocene (E3–1, Lower Xiaganchaigou Formation)
During deposition of unit E3–1, subbasins A, B, and C became larger (Fig. 12B). This is asso-ciated with an overall eastward expansion of the Qaidam basin, with its new eastern boundary located east of Golmud. The center of subba-sin A also migrated southward, occupying the central position of the Qaidam basin. The most noticeable change at this time is the increase in the north-south width of subbasin A. This increase is associated with a coeval increase in the amplitude and wavelength of the underly-ing Qaidam synclinorium (Fig. 13). Subbasins B and C also expanded laterally. The small
subbasins along the eastern margin of the Qai-dam basin similarly became larger (wavelength >50 km) and more elongated compared to the E1+2 pattern (Fig. 12A; cf. Fig. 12B).
Early Oligocene (E3–2, Upper Xiaganchaigou Formation)
During deposition of unit E3–2, subbasins A, B, and C all expanded in the northeast and south-west directions perpendicular to the structural trend in the basin (Fig. 12C). The most promi-nent feature is the appearance of a southward-thickening subbasin D near Golmud, which may be controlled by the presence of a north-directed thrust to the south. Subbasin C also became more asymmetric, with the north-dipping slope on the south side steeper than the south-dipping northern slope on the north side (Fig. 12C). The extent of unit E3–2 is approximately the same as that of the current Qaidam basin. Subbasins on the east side became much more elongated, as expressed by the development of two rows of northwest-trending troughs (Fig. 12C).
Late Oligocene (N1, Shangganchaigou Formation)
The main feature of the N1 isopach pattern is that subbasin A became larger by incorporat-ing subbasin C and part of subbasin B devel-oped earlier (Fig. 12D). Subbasin D, which was prominent during deposition of unit E3–2, is completely absent. Subbasin B is partitioned into western and eastern basins (B-west and B-east), with subbasin B-east joining the larger subbasin A (Fig. 12D). In addition to the con-tinuous enlargement of subbasin A, two smaller subbasins (A-1 and A-2) are present along the northwestern margin of the Qaidam basin. In the eastern half of the basin, the isopach pattern is simplifi ed, as expressed by one asymmetric basin with a gentle southern slope and a steep northern slope (Fig. 12D).
Early and Middle Miocene (N2–1, Xiayoushashan Formation)
The depositional pattern of unit N2–1 is similar to that for unit N1 (Fig. 12E). Key dif-ferences are the disappearance of subbasins A-1 and A-2 shown during deposition of unit N1. An asymmetric subbasin remains in the eastern half of the basin.
Late Miocene (N2–2, Shangyoushashan Formation)
During deposition of unit N2–2, a northwest-trending synclinal trough extending from sub-
basin A through subbasins C, E, F, G, and F was developed (Fig. 12F). This synclinal trough was built on an earlier structural arch in the eastern Qaidam basin, which became converted into a series of small basins (i.e., subbasins E, F, G, and H). Meanwhile, subbasins A, B, and C in the western Qaidam basin continued to develop.
Pliocene (N2–3, Shizigou Formation)
During deposition of unit N2–3, the depocen-ter of subbasin A migrated prominently to the east for ~100 km, leaving behind a small sub-basin occupying its original depocenter during deposition of unit N2–2 (Fig. 12G). In the east-ern half of the Qaidam basin, the isopach data show that the broad synclinal trough continued to develop, with a gentler slope in the south and a steeper slope in the north. In contrast, the west-ern half of the Qaidam basin is characterized by numerous short-wavelength (<40 km) and shal-low (mostly <500 m) basins (Fig. 12G).
Quaternary (Q, Qigequan Formation)
The isopach pattern of Quaternary deposits refl ects the modern depositional system across the Qaidam basin (Fig. 12H). The main depo-center lies along the northwest-trending basin axis, with sediments fed mainly by internally drained rivers from the Eastern Kunlun Range to the south. The highly elongated toughs and arches are correlative with active growing anti-clines and synclines (Fig. 13).
DISCUSSION
Tectonic Origin of Qaidam Basin
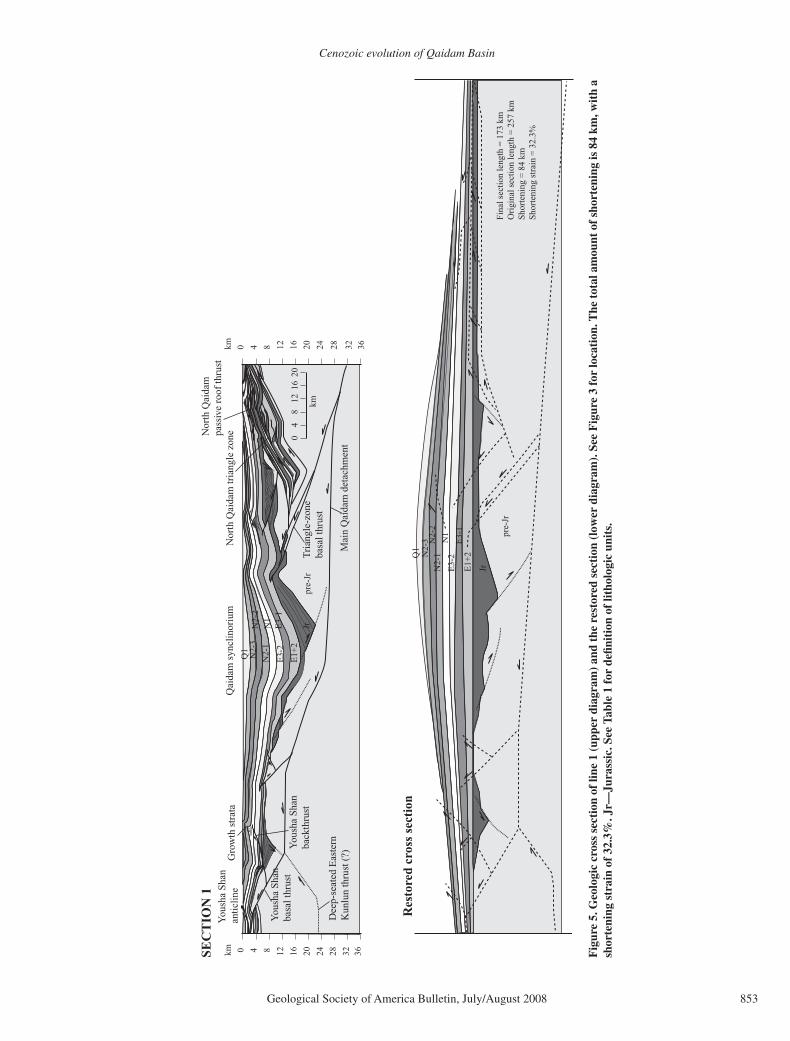
Our results on the timing, style, and magni-tude of Cenozoic deformation across the Qai-dam basin are summarized in Figures 13 and 14A. This information allows us to evaluate the existing tectonic models for the development of the Qaidam basin. The diachronous initia-tion of deformation and the lack of strike-slip faults along the northern and southern basin margins (also see Yin et al., 2008, 2007a) pre-clude extrusion of the Qaidam basin from the west (Wang et al., 2006) (Fig. 13). The older initiation age of deformation in the northern basin margin ca. 65–50 Ma and the younger initiation age of deformation in the southern basin margin at 29–24 Ma are inconsistent with the stepwise northward-jumping model (Métivier et al., 1998). As shown in Figure 13, our structural observations are consistent with the suggestions that a basement-involved thrust belt lies across the Qaidam basin (Burchfi el et al., 1989), and the fi rst-order structure of the

Yin et al.
862 Geological Society of America Bulletin, July/August 2008
1000
600
1000
1000 1000
1000+
+
+ +
+
+
+
-
600
600
600600
++ +
-
--
-
+
+
-
--
-
-
-
-+
+
+
+
0
300
300
600
900
600
600
+
300
-
--
+
+ +
+
+
+
+
+
+
+
+
+
0
300
600
900
1200
1500
600
900
+
1200
1200
1500
-900
+
+
+
+
600
E1+2 Lulehe Fm.
(65–50 Ma)
E3-1 Lower
Xiaganchaigou
Fm. (50–37 Ma)
E3-2 Upper
Xiaganchaigou
Fm. (37–29 Ma)
Golmud
Lenghu
Huatugou
Da Qaidam
Delingha
Golmud
Lenghu
Huatugou
Da Qaidam
Delingha
Golmud
Lenghu
Huatugou
Da Qaidam
Delingha
Altyn Tagh Range
Qilian Shan
Altyn Tagh Range
Qilian Shan
Altyn Tagh Range
Qilian Shan
Future Eastern Kunlun Range
Future Eastern Kunlun Range
Future Eastern Kunlun Range
0 20 40 60 80 km
0 20 40 60 80 km
0 20 40 60 80 km
A
B
C
98°E
(A)
(C)
(B)
(A)
(C)
(B)
(A)
(C)
(B)
(D)
> 1 km
> 1.5 km
> 1 km
> 1.5 km
> 1 km
> 1.5 km
Interpreted seismic
reflection line(1)
98°E
38°N
96°E92°E
36°N
94°E
37°N
(1)
(2)
(3)
(4)
(5)(6)
(7)
91°E
98°E
38°N
96°E92°E
36°N
94°E
37°N
(1)
(2)
(3)
(4)
(5)(6)
(7)
91°E
Interpreted seismic
reflection line(1)
98°E
38°N
96°E92°E
36°N
94°E
37°N
(1)
(2)
(3)
(4)
(5)(6)
(7)
91°E
Interpreted seismic
reflection line(1)
Figure 12 (Continued on following page).

Cenozoic evolution of Qaidam Basin
Geological Society of America Bulletin, July/August 2008 863
0
300
600
900
300
1500
900
900
900
900
900
0
+
+
+
+
+
++
+
++
+
+
+
+
+
+
+
-
-
-
++
-
-
+
+
+ -
-
+
+
+
+
0
300
600900
1200
15001800
2100
2400
1500
1200
900
1200
--
-
-
-
+
+
+
+
+
+
+
+
+
+
+
-
-
0
300
600
900
12001500
1500
1800
1800
2100
2100
2400
N1 Shangganchaigou Fm.
(29–24 Ma)
N2-1 Xiayoushashan Fm.
(24–10 Ma)
N2-2 Shangyoushashan
Fm. (10–5 Ma)
Golmud
Lenghu
Huatugou
Da Qaidam
Delingha
Golmud
Lenghu
Huatugou
Da Qaidam
Delingha
Golmud
Lenghu
Huatugou
Da Qaidam
Delingha
Altyn Tagh Range
Eastern Kunlun Range
Qilian Shan
Altyn Tagh Range
Eastern Kunlun Range
Qilian Shan
Altyn Tagh Range
Eastern Kunlun Range
Qilian Shan
0 20 40 60 80 km
0 20 40 60 80 km
0 20 40 60 80 km
D
E
F
> 1 km
> 1.5 km
> 1 km
> 1.5 km
> 1 km
> 1.5 km
(A + C)
(B-west)
(A+C)
(A)
(C)
(B)
(B-east)
(B-east)
(E)(F)
(G)
(H)
(A-1)(A-2)
98°E
38°N
96°E92°E
36°N
94°E
37°N
(1)
(2)
(3)
(4)
(5)(6)
(7)
91°E
Interpreted seismic
reflection line(1)
98°E
38°N
96°E92°E
36°N
94°E
37°N
(1)
(2)
(3)
(4)
(5)(6)
(7)
91°E
Interpreted seismic
reflection line(1)
98°E
38°N
96°E92°E
36°N
94°E
37°N
(1)
(2)
(3)
(4)
(5)(6)
(7)
91°E
Interpreted seismic
reflection line(1)
Figure 12 (Continued on following page).

Yin et al.
864 Geological Society of America Bulletin, July/August 2008
Figure 12 (continued). (A) Isopach map of the Lulehe Formation (E1+2). (B) Isopach map of the lower Xiaganchaigou Forma tion (E3-1). (C) Isopach map of the upper Xiaganchaigou Formation (E3-2). (D) Isopach map of the Shanggan-chaigou Formation (N1). (E) Isopach map of the Xiayoushashan Formation (N2-1). (F) Isopach map of the Shangyousha-shan Formation (N2-2). (G) Isopach map of the Shizigou Formation (N2-3). (H) Isopach map of Quaternary sediments (Q). See Table 1 for age assignment of each unit.
- -
--
-
-
-
--
-
+
+
+
+
+
+
+
+
+
+
++
+
+
+
+
+
++
+
+
+
0
0
0
300
300
600
600
1500
1200
900600
1800
21002700
3000
Da Qaidam
Lenghu
Delingha
000000
0
300
600
900
1200
1500 -
--
-
---
-
-
--
+
+
+
+
+
+
+
+
--
+
+
-+
++
+
+
+
1200
900
0
0
300
300
600
900
600
900
0
300
600
G
0 20 40 60 80 km
0 20 40 60 80 km
Altyn Tagh Range
Eastern Kunlun Range
Qilian Shan
H
N2-3 Shizigou Fm.
(5–1.8 Ma)
Golmud
Lenghu
Huatugou
Da Qaidam
Delingha
Altyn Tagh Range
Eastern Kunlun Range
Qilian Shan
Q Qigequan Fm.
(1.8–0 Ma)
> 1 km
> 1.5 km
> 1 km
> 1.5 km
98°E
38°N
96°E92°E
36°N
94°E
37°N
(1)
(2)
(3)
(4)
(5)(6)
(7)
91°E
Interpreted seismic
reflection line(1)
98°E
38°N
96°E
36°N
94°E
37°N
(1)
(2)
(3)
(4)
(5)
(7)
91°E
(6)
92°E
Interpreted seismic
reflection line(1)
(A)
Golmud
2400
2400
0
300
Huatugou
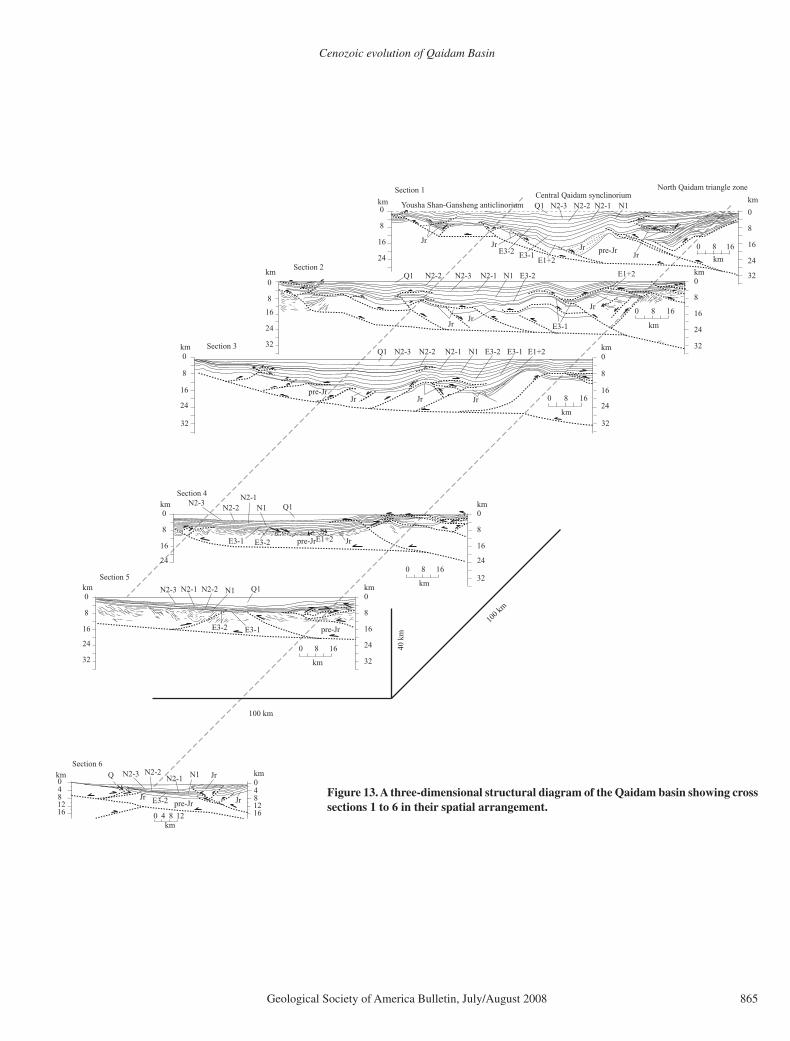
Cenozoic evolution of Qaidam Basin
Geological Society of America Bulletin, July/August 2008 865
0
8
16
24
km0
8
16
24
km
32
0 8 16
km
32
E3-1
E3-2N1
Jr
E1+2N2-1N2-2 N2-3Q1
0
8
16
24
km
0
8
16
24
km
0 8 16
km
pre-Jr
E3-1E3-2N1
Jr
E1+2N2-1N2-2N2-3Q1
3232
0
8
16
24
km
320 8 16
km
E3-1 E3-2
N1
pre-Jr JrE1+2
N2-1
N2-2N2-3
Q10
8
16
24
km
0 8 16
km
0
8
16
24
km
32
pre-Jr
N2-3 Q1N2-2N2-1 N1
E3-2 E3-1
0
8
16
24
km
32
24
0 8 16
kmE3-1E3-2
N1N2-1N2-2N2-3Q1
E1+2
pre-Jr
0
8
16
24
km
32
Yousha Shan-Gansheng anticlinorium
North Qaidam triangle zoneCentral Qaidam synclinorium
0
8
16
24
km
100 km
100
km
40
km
Section 1
Section 2
Section 3
Section 4
Section 5
0
84
1216
0
84
1216
km
pre-JrJr
N1Q N2-3
E3-2
N2-2N2-1
0 4 8 12km
Jr
Section 6
JrJr
Jr
Jr
Jr
Jr
JrJr
Jr km
Figure 13. A three-dimensional structural diagram of the Qaidam basin showing cross sections 1 to 6 in their spatial arrangement.

Yin et al.
866 Geological Society of America Bulletin, July/August 2008
0 20 40 60 80 km
Golmud
Da Qaidam
Delingha
Altyn Tagh Range
Qilian Shan
98°E
38°N
96°E92°E
36°N
94°E
37°N
Y-0
7b
(1)
(2)
(3)
(4)
(5)
170 km
90°E88°E
Qaidam Basin
Present northern margin of Qaidam
basin
Qaid
n
P
t n
m
amPresent southern margin of Qaidam basin
resent southern margin oof Qm
Altyn Tagh fault
0 20 40 60 80 km
Golmud
Da Qaidam
Delingha
Altyn Tagh Range
Qilian Shan
98°E
38°N
96°E92°E
36°N
94°E
37°N
Y-0
7b
(1)
(2)
(3)
(4)
(5)
140 km
90°E88°E
Qaidam Basin
Present northern margin of Qaidam
basin
Qaid
n
P
t n
m
amPresent southern margin of Qaidam basin
resent southern margin oof Qm
Restored southern margin of Qaidam basin
Altyn Tagh fault
12°Restored southern margin of Qaidam basin
(6)
(6)
0 20 40 60 80 km
Golmud
Da Qaidam
Delingha
Altyn Tagh Range
Eastern Kunlun Range
Qilian Shan
98°E
38°N
96°E92°E
36°N
94°E
37°NY
-07b
(1)
(2)
(3)
(4)
(5)
90°E88°E
Altyn Tagh fault
(6)
(7)
nt northern margin of Qaidam
basin
Presenn
Present northern margin of Qaidam
basin
29 Ma
PrPresent southern margin of Qaidam basin
24 Ma
65–50 M
a
29 Ma
29 Ma
29 Ma 65–59
Ma
24 Ma
24 Ma
29 Ma
65–59 Ma
after24 Ma
30%
< 1%
11%
12%
17%
35%
32%
> 4
8%
30%
Reconstructing southern Qaidam
margin by restoring Cenozoic
shortening across Qaidam basin
Reconstructing southern Qaidam
margin by rotating Eastern
Kunlun Range
Eastern Kunlun Range
Inferred upper-crustal ramp
below Qaidam basin
65–50 M
a &Qaidam
Synclinorium
Summary of timing and magnitude
Cenozoic deformation across
Qaidam basin
B
C
A
Figure 14. (A) Summary of timing and shortening strain across the Qaidam basin. (B) Reconstruction of southern Qaidam margin relative to its northern margin by projecting the magnitude of shortening along the western edge of the Qaidam basin against the Altyn Tagh fault. This projection predicts ~140 km shortening across the western edge of the Qaidam basin along the Altyn Tagh fault. (C) Restored southern margin of the Qaidam basin by rotating the Eastern Kunlun Range 12º in a clockwise sense. This projection predicts ~170 km shortening along the western edge of the Qaidam basin against the Altyn Tagh fault.
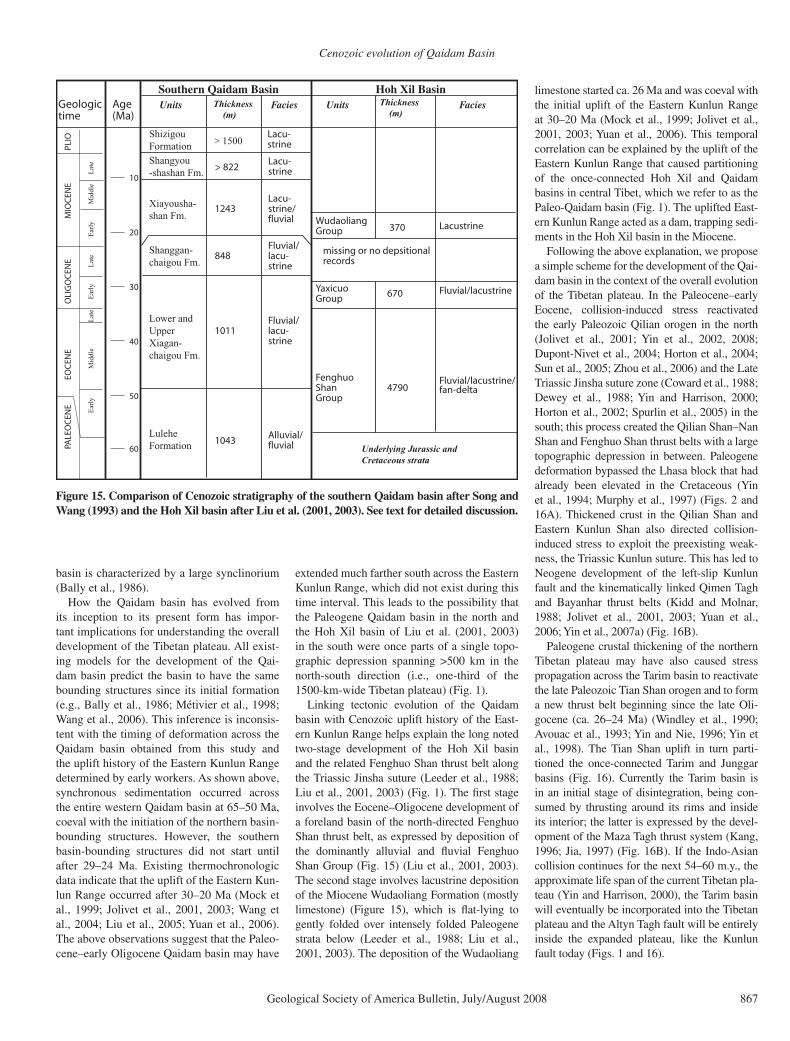
Cenozoic evolution of Qaidam Basin
Geological Society of America Bulletin, July/August 2008 867
basin is characterized by a large synclinorium (Bally et al., 1986).
How the Qaidam basin has evolved from its inception to its present form has impor-tant implications for understanding the overall development of the Tibetan plateau. All exist-ing models for the development of the Qai-dam basin predict the basin to have the same bounding structures since its initial formation (e.g., Bally et al., 1986; Métivier et al., 1998; Wang et al., 2006). This inference is inconsis-tent with the timing of deformation across the Qaidam basin obtained from this study and the uplift history of the Eastern Kunlun Range determined by early workers. As shown above, synchronous sedimentation occurred across the entire western Qaidam basin at 65–50 Ma, coeval with the initiation of the northern basin-bounding structures. However, the southern basin-bounding structures did not start until after 29–24 Ma. Existing thermochronologic data indicate that the uplift of the Eastern Kun-lun Range occurred after 30–20 Ma (Mock et al., 1999; Jolivet et al., 2001, 2003; Wang et al., 2004; Liu et al., 2005; Yuan et al., 2006). The above observations suggest that the Paleo-cene–early Oligocene Qaidam basin may have
extended much farther south across the Eastern Kunlun Range, which did not exist during this time interval. This leads to the possibility that the Paleogene Qaidam basin in the north and the Hoh Xil basin of Liu et al. (2001, 2003) in the south were once parts of a single topo-graphic depression spanning >500 km in the north-south direction (i.e., one-third of the 1500-km-wide Tibetan plateau) (Fig. 1).
Linking tectonic evolution of the Qaidam basin with Cenozoic uplift history of the East-ern Kunlun Range helps explain the long noted two-stage development of the Hoh Xil basin and the related Fenghuo Shan thrust belt along the Triassic Jinsha suture (Leeder et al., 1988; Liu et al., 2001, 2003) (Fig. 1). The fi rst stage involves the Eocene–Oligocene development of a foreland basin of the north-directed Fenghuo Shan thrust belt, as expressed by deposition of the dominantly alluvial and fl uvial Fenghuo Shan Group (Fig. 15) (Liu et al., 2001, 2003). The second stage involves lacustrine deposition of the Miocene Wudaoliang Formation (mostly limestone) (Figure 15), which is fl at-lying to gently folded over intensely folded Paleogene strata below (Leeder et al., 1988; Liu et al., 2001, 2003). The deposition of the Wudaoliang
limestone started ca. 26 Ma and was coeval with the initial uplift of the Eastern Kunlun Range at 30–20 Ma (Mock et al., 1999; Jolivet et al., 2001, 2003; Yuan et al., 2006). This temporal correlation can be explained by the uplift of the Eastern Kunlun Range that caused partitioning of the once-connected Hoh Xil and Qaidam basins in central Tibet, which we refer to as the Paleo-Qaidam basin (Fig. 1). The uplifted East-ern Kunlun Range acted as a dam, trapping sedi-ments in the Hoh Xil basin in the Miocene.
Following the above explanation, we propose a simple scheme for the development of the Qai-dam basin in the context of the overall evolution of the Tibetan plateau. In the Paleocene–early Eocene, collision-induced stress reactivated the early Paleozoic Qilian orogen in the north ( Jolivet et al., 2001; Yin et al., 2002, 2008; Dupont-Nivet et al., 2004; Horton et al., 2004; Sun et al., 2005; Zhou et al., 2006) and the Late Triassic Jinsha suture zone (Coward et al., 1988; Dewey et al., 1988; Yin and Harrison, 2000; Horton et al., 2002; Spurlin et al., 2005) in the south; this process created the Qilian Shan–Nan Shan and Fenghuo Shan thrust belts with a large topographic depression in between. Paleogene deformation bypassed the Lhasa block that had already been elevated in the Cretaceous (Yin et al., 1994; Murphy et al., 1997) (Figs. 2 and 16A). Thickened crust in the Qilian Shan and Eastern Kunlun Shan also directed collision-induced stress to exploit the preexisting weak-ness, the Triassic Kunlun suture. This has led to Neogene development of the left-slip Kunlun fault and the kinematically linked Qimen Tagh and Bayanhar thrust belts (Kidd and Molnar, 1988; Jolivet et al., 2001, 2003; Yuan et al., 2006; Yin et al., 2007a) (Fig. 16B).
Paleogene crustal thickening of the northern Tibetan plateau may have also caused stress propagation across the Tarim basin to reactivate the late Paleozoic Tian Shan orogen and to form a new thrust belt beginning since the late Oli-gocene (ca. 26–24 Ma) (Windley et al., 1990; Avouac et al., 1993; Yin and Nie, 1996; Yin et al., 1998). The Tian Shan uplift in turn parti-tioned the once-connected Tarim and Junggar basins (Fig. 16). Currently the Tarim basin is in an initial stage of disintegration, being con-sumed by thrusting around its rims and inside its interior; the latter is expressed by the devel-opment of the Maza Tagh thrust system (Kang, 1996; Jia, 1997) (Fig. 16B). If the Indo-Asian collision continues for the next 54–60 m.y., the approximate life span of the current Tibetan pla-teau (Yin and Harrison, 2000), the Tarim basin will eventually be incorporated into the Tibetan plateau and the Altyn Tagh fault will be entirely inside the expanded plateau, like the Kunlun fault today (Figs. 1 and 16).
Geologic time
Age(Ma)
Units Thickness (m)
Facies
1043
1011
848
1243
> 822
Alluvial/ fluvial
Fluvial/ lacu-strine
Fluvial/ lacu-strine
Lacu-strine/fluvial
Lacu-strine
Southern Qaidam Basin Hoh Xil Basin
Fenghuo ShanGroup
Yaxicuo Group
Units Facies
WudaoliangGroup
4790
670
missing or no depsitionalrecords
370
Fluvial/lacustrine/fan-delta
Fluvial/lacustrine
Lacustrine
10
20
30
40
50
EOC
ENE
OLI
GO
CEN
EM
IOC
ENE
PLIO Shizigou
Formation> 1500
Shangyou
-shashan Fm.
Xiayousha-
shan Fm.
Shanggan-
chaigou Fm.
Lulehe
Formation
Lower and
Upper
Xiagan-
chaigou Fm.
Lacu-strine
Lat
eM
iddle
Ear
lyE
arly
Lat
eE
arly
Lat
eM
iddle
Thickness (m)
60PALE
OC
ENE
Underlying Jurassic and
Cretaceous strata
Figure 15. Comparison of Cenozoic stratigraphy of the southern Qaidam basin after Song and Wang (1993) and the Hoh Xil basin after Liu et al. (2001, 2003). See text for detailed discussion.

Yin et al.
868 Geological Society of America Bulletin, July/August 2008
Inf
er
re
d M
ain
Qa
ida
m D
eta
ch
me
nt
Qili
an S
han
Thru
st B
elt
East
ern
Kun
lun
thru
st b
elt
Ku
nlu
n F
au
ltSo
ngpa
n-G
anzi
terr
ane
Qai
dam
Bas
in
Qia
ngta
ng m
antle
lith
osph
ere
Song
pan-
Gan
zi m
antle
lit
hosp
here
Qai
dam
-Kun
lun
man
tle li
thos
pher
e
Qia
ngta
ng te
rran
e
Nor
th C
hina
Cra
ton
0 100
km
Nor
th C
hina
man
tle
litho
sphe
re
Tria
ssic
Jin
sha
sutu
re
Dev
onia
n Q
ilian
su
ture
reac
tivat
ed
in th
e Pa
leog
ene
km0
200
100
0
100
kmEa
rly M
ioce
ne W
udao
liang
Fm
.Pa
leog
ene
Feng
huos
han
and
Yaxi
cuo
Gro
ups
Hoh
Xil
Bas
inK
unlu
n R
ange
Feng
huos
han
thru
st b
elt
Kua
ntai
shan
thru
st
Dee
p-se
ated
Eas
tern
Kun
lun
thru
st s
yste
m
AB
200
200
Neo
gene
man
tle
subd
uctio
n zo
ne
reac
tivat
ing
Tria
ssic
Kun
lun
sutu
re
Early
Pal
eozo
ic
Nor
th Q
aida
m
UH
P te
rran
e
Kun
lun-
Qai
dam
terr
ane
Qili
an O
roge
n
C
Mo
ho
Pal
eoge
ne T
ibet
an p
late
au
Pal
eo-Q
aida
m B
asin
Qili
an
Sha
n
Alty
n Ta
gh
faul
t
Pal
eo-T
arim
-Jun
gger
Bas
in
Feng
huos
han
thru
st b
elt
Ele
vate
d Lh
asa
Blo
ckF
utu
re K
un
lun
tran
spre
ssio
nal
fau
lt s
yste
m
400
km
A
nP
LhLhnleghBB
tnsuure
Ku
nlu
ntu
Fu
tasa
k
nTa
ghn
70°E
60°E
90°E
100°
E
40°N
30°N
N. T
arim
B
asin
Neo
gene
Tib
etan
pla
teau
Ele
vate
d Lh
asa
Blo
ck
Qili
an
Sha
n
Alty
n Ta
gh fa
ult
Ku
nlu
ntr
ansp
ress
ion
alsy
stem
Qai
dam
Bas
in
Tian
Sha
n
Maza T
agh
Jung
ger
Bas
in
No
rth
Ch
ina
Cra
ton
Feng
huo
Sha
n th
rust
be
lt
Hoh
Xil
Bas
in
Mio
cene
Wud
aolia
ng
Fm
. (la
cust
rine)
B
A
B
S. T
arim
B
asin
tran
spre
ssio
na
al
dWW
hCC
htN
BBul
tau f
eMMSS
llsahgg
yraKu
KanliB
70°E
60°E
90°E
100°
E
Fig
ure
16. (
A) P
aleo
gene
tect
onic
con
fi gur
atio
n of
the
Tib
etan
pla
teau
in p
rese
nt-d
ay g
eogr
aphi
c co
ordi
nate
s. T
he P
aleo
-Qai
dam
bas
in li
es b
etw
een
the
elev
ated
Lha
sa b
lock
and
th
e F
engh
uo S
han
thru
st b
elt i
n th
e so
uth
and
the
elev
ated
Qili
an S
han
in th
e no
rth.
The
reg
ion
nort
h of
the
Tib
etan
pla
teau
was
a la
rge
topo
grap
hic
depr
essi
on th
at li
nks
Tari
m
and
Jung
gar
basi
ns a
cros
s th
e T
ian
Shan
, as
the
Tia
n Sh
an w
as n
ot u
plif
ted
unti
l the
ear
ly M
ioce
ne. (
B)
Neo
gene
tec
toni
c co
nfi g
urat
ion
of t
he T
ibet
an p
late
au in
pre
sent
-day
ge
ogra
phic
coo
rdin
ates
. The
init
iati
on o
f th
e E
aste
rn K
unlu
n le
ft-s
lip t
rans
pres
sion
al s
yste
m c
ause
d th
e up
lift
of t
he E
aste
rn K
unlu
n R
ange
, whi
ch h
as p
arti
tion
ed t
he P
aleo
-Q
aida
m b
asin
into
the
Hoh
Xil
basi
n to
the
sout
h an
d th
e Q
aida
m b
asin
to th
e no
rth.
The
upl
ift o
f the
Tia
n Sh
an r
ange
sim
ilarl
y pa
rtit
ione
d th
e on
ce-u
nite
d Ta
rim
-Jun
ggar
bas
in
into
the
Tari
m b
asin
to th
e so
uth
and
Jung
gar
basi
n to
the
nort
h. T
he d
evel
opm
ent o
f the
Maz
a Ta
gh th
rust
zon
e in
cen
tral
Tar
im b
asin
is c
urre
ntly
par
titi
onin
g th
e Ta
rim
bas
in
into
nor
ther
n an
d so
uthe
rn s
ubba
sins
. (C
) Sc
hem
atic
cro
ss s
ecti
on s
how
ing
fi rst
-ord
er c
rust
al s
truc
ture
s of
the
cen
tral
and
nor
ther
n T
ibet
an p
late
au. G
eolo
gy o
f th
e so
uthe
rn
Qili
an S
han
is b
ased
on
Yin
et a
l. (2
008)
, geo
logy
of t
he Q
aida
m b
asin
is b
ased
on
inte
rpre
ted
seis
mic
sec
tion
3 in
Fig
ure
7, a
nd g
eolo
gy o
f the
Eas
tern
Kun
lun
is b
ased
on
our
own
unpu
blis
hed
map
ping
.

Cenozoic evolution of Qaidam Basin
Geological Society of America Bulletin, July/August 2008 869
First-order lithospheric structures result-ing from the above plateau-growth history are shown in Figure 16C. A question may be raised about our proposed Paleo-Qaidam basin hypoth-esis: why is the elevation of the Hoh Xil basin currently ~2 km higher than that of the Qaidam basin? Several mechanisms may have operated to cause this elevation difference in the Neogene once the two basins were partitioned. First, the high elevation of the Hoh Xil basin could have been induced by a thermal event in the mantle, such as convective removal of the Hoh Xil man-tle lithosphere (e.g., Harrison et al., 1992; Mol-nar et al., 1993) or subduction of the Qaidam mantle lithosphere below the Hoh Xil region (e.g., Meyer et al., 1998; Yin et al., 2002). Sec-ond, it is possible that lower crust was extruded northward, as from the elevated Lhasa block into the Hoh Xil basin (e.g., Clark and Royden, 2000). Finally, it is possible that Hoh Xil lower crust was thickened by thrust duplication due to the development of a large fl ake-tectonics sys-tem across the Eastern Kunlun Range (Yin et al., 2008). The last hypothesis is consistent with our structural observations from the southwestern Qaidam basin, where excess lower crust must have been subducted below the nearby thrust belts (Yin et al., 2007a). The above end-member processes could have operated and interacted simultaneously, and more detailed geologic research is required across the Eastern Kunlun Range and the Hoh Xil basin to differentiate these possible mechanisms for plateau uplift.
The plateau-growth history proposed above implies that the largest plateau on Earth was constructed by fi rst creating and then destroy-ing large intracontinental basins. This view is in strong contrast to the passive-fi lling bath-tub model of Métivier et al. (1998), Meyer et al. (1998), and Tapponnier et al. (2001) that invokes no crustal shortening once intraplateau basins were created. The proposed deformation sequence above (Fig. 16) is different from the predictions of the thin viscous sheet model or the continental extrusion model (England and Houseman, 1986; Tapponnier et al., 1982), as both require northward propagation of deforma-tion across Tibet and eastern Asia. In contrast, models considering preexisting weakness and topography provide a better physical scheme to simulate the growth history of the Tibetan pla-teau (e.g., Neil and Houseman, 1997; Kong et al., 1997).
Deformation History and Basin-Forming Mechanisms
The Cenozoic deformation history of the Qaidam basin and associated sedimentation are illustrated in Figure 17. In the Paleocene and
early Eocene, a triangle zone was developed along the northern edge of the Qaidam basin, and produced a southward tapering growth-strata sequence (Fig. 17B). The triangle zone continued to grow in the middle and late Eocene via development of a passive-roof thrust duplex, causing further thickening of the growth-strata sequence southward away from the triangle zone (Fig. 17C). In the late Oligocene and Miocene, the Qaidam synclinorium began to develop, caused by the formation of a south-directed thrust below the synclinal axis and a fault-bend fold along the southern Qaidam basin margin (Fig. 17D). The continuous development of the fault-bend fold from the Pliocene to the present in the southern Qaidam basin caused further tightening of the Qaidam synclinorium and deposition of a thick growth-strata sequence (Fig. 17E).
The most interesting observation from the Qaidam basin is its central axis has been per-sistently downgoing throughout the Cenozoic, with an amplitude locally reaching 16 km. In our kinematic model, we interpret it to have developed by the formation of two thrust sys-tems initiated at different times below the two fold limbs. Although the development of crustal-scale folds by hidden thrust systems has been well documented in the North American Cordil-leran fold-thrust belt (e.g., Price, 1981, 1986; Yin and Kelty, 1991), the folds are much smaller than those across the Qaidam basin (amplitude <5 km and half-wavelength <50 km). One pos-sible explanation for the differences in fold size is that the North American Cordilleran thrust belt is thin-skinned, involving only the sedi-mentary cover sequence, whereas the Qaidam thrust belt is thick-skinned, involving even the lower-crustal basement. The diachronous initia-tion of the fold limbs across the Qaidam basin precludes buckling as a mechanism to grow the syncline (e.g., Cloetingh et al., 2002), although it could be the cause of initiation of the develop-ment of thrust duplexes (see experimental dem-onstration of this process by Burg et al., 1994). In addition to thrust loading by the development of thrust wedges on both sides of the Qaidam basin, it is also possible that additional forces have assisted downward warping of the basin axis. They may include the presence of a south-ward subducting lithospheric slab from the Qil-ian Shan–Nan Shan thrust belt or a downward drip of thickened lithosphere below the basin.
Classifying the Qaidam basin is not straight-forward; its structural setting and isopach pat-terns differ from a classic foreland basin in that its main depocenter has been located persis-tently in the basin axis away from the bound-ing thrusts (Fig. 12) (e.g., Jordan, 1981). Alter-natively, the Qaidam basin could be classifi ed
as a wedge-top basin in the sense of DeCelles and Giles (1996), lying above the Qimen Tagh–Eastern Kunlun thrust belt in the south and Qilian Shan–Nan Shan thrust belt in the north. Because the initiation age and structural style of the two thrust belts are signifi cantly differ-ent, such a simple classifi cation may obscure the complex basin history as illustrated by our reconstruction (Fig. 17). Naming the Qaidam basin as a simple piggyback basin suffers the same problem of oversimplifying the basin-forming process. Dickinson et al. (1988) noted that some latest Cretaceous–early Tertiary Lar-amide basins in the North American Cordillera were developed in hanging walls of large base-ment-involved thrusts, which they referred to as axial basins. Yin and Ingersoll (1997) found that these basins are commonly located in synclinal troughs above oppositely dipping thrusts. This structural setting in the broadest sense matches the tectonic setting of the Qaidam basin and its bounding thrust belts: the basis is bounded by the south-directed Qimen Tagh–Eastern Kunlun thrust belt in the south and the north-directed Qilian Shan–Nan Shan thrust belt in the north. The key difference between the North Ameri-can and Tibetan axial basins is that the syncli-nal trough across the Qaidam region may be a lithospheric-scale fold.
Relationship between Deformation of the Qaidam Basin and Motion on the Altyn Tagh Fault
Results of our interpreted seismic sections and the earlier work in the westernmost Qaidam basin (Yin et al., 2007a) suggest that shorten-ing strain and shortening magnitude across the Qaidam basin decrease systematically east-ward: ~35% in the west, ~11% in the center, and <1% in the east (Fig. 14A). We used this information to reconstruct the original position of the southern Qaidam margin relative to the northern margin. In our reconstruction, we used the estimated strain of >48% (Yin et al., 2007a) for the westernmost part of the Qaidam basin (Fig. 14A). The restored southern basin margin requires ~140 km shortening across the west-ernmost the Qaidam basin and 140 km decrease in fault slip on the Altyn Tagh fault across the Qaidam basin (Fig. 14B): from ~470 km at its intersection with the southern Qaidam margin (Cowgill et al., 2003) to ~330 km at its inter-section with the northern Qaidam margin. The eastward decrease in Qaidam shortening also implies that the southern Qaidam margin has rotated clockwise relative to its northern mar-gin. If we treat the Eastern Kunlun Range as a rigid block, the along-strike variation of short-ening requires >12° of clockwise rotation and

Yin et al.
870 Geological Society of America Bulletin, July/August 2008
E1+2
N1
A. E
nd o
f C
reta
ceous
(ca.
65 M
a)
B. P
aleo
cene–
earl
y E
oce
ne
(E1+
2, 65–49 M
a)
C. M
iddle
Eoce
ne–
earl
y O
ligoce
ne
(E3-1
and E
3-2
, 49–29 M
a)
D. L
ate
Oli
goce
ne–
Mio
cene
(N1, N
2-1
, an
d N
2-2
, 29–5 M
a)
E. P
lioce
ne–
Quat
ernar
y (
N2-3
and Q
, 5–0 M
a)
N2
Q
E3
E3
N2
N1
Jr
Jr
E1+2
E3
JrE1
+2
Jr
pre-
Jrpre-
Jr pre-
Jr pre-
Jr
pre-
Jr
N2
Init
iati
on o
f th
e fa
ult
-ben
d
fold
in t
he
late
Oli
goce
ne
Jr
N1
N1
pre-
Jrpr
e-Jr
pre-
Jr
pre-
Jrpr
e-Jr
pre-
Jr
pre-
Jr
pre-
Jrpr
e-Jr
N1
N1
N2
N2
N2
N2
E1+2
Jr
pre-
Jrpr
e-Jr
pre-
Jr
pre-
Jrpr
e-Jr
pre-
Jr
Fig
ure
17. R
esto
rati
on o
f cro
ss s
ecti
on 1
. Sta
ge 1
, end
of C
reta
ceou
s (c
a. 6
5 M
a); s
tage
2, P
aleo
cene
–ear
ly E
ocen
e (E
1+2,
65–
49 M
a); s
tage
3, m
iddl
e E
ocen
e–ea
rly
Olig
ocen
e (E
3-1
and
E3-
2, 4
9–29
Ma)
; sta
ge 4
, lat
e O
ligoc
ene–
Plio
cene
(N1
and
N2,
29–
2 M
a); s
tage
5, Q
uate
rnar
y (2
–0 M
a). J
r is
Jur
assi
c.

Cenozoic evolution of Qaidam Basin
Geological Society of America Bulletin, July/August 2008 871
>170 km shortening across the westernmost the Qaidam basin; the slip magnitude on the Altyn Tagh fault is constrained to be <~300 km north of the Qaidam basin (Fig. 14C).
Our proposed tectonic rotation of the south-ern margin of the Qaidam basin relative to the northern basin margin can be tested by the existing paleomagnetic data across the basin. Paleomagnetic studies of middle Eocene–early Oligocene samples by Dupont-Nivet et al. (2002) along the northern margin of the Qaidam basin indicate that the region has not rotated with respect to the Eurasian reference pole since the early Oligocene (Fig. 2). A study of Cretaceous samples by Sun et al. (2006) at the eastern end of the Qaidam basin indicates that the region has not rotated in the Cenozoic (Fig. 2). In north-central Qaidam, Chen et al. (2002) showed that Paleogene red beds have rotated ~15° clockwise. Using Late Jurassic samples from the southwestern Qaidam basin, Chen et al. (2002) and Halim et al. (2003) showed that the region has rotated as much as ~29° clockwise prior to late Miocene; how-ever, how much of this rotation occurred in the Cenozoic is not clear. In the Hol Xil region, samples from late Oligocene strata show that the region has rotated ~15° clockwise (Fig. 2). Liu et al. (2003) showed that in the Fenghuo Shan area of the Hoh Xil basin, the region has undergone 29º ± 8° of clockwise rotation since ca. 31 Ma (Fig. 2). The above data in general are consistent with our block rotation model and, in light of the paleomagnetic data from the Hoh Xil basin, our proposed 12° regional rotation of the Eastern Kunlun Range may rep-resent a lower bound.
As we stated in Yin et al. (2008), we consider Cenozoic deformation across the Qaidam basin to have been driven by motion on the Altyn Tagh fault, as expressed by initiation of deformation and sedimentation at the western edge of the Qaidam basin against the Altyn Tagh fault and subsequent eastward propagation. This suggests that the initiation of the Altyn Tagh fault occurred during the deposition of unit E1+2 at 65–50 Ma (Yin et al., 2002; cf. Meyer et al., 1998).
Relationship between Upper-Crustal and Lower-Crustal Deformation
Because its topography is quite fl at, the 45 km crustal thickness of the Qaidam basin may vary little under Airy isostasy. The crustal thickness of the Qaidam basin at the onset of the Indo-Asian collision was probably >~32 km, because Late Cretaceous strata are terrestrial deposits (e.g., Huang et al., 1996). With the initial (>32 km) and fi nal (45 km) crustal thickness as the bounds, we discuss possible relationships between upper-
crustal and lower-crustal deformation during Cenozoic development of the Qaidam basin.
In the western Qaidam basin, the >48% upper-crustal shortening strain alone is suffi -cient to explain the observed crustal thickness (Yin et al., 2007a). This mode of deformation as shown in Figure 18A predicts an extra length of lower crust and mantle lithosphere, which may have been subducted below the neighbor-ing thrust belts. In the eastern Qaidam basin, the observed upper-crustal shortening strain is neg-ligible (<1%) and thus is insuffi cient to explain the current crustal thickness and basin elevation. The above arguments require a systematic east-ward variation of crustal-thickening mechanism across the Qaidam basin: (1) dominantly upper-crustal shortening in the west (Fig. 18A), (2) mixed upper-crustal and lower-crustal thicken-ing in the center (Fig. 18B), and (3) dominantly lower-crustal shortening in the east (Fig. 18C). The above discussion on the spatial variation of crustal shortening strain and shortening mecha-nisms refers only to the Qaidam basin that is defi ned by the present topography in the region. It is possible that the earlier extent of the Qaidam basin, such as in Paleogene time, was larger. For example, the Delingha and Sugan basins north of the Qaidam basin could once have been parts of the greater Qaidam basin.
In the absence of upper-crustal deformation, lower-crustal thickening can be achieved by channel fl ow (Fig. 18D) (Clark and Royden, 2000) or ductile thrusting (Fig. 18E). The fi rst process may be tested via stratigraphic relation-ships. If the surface uplift rate induced by lower-crustal fl ow were greater than the sedimentation rate, the basin margins would migrate toward the basin center, resulting in regressional strati-graphic relationships (Fig. 19A). In contrast, if the surface uplift rate were lower than the sedi-mentation rate, the basin margins would migrate away from the basin center, resulting in transgres-sional stratigraphic relationships (Fig. 19B). As exemplifi ed in Figure 10, the southern margin of the Qaidam basin has undergone transgression throughout the Cenozoic, which implies that the surface uplift rate induced by lower-crustal fl ow, if it has occurred, has been lower than the sedi-mentation rate. The total Cenozoic section in the southern Qaidam basin is <5 km deposited over 50 m.y., which yields an average surface uplift rate of <0.1 mm/yr.
It has been noted that the Qaidam lithosphere is unusually strong in Tibet (Braitenberg et al., 2003). If the strength of lithosphere mainly concentrates in the lower crust due to absence of fl uids (i.e., Jackson et al., 2004), then Qai-dam lower crust would be the least likely place for lower-crustal fl ow in Tibet. Thus, crustal thickening in the eastern Qaidam basin could
have been induced by thrust duplication of the lower crust (Fig. 18E). Following the inferred geometry of the Main Qaidam detachment, as shown in Figures 5, 6, 7, and 10, we envision the existence of two thrust ramps in the eastern-most Qaidam; the northern thrust ramp crosses the lower crust below the Qilian Shan and the southern thrust ramp crosses the upper crust below the Eastern Kunlun Range. To explain the along-strike variation of crustal thickening, the upper-crustal ramp must lie diagonally across the Qaidam basin, as shown in Figure 14A. This ramp confi guration allows progressive transition from dominantly upper-crustal shortening in the west to dominantly lower-crustal shortening in the east (Fig. 14A).
Mesozoic Deformation
Mesozoic extensional structures are wide-spread across the Qaidam basin. Typically, these faults cut the lower part of the Jurassic sequence but are overlain by the upper part of the sequence, suggesting that extensional fault-ing occurred in the Early Jurassic. This obser-vation is inconsistent with the proposal that the Jurassic Qaidam basin was in a compressional tectonic setting (Huo and Tan, 1995; Ritts and Biffi , 2000), but consistent with the regional observation that northern and southern Tibet underwent several phases of extension in the Jurassic and Cretaceous (Huo and Tan, 1995; Huang et al., 1996; Sobel, 1999; Vincent and Allen, 1999; Kapp et al., 2000, 2003; Xia et al., 2001; Chen et al., 2003; Horton et al., 2004).
The extensional faults appear to die out along strike within a distance of 40–50 km, as we could not correlate them from one section to another like the Cenozoic structures. Because of this, the exact trends of Jurassic extensional faults are not well determined. This has made discussion on the relationship between Meso-zoic and Cenozoic structures diffi cult. From the regional seismic sections we analyzed, we could not detect any evidence that Jurassic extensional faults were reactivated by Cenozoic thrusting (also see Yin et al., 2008; cf. Xia et al., 2001; Chen et al., 2003). Further research is needed to determine whether the lack of evidence for reactivation is due to the coarse spacing of our seismic sections, or that the trends of the older extensional faults and the younger Cenozoic thrusts are drastically different. The latter situa-tion would make tectonic inversion diffi cult.
Kink Folds versus Circular Folds
Similar to our detailed structural study of the North Qaidam thrust belt (Yin et al., 2008), Cenozoic folds across the central Qaidam basin

Yin et al.
872 Geological Society of America Bulletin, July/August 2008
Upper crust
Lower crust
A Upper-crustal shortening
(western Qaidam)
Upper crust
Lower crust
C Lower-crustal shortening
(eastern Qaidam)
Upper crust
Lower crust
Intruded Channel
D Channel flow
Upper crust
Lower crust
Lower crust
Lower crust
Qilian Shan thrust beltEastern Kunlun thrust belt
Qaidam basin
E Lower-crustal thickening by thrusting
Upper crust
Upper crust
Lower crust
B Coupled pure-shear
crustal shortening
(central Qaidam)
Upper crust
Stage 1
Stage 2
Stage 3
Figure 18. Relationship between upper-crustal and lower-crustal deformation across the Qaidam basin. (A) Crustal thickening is accomplished by upper-crustal shortening, and the lower crust and the mantle lithosphere are subducted below basin-bounding thrust belts. (B) Crustal thickening is accommodated by pure-shear shortening of the entire crust. (C) Crustal thickening is accommodated by pure-shear contraction in the lower crust. The extra section length for the upper crust may have been thrust over the basin-bounding thrust belts. (D) Lower crustal thickened is achieved by channel fl ow coming from below the basin-bounding thrust belts. (E) Crustal thickening may have been accomplished by thrust duplication of the lower crust; the brittle portion of the thrust zone may have surfaced in the Eastern Kunlun Range to the south and the listric fault geometry may cause progressive northward tilting of the basin fl oor, as seen in seismic lines.

Cenozoic evolution of Qaidam Basin
Geological Society of America Bulletin, July/August 2008 873
have broader and rather circular hinge zones and lower fold amplitudes than those predicted by the kink-bend method if one extrapolates sur-face geology to a greater depth (Suppe, 1983). The round fold hinge-zone geometry is compat-ible with our direct fi eld observations of Ceno-zoic folds and map patterns that show circular and broad fold-hinge zones (Yin et al., 2008). Recognition of this fold style resolves the long-noted discrepancy across the Qaidam basin that the fold limbs determined by surface mapping tend to be much steeper than those constrained by seismic and drill-hole data. That is, the broad and circular fold-hinge geometry predicts a rapid change in bedding dip downward, rather than maintaining the same dip, as anticipated by the kink-bend method.
CONCLUSIONS
The major geologic observations and inferences derived from analyses of seismic-
refl ection profi les and thickness distributions of Cenozoic strata across the Qaidam basin are summarized in the following.
1. The fi rst-order structure across the basin is a major Cenozoic synclinorium, with its ampli-tude decreasing progressively eastward, from >16 km in the west to <4 km in the east. Associ-ated with the amplitude decrease is an eastward decrease in the half-wavelength of the fold from ~170 km to ~50 km. Associated with the eastward decrease in fold amplitude and half-wavelength is the decrease in the north-south width of the Qaidam basin from ~400 km in the west to ~100 km in the east, suggesting that the basin formation and its topographic expres-sion are closely related to the development of the Qaidam synclinorium. Growth-strata rela-tionships indicate that the synclinorium axis has propagated eastward: located entirely in the western Qaidam ca. 65–50 Ma with subse-quent expansion to the easternmost basin after 24 Ma.
2. Cenozoic upper-crustal shortening strain and shortening magnitude across the Qaidam basin decrease systematically eastward: >48% in the west, ~17% in the center, and <1% in the east. Cenozoic strain rates range from 1.3 × 10⁻¹⁷ s–1 to 3.2 × 10⁻¹⁵ s–1. The eastward decrease in upper-crustal shortening strain indicates a pro-gressive transition in crustal-thickening mecha-nism, from dominantly upper-crustal shortening in the west to dominantly lower-crustal shorten-ing in the east.
3. Qaidam upper-crustal structures can be best explained by thrusting along a mid-crustal décollement, which we referred to as the Main Qaidam detachment. The detachment links a lower-crustal ramp in the northern Qaidam basin and southern Qilian Shan and an upper-crustal ramp in the southern Qaidam basin and the East-ern Kunlun Range. The depth to the décollement decreases eastward from ~28 km in the west to ~16 km in the east. The upper-crustal ramp lies diagonally across the Qaidam basin, oblique to
Upper crust
Lower crust
Moho
upper crust
Lower crust
Moho
upper crust
Lower crust
Moho
L0
L0
L1
L1
L0
Hinge migration
Hinge migration
Qaidam Basin
Kunlun RangeNorth
Regression sequencewith pinch-out point progressively retreating
Lower crustal flow
H1
H2
1
1 2
Lower crustal flow
Lower crustal flow
pinch-out points
Upper crust
Lower crust
Moho
Upper crust
Lower crust
Moho
Upper crust
Lower crust
Moho
L0
L0
L1
L1
L0
Hinge migration
Hinge migration
Qaidam Basin
Kunlun RangeNorth
Lower crustal flow
H1
H2
1
1 2
Lower crustal flow
Lower crustal flow
(1) (1)
(2) (2)
(3) (3)
Uplift rate > Sedimentation rate Uplift rate < Sedimentation rateA B
Figure 19. Possible growth-strata patterns along the northern plateau margin due to lower-crustal channel fl ow. (A) Sedimentation rate is lower than the uplift rate, producing a regressional sequence. (B) Sedimentation rate is higher than the uplift rate, producing a transgressional sequence.

Yin et al.
874 Geological Society of America Bulletin, July/August 2008
the general structural trend of the basin. This ramp confi guration allows a systematic transi-tion from dominantly upper-crustal shortening in the west to dominantly lower-crustal shorten-ing in the east.
4. Although sedimentation of Paleocene–Eocene strata occurred synchronously across the entire basin, initiation of the basin-bounding structures was diachronous: the northern basin-bounding structures started coevally with the initial basin sedimentation at 65–50 Ma, while the southern basin-bounding structures started much later, at 29–24 Ma. This observation, in conjunction with the uplift of the Eastern Kunlun Range south of the basin since 30–20 Ma, sug-gests that the Paleogene Qaidam basin extended much farther to the south across the Eastern Kunlun Range and was possibly linked with the Paleogene Hoh Xil basin that is currently south of the Eastern Kunlun Range. The two basins formed a united Paleogene topographic depres-sion that was >500 km wide in the north-south direction and had a size and tectonic setting sim-ilar to the present-day Tarim basin between the Tian Shan and the Tibetan plateau to the north. The development and subsequent demise of this Paleo-Qaidam basin imply a complex sequence of deformation that may have been controlled by the preexisting heterogeneity of mechanical strength in Tibetan lithosphere at the onset of the Indo-Asian collision.
5. The initiation and subsequent develop-ment of the Qaidam basin was closely related to motion on the Altyn Tagh left-slip fault. This was expressed by the Paleocene–early Eocene initiation of basin sedimentation and related deformation in the westernmost part of the basin adjacent to the strike-slip fault. Deformation and sedimentation were subsequently expanded eastward across the basin.
6. Jurassic extensional structures and asso-ciated half-grabens are widespread across the Qaidam basin. From the seismic profi les we analyzed, we could not detect any evidence that the early extensional faults were reactivated by Cenozoic thrusts.
ACKNOWLEDGMENTS
We thank J. Sears and F. Neubauer for their excel-lent reviews and the constructive suggestions by the GSA Bulletin Editor Brendan Murphy and Associ-ate Editor Cecilio Quesada. Neubauer’s suggestions of using the existing paleomagnetic data to test our rotational model were particularly helpful in improv-ing the original draft and clarifying the implications of our proposed block rotation model. This research was supported by the Qinghai Oilfi eld Company of PetroChina and the China University of Geosci-ences (Beijing). Yin’s work in Tibet in the past two decades, including this work, was also supported by the Tectonics Program of the U.S. National Science Foundation. The research presented in this paper was
mostly conducted while Yin was a summer visiting professor at the China University of Geosciences, sponsored by the Chinese Ministry of Education via a Changjiang Visiting Professor Fellowship.
REFERENCES CITED
Avouac, J.P., Tapponnier, P., Bai, M., You, H., and Wang, G., 1993, Active thrusting and folding along the northern Tien-Shan and late Cenozoic rotation of the Tarim rela-tive to Zungaria and Kazakhstan: Journal of Geophysi-cal Research, v. 98, no. B4, p. 6755–6804.
Bally, A.W., Chou, I.-M., Clayton, R., Eugster, H.P., Kidwell, S., Meckel, L.D., Ryder, R.T., Watts, A.B., and Wilson, A.A., 1986, Notes on sedimentary basins in China—Report of the American Sedimentary Basins delegation to the People’s Republic of China: U.S. Geological Survey Open-File Report 86–327, 108 p.
Braitenberg, C., Wang, Y., Fang, J., and Hsu, H.T., 2003, Spatial variations of fl exure parameters over the Tibet-Qinghai plateau: Earth and Planetary Science Letters, v. 205, p. 211–224, doi: 10.1016/S0012-821X(02)01042-7.
Burchfi el, B.C., Deng, Q., Molnar, P., Royden, L.H., Wang, Y., Zhang, P., and Zhang, W., 1989, Intracrustal detach-ment with zones of continental deformation: Geology, v. 17, p. 748–752, doi: 10.1130/0091-7613(1989)017<0448:IDWZOC>2.3.CO;2.
Burg, J.P., Davy, P., and Martinod, J., 1994, Shortening of analog models of the continental lithosphere—New hypothesis for the formation of the Tibetan plateau: Tec-tonics, v. 13, p. 475–483, doi: 10.1029/93TC02738.
Chen, W.P., and Molnar, P., 1983, Focal depths of intracon-tinental and intraplate earthquakes and their implica-tions for the thermal and mechanical properties of the lithosphere: Journal of Geophysical Research, v. 88, p. 4183–4214.
Chen, X.H., Yin, A., Gehrels, G.E., Cowgill, E., Grove, M., Harrison, T.M., and Wang, X.F., 2003, Two phases of Mesozoic north-south extension in the eastern Altyn Tagh Range, northern Tibetan plateau: Tecton-ics, v. 22, p. 1053, doi: 10.1029/2001TC001336, doi: 10.1029/2001TC001336.
Chen, Y., Gilder, S., Halim, N., Cogne, J.P., and Courtillot, V., 2002, New paleomagnetic constraints on central Asian kinematics: Displacement along the Altyn Tagh fault and rotation of the Qaidam Basin: Tectonics, v. 21, 1042, doi: 10.1029/2001TC901030.
Clark, M.K., and Royden, L.H., 2000, Topographic ooze: Building the eastern margin of Tibet by lower crustal fl ow: Geology, v. 28, p. 703–706, doi: 10.1130/0091-7613(2000)28<703:TOBTEM>2.0.CO;2.
Cloetingh, S., Burov, E., Beekman, F., Andeweg, B., Andries-sen, P.A.M., Garcia-Castellanos, D., de Vicente, G., and Vegas, R., 2002, Lithospheric folding in Iberia: Tecton-ics, v. 21, no. 5, 1041, doi: 10.1029/2001TC901031.
Coward, M.P., Kidd, W.S.F., Pan, Y., Shackleton, R.M., and Zhang, H., 1988, The structure of the 1985 Tibet Geotraverse, Lhasa to Golmud: Royal Society of London Philosophical Transactions, ser. A, v. 327, p. 307–336, doi: 10.1098/rsta.1988.0131.
Cowgill, E., 2007, Impact of riser reconstructions on estima-tion of secular variation in rates of strike-slip faulting: Revisiting the Cherchen River site along the Altyn Tagh fault, NW China: Earth and Planetary Science Letters, v. 254, p. 239–255, doi: 10.1016/j.epsl.2006.09.015.
Cowgill, E., Yin, A., Feng, W.X., and Qing, Z., 2000, Is the North Altyn fault part of a strike-slip duplex along the Altyn Tagh fault system?: Geology, v. 28, p. 255–258, doi: 10.1130/0091-7613(2000)28<255:ITNAFP>2.0.CO;2.
Cowgill, E., Yin, A., Harrison, T.M., and Wang, X.F., 2003, Reconstruction of the Altyn Tagh fault based on U-Pb geochronology: Role of back thrusts, mantle sutures, and heterogeneous crustal strength in forming the Tibetan Plateau: Journal of Geophysical Research, no. B7, p. 2346.
Cowgill, E., Yin, A., Arrowsmith, J.R., Feng, W.X., and Zhang, S.H., 2004a, The Akato Tagh bend along the Altyn Tagh fault, northwest Tibet 1: Smoothing by vertical-axis rotation and the effect of topographic stresses on bend-fl anking faults: Geological Society of
America Bulletin, v. 116, p. 1423–1442, doi: 10.1130/B25359.1.
Cowgill, E., Arrowsmith, J.R., Yin, A., Wang, X.F., and Chen, Z.L., 2004b, The Akato Tagh bend along the Altyn Tagh fault, northwest Tibet 2: Active deformation and the importance of transpression and strain hardening within the Altyn Tagh system: Geological Society of America Bulletin, v. 116, p. 1443–1464, doi: 10.1130/B25360.1.
Dang, Y., Hu, Y., Yu, H., Song, Y., and Yang, F., 2003, Petro-leum geology of northern Qaidam basin: Beijing, Geo-logical Publishing House, 187 p.
DeCelles, P.G., and Giles, K.A., 1996, Foreland basin sys-tems: Basin Research, v. 8, p. 105–123.
Dewey, J.F., Shackelton, R.M., Chang, C., and Sun, Y., 1988, The tectonic evolution of the Tibetan Plateau: Royal Society of London Philosophical Transactions, ser. A, v. 327, p. 379–413.
Dickinson, W.R., Klute, M.A., Hayes, M.J., Janecke, S.U., Lundin, E.R., McKittrick, M.A., and Olivares, M.D., 1988, Paleogeographic and paleotectonic setting of Laramide sedimentary basins in the central Rocky Mountain region: Geological Society of America Bul-letin, v. 100, p. 1023–1039, doi: 10.1130/0016-7606(1988)100<1023:PAPSOL>2.3.CO;2.
Dupont-Nivet, G., Butler, R.F., Yin, A., and Chen, X., 2002, Paleomagnetism indicates no Neogene rotation of Qai-dam basin in northern Tibet during Indo-Asian colli-sion: Geology, v. 30, p. 263–266, doi: 10.1130/0091-7613(2002)030<0263:PINNRO>2.0.CO;2.
Dupont-Nivet, G., Horton, B.K., Butler, R.F., Wang, J., Zhou, J., and Waanders, G.L., 2004, Paleogene clockwise tec-tonic rotation of the Xining-Lanzhou region, northeast-ern Tibetan Plateau: Journal of Geophysical Research, v. 109, B04401, doi: 10.1029/2003JB002620.
England, P., and Houseman, G., 1986, Finite strain calcula-tions of continental deformation 2. Comparison with the India-Asia collision zone: Journal of Geophysical Research, v. 91, p. 3664–3676.
Gehrels, G.E., Yin, A., and Wang, X.F., 2003a, Detrital zircon geochronology of the northeastern Tibet: Geological Society of America Bulletin, v. 115, p. 881–896, doi: 10.1130/0016-7606(2003)115<0881:DGOTNT>2.0.CO;2.
Gehrels, G.E., Yin, A., and Wang, X.F., 2003b, Magmatic history of the Altyn Tagh, Nan Shan, and Qilian Shan region of western China: Journal of Geophysical Research, v. 108, 2423, doi: 10.1029/2002JB001876.
Halim, N., Chen, Y., and Cogne, J.P., 2003, A fi rst palaeo-magnetic study of Jurassic formations from the Qai-dam basin, Northeastern Tibet, China—Tectonic impli-cations: Geophysical Journal International, v. 153, p. 20–26, doi: 10.1046/j.1365-246X.2003.01860.x.
Hanson, A.D., 1998, Orogenic geochemistry and petroleum geology, tectonics and basin analysis of southern Tarim and northern Qaidam basins, northwest China [Ph.D. thesis]: Stanford, California, Stanford University, 316 p.
Harrison, T.M., Copeland, P., Kidd, W.S.F., and Yin, A., 1992, Raising Tibet: Science, v. 255, p. 1663–1670, doi: 10.1126/science.255.5052.1663.
Horton, B.K., Yin, A., Spurlin, M.S., Zhou, J.Y., and Wang, J.H., 2002, Paleocene–Eocene syncontractional sedi-mentation in narrow, lacustrine-dominated basins of east-central Tibet: Geological Society of America Bulle-tin, v. 114, p. 771–786, doi: 10.1130/0016-7606(2002)114<0771:PESSIN>2.0.CO;2.
Horton, B.K., Dupont-Nivet, G., Zhou, J., Waanders, G.L., Butler, R.F., and Wang, J., 2004, Mesozoic- Cenozoic evolution of the Xining-Minhe and Dangchang basins, northeastern Tibetan Plateau: Magnetostratigraphic and biostratigraphic results: Journal of Geophysical Research, v. 109, B04402, doi: 10.1029/2003JB002913.
Hsü, J.K., 1988, Relic back-arc basins: Principles of recon-struction and possible new examples from China, in Kleinspehn, K.L., and Paola, C., eds., New perspective in basin analysis: Berlin, Springer-Verlag, p. 345–363.
Huang, H., Huang, Q., and Ma, Y., 1996, Geology of Qaidam Basin and its petroleum prediction: Beijing, Geological Publishing House, 257 p. (in Chinese).
Huo, G.M., ed., 1990, Petroleum geology of China, in Oil fi elds in Qianghai and Xizang, v. 14: Beijing, Chinese Petroleum Industry Press, 483 p.
Huo, Y.L., and Tan, S.D., 1995, Exploration case history and petroleum geology in Jiuquan continental basin: Bei-jing, Chinese Petroleum Industry Press, 211 p.

Cenozoic evolution of Qaidam Basin
Geological Society of America Bulletin, July/August 2008 875
Jackson, J.A., Austrheim, H., McKenzie, D., and Priestley, K., 2004, Metastability, mechanical strength, and the support of mountain belts: Geology, v. 32, p. 625–628, doi: 10.1130/G20397.1.
Jia, C., 1997, Tectonic characteristics and petroleum: Tarim Basin, China: Beijing, Chinese Petroleum Industry Press, 295 p.
Jolivet, M., Brunel, M., Seward, D., Xu, Z., Yang, J., Roger, F., Tapponnier, P., Malavieille, J., Arnaud, N., and Wu, C., 2001, Mesozoic and Cenozoic tectonics of the northern edge of the Tibetan plateau: Fission-track constraints: Tectonophysics, v. 343, p. 111–134, doi: 10.1016/S0040-1951(01)00196-2.
Jolivet, M., Brunel, M., Seward, D., Xu, Z., Yang, J., Mala-vieille, J., Roger, F., Leloup, A., Arnaud, N., and Wu, C., 2003, Neogene extension and volcanism in the Kunlun fault zone, northern Tibet: New constraints on the age of the Kunlun fault: Tectonics, v. 22, 1052, doi: 10.1029/2002TC001428.
Jordan, T.E., 1981, Thrust loads and foreland basin evolu-tion, Cretaceous, western United States: American Association of Petroleum Geologists Bulletin, v. 65, p. 2506–2520.
Kang, Y.Z., ed., 1996, Petroleum geology and resource assessment in the Tarim Basin, Xinjiang, China: Bei-jing, Geological Publishing House, 348 p.
Kapp, P.A., Yin, A., Manning, C., Murphy, M.A., Harrison, T.M., Ding, L., Deng, X.G., and Wu, C.-M., 2000, Blueschist-bearing metamorphic core complexes in the Qiangtang block reveal deep crustal structure of north-ern Tibet: Geology, v. 28, p. 19–22, doi: 10.1130/0091-7613(2000)28<19:BMCCIT>2.0.CO;2.
Kapp, P., Yin, A., Manning, C.E., Harrison, T.M., Taylor, M.H., and Ding, L., 2003, Tectonic evolution of the early Mesozoic blueschist-bearing Qiangtang meta-morphic belt, central Tibet: Tectonics, v. 22, no. 4, 1043, doi: 10.1029/2002TC001383.
Kidd, W.S.F., and Molnar, P., 1988, Quaternary and active faulting observed on the 1985 Academia Sinica–Royal Society Geotraverse of Tibet: Royal Society of London Philosophical Transactions, ser. A, v. 327, p. 337–363, doi: 10.1098/rsta.1988.0133.
Kong, X., Yin, A., and Harrison, T.M., 1997, Evaluating the role of preexisting weakness and topographic dis-tributions in the Indo-Asian collision by use of a thin-shell numerical model: Geology, v. 25, p. 527–530, doi: 10.1130/0091-7613(1997)025<0527:ETROPW>2.3.CO;2.
Leeder, M.R., Smith, A.B., and Yin, J., 1988, Sedimentol-ogy, palaeoecology and palaeoenvironmental evolu-tion of the 1985 Lhasa to Golmud Geotraverse: Royal Society of London Philosophical Transactions, ser. A, v. 327, p. 107–143, doi: 10.1098/rsta.1988.0123.
Li, S.L., Mooney, W.D., and Fan, J.C., 2006, Crustal struc-ture of mainland China from deep seismic sound-ing data: Tectonophysics, v. 420, p. 239–252, doi: 10.1016/j.tecto.2006.01.026.
Li, Y.H., Wu, Q.J., An, Z.H., Tian, X.B., Zeng, R.S., Zhang, R.Q., and Li, H.G., 2006, The Poisson ratio and crustal structure across the NE Tibetan Plateau determined from receiver functions: Chinese Journal of Geophys-ics—Chinese Edition, v. 49, p. 1359–1368.
Liu, Y.J., Genser, J., Neubauer, F., Jin, W., Ge, X.H., Handler, R., and Takasu, A., 2005, 40Ar/39Ar mineral ages from basement rocks in the Eastern Kunlun Mountains, NW China, and their tectonic implications: Tectonophysics, v. 398, p. 199–224, doi: 10.1016/j.tecto.2005.02.007.
Liu, Z.F., Wang, C.S., and Yi, H.S., 2001, Evolution and mass accumulation of the Cenozoic Hoh Xil basin, northern Tibet: Journal of Sedimentary Research, v. 71, p. 971–984.
Liu, Z.F., Zhao, X.X., Wang, C.S., Liu, S., and Yi, H.S., 2003, Magnetostratigraphy of Tertiary sediments from the Hoh Xil Basin: Implications for the Cenozoic tectonic history of the Tibetan Plateau: Geophysical Journal International, v. 154, p. 233–252, doi: 10.1046/j.1365-246X.2003.01986.x.
Métivier, F., Gaudemer, Y., Tapponnier, P., and Meyer, B., 1998, Northeastward growth of the Tibet pla-teau deduced from balanced reconstruction of two depositional areas: The Qaidam and Hexi Corridor basins, China: Tectonics, v. 17, p. 823–842, doi: 10.1029/98TC02764.
Meyer, B., Tapponnier, P., Bourjot, L., Metivier, F., Gaud-emer, Y., Peltzer, G., Shunmin, G., and Zhitai, C., 1998, Crustal thickening in Gansu-Qinghai, lithospheric mantle subduction, and oblique, strike-slip controlled growth of the Tibet plateau: Geophysical Journal International, v. 135, p. 1–47, doi: 10.1046/j.1365-246X.1998.00567.x.
Mock, C., Arnaud, N.O., and Cantagrel, J.M., 1999, An early unroofi ng in northeastern Tibet? Constraints from 40Ar/ 39Ar thermochronology on granitoids from the eastern Kunlun range (Qianghai, NW China): Earth and Planetary Science Letters, v. 171, p. 107–122, doi: 10.1016/S0012-821X(99)00133-8.
Molnar, P., England, P., and Martinod, J., 1993, Mantle dynamics, the uplift of the Tibetan Plateau, and the Indian monsoon: Review of Geophysics, v. 31, p. 357–396, doi: 10.1029/93RG02030.
Murphy, M.A., Yin, A., Harrison, T.M., Dürr, S.B., Chen, Z., Ryerson, F.J., Kidd, W.S.F., Wang, X., and Zhou, X., 1997, Signifi cant crustal shortening in south-central Tibet prior to the Indo-Asian collision: Geology, v. 25, p. 719–722, doi: 10.1130/0091-7613(1997)025<0719:DTIACA>2.3.CO;2.
Neil, E.A., and Houseman, G.A., 1997, Geodynamics of the Tarim Basin and the Tian Shan in central Asia: Tecton-ics, v. 16, no. 4, p. 571–584, doi: 10.1029/97TC01413.
Person, M., Raffensperger, J.P., Ge, S.M., and Garven, G., 1996, Basin-scale hydrogeologic modeling: Reviews of Geophysics, v. 34, p. 61–87, doi: 10.1029/95RG03286.
Price, R.A., 1981, The Cordilleran foreland thrust and fold belt in the southern Canadian Rocky Mountains, in Coward, M.P., and McClay, K.R., eds., Thrust and nappe tectonics: Geological Society of London Special Publication 9, p. 427–448.
Price, R.A., 1986, The Southeastern Canadian Cordillera—Thrust faulting, tectonic wedging, and delamination of the lithosphere: Journal of Structural Geology, v. 8, p. 239–254, doi: 10.1016/0191-8141(86)90046-5.
Qinghai Bureau of Geology and Mineral Resources, 1991, Regional geology of Qinghai Province: Beijing, Geo-logical Publishing House, 662 p.
Nansheng, Q., 2002, Tectono-thermal evolution of the Qai-dam Basin, China: Evidence from Ro and apatite fi ssion track data: Petroleum Geoscience, v. 8, p. 279–285.
Nansheng, Q., 2003, Geothermal regime in the Qai-dam basin, northeast Qinghai-Tibet Plateau: Geo-logical Magazine, v. 140, p. 707–719, doi: 10.1017/S0016756803008136.
Rieser, A.B., Neubauer, F., Liu, Y.J., and Ge, X.H., 2005, Sandstone provenance of north-western sectors of the intracontinental Cenozoic Qaidam basin, western China: Tectonic vs. climatic control: Sedimentary Geology, v. 177, p. 1–18, doi: 10.1016/j. sedgeo.2005.01.012.
Rieser, A.B., Liu, Y.J., Genser, J., Neubauer, F., Handler, R., Friedl, G., and Ge, X.H., 2006a, 40Ar/39Ar ages of detri-tal white mica constrain the Cenozoic development of the intracontinental Qaidam Basin, China: Geological Society of America Bulletin, v. 118, p. 1522–1534, doi: 10.1130/B25962.1.
Rieser, A.B., Liu, Y.J., Genser, J., Neubauer, F., Handler, R., and Ge, X.H., 2006b, Uniform Permian 40Ar/ 39Ar detri-tal mica ages in the eastern Qaidam Basin (NW China): Where is the source?: Terra Nova, v. 18, p. 79–87, doi: 10.1111/j.1365-3121.2005.00666.x.
Ritts, B.D., and Biffi , U., 2000, Magnitude of post-Middle Jurassic (Bajocian) displacement on the central Altyn Tagh fault system, northwest China: Geological Soci-ety of America Bulletin, v. 112, p. 61–74, doi: 10.1130/0016-7606(2000)112<0061:MOPMJB>2.3.CO;2.
Sobel, E.R., 1999, Basin analysis of the Jurassic–Lower Cretaceous southwest Tarim basin, northwest China: Geological Society of America Bulletin, v. 111, p. 709–724, doi: 10.1130/0016-7606(1999)111<0709:BAOTJL>2.3.CO;2.
Sobel, E.R., Hilley, G.E., and Strecker, M.R., 2003, Forma-tion of internally drained contractional basins by arid-ity-limited bedrock incision: Journal of Geophysical Research, v. 108, 2344, doi: 10.1029/2002JB001883.
Song, S.G., Zhang, L.F., Niu, Y.L., Su, L., Jian, P., and Liu, D.Y., 2005, Geochronology of diamond-bearing zircons from garnet peridotite in the North Qaidam UHPM belt, Northern Tibetan Plateau: A record of complex histo-ries from oceanic lithosphere subduction to continental
collision: Earth and Planetary Science Letters, v. 234, p. 99–118, doi: 10.1016/j.epsl.2005.02.036.
Song, T., and Wang, X., 1993, Structural styles and strati-graphic patterns of syndepositional faults in a contrac-tional setting: Examples from Qaidam basin, north-western China: American Association of Petroleum Geologists Bulletin, v. 77, p. 102–117.
Spurlin, M.S., Yin, A., Horton, B.K., Zhou, J., and Wang, J., 2005, Structural evolution of the Yushu-Nangqian region and its relationship to syncollisional igneous activity, east-central Tibet: Geological Society of America Bul-letin, v. 117, p. 1293–1317, doi: 10.1130/B25572.1.
Sun, D.Q., and Sun, Q.Y., 1959, Petroleum potential of the Qaidam basin as viewed from the style and pattern of its structural geology: Journal of Geomechanics, v. 1, p. 46–57 (in Chinese).
Sun, Z., Feng, X., Li, D., Yang, F., Qu, Y., and Wang, H., 1999, Cenozoic Ostracoda and palaeoenvironments of the northeastern Tarim Basin, western China: Palaeo-geography, Palaeoclimatology, Palaeoecology, v. 148, p. 37–50, doi: 10.1016/S0031-0182(98)00174-6.
Sun, Z.M., Yang, Z.Y., Pei, J.L., Ge, X.H., Wang, X.S., Yang, T.S., Li, W.M., and Yuan, S.H., 2005, Magne-tostratigraphy of Paleogene sediments from northern Qaidam basin, China: Implications for tectonic uplift and block rotation in northern Tibetan plateau: Earth and Planetary Science Letters, v. 237, p. 635–646, doi: 10.1016/j.epsl.2005.07.007.
Sun, Z.M., Yang, Z.Y., Pei, J.L., Yang, T.S., and Wang, X.S., 2006, New Early Cretaceous paleomagnetic data from volcanic and red beds of the eastern Qaidam Block and its implications for tectonics of Central Asia: Earth and Planetary Science Letters, v. 243, p. 268–281, doi: 10.1016/j.epsl.2005.12.016.
Suppe, J., 1983, Geometry and kinematics of fault-bend fold-ing: American Journal of Science, v. 283, p. 684–721.
Suppe, J., and Medwedeff, D.A., 1990, Geometry and kine-matics of fault-propagation folding: Ecologae Geologi-cae Helvetiae, v. 83, p. 409–454.
Tapponnier, P., Peltzer, G., Le Dain, A.Y., Armijo, R., and Cobbold, P., 1982, Propagating extrusion tectonics in Asia: New insights from simple experiments with plas-ticine: Geology, v. 10, p. 611–616, doi: 10.1130/0091-7613(1982)10<611:PETIAN>2.0.CO;2.
Tapponnier, P., Meyer, B., Avouac, J.P., Peltzer, G., Gaud-emer, Y., Shunmin, G., Hongfa, X., Kelun, Y., Zhitai, C., Shuahua, C., and Huagant, D., 1990, Active thrust-ing and folding in the Qilian Shan, and decoupling between upper crust and mantle in northeastern Tibet: Earth and Planetary Science Letters, v. 97, p. 382–403, doi: 10.1016/0012-821X(90)90053-Z.
Tapponnier, P., Xu, Z.Q., Roger, F., Meyer, B., Arnaud, N., Wittlinger, G., and Yang, J.S., 2001, Oblique stepwise rise and growth of the Tibet plateau: Science, v. 294, p. 1671–1677, doi: 10.1126/science.105978.
Taylor, M., Yin, A., Ryerson, F.J., Kapp, P., and Ding, L., 2003, Conjugate strike-slip faulting along the Ban-gong-Nujiang suture zone accommodates coeval east-west extension and north-south shortening in the inte-rior of the Tibetan Plateau: Tectonics, v. 22, 1044, doi: 10.1029/2002TC001361.
Vincent, S.J., and Allen, M.B., 1999, Evolution of the Minle and Chaoshui Basins, China: Implications for Mesozoic strike-slip basin formation in Central Asia: Geological Society of America Bulletin, v. 111, p. 725–742, doi: 10.1130/0016-7606(1999)111<0725:EOTMAC>2.3.CO;2.
Wang, E., Xu, F.Y., Zhou, J.X., Wan, J.L., and Burchfi el, B.C., 2006, Eastward migration of the Qaidam basin and its implications for Cenozoic evolution of the Altyn Tagh fault and associated river systems: Geolog-ical Society of America Bulletin, v. 118, p. 349–365, doi: 10.1130/B25778.1.
Wang, F., Lo, C.H., Li, Q., Yeh, M.W., Wan, J.L., Zheng, D.W., and Wang, E.Q., 2004, Onset timing of signifi cant unroofi ng around Qaidam basin, northern Tibet, China: Constraints from Ar-40/Ar-39 and FT thermochronol-ogy on granitoids: Journal of Asian Earth Sciences, v. 24, p. 59–69, doi: 10.1016/j.jseaes.2003.07.004.
Wang, Q., and Coward, M.P., 1990, The Chaidam Basin (NW China): Formation and hydrocarbon potential: Journal of Petroleum Geology, v. 13, p. 93–112.
Windley, B.F., Allen, M.B., Zhang, C., Zhao, Z.Y., and Wang, G.R., 1990, Paleozoic accretion and Cenozoic

Yin et al.
876 Geological Society of America Bulletin, July/August 2008
redeformation of the Chinese Tien Shan Range, Cen-tral Asia: Geology, v. 18, p. 128–131, doi: 10.1130/0091-7613(1990)018<0128:PAACRO>2.3.CO;2.
Xia, W., Zhang, N., Yuan, X., Fan, L., and Zhang, B., 2001, Cenozoic Qaidam basin, China: A stronger tectonic inversed, extensional rifted basin: American Association of Petroleum Geologists Bulletin, v. 85, p. 715–736.
Yang, F., Ma, Z., Xu, T., and Ye, S., 1992, A Tertiary paleo-magnetic stratigraphic profi le in Qaidam basin: Acta Petrologica Sinica, v.13, p.97–101.
Yang, F., Sun, Z., Cao, C., Ma, Z., and Zhang, Y., 1997, Qua-ternary fossil ostracod zones and magnetostratigraphic profi le in the Qaidam basin: Acta Micropalaeotologica Sinica, v. 14, p. 378–390.
Yang, P., Sun, Z., Li, D., Jing, M., Fang, F., and Liu, H., 2000, Ostracoda extinction and explosion events of the Mesozoic–Cenozoic in Qaidam basin, northwest China: Journal of Palaeogeography, v. 2, p. 69-74
Yang, J.S., Xu, Z., Zhang, J.M., Chu, C.Y., Zhang, R., and Liou, J.G., 2001, Tectonic signifi cance of early Paleo-zoic high-pressure rocks in Altun-Qaidam-Qilian Mountains, northwest China, in Hendric, M.S., and Davis, G.A., eds., Paleozoic and Mesozoic tectonic evolution of central Asia: From continental assembly to intracontinental deformation: Geological Society of America Memoir 194, p. 151–170.
Yin, A., and Harrison, T.M., 2000, Geologic evolution of the Himalayan-Tibetan orogen: Annual Review of Earth and Planetary Sciences, v. 28, p. 211–280.
Yin, A., and Ingersoll, R.V., 1997, A model for evolu-tion of Laramide axial basins in the southern Rocky Mountains, USA: International Geology Review, v. 39, p. 1113–1123.
Yin, A., and Kelty, T.K., 1991, Structural evolution of the Lewis thrust system, southern Glacier National Park: Implica-tions for the regional tectonic development: Geological Society of America Bulletin, v. 103, p. 1073–1089, doi: 10.1130/0016-7606(1991)103<1073:SEOTLP>2.3.CO;2.
Yin, A., and Nie, S., 1996, A Phanerozoic palinspastic reconstruction of China and its neighboring regions, in Yin, A., and Harrison, T.M., eds., The tectonics of Asia: New York, Cambridge University Press, p. 442–485.
Yin, A., Harrison, T.M., Ryerson, F.J., Chen, W.J., Kidd, W.S.F., and Copeland, P., 1994, Tertiary structural evolution of the Gangdese thrust system, southeastern Tibet: Journal of Geophysical Research, v. 99, no. B9, p. 18,175–18,201, doi: 10.1029/94JB00504.
Yin, A., Nie, S., Craig, P., Harrison, T.M., Ryerson, Qian, X., and Young, G., 1998, Late Cenozoic tectonic evo-lution of the southern Chinese Tian Shan: Tectonics, v. 17, p. 1–27.
Yin, A., Rumelhart, P.E., Cowgill, E., Butler, R., Harrison, T.M., Ingersoll, R.V., Cooper, K., Zhang, Q., and Wang, X.-F., 2002, Tectonic history of the Altyn Tagh fault in northern Tibet inferred from Cenozoic sedi-mentation: Geological Society of America Bulletin, v. 114, p. 1257–1295, doi: 10.1130/0016-7606(2002)114<1257:THOTAT>2.0.CO;2.
Yin, A., McRivette, Burgess, W.P., and Chen, X., 2007a, Cenozoic tectonic evolution of Qaidam basin and its surrounding regions (Part 2): Wedge tectonics in south-ern Qaidam basin and the Eastern Kunlun Range, in Sears, J.W., Harms, T.A., and Evenchick, C.A., eds., Whence the Mountains? Inquiries into the evolution of orogenic systems: A volume in honor of Raymond Price: Geological Society of America Special Paper 433, p. 369–390, doi: 10.1130/2007.2433(18).
Yin, A., Manning, C.E., Lovera, O., Menold, C., Chen, X., and Gehrels, G.E., 2007b, Early Paleozoic tectonic and thermomechanical evolution of ultrahigh-pressure (UHP) metamorphic rocks in the northern Tibetan Plateau of NW China: International Geology Review, v. 49, p. 681-716.
Yin, A., Chen, X., McRivette, M.W., Wang, L., and Jiang, W., 2008, Cenozoic tectonic evolution of Qaidam basin and its surrounding regions (Part 1): The North Qaidam
thrust system: Geological Society of America Bulletin, doi:10.1130/B26180.1.
Yuan, W.M., Dong, J.Q., Wang, S.C., and Carter, A., 2006, Apatite fi ssion track evidence for Neogene uplift in the eastern Kunlun Mountains, northern Qinghai-Tibet Plateau: Journal of Asian Earth Sciences, v. 27, p. 847–856, doi: 10.1016/j.jseaes.2005.09.002.
Zhang, J.X., Yang, J.S., Mattinson, C.G., Xu, Z.Q., Meng, F.C., and Shi, R.D., 2005, Two contrasting eclogite cool-ing histories, North Qaidam HP/UHP terrane, western China: Petrological and isotopic constraints: Lithos, v. 84, p. 51–76, doi: 10.1016/j.lithos.2005.02.002.
Zhang, Y.C., 1997, Prototype of analysis of petroliferous basins in China: Nanjing, Nanjing University Press, 434 p.
Zhao, J.M., Mooney, W.D., Zhang, X.K., Li, Z.C., Jin, Z.J., and Okaya, N., 2006, Crustal structure across the Altyn Tagh Range at the northern margin of the Tibetan pla-teau and tectonic implications: Earth and Planetary Science Letters, v. 241, p. 804–814, doi: 10.1016/j.epsl.2005.11.003.
Zhou, J.X., Xu, F.Y., Wang, T.C., Cao, A.F., and Yin, C.M., 2006, Cenozoic deformation history of the Qaidam Basin, NW China: Results from cross-section res-toration and implications for Qinghai–Tibet Plateau tectonics: Earth and Planetary Science Letters, v. 243, p. 195–210, doi: 10.1016/j.epsl.2005.11.033.
Zhu, L.P., and Helmberger, D.V., 1998, Moho offset across the northern margin of the Tibetan Plateau: Science, v. 281, p. 1170–1172, doi: 10.1126/sci-ence.281.5380.1170.
MANUSCRIPT RECEIVED 24 MARCH 2007REVISED MANUSCRIPT RECEIVED 11 AUGUST 2007MANUSCRIPT ACCEPTED 14 AUGUST 2007
Printed in the USA