Embed Size (px)
Citation preview
8/3/2019 Census 2004 Overview
http://slidepdf.com/reader/full/census-2004-overview 1/48
1 © 2006 Pradet Timor Lorosae
PRADET Timor Lorosa’e
Timor Leste Census 2004
Overview
8/3/2019 Census 2004 Overview
http://slidepdf.com/reader/full/census-2004-overview 2/48
2 © 2006 Pradet Timor Lorosae
Table of ContentsTable of Contents..................................................................................................2 Acknowledgements...............................................................................................4
Errors and omissions.........................................................................................4
Introduction ...........................................................................................................5
Map of Timor Leste...............................................................................................7
Population.............................................................................................................8
Table 1 Timor Leste Resident Population By District 2004............................8
Chart 1 Timor Leste Population Pyramid 2004 census..................................9 Chart 2 Aileu District......................................................................................9
Chart 3 Ainaro District..................................................................................11
Chart 4 Bacau District ..................................................................................11 Chart 5 Bobonaro District ............................................................................12
Chart 6 Cova Lima District...........................................................................12
Chart 7 Dili District .......................................................................................13
Chart 8 Emera District .................................................................................13
Chart 9 Lautem District ................................................................................14
Chart 10 Liquica District...............................................................................14
Chart 11 Manatuto District ...........................................................................15
Chart 12 Manufahi District ...........................................................................15
Chart 13 Oecusse District............................................................................16
Chart 14 Viqueque District...........................................................................16 Social Characteristics .........................................................................................17
Marital status...................................................................................................17
Chart 15 Marital Status................................................................................17
Sex of the Head of the Household...................................................................17 Chart 16 Sex of the Head of the Household ................................................18
Household size................................................................................................18
Chart 17 Persons per Household.................................................................18
Fertility ................................................................................................................19
Chart 18 Rate /1000 Women reporting a birth in the year prior to the census.....................................................................................................................19 Chart 19 Population –individual years persons aged <18............................20
Chart 20 Percentage of First births <16 and Number of First births <16 byDistrict..........................................................................................................20 Chart 21 Median age of First births by District.............................................21
Education and Literacy .......................................................................................22 Chart 22 Male to Female Literacy ratio........................................................22
Chart 23 Male Literacy by District................................................................23
Chart 24 Female Literacy by District............................................................23
Chart 25 Reported Level of Education.........................................................24
Economic Activity................................................................................................25
Chart 26 Participation on the Labour Force ........................................................25
Chart 27 Main Activity of Labour Force Participants ...........................................26
8/3/2019 Census 2004 Overview
http://slidepdf.com/reader/full/census-2004-overview 3/48
3 © 2006 Pradet Timor Lorosae
Chart 28 Main Activity of People in the Labour Force..................................26
Chart 29 Days worked in the Week before the census ................................27
Disability .............................................................................................................28
Chart 30 Households with disabled members..............................................28
Housing...............................................................................................................29
Chart 31 Construction material of the floor of the dwelling ..........................29 Language............................................................................................................30
Table 2.1 Language by District of most speakers............................................30
Table 2.2 Language of Timor Leste Residents and Dili District.......................32 Regional Variation Maps.....................................................................................34
Map 2 Average Number of Persons per Household 2004 Census ..................35
Map 3 Population Density 2004 census .........................................................35
Map 3 Population Density 2004 census .........................................................36
Map 4 High School Graduates 2004 Census ..................................................37
Appendices .........................................................................................................38
Appendix 1 Population by District 2004 Census..............................................38
Appendix 2 Marital Status ..............................................................................41 Appendix 3 Sex of Head of Household...........................................................41
Appendix 4 Household size.............................................................................42 Appendix 5 Fertility..........................................................................................42
Appendix 6 Literacy and Education.................................................................44
Appendix 7 Labour force participation .............................................................45 Appendix 8 Households with disabled members.............................................47
Appendix 9 Construction material of the floor of dwellings..............................48
8/3/2019 Census 2004 Overview
http://slidepdf.com/reader/full/census-2004-overview 4/48
4 © 2006 Pradet Timor Lorosae
Acknowledgements
Sincere thanks and grateful acknowledgement must be given to Mr Ricardo
Neupert of the National Directorate Statistics, Dili for permission to use data fromthe Timor Leste Census of 2004
Grateful acknowledgement is also made to Mr Carlos R. Risopatron,UNOTILEconomic Advisor, Prime Minister’s Office, Timor Leste for permission toreproduce the maps showing regional variations.
Errors and omissions
Inevitably there will be errors in this document, some trivial, hopefully nonemajor. Your feedback would be gratefully appreciated [email protected] .
8/3/2019 Census 2004 Overview
http://slidepdf.com/reader/full/census-2004-overview 5/48
5 © 2006 Pradet Timor Lorosae
Introduction
As a census is both expensive and logistically difficult to undertake, it is usual to
collect information on as many variables as possible. Both for reasons ofconfidentially and as most users do not have the capacity to analyze unit recordlevel data, it is usual to present the data a multilevel tables at variousgeographical levels, for example suco, sub district, district and country. Whilemultilevel tables retain as much information as possible by selected majordimensions (geographical unit, age, sex etc.) the amount of information includedin each table presents more complexity than most people can interpret.Comparison between units is difficult both because of the complexity of thetables and the differing size of the population in each table.
The aim of this document is to extract only small amounts of data that may be of
interest in a community service context and to present it in a way that facilitatescomparison between districts. The document contains both charts to assist invisually understanding the data, and tables that show the raw numbers on whichthe charts were based. The census data contains much more detail than hasbeen shown here. For access to that detail see the National DirectorateStatistics, Dili website at http://dne.mopf.gov.tl/ or contact :
Direcao Nacional de EstatisticaCaicoli, DiliTimor-Leste
Phone:670-3339527
8/3/2019 Census 2004 Overview
http://slidepdf.com/reader/full/census-2004-overview 6/48
6 © 2006 Pradet Timor Lorosae
8/3/2019 Census 2004 Overview
http://slidepdf.com/reader/full/census-2004-overview 7/48
7 © 2006 Pradet Timor Lorosae
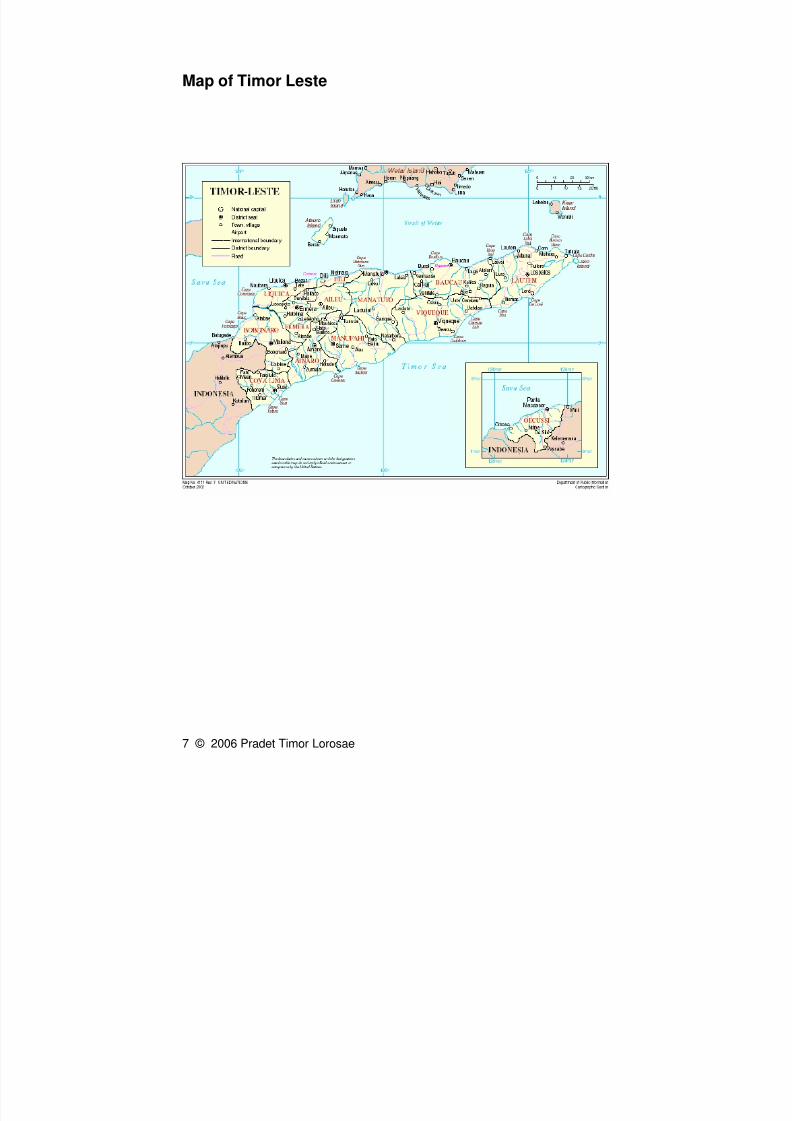
Map of Timor Leste
8/3/2019 Census 2004 Overview
http://slidepdf.com/reader/full/census-2004-overview 8/48
8 © 2006 Pradet Timor Lorosae
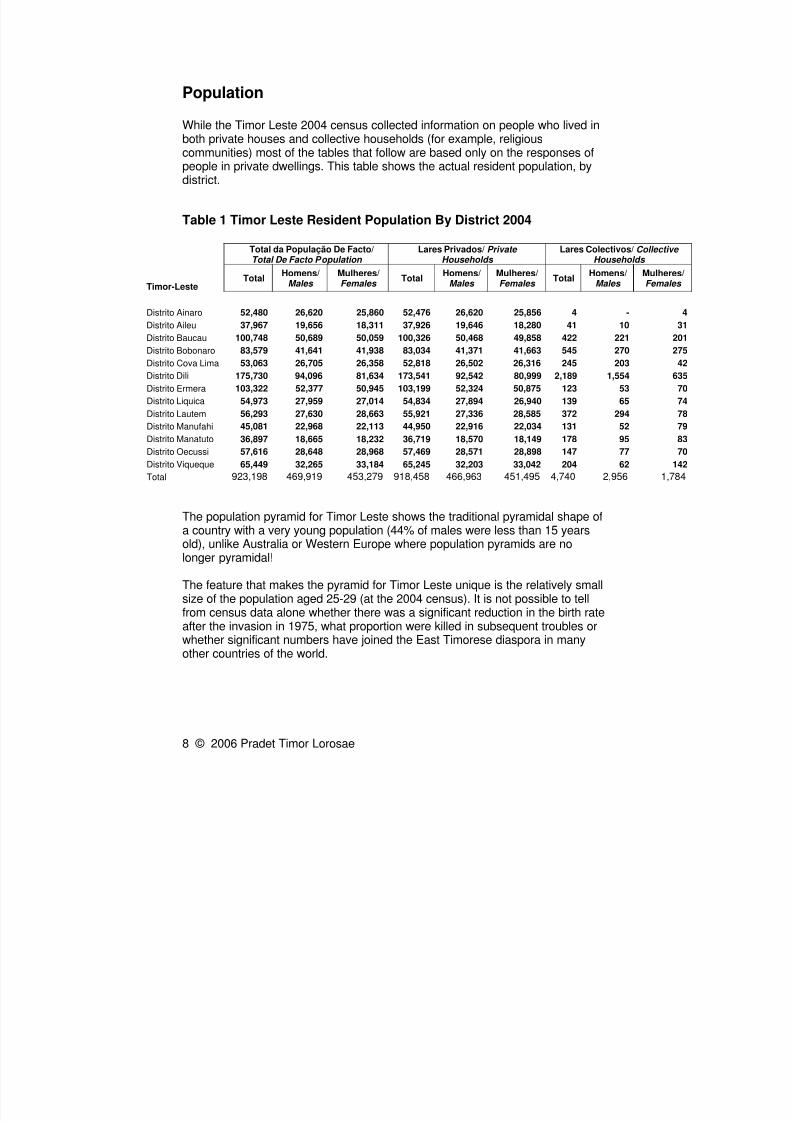
Population
While the Timor Leste 2004 census collected information on people who lived inboth private houses and collective households (for example, religious
communities) most of the tables that follow are based only on the responses ofpeople in private dwellings. This table shows the actual resident population, bydistrict.
Table 1 Timor Leste Resident Population By District 2004
Total da População De Facto/Total De Facto Population
Lares Privados/ Private Households
Lares Colectivos/ CollecHouseholds
Timor-LesteTotal
Homens/Males
Mulheres/Females
TotalHomens/
Males Mulheres/Females
TotalHomens/
Males MulhFem
Distrito Ainaro 52,480 26,620 25,860 52,476 26,620 25,856 4 -
Distrito Aileu 37,967 19,656 18,311 37,926 19,646 18,280 41 10
Distrito Baucau 100,748 50,689 50,059 100,326 50,468 49,858 422 221
Distrito Bobonaro 83,579 41,641 41,938 83,034 41,371 41,663 545 270
Distrito Cova Lima 53,063 26,705 26,358 52,818 26,502 26,316 245 203
Distrito Dili 175,730 94,096 81,634 173,541 92,542 80,999 2,189 1,554
Distrito Ermera 103,322 52,377 50,945 103,199 52,324 50,875 123 53
Distrito Liquica 54,973 27,959 27,014 54,834 27,894 26,940 139 65
Distrito Lautem 56,293 27,630 28,663 55,921 27,336 28,585 372 294
Distrito Manufahi 45,081 22,968 22,113 44,950 22,916 22,034 131 52
Distrito Manatuto 36,897 18,665 18,232 36,719 18,570 18,149 178 95
Distrito Oecussi 57,616 28,648 28,968 57,469 28,571 28,898 147 77 Distrito Viqueque 65,449 32,265 33,184 65,245 32,203 33,042 204 62
Total 923,198 469,919 453,279 918,458 466,963 451,495 4,740 2,956
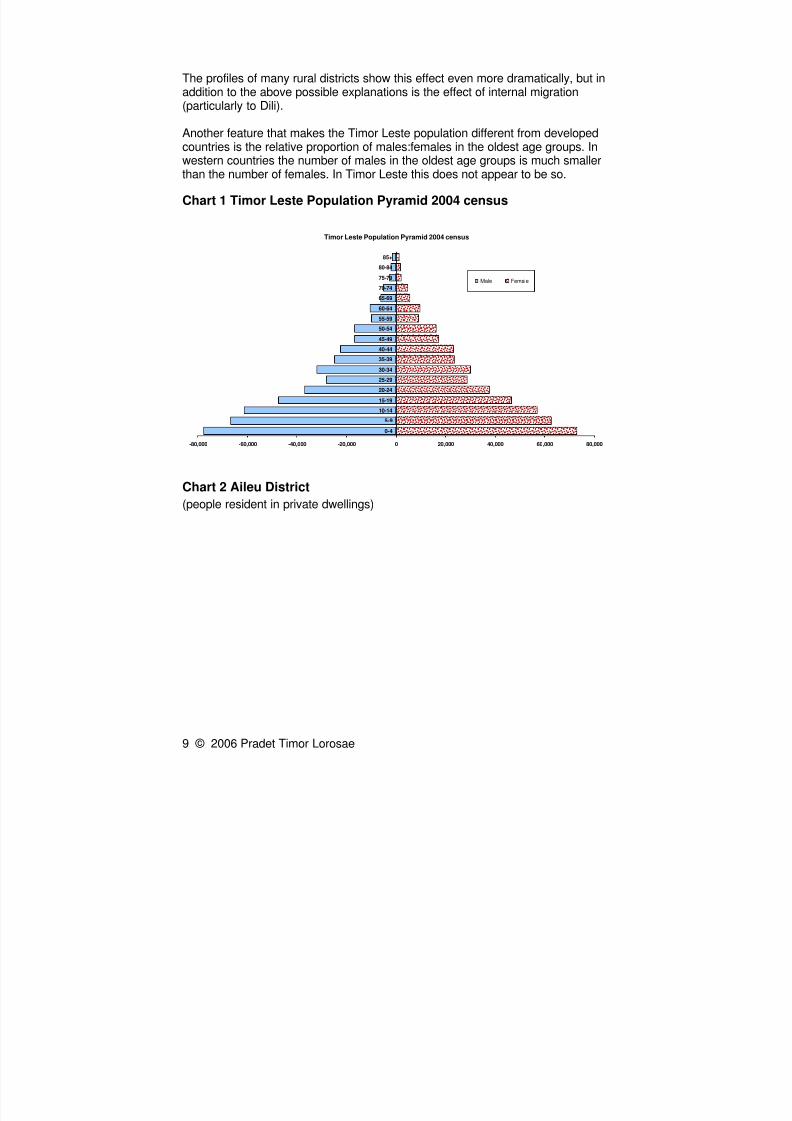
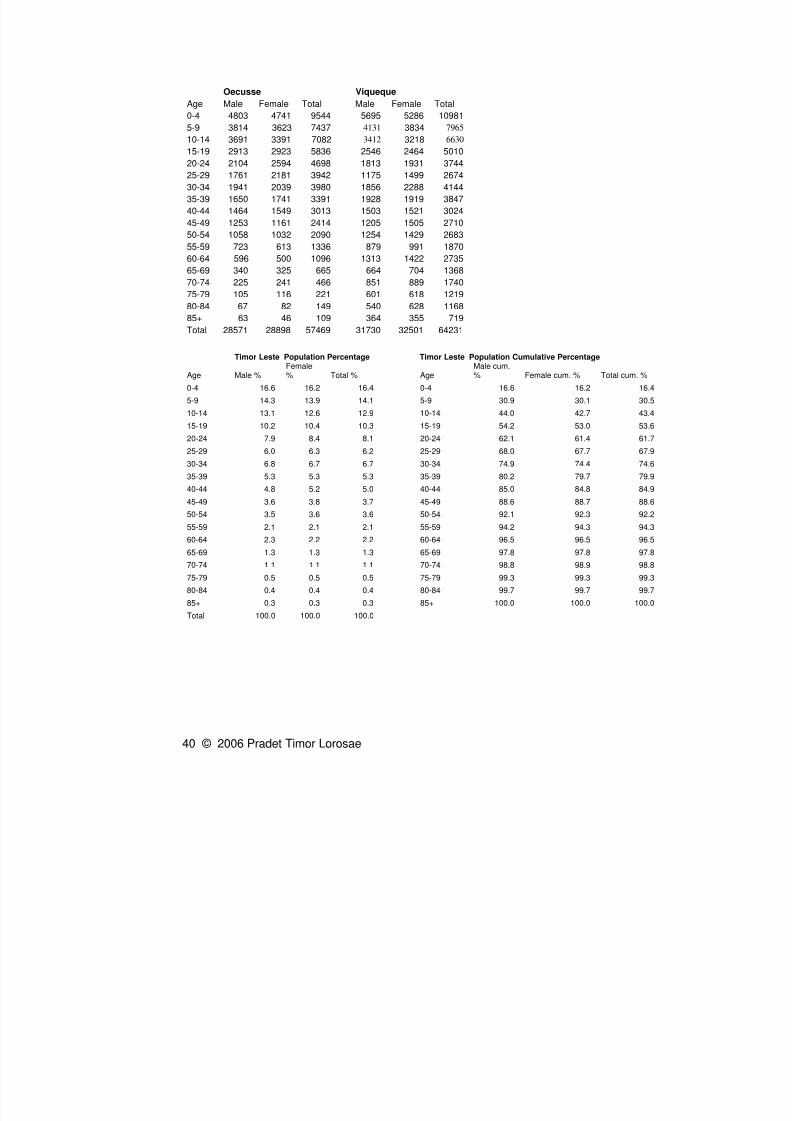
The population pyramid for Timor Leste shows the traditional pyramidal shape ofa country with a very young population (44% of males were less than 15 yearsold), unlike Australia or Western Europe where population pyramids are nolonger pyramidal!
The feature that makes the pyramid for Timor Leste unique is the relatively smallsize of the population aged 25-29 (at the 2004 census). It is not possible to tellfrom census data alone whether there was a significant reduction in the birth rateafter the invasion in 1975, what proportion were killed in subsequent troubles orwhether significant numbers have joined the East Timorese diaspora in manyother countries of the world.
8/3/2019 Census 2004 Overview
http://slidepdf.com/reader/full/census-2004-overview 9/48
8/3/2019 Census 2004 Overview
http://slidepdf.com/reader/full/census-2004-overview 10/48
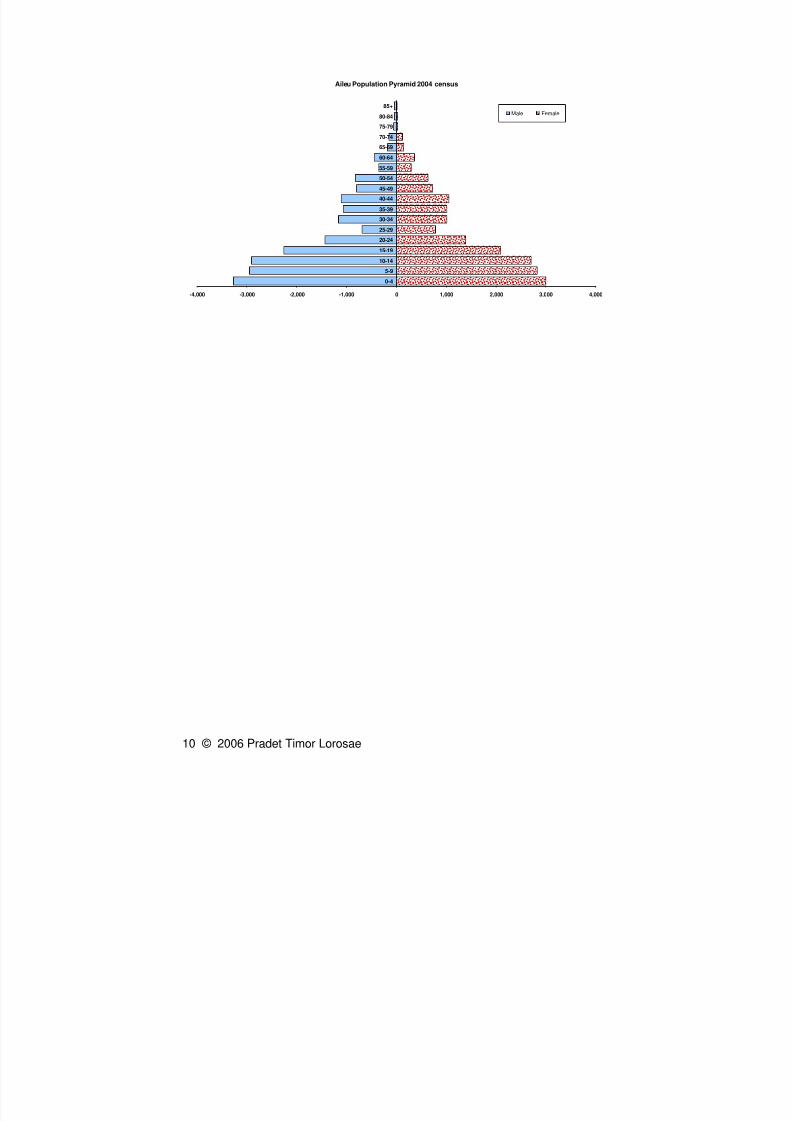
10 © 2006 Pradet Timor Lorosae
Aileu Population Pyramid 2004 census
-4,000 -3,000 -2,000 -1,000 0 1,000 2,000 3,000 4,000
0-4
5-9
10-14
15-19
20-24
25-29
30-34
35-39
40-44
45-49
50-54
55-59
60-64
65-69
70-74
75-79
80-84
85+
Male Female
8/3/2019 Census 2004 Overview
http://slidepdf.com/reader/full/census-2004-overview 11/48
11 © 2006 Pradet Timor Lorosae
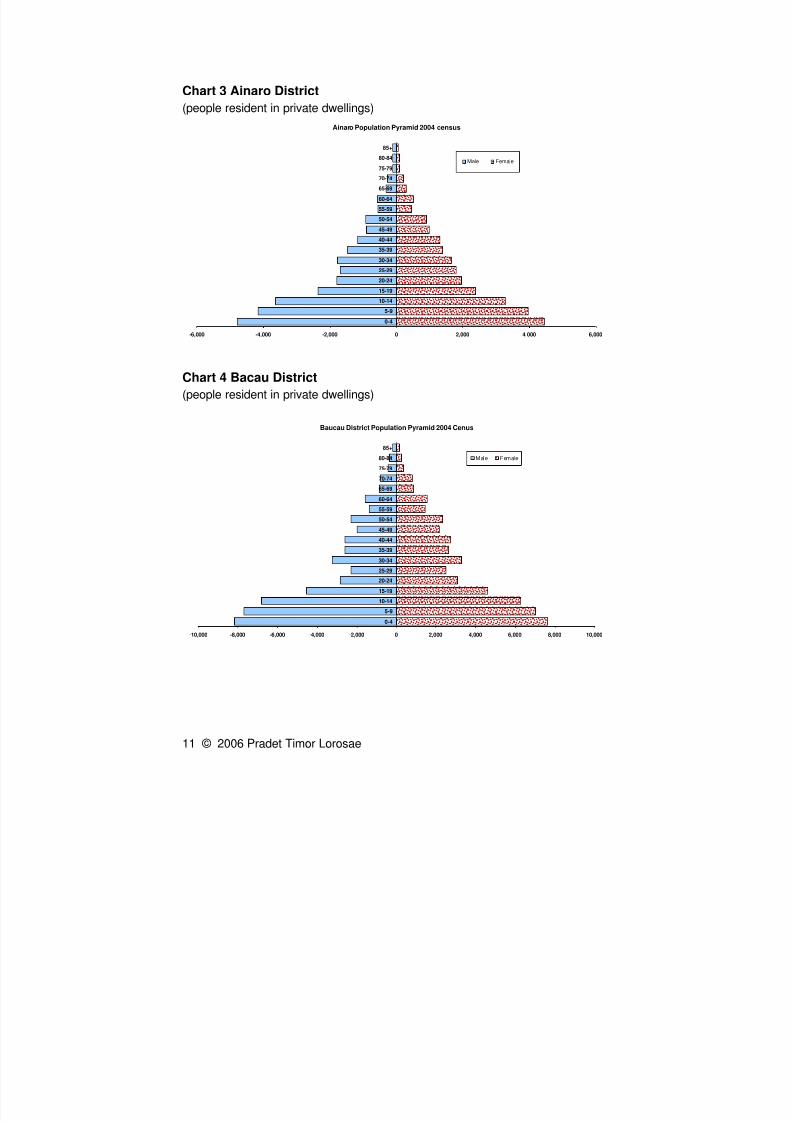
Chart 3 Ainaro District
(people resident in private dwellings)
Ainaro Population Pyramid 2004 census
-6,000 -4,000 -2,000 0 2,000 4,000 6,000
0-4
5-910-14
15-19
20-24
25-29
30-34
35-39
40-44
45-49
50-54
55-59
60-64
65-69
70-74
75-79
80-84
85+
Male Female
Chart 4 Bacau District
(people resident in private dwellings)
Baucau District Population Pyramid 2004 Cenus
-10,000 -8,000 -6,000 -4,000 -2,000 0 2,000 4,000 6,000 8,000 10,000
0-4
5-9
10-14
15-19
20-24
25-29
30-34
35-39
40-44
45-49
50-54
55-59
60-64
65-69
70-74
75-79
80-84
85+
Male Female
8/3/2019 Census 2004 Overview
http://slidepdf.com/reader/full/census-2004-overview 12/48
12 © 2006 Pradet Timor Lorosae
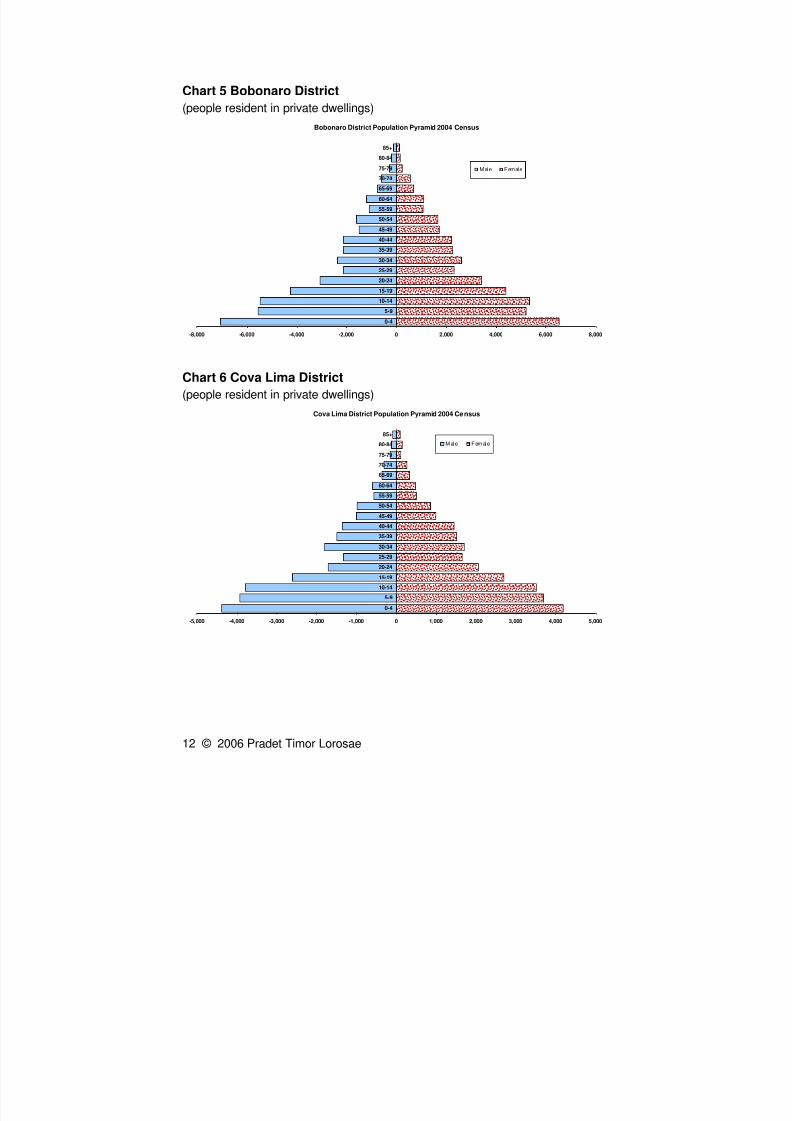
Chart 5 Bobonaro District
(people resident in private dwellings)
Bobonaro District Population Pyramid 2004 Census
-8,000 -6,000 -4,000 -2,000 0 2,000 4,000 6,000 8,000
0-4
5-910-14
15-19
20-24
25-29
30-34
35-39
40-44
45-49
50-54
55-59
60-64
65-69
70-74
75-79
80-84
85+
Male Female
Chart 6 Cova Lima District
(people resident in private dwellings)
Cova Lima District Population Pyramid 2004 Census
-5,000 -4,000 -3,000 -2,000 -1,000 0 1,000 2,000 3,000 4,000 5,000
0-4
5-9
10-14
15-19
20-24
25-29
30-34
35-39
40-44
45-49
50-54
55-59
60-64
65-69
70-74
75-79
80-84
85+
Male Female
8/3/2019 Census 2004 Overview
http://slidepdf.com/reader/full/census-2004-overview 13/48
13 © 2006 Pradet Timor Lorosae
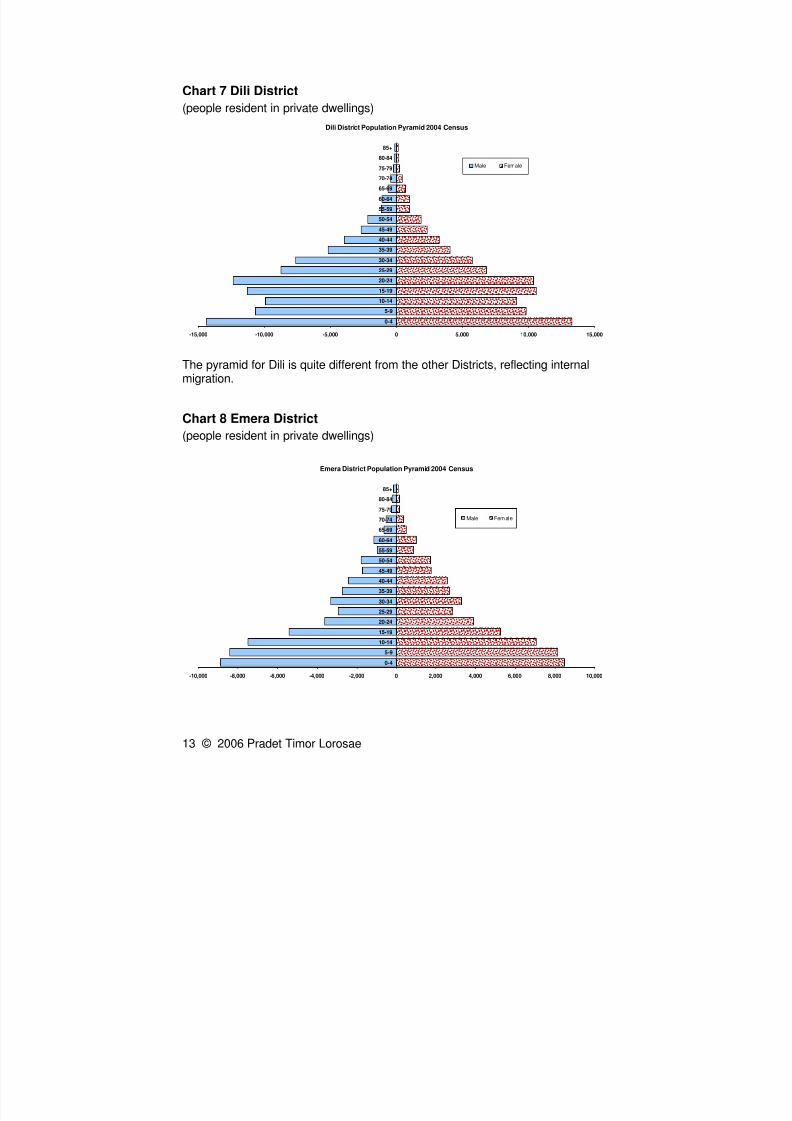
Chart 7 Dili District
(people resident in private dwellings)
Dili District Population Pyramid 2004 Census
-15,000 -10,000 -5,000 0 5,000 10,000 15,000
0-4
5-910-14
15-19
20-24
25-29
30-34
35-39
40-44
45-49
50-54
55-59
60-64
65-69
70-74
75-79
80-84
85+
Male Female
The pyramid for Dili is quite different from the other Districts, reflecting internalmigration.
Chart 8 Emera District
(people resident in private dwellings)
Emera District Population Pyramid 2004 Census
-10,000 -8,000 -6,000 -4,000 -2,000 0 2,000 4,000 6,000 8,000 10,000
0-4
5-9
10-14
15-19
20-24
25-29
30-34
35-39
40-44
45-49
50-54
55-59
60-64
65-69
70-74
75-79
80-84
85+
Male Fem al e
8/3/2019 Census 2004 Overview
http://slidepdf.com/reader/full/census-2004-overview 14/48
14 © 2006 Pradet Timor Lorosae
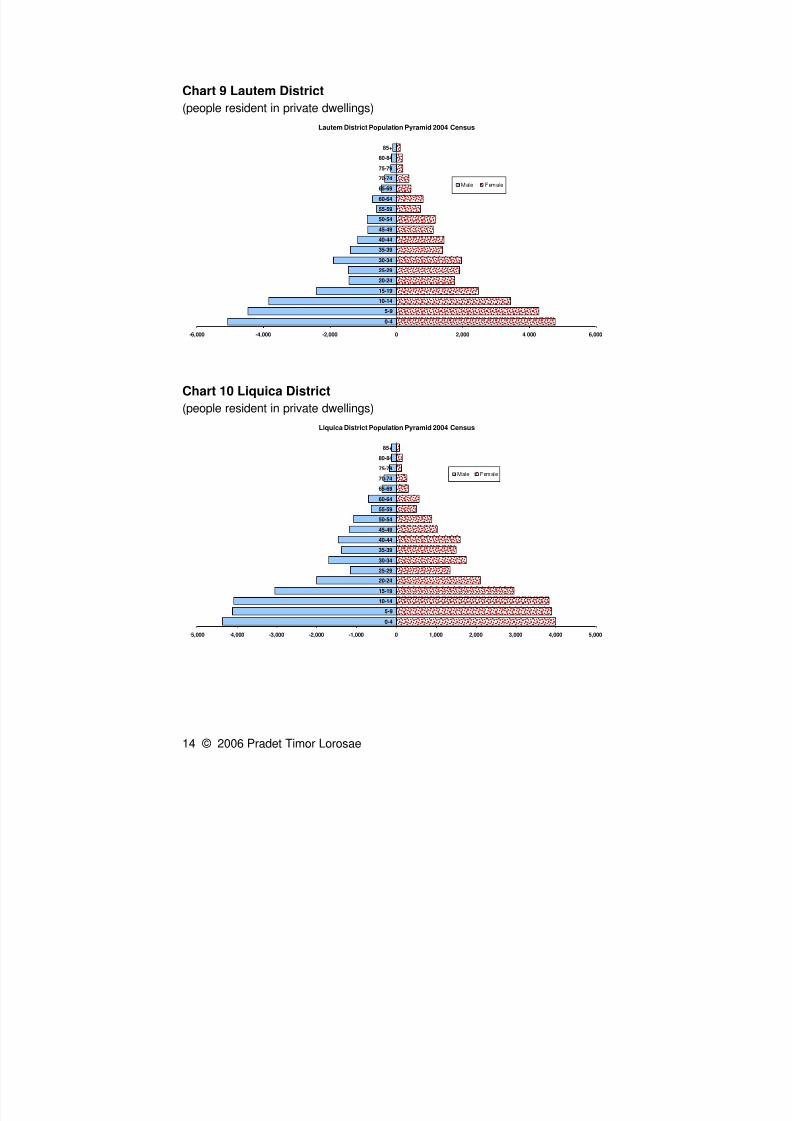
Chart 9 Lautem District
(people resident in private dwellings)
Lautem District Population Pyramid 2004 Census
-6,000 -4,000 -2,000 0 2,000 4,000 6,000
0-4
5-910-14
15-19
20-24
25-29
30-34
35-39
40-44
45-49
50-54
55-59
60-64
65-69
70-74
75-79
80-84
85+
Male Female
Chart 10 Liquica District
(people resident in private dwellings)
Liquica District Population Pyramid 2004 Census
-5,000 -4,000 -3,000 -2,000 -1,000 0 1,000 2,000 3,000 4,000 5,000
0-4
5-9
10-14
15-19
20-24
25-29
30-34
35-39
40-44
45-49
50-54
55-59
60-64
65-69
70-74
75-79
80-84
85+
Male Female
8/3/2019 Census 2004 Overview
http://slidepdf.com/reader/full/census-2004-overview 15/48
15 © 2006 Pradet Timor Lorosae
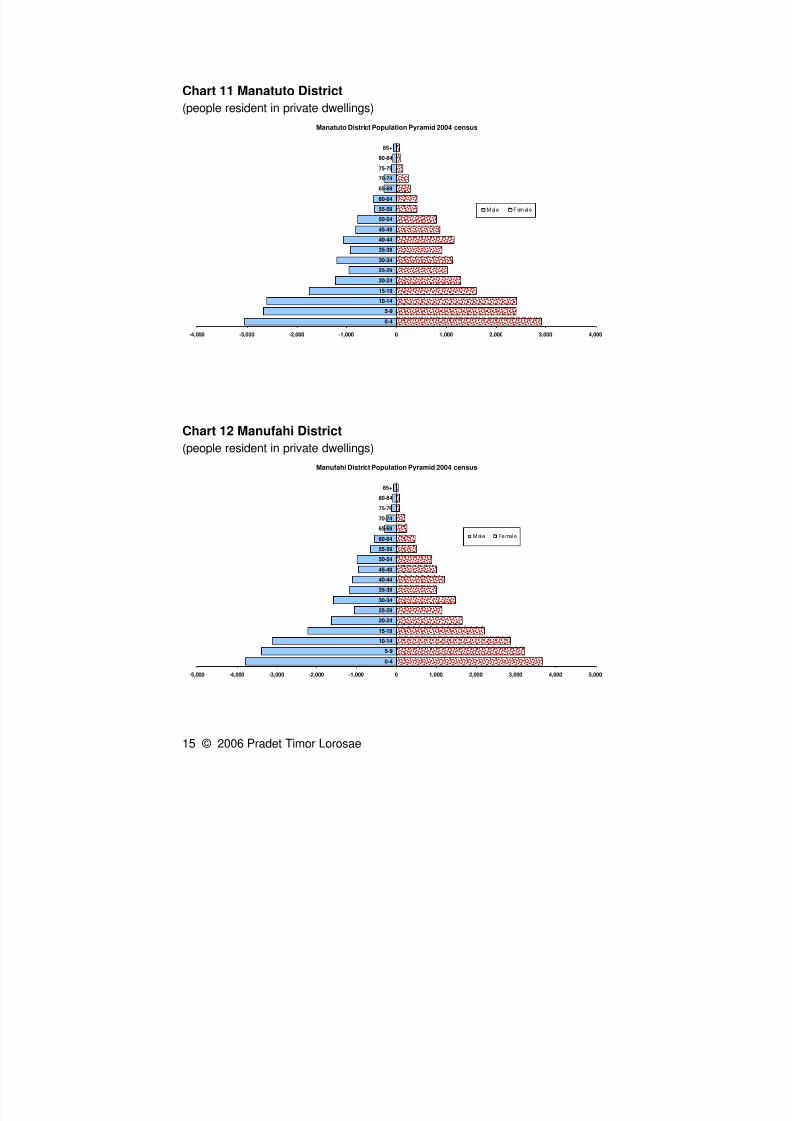
Chart 11 Manatuto District
(people resident in private dwellings)
Manatuto District Population Pyramid 2004 census
-4,000 -3,000 -2,000 -1,000 0 1,000 2,000 3,000 4,000
0-4
5-910-14
15-19
20-24
25-29
30-34
35-39
40-44
45-49
50-54
55-59
60-64
65-69
70-74
75-79
80-84
85+
Male Female
Chart 12 Manufahi District
(people resident in private dwellings)
Manufahi District Population Pyramid 2004 census
-5,000 -4,000 -3,000 -2,000 -1,000 0 1,000 2,000 3,000 4,000 5,000
0-4
5-9
10-14
15-19
20-24
25-29
30-34
35-39
40-44
45-49
50-54
55-59
60-64
65-69
70-74
75-79
80-84
85+
Male Female
8/3/2019 Census 2004 Overview
http://slidepdf.com/reader/full/census-2004-overview 16/48
16 © 2006 Pradet Timor Lorosae
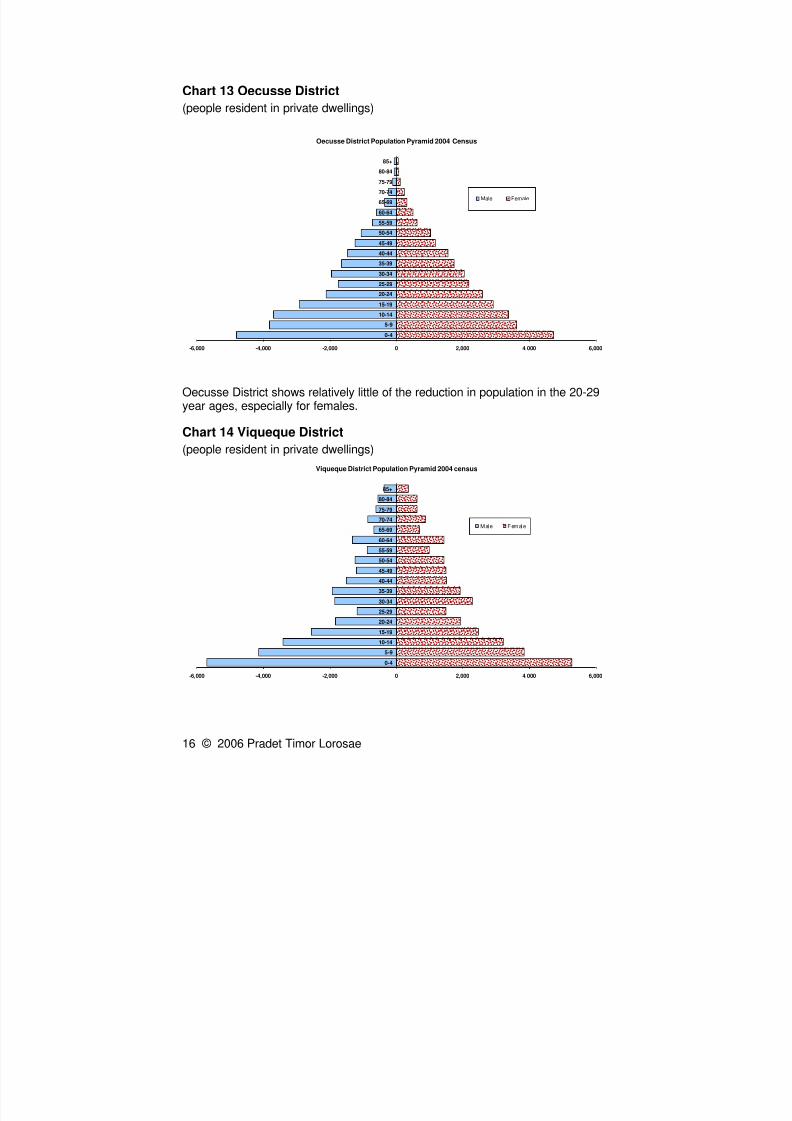
Chart 13 Oecusse District
(people resident in private dwellings)
Oecusse District Population Pyramid 2004 Census
-6,000 -4,000 -2,000 0 2,000 4,000 6,000
0-4
5-9
10-14
15-19
20-24
25-29
30-34
35-39
40-44
45-49
50-54
55-59
60-64
65-69
70-74
75-79
80-84
85+
Male Female
Oecusse District shows relatively little of the reduction in population in the 20-29year ages, especially for females.
Chart 14 Viqueque District
(people resident in private dwellings)Viqueque District Population Pyramid 2004 census
-6,000 -4,000 -2,000 0 2,000 4,000 6,000
0-4
5-9
10-14
15-19
20-24
25-29
30-34
35-39
40-44
45-49
50-54
55-59
60-64
65-69
70-74
75-79
80-84
85+
Male Female
8/3/2019 Census 2004 Overview
http://slidepdf.com/reader/full/census-2004-overview 17/48
17 © 2006 Pradet Timor Lorosae
Social Characteristics
Marital status
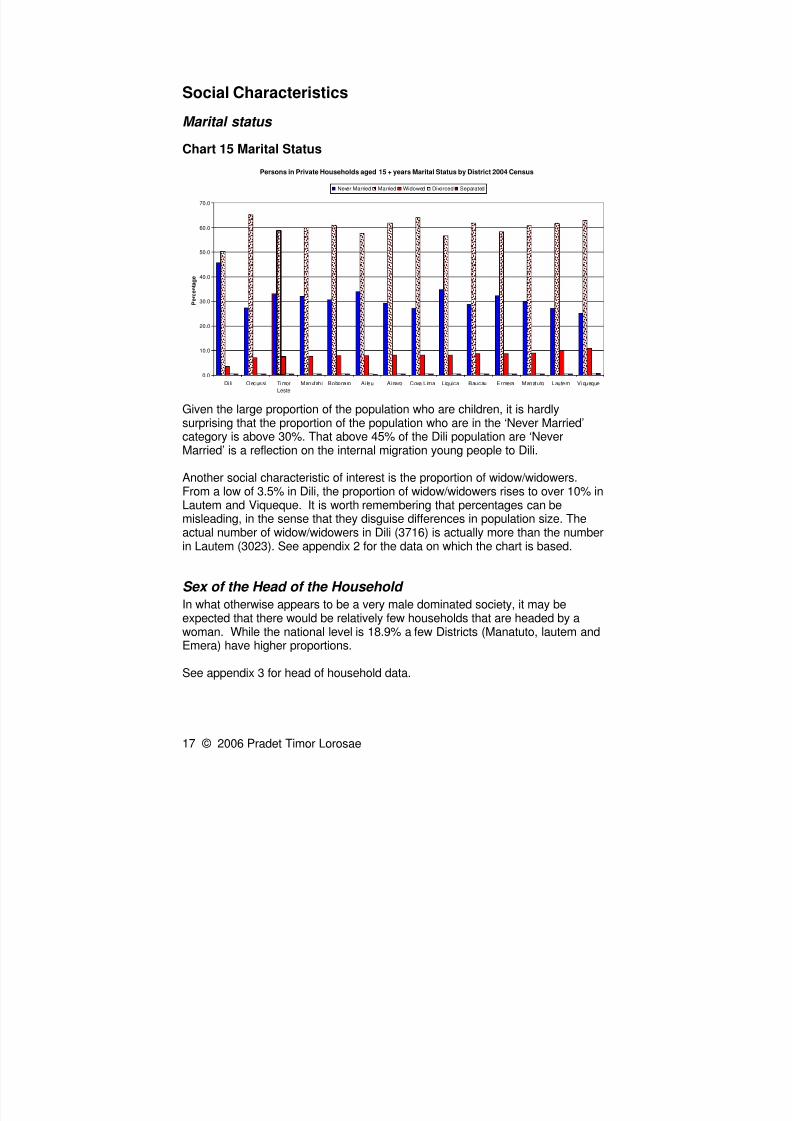
Chart 15 Marital StatusPersons in Private Households aged 15 + years Marital Status by District 2004 Census
0.0
10.0
20.0
30.0
40.0
50.0
60.0
70.0
Di li Oecussi Timor
Leste
Manufahi Bobonaro Aileu Ainaro Cova Lima Liquica Baucau Ermera Manatuto Lautem Viqueque
P
e r c e n t a g e
Never Married Married Widowed Divorced Separated
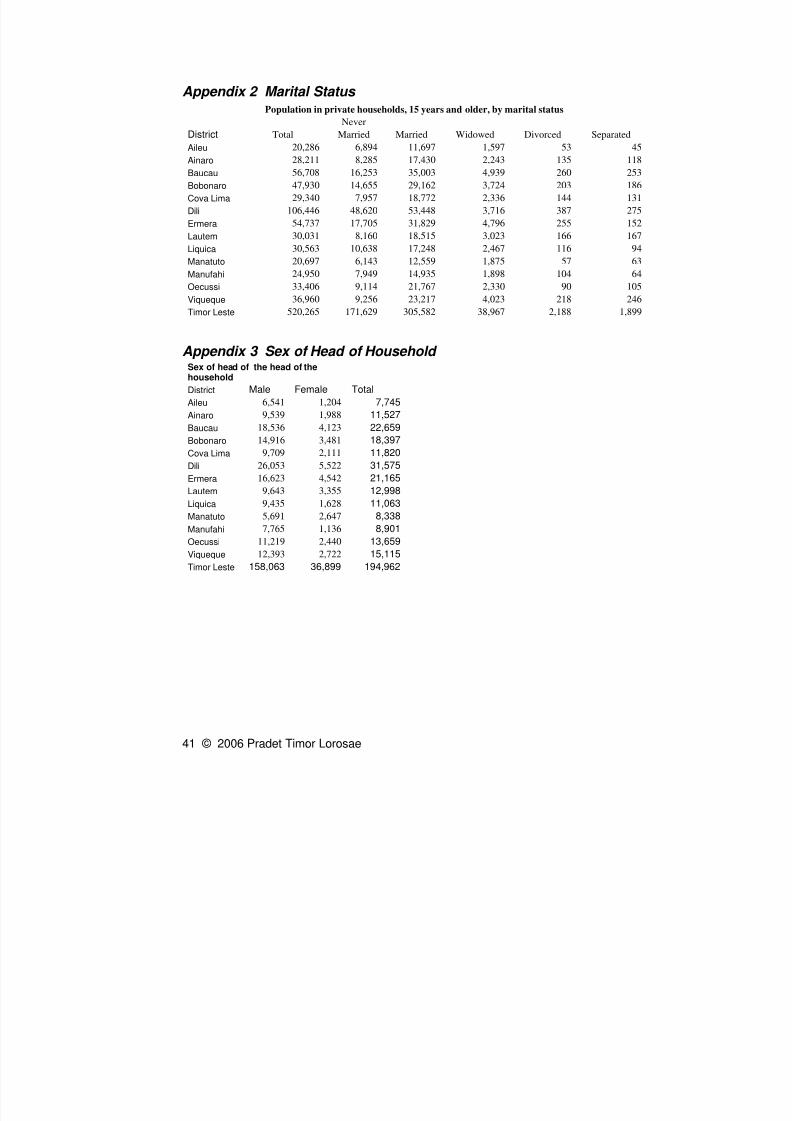
Given the large proportion of the population who are children, it is hardlysurprising that the proportion of the population who are in the ‘Never Married’category is above 30%. That above 45% of the Dili population are ‘Never
Married’ is a reflection on the internal migration young people to Dili.
Another social characteristic of interest is the proportion of widow/widowers.From a low of 3.5% in Dili, the proportion of widow/widowers rises to over 10% inLautem and Viqueque. It is worth remembering that percentages can bemisleading, in the sense that they disguise differences in population size. Theactual number of widow/widowers in Dili (3716) is actually more than the numberin Lautem (3023). See appendix 2 for the data on which the chart is based.
Sex of the Head of the Household
In what otherwise appears to be a very male dominated society, it may beexpected that there would be relatively few households that are headed by awoman. While the national level is 18.9% a few Districts (Manatuto, lautem andEmera) have higher proportions.
See appendix 3 for head of household data.
8/3/2019 Census 2004 Overview
http://slidepdf.com/reader/full/census-2004-overview 18/48
18 © 2006 Pradet Timor Lorosae
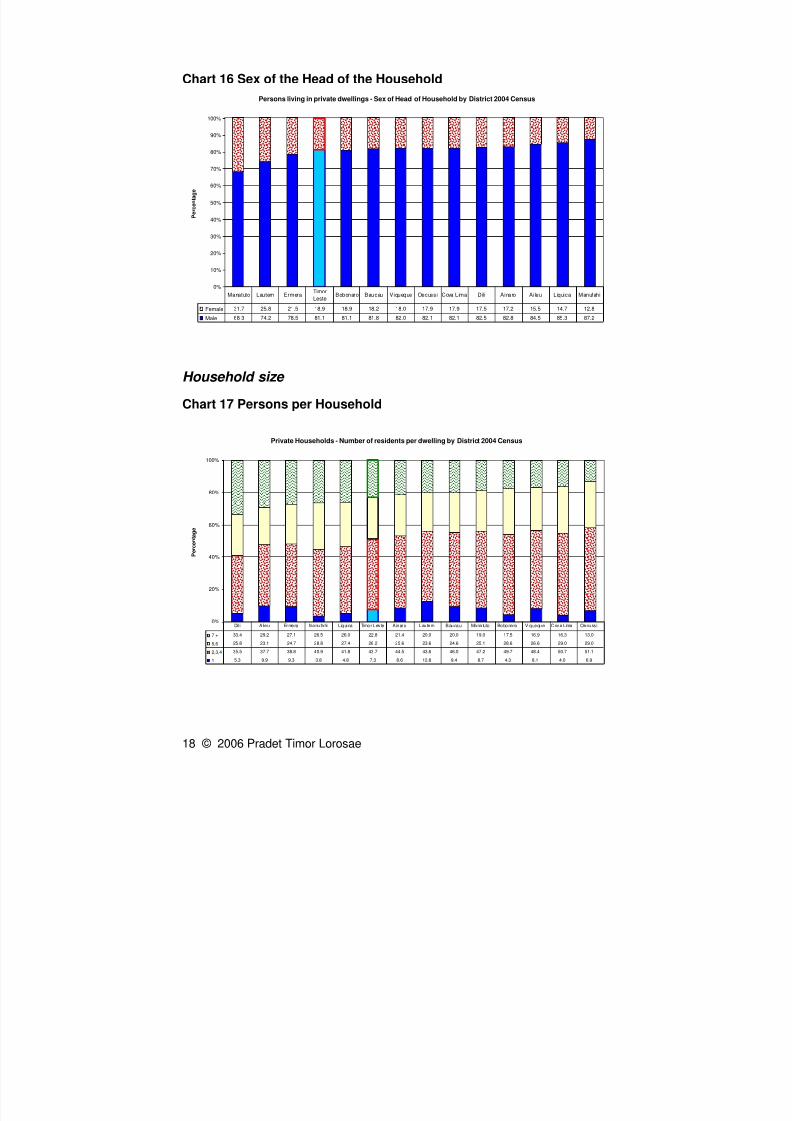
Chart 16 Sex of the Head of the Household
Persons living in private dwellings - Sex of Head of Household by District 2004 Census
0%
10%
20%
30%
40%
50%
60%
70%
80%
90%
100%
P e r c e n t a g e
Female 31.7 25.8 21.5 18.9 18.9 18.2 18.0 17.9 17.9 17.5 17.2 15.5 14.7 12.8
Male 68.3 74.2 78.5 81.1 81.1 81.8 82.0 82.1 82.1 82.5 82.8 84.5 85.3 87.2
Manatuto Lautem ErmeraTimor
LesteBobonaro Baucau Viqueque Oecussi Cova Lima Dili Ainaro Aileu Liquica Manufahi
Household size
Chart 17 Persons per Household
Private Households - Number of residents per dwelling by District 2004 Census
0%
20%
40%
60%
80%
100%
P e r c e n t a g e
7 + 33.4 29.2 27.1 26.5 26.0 22.8 21.4 20.0 20.0 19.0 17.5 16.9 16.3 13.0
5,6 25.8 23.1 24.7 28.8 27.4 26.2 25.6 23.6 24.6 25.1 28.6 26.6 29.0 29.0
2,3,4 35.5 37.7 38.8 40.9 41.8 43.7 44.5 43.6 46.0 47.2 49.7 48.4 50.7 51.1
1 5.3 9.9 9.3 3.8 4.8 7.3 8.6 12.8 9.4 8.7 4.3 8.1 4.0 6.9
Dil i A ileu Ermera Manufahi L iquica Timor Leste A inaro Lautem Baucau Manatu to Bobonaro V iqueque Cova L ima Oecuss i
8/3/2019 Census 2004 Overview
http://slidepdf.com/reader/full/census-2004-overview 19/48
19 © 2006 Pradet Timor Lorosae
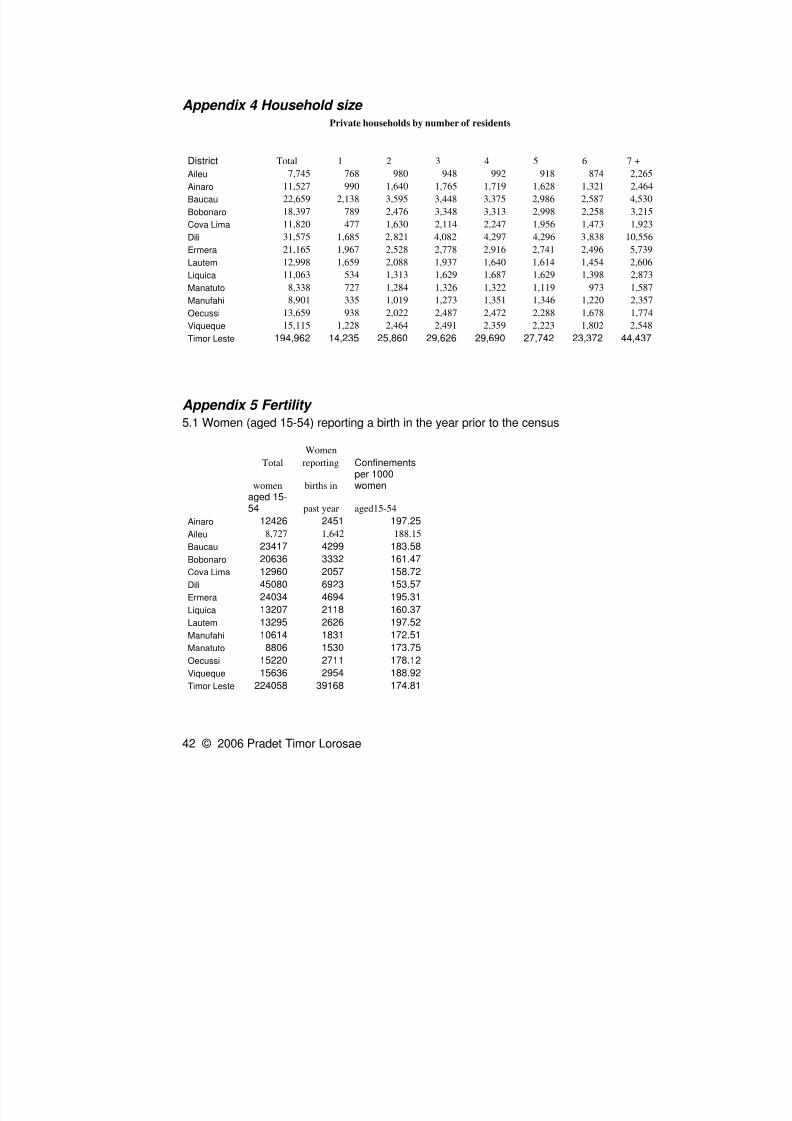
With the internal migration to Dili, it is probably not unexpected that there shouldbe some pressure on household size there. Aileu and Emera districts aresurprisingly similar, while Oecusse has comparatively few large households.
See appendix 4 for additional household size data.
Fertility
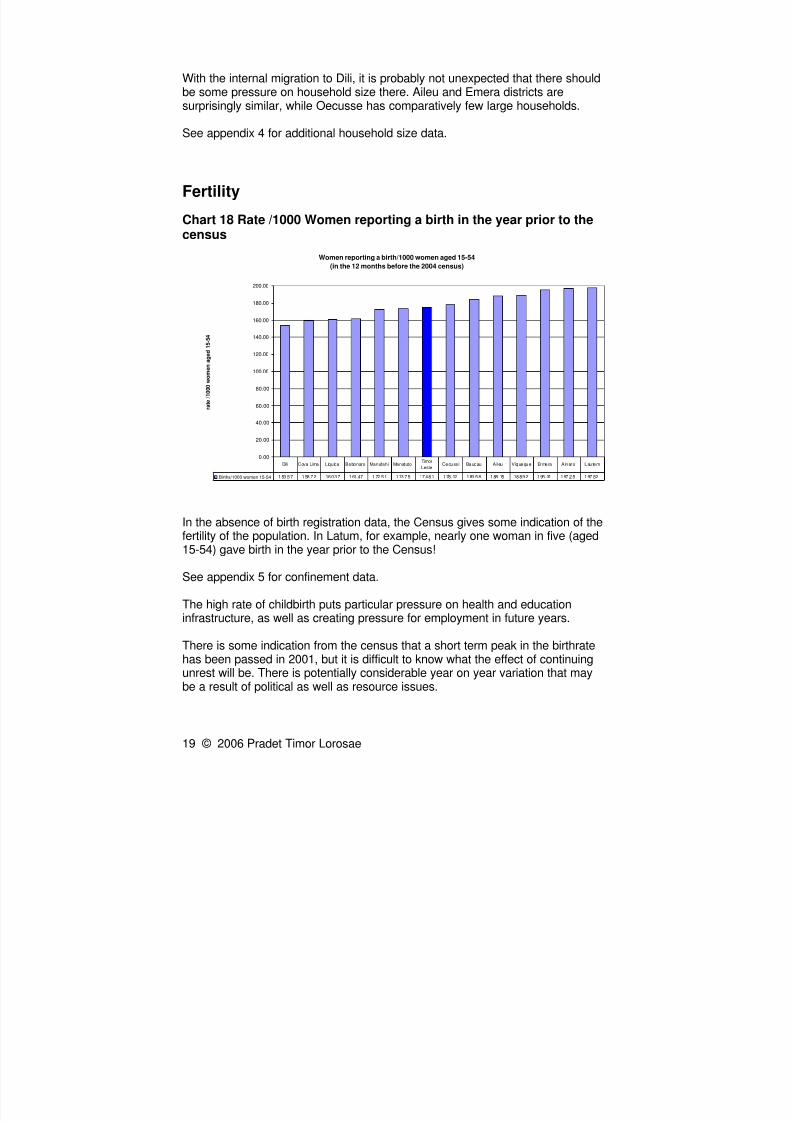
Chart 18 Rate /1000 Women reporting a birth in the year prior to thecensus
Women reporting a birth/1000 women aged 15-54
(in the 12 months before the 2004 census)
0.00
20.00
40.00
60.00
80.00
100.00
120.00
140.00
160.00
180.00
200.00
r a t e / 1 0 0 0 w o m e n a g e d 1 5 - 5 4
Births/1000 women 15-54 1 53 .5 7 1 58.7 2 16 0.3 7 1 61 .47 1 72 .5 1 1 73.7 5 17 4.8 1 1 78. 12 1 83 .5 8 1 88. 15 18 8.9 2 1 95. 31 1 97 .2 5 1 97 .52
Dili Cova Lima Liquica Bobonaro Manufahi ManatutoTimor
LesteOecuss i Baucau A ileu V iqueque Ermera A inaro Lautem
In the absence of birth registration data, the Census gives some indication of thefertility of the population. In Latum, for example, nearly one woman in five (aged15-54) gave birth in the year prior to the Census!
See appendix 5 for confinement data.
The high rate of childbirth puts particular pressure on health and educationinfrastructure, as well as creating pressure for employment in future years.
There is some indication from the census that a short term peak in the birthratehas been passed in 2001, but it is difficult to know what the effect of continuingunrest will be. There is potentially considerable year on year variation that maybe a result of political as well as resource issues.
8/3/2019 Census 2004 Overview
http://slidepdf.com/reader/full/census-2004-overview 20/48
20 © 2006 Pradet Timor Lorosae
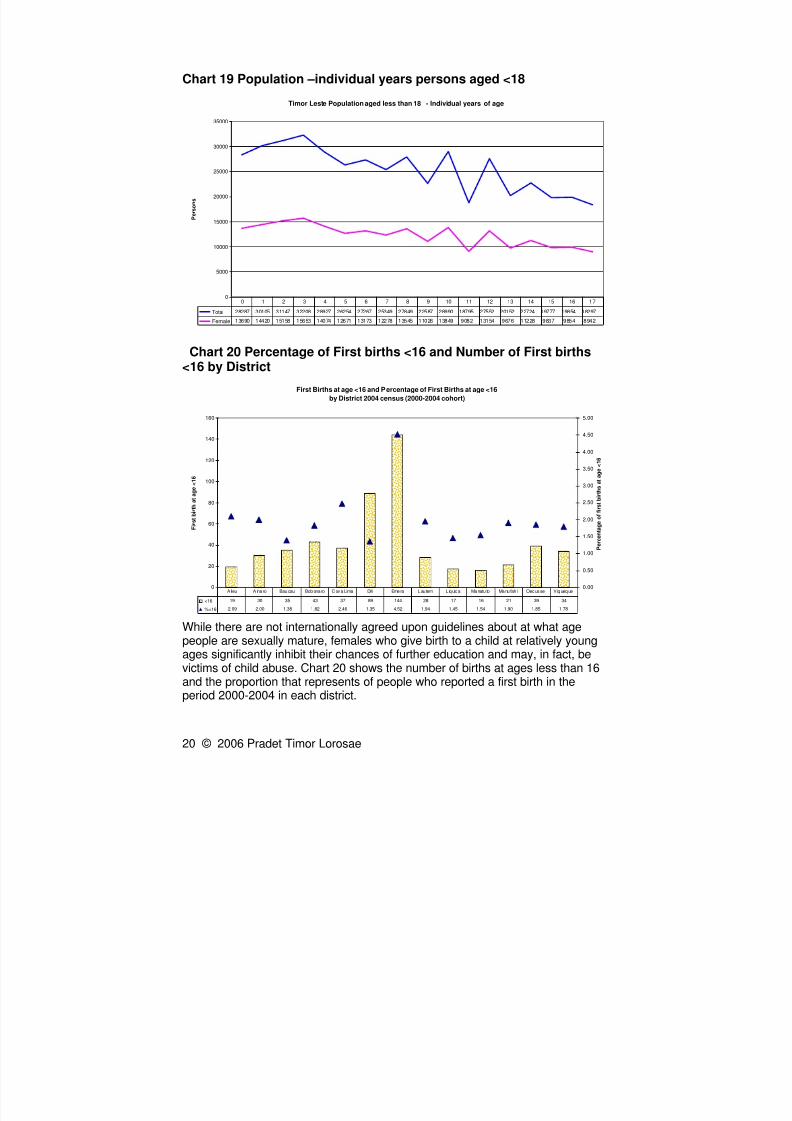
Chart 19 Population –individual years persons aged <18
Timor Leste Population aged less than 18 - Individual years of age
0
5000
10000
15000
20000
25000
30000
35000
P e r s o n s
Total 28287 30105 31147 32208 28927 26254 27267 25349 27849 22587 28990 18795 27552 20152 22724 19777 19854 18297
Female 13690 14420 15158 15653 14074 12671 13173 12278 13545 11026 13849 9082 13154 9676 11228 9837 9854 8942
0 1 2 3 4 5 6 7 8 9 10 11 12 13 14 15 16 17
Chart 20 Percentage of First births <16 and Number of First births<16 by District
First Births at age <16 and Percentage of First Births at age <16
by District 2004 census (2000-2004 cohort)
0
20
40
60
80
100
120
140
160
F i r s t b i r t h a t a g e < 1 6
0.00
0.50
1.00
1.50
2.00
2.50
3.00
3.50
4.00
4.50
5.00
P e r c e n t a g e o f f i r s t b i r t h s a t a g e < 1 6
<16 19 30 35 43 37 89 144 28 17 16 21 39 34
%<16 2.09 2.00 1.38 1.82 2.46 1.35 4.52 1.94 1.45 1.54 1.90 1.85 1.78
A ileu A ina ro Bau cau Bob ona ro C ov a Lima Dili Eme ra L au tem L iq uic a Ma natu to Ma nu fah i Oec us se V iq ueq ue
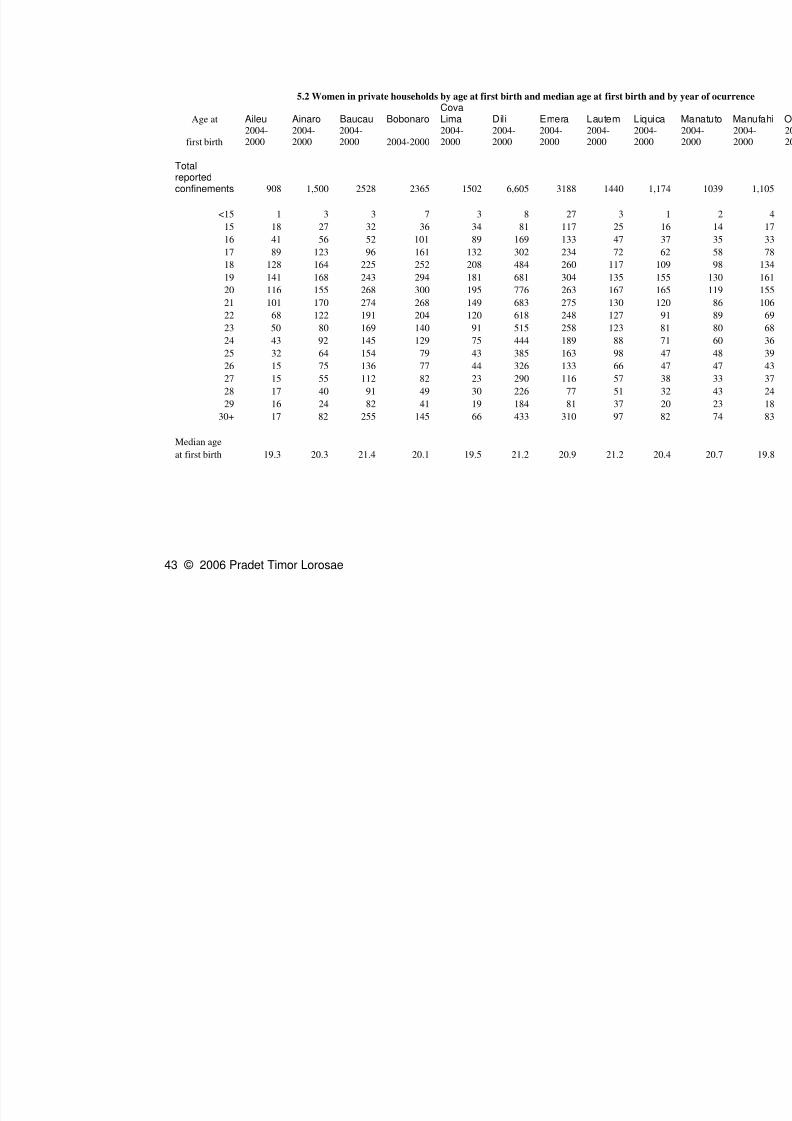
While there are not internationally agreed upon guidelines about at what agepeople are sexually mature, females who give birth to a child at relatively youngages significantly inhibit their chances of further education and may, in fact, bevictims of child abuse. Chart 20 shows the number of births at ages less than 16and the proportion that represents of people who reported a first birth in theperiod 2000-2004 in each district.
8/3/2019 Census 2004 Overview
http://slidepdf.com/reader/full/census-2004-overview 21/48
21 © 2006 Pradet Timor Lorosae
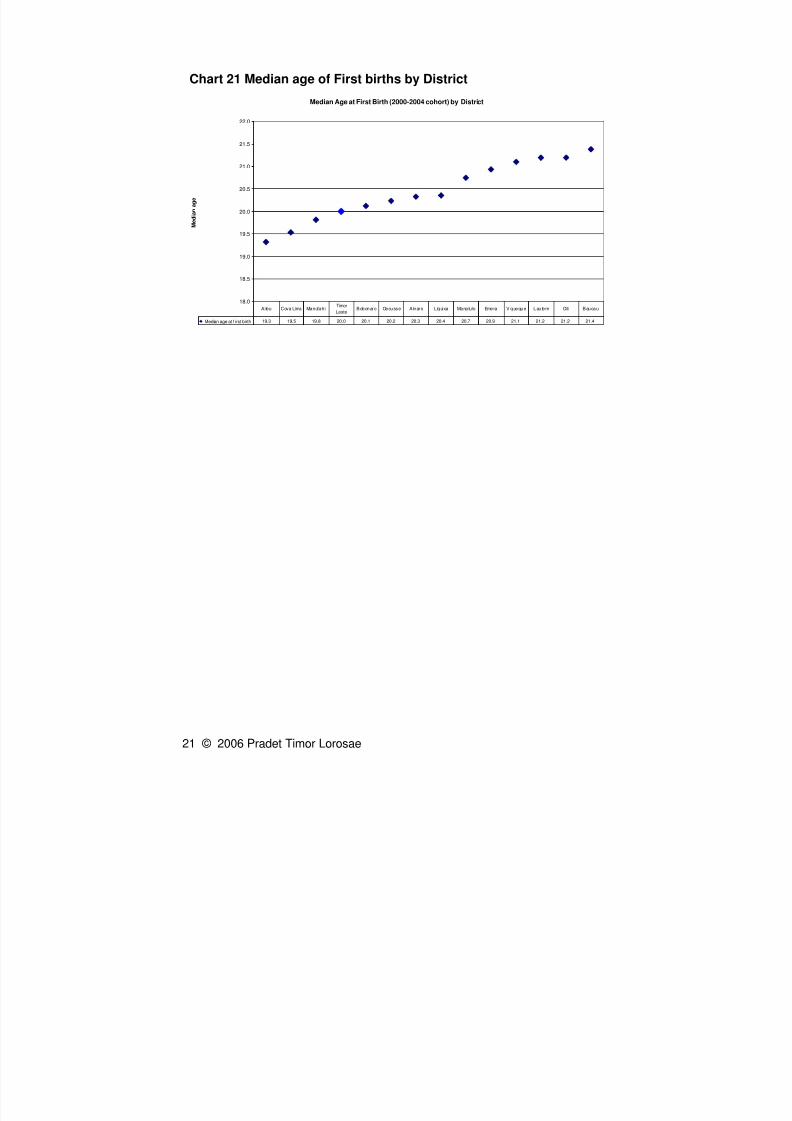
Chart 21 Median age of First births by District
Median Age at First Birth (2000-2004 cohort) by District
18.0
18.5
19.0
19.5
20.0
20.5
21.0
21.5
22.0
M e d i a n a g e
Median age at f irst birth 19.3 19.5 19.8 20.0 20.1 20.2 20.3 20.4 20.7 20.9 21.1 21.2 21.2 21.4
Aileu Cova Lima ManufahiTimor
LesteBobonaro Oecusse A inaro L iquica Manatu to Emera V iqueque Lautem Dili Baucau
8/3/2019 Census 2004 Overview
http://slidepdf.com/reader/full/census-2004-overview 22/48
22 © 2006 Pradet Timor Lorosae
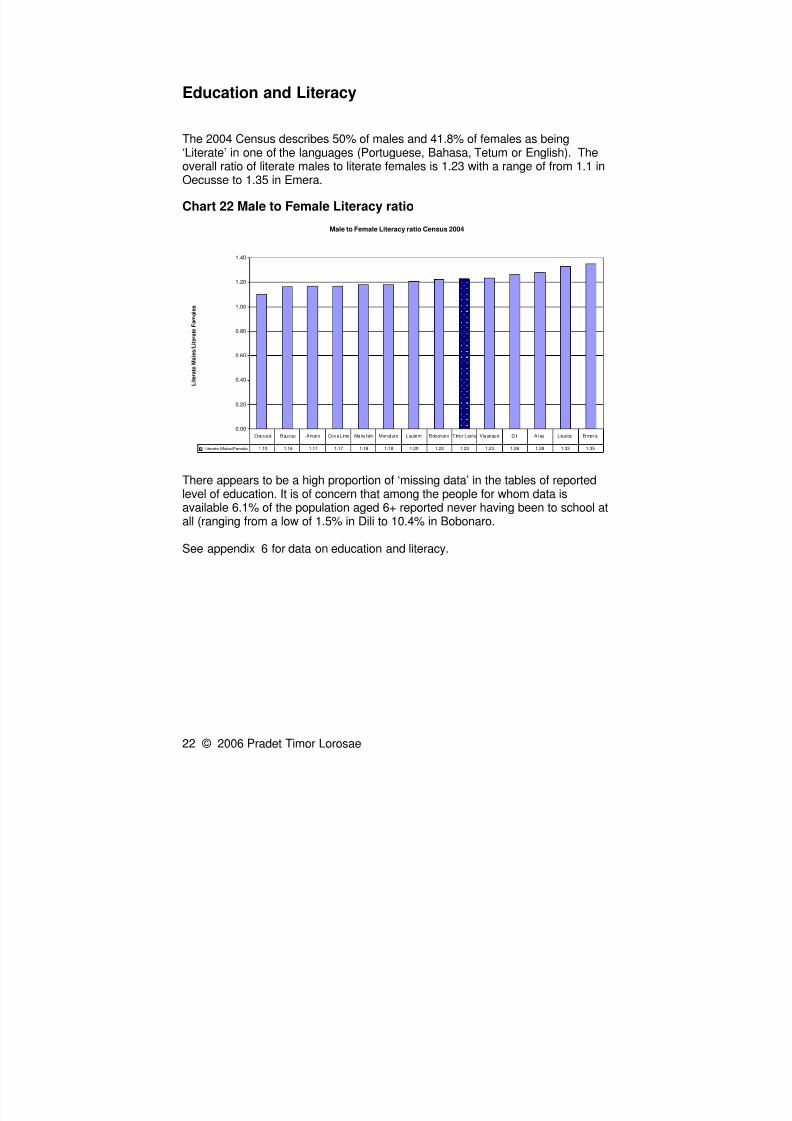
Education and Literacy
The 2004 Census describes 50% of males and 41.8% of females as being
‘Literate’ in one of the languages (Portuguese, Bahasa, Tetum or English). Theoverall ratio of literate males to literate females is 1.23 with a range of from 1.1 inOecusse to 1.35 in Emera.
Chart 22 Male to Female Literacy ratio
Male to Female Literacy ratio Census 2004
0.00
0.20
0.40
0.60
0.80
1.00
1.20
1.40
L i t e r a t e M a l e s / L i t e r a t e F a m a l e s
Literate Males/Female 1.10 1.16 1.17 1.17 1.18 1.18 1.20 1.22 1.23 1.23 1.26 1.28 1.33 1.35
Oecussi Baucau Ainaro Cova Lima Manufahi Manatuto Lautem Bobonaro Timor Leste Viqueque Di li Aileu Liquica Ermera
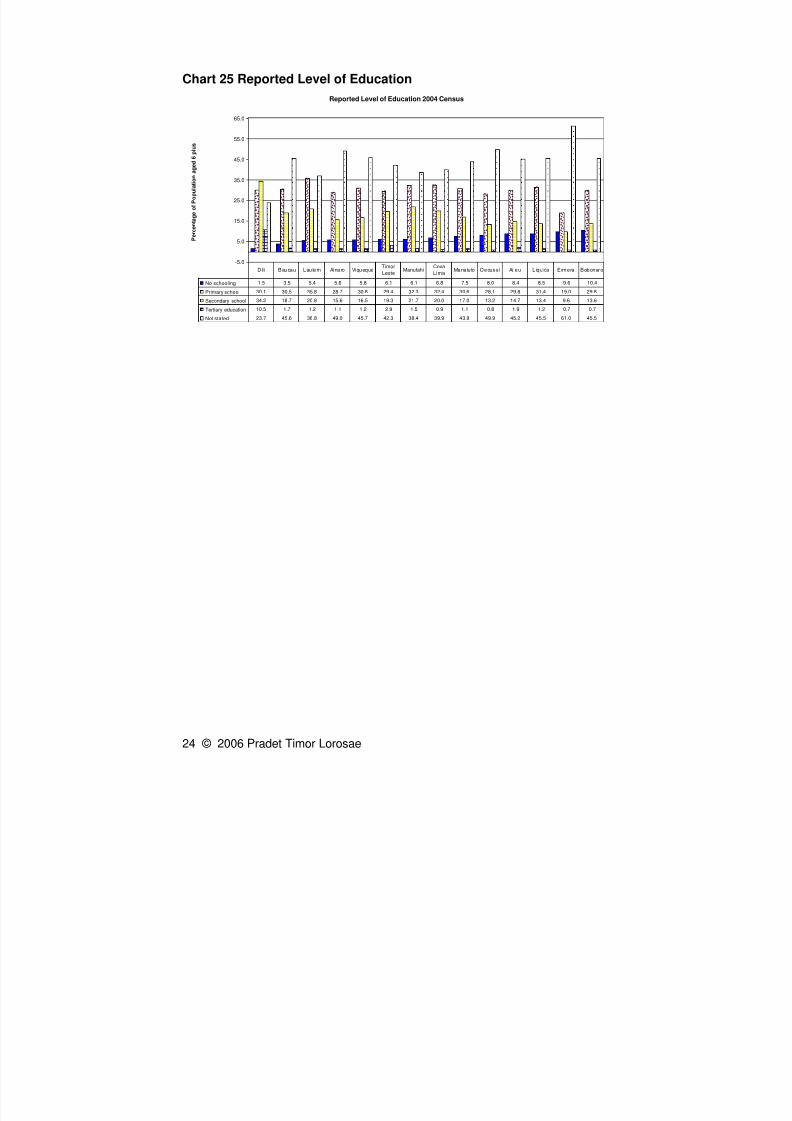
There appears to be a high proportion of ‘missing data’ in the tables of reportedlevel of education. It is of concern that among the people for whom data isavailable 6.1% of the population aged 6+ reported never having been to school atall (ranging from a low of 1.5% in Dili to 10.4% in Bobonaro.
See appendix 6 for data on education and literacy.
8/3/2019 Census 2004 Overview
http://slidepdf.com/reader/full/census-2004-overview 23/48
23 © 2006 Pradet Timor Lorosae
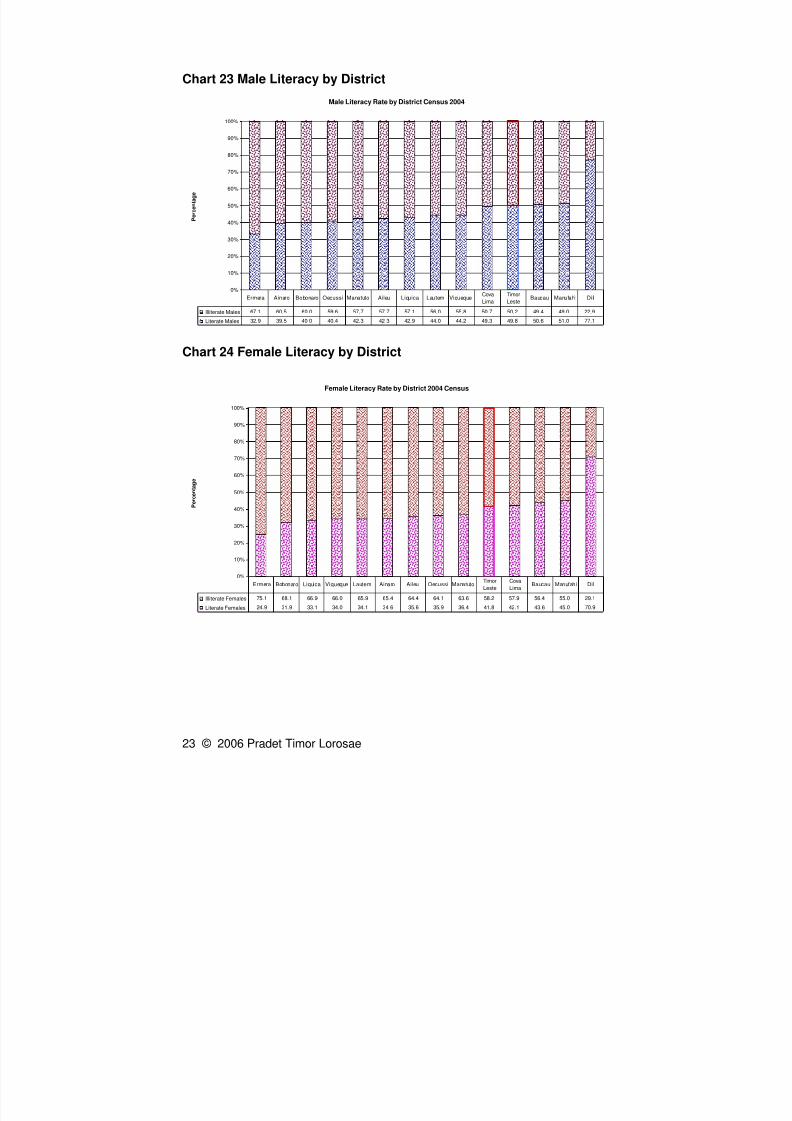
Chart 23 Male Literacy by District
Male Literacy Rate by District Census 2004
0%
10%
20%
30%
40%
50%
60%
70%
80%
90%
100%
P e r c e n t a g e
Illiterate Males 67.1 60.5 60.0 59.6 57.7 57.7 57.1 56.0 55.8 50.7 50.2 49.4 49.0 22.9
Literate Males 32.9 39.5 40.0 40.4 42.3 42.3 42.9 44.0 44.2 49.3 49.8 50.6 51.0 77.1
Ermera Ainaro Bobonaro Oecussi Manatuto Aileu Liquica Lautem ViquequeCova
Lima
Timor
Leste
Baucau Manufahi Dili
Chart 24 Female Literacy by District
Female Literacy Rate by District 2004 Census
0%
10%
20%
30%
40%
50%
60%
70%
80%
90%
100%
P e r c e n t a g e
Illiterate Females 75.1 68.1 66.9 66.0 65.9 65.4 64.4 64.1 63.6 58.2 57.9 56.4 55.0 29.1
Literate Females 24.9 31.9 33.1 34.0 34.1 34.6 35.6 35.9 36.4 41.8 42.1 43.6 45.0 70.9
Ermera Bobonaro Liquica Viqueque Lautem Ainaro Aileu Oecussi ManatutoTimor
Leste
Cova
LimaBaucau Manufahi Dili
8/3/2019 Census 2004 Overview
http://slidepdf.com/reader/full/census-2004-overview 24/48
24 © 2006 Pradet Timor Lorosae
Chart 25 Reported Level of Education
Reported Level of Education 2004 Census
-5.0
5.0
15.0
25.0
35.0
45.0
55.0
65.0
P e r c e n t a g e o f P o p u l a t i o n a g e d 6 p l u s
No schooling 1.5 3.5 5.4 5.6 5.8 6.1 6.1 6.8 7.5 8.0 8.4 8.5 9.6 10.4
Primary school 30.1 30.5 35.8 28.7 30.8 29.4 32.3 32.4 30.6 28.1 29.8 31.4 19.0 29.8
Secondary school 34.2 18.7 20.8 15.6 16.5 19.3 21.7 20.0 17.0 13.2 14.7 13.4 9.6 13.6Tertiary education 10.5 1.7 1.2 1.1 1.2 2.9 1.5 0.9 1.1 0.8 1.9 1.2 0.7 0.7
Not stated 23.7 45.6 36.8 49.0 45.7 42.3 38.4 39.9 43.9 49.9 45.2 45.5 61.0 45.5
Dil i Baucau Lautem Ainaro ViquequeTimor
LesteManufahi
Cova
LimaManatuto Oecuss i Ai leu L iquica Ermera Bobonaro
8/3/2019 Census 2004 Overview
http://slidepdf.com/reader/full/census-2004-overview 25/48
25 © 2006 Pradet Timor Lorosae
Economic Activity
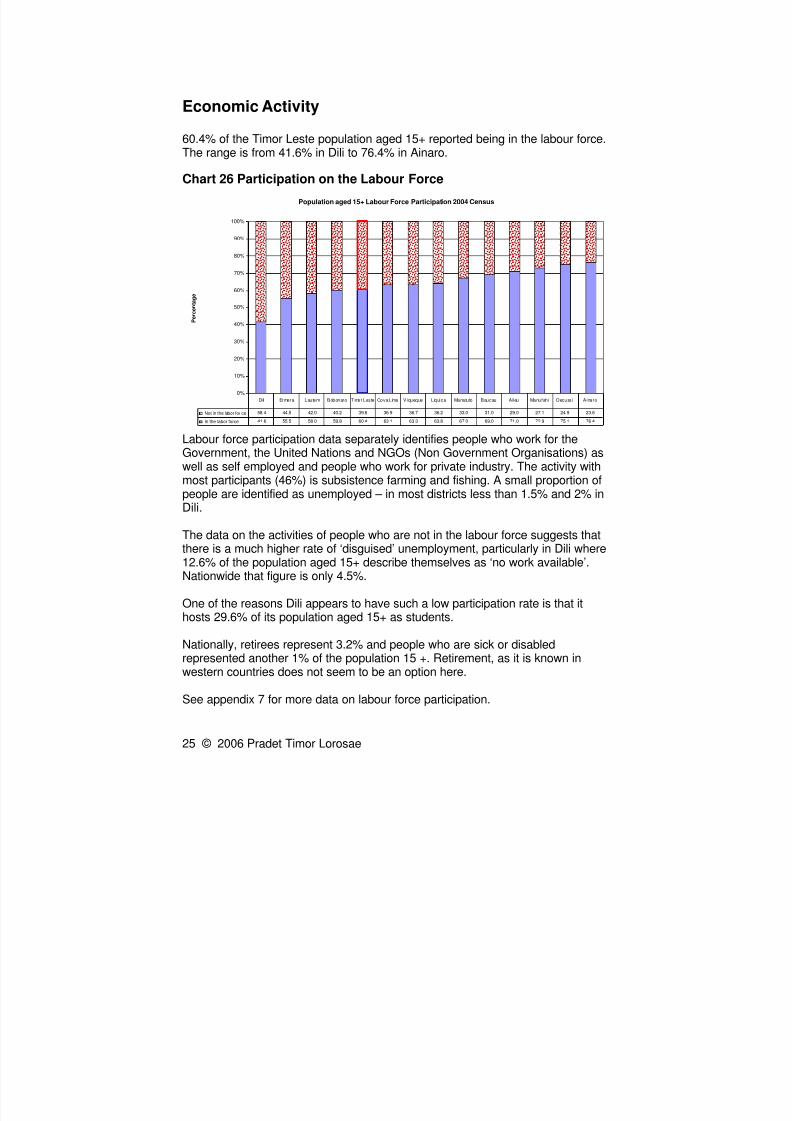
60.4% of the Timor Leste population aged 15+ reported being in the labour force.
The range is from 41.6% in Dili to 76.4% in Ainaro.
Chart 26 Participation on the Labour Force
Population aged 15+ Labour Force Participation 2004 Census
0%
10%
20%
30%
40%
50%
60%
70%
80%
90%
100%
P e r c e n t a g e
Not in the labor for ce 58.4 44.5 42.0 40.2 39.6 36.9 36.7 36.2 33.0 31.0 29.0 27.1 24.9 23.6
In the labor force 41.6 55.5 58.0 59.8 60.4 63.1 63.3 63.8 67.0 69.0 71.0 72.9 75.1 76.4
Di li Ermera Lautem Bobonaro Timor Leste Cova Lima Viqueque Liquica Manatuto Baucau Aileu Manufahi Oecussi Ainaro
Labour force participation data separately identifies people who work for the
Government, the United Nations and NGOs (Non Government Organisations) aswell as self employed and people who work for private industry. The activity withmost participants (46%) is subsistence farming and fishing. A small proportion ofpeople are identified as unemployed – in most districts less than 1.5% and 2% inDili.
The data on the activities of people who are not in the labour force suggests thatthere is a much higher rate of ‘disguised’ unemployment, particularly in Dili where12.6% of the population aged 15+ describe themselves as ‘no work available’.Nationwide that figure is only 4.5%.
One of the reasons Dili appears to have such a low participation rate is that ithosts 29.6% of its population aged 15+ as students.
Nationally, retirees represent 3.2% and people who are sick or disabledrepresented another 1% of the population 15 +. Retirement, as it is known inwestern countries does not seem to be an option here.
See appendix 7 for more data on labour force participation.
8/3/2019 Census 2004 Overview
http://slidepdf.com/reader/full/census-2004-overview 26/48
26 © 2006 Pradet Timor Lorosae
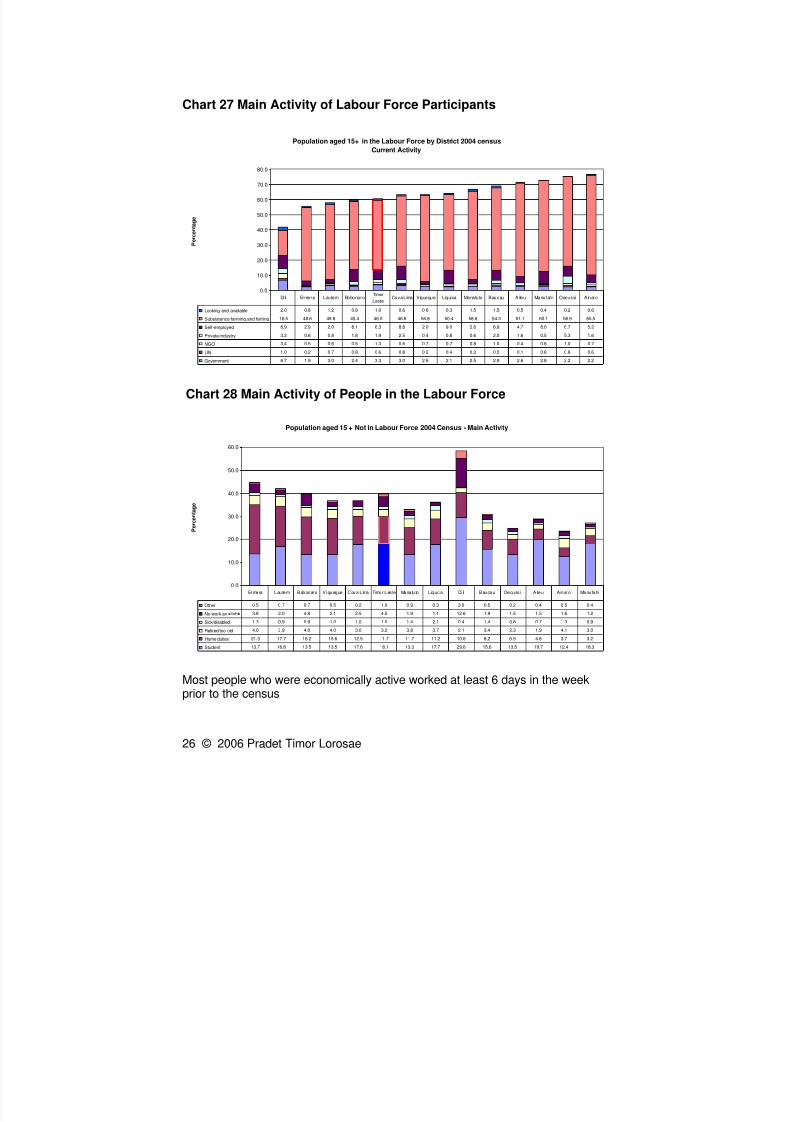
Chart 27 Main Activity of Labour Force Participants
Population aged 15+ in the Labour Force by District 2004 census
Current Activity
0.0
10.0
20.0
30.0
40.0
50.0
60.0
70.0
80.0
P e r c e n t a g e
Looking and available 2.0 0.8 1.2 0.8 1.0 0.6 0.6 0.3 1.5 1.5 0.5 0.4 0.2 0.6
Subsistence farming and fishing 16.5 48.6 49.8 45.4 46.0 46.8 56.8 50.4 58.6 54.3 61.1 60.1 58.9 65.5
Self-employed 8.9 2.9 2.0 8.1 6.3 8.8 2.0 9.0 2.6 6.9 4.7 8.0 6.7 5.2
Private industry 3.2 0.6 0.8 1.8 1.9 2.5 0.4 0.8 0.6 2.0 1.6 0.5 5.3 1.6
NGO 3.4 0.5 0.6 0.5 1.3 0.6 0.7 0.7 0.8 1.0 0.4 0.6 1.0 0.7
UN 1.0 0.2 0.7 0.8 0.6 0.8 0.2 0.4 0.3 0.5 0.1 0.6 0.8 0.6
Government 6.7 1.9 3.0 2.4 3.3 3.0 2.6 2.1 2.5 2.9 2.6 2.8 2.2 2.2
Di li Ermera Lautem BobonaroTimor
Leste
Cova Lima Viqueque Liquica Manatuto Baucau Ai leu Manufahi Oecussi Ainaro
Chart 28 Main Activity of People in the Labour Force
Population aged 15 + Not in Labour Force 2004 Census - Main Activity
0.0
10.0
20.0
30.0
40.0
50.0
60.0
P e r c e n t a g e
Other 0.5 0.7 0.7 0.5 0.2 1.0 0.9 0.3 3.0 0.5 0.2 0.4 0.5 0.4No work av ailable 3.8 2.0 4.8 2.1 2.5 4.5 1.9 1.1 12.6 1.9 1.5 1.5 1.6 1.2
Sick/disabled 1.3 0.9 0.9 1.0 1.0 1.0 1.4 2.1 0.4 1.4 0.8 0.7 1.3 0.9
Retired/too old 4.0 3.9 4.0 4.0 3.0 3.2 3.8 3.7 2.1 3.4 2.3 1.9 4.1 3.0
Home duties 21.3 17.7 16.2 15.6 12.5 11.7 11.7 11.2 10.6 8.2 6.5 4.8 3.7 3.2
Student 13.7 16.8 13.5 13.5 17.6 18.1 13.3 17.7 29.6 15.6 13.5 19.7 12.4 18.3
Ermera Lautem Bobonaro V iqueque Cova L ima Timor Leste Manatu to L iquica Di li Baucau Oecuss i A ileu A inaro Manufahi
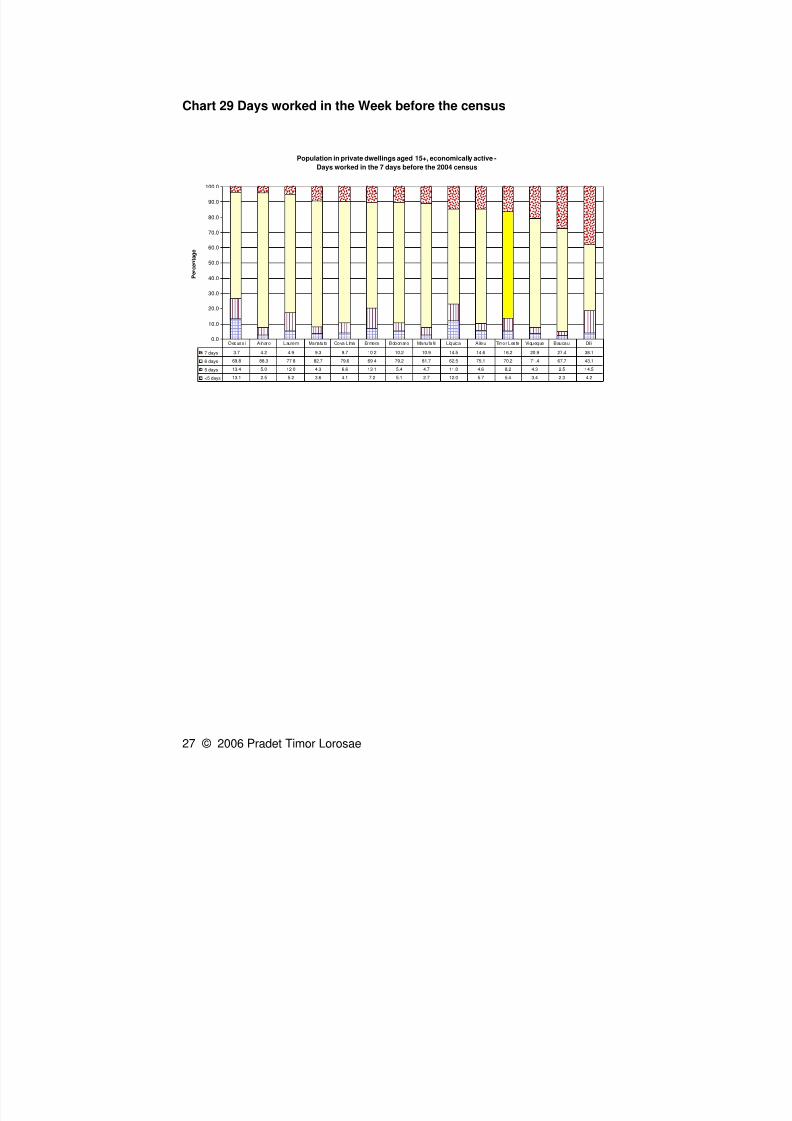
Most people who were economically active worked at least 6 days in the weekprior to the census
8/3/2019 Census 2004 Overview
http://slidepdf.com/reader/full/census-2004-overview 27/48
27 © 2006 Pradet Timor Lorosae
Chart 29 Days worked in the Week before the census
Population in private dwellings aged 15+, economically active -
Days worked in the 7 days before the 2004 census
0.0
10.0
20.0
30.0
40.0
50.0
60.0
70.0
80.0
90.0
100.0
P e r c e n t a g e
7 days 3.7 4.2 4.9 9.3 9.7 10.2 10.2 10.9 14.5 14.6 16.2 20.9 27.4 38.1
6 days 69.8 88.3 77.8 82.7 79.6 69.4 79.2 81.7 62.5 75.1 70.2 71.4 67.7 43.1
5 days 13.4 5.0 12.0 4.3 6.6 13.1 5.4 4.7 11.0 4.6 8.2 4.3 2.5 14.5
<5 days 13.1 2.5 5.2 3.6 4.1 7.2 5.1 2.7 12.0 5.7 5.4 3.4 2.3 4.2
Oecuss i A inaro Lautem Manatu to Cova L ima Ermera Bobonaro Manufahi L iquica A ileu Timor Leste Viqueque Baucau Dil i
8/3/2019 Census 2004 Overview
http://slidepdf.com/reader/full/census-2004-overview 28/48
28 © 2006 Pradet Timor Lorosae
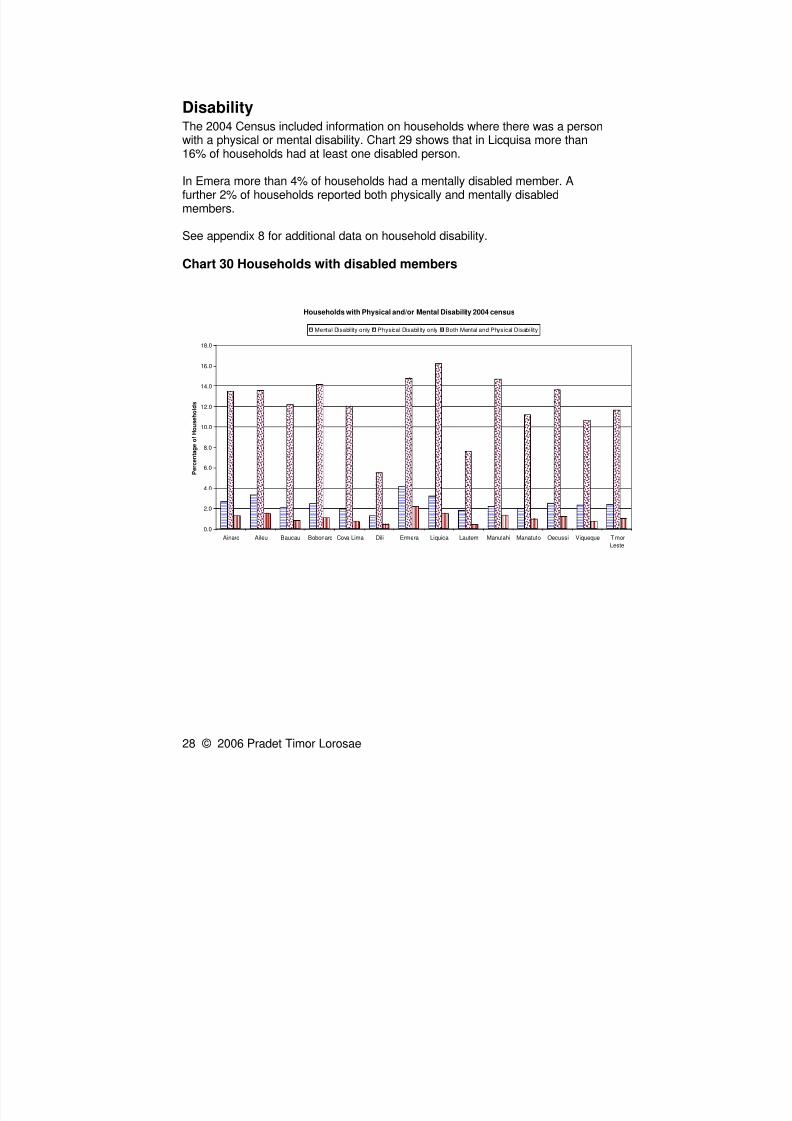
DisabilityThe 2004 Census included information on households where there was a personwith a physical or mental disability. Chart 29 shows that in Licquisa more than
16% of households had at least one disabled person.
In Emera more than 4% of households had a mentally disabled member. Afurther 2% of households reported both physically and mentally disabledmembers.
See appendix 8 for additional data on household disability.
Chart 30 Households with disabled members
Households with Physical and/or Mental Disability 2004 census
0.0
2.0
4.0
6.0
8.0
10.0
12.0
14.0
16.0
18.0
Ainaro Aileu Baucau Bobonaro Cova Lima Dili Ermera Liquica Lautem Manufahi Manatuto Oecussi Viqueque Timor
Leste
P e r c e n t a g e
o f H o u s e h o l d s
Mental Disability only Physical Disability only Both Mental and Physical Disability
8/3/2019 Census 2004 Overview
http://slidepdf.com/reader/full/census-2004-overview 29/48
29 © 2006 Pradet Timor Lorosae
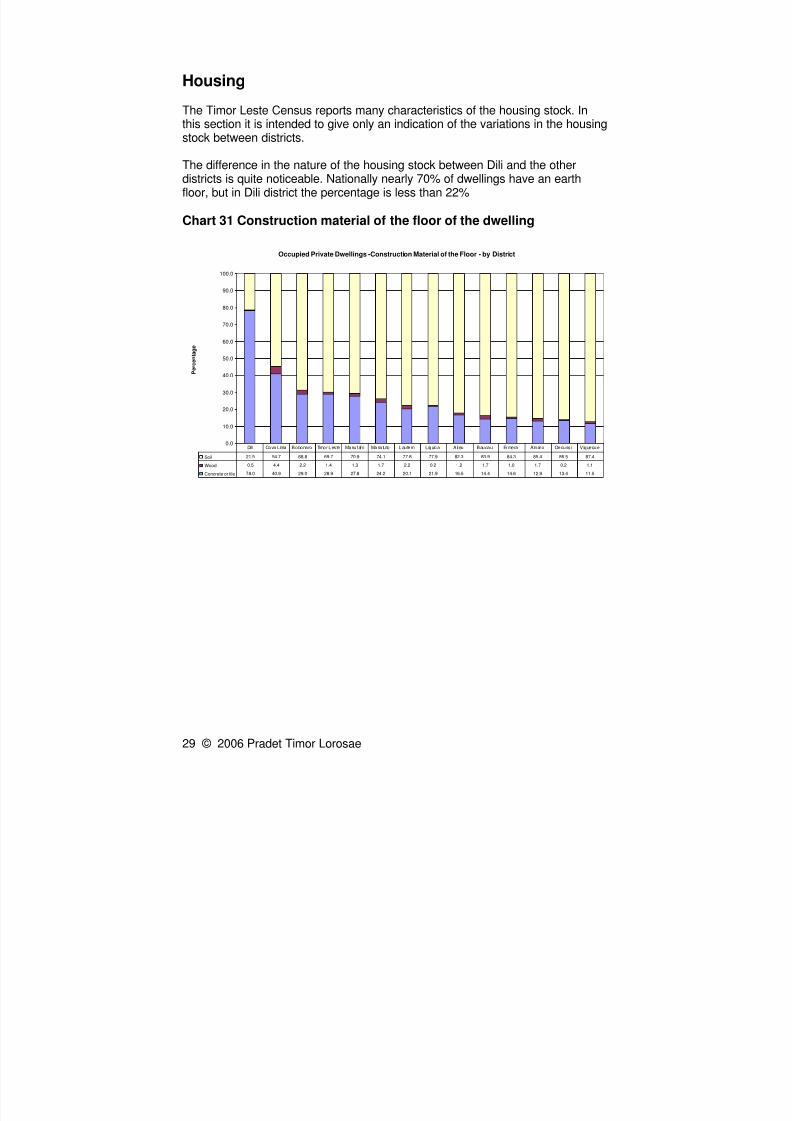
Housing
The Timor Leste Census reports many characteristics of the housing stock. Inthis section it is intended to give only an indication of the variations in the housingstock between districts.
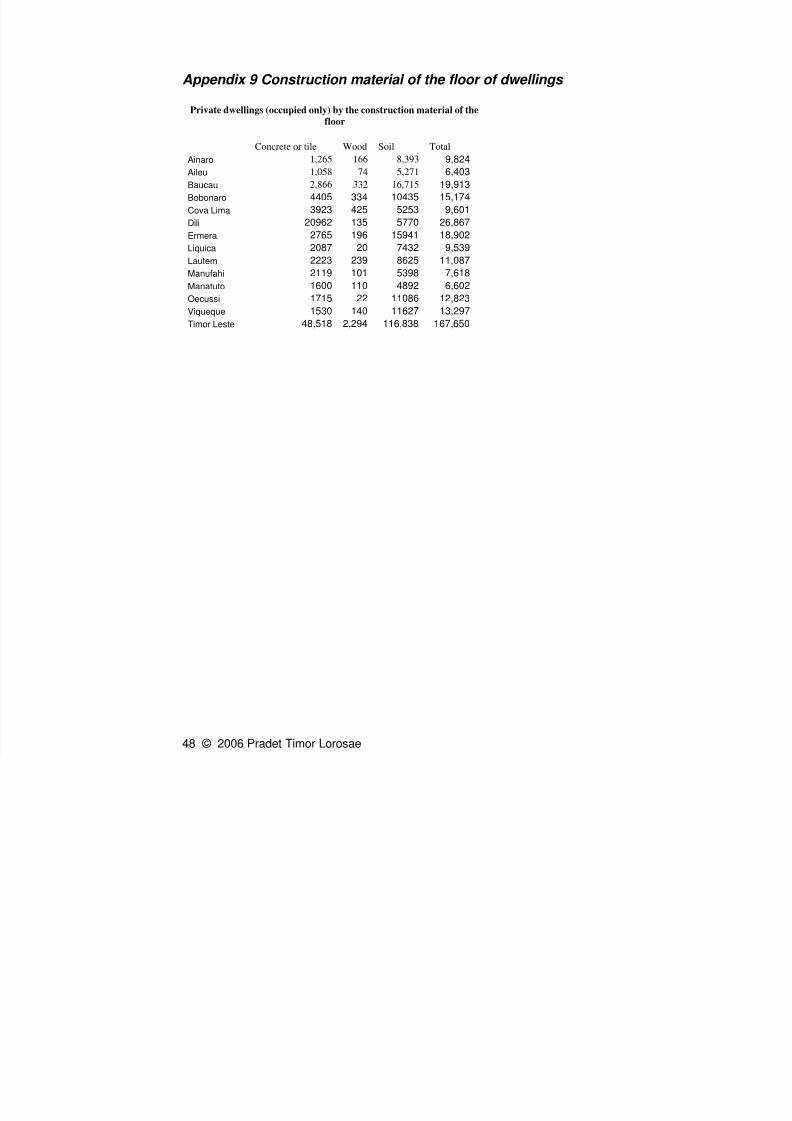
The difference in the nature of the housing stock between Dili and the otherdistricts is quite noticeable. Nationally nearly 70% of dwellings have an earthfloor, but in Dili district the percentage is less than 22%
Chart 31 Construction material of the floor of the dwelling
Occupied Private Dwellings -Construction Material of the Floor - by District
0.0
10.0
20.0
30.0
40.0
50.0
60.0
70.0
80.0
90.0
100.0
P e r c e n t a g e
Soil 21.5 54.7 68.8 69.7 70.9 74.1 77.8 77.9 82.3 83.9 84.3 85.4 86.5 87.4
Wood 0.5 4.4 2.2 1.4 1.3 1.7 2.2 0.2 1.2 1.7 1.0 1.7 0.2 1.1
Concrete or tile 78.0 40.9 29.0 28.9 27.8 24.2 20.1 21.9 16.5 14.4 14.6 12.9 13.4 11.5
Dili Cova L ima Bobonaro Timor Leste Manufah i Manatu to Lautem L iquica A il eu Baucau Ermera A inaro Oecuss i V iqueque
8/3/2019 Census 2004 Overview
http://slidepdf.com/reader/full/census-2004-overview 30/48
30 © 2006 Pradet Timor Lorosae
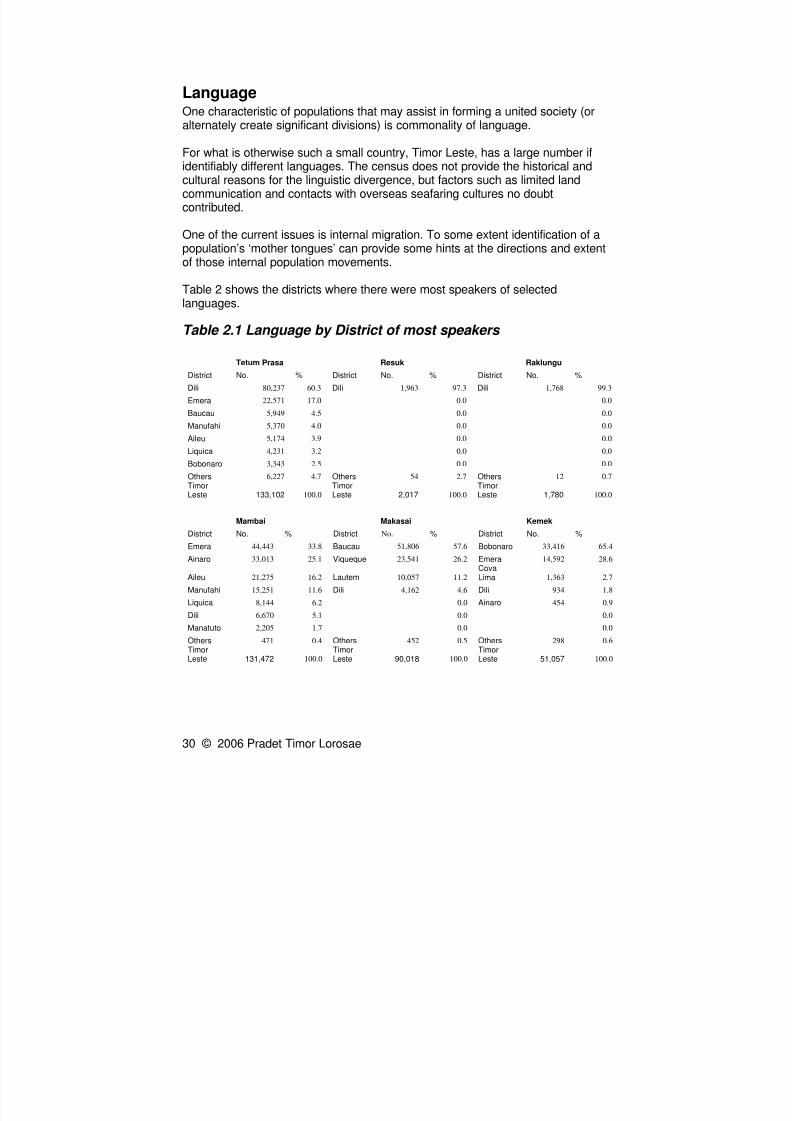
LanguageOne characteristic of populations that may assist in forming a united society (oralternately create significant divisions) is commonality of language.
For what is otherwise such a small country, Timor Leste, has a large number ifidentifiably different languages. The census does not provide the historical andcultural reasons for the linguistic divergence, but factors such as limited landcommunication and contacts with overseas seafaring cultures no doubtcontributed.
One of the current issues is internal migration. To some extent identification of apopulation’s ‘mother tongues’ can provide some hints at the directions and extentof those internal population movements.
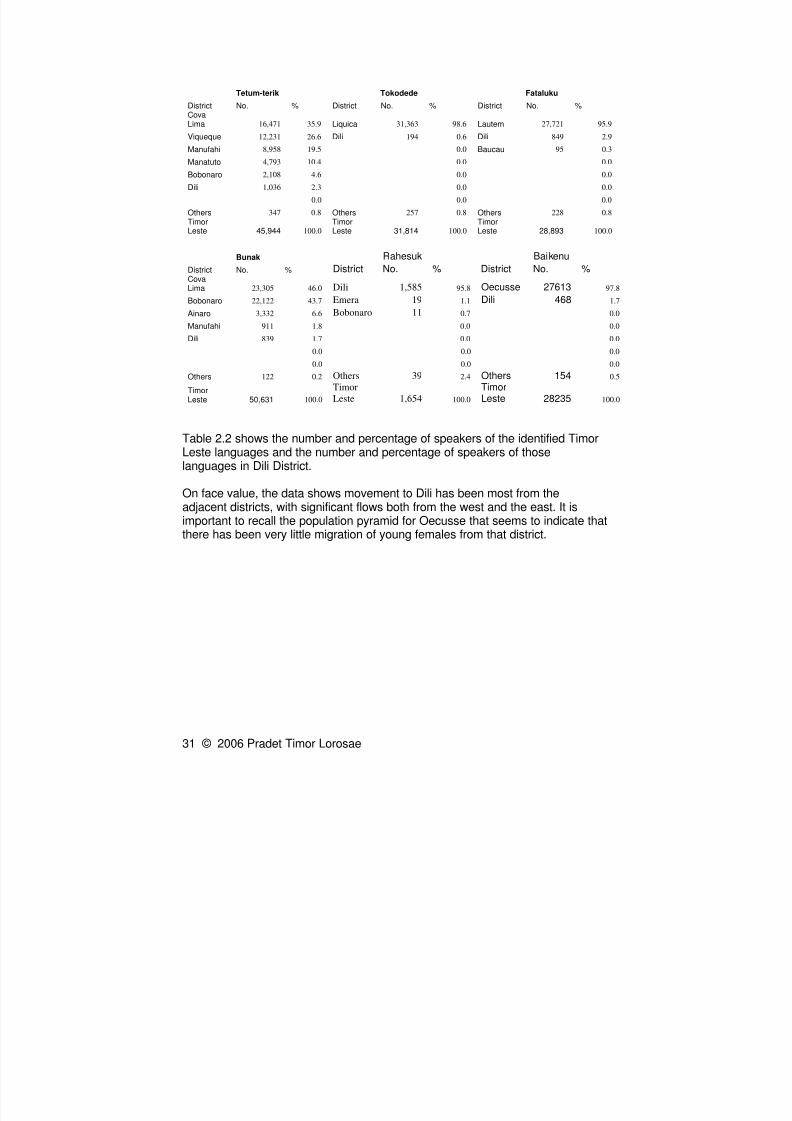
Table 2 shows the districts where there were most speakers of selected
languages.
Table 2.1 Language by District of most speakers
Tetum Prasa Resuk Raklungu
District No. % District No. % District No. %
Dili 80,237 60.3 Dili 1,963 97.3 Dili 1,768 99.3
Emera 22,571 17.0 0.0 0.0
Baucau 5,949 4.5 0.0 0.0
Manufahi 5,370 4.0 0.0 0.0
Aileu 5,174 3.9 0.0 0.0
Liquica 4,231 3.2 0.0 0.0Bobonaro 3,343 2.5 0.0 0.0
Others 6,227 4.7 Others 54 2.7 Others 12 0.7
TimorLeste 133,102 100.0
TimorLeste 2,017 100.0
TimorLeste 1,780 100.0
Mambai Makasai Kemek
District No. % District No. % District No. %
Emera 44,443 33.8 Baucau 51,806 57.6 Bobonaro 33,416 65.4
Ainaro 33,013 25.1 Viqueque 23,541 26.2 Emera 14,592 28.6
Aileu 21,275 16.2 Lautem 10,057 11.2CovaLima 1,363 2.7
Manufahi 15,251 11.6 Dili 4,162 4.6 Dili 934 1.8
Liquica 8,144 6.2 0.0 Ainaro 454 0.9Dili 6,670 5.1 0.0 0.0
Manatuto 2,205 1.7 0.0 0.0
Others 471 0.4 Others 452 0.5 Others 298 0.6
TimorLeste 131,472 100.0
TimorLeste 90,018 100.0
TimorLeste 51,057 100.0
8/3/2019 Census 2004 Overview
http://slidepdf.com/reader/full/census-2004-overview 31/48
31 © 2006 Pradet Timor Lorosae
Tetum-terik Tokodede Fataluku
District No. % District No. % District No. %CovaLima 16,471 35.9 Liquica 31,363 98.6 Lautem 27,721 95.9
Viqueque 12,231 26.6 Dili 194 0.6 Dili 849 2.9
Manufahi 8,958 19.5 0.0 Baucau 95 0.3Manatuto 4,793 10.4 0.0 0.0
Bobonaro 2,108 4.6 0.0 0.0
Dili 1,036 2.3 0.0 0.0
0.0 0.0 0.0
Others 347 0.8 Others 257 0.8 Others 228 0.8
TimorLeste 45,944 100.0
TimorLeste 31,814 100.0
TimorLeste 28,893 100.0
Bunak Rahesuk Baikenu
District No. % District No. % District No. %CovaLima 23,305 46.0 Dili 1,585 95.8 Oecusse 27613 97.8
Bobonaro 22,122 43.7 Emera 19 1.1 Dili 468 1.7Ainaro 3,332 6.6 Bobonaro 11 0.7 0.0
Manufahi 911 1.8 0.0 0.0
Dili 839 1.7 0.0 0.0
0.0 0.0 0.0
0.0 0.0 0.0
Others 122 0.2 Others 39 2.4 Others 154 0.5
TimorLeste 50,631 100.0
Timor
Leste 1,654 100.0
TimorLeste 28235 100.0
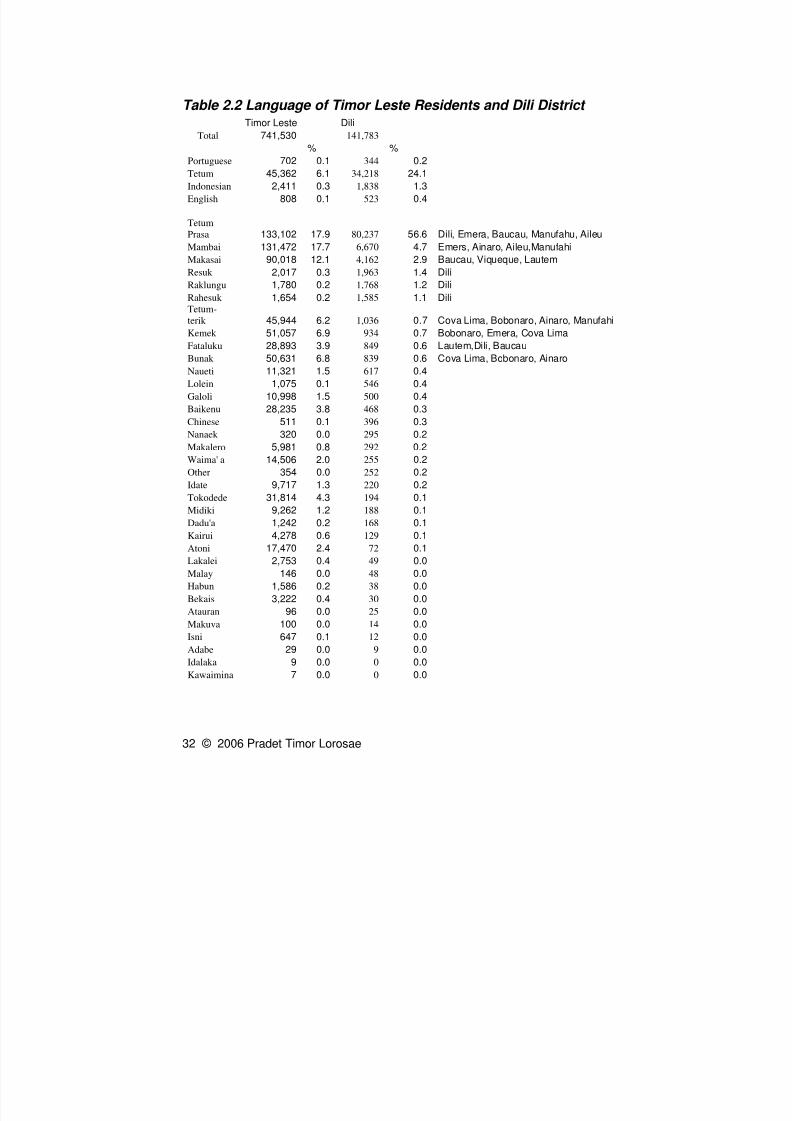
Table 2.2 shows the number and percentage of speakers of the identified Timor
Leste languages and the number and percentage of speakers of thoselanguages in Dili District.
On face value, the data shows movement to Dili has been most from theadjacent districts, with significant flows both from the west and the east. It isimportant to recall the population pyramid for Oecusse that seems to indicate thatthere has been very little migration of young females from that district.
8/3/2019 Census 2004 Overview
http://slidepdf.com/reader/full/census-2004-overview 32/48
32 © 2006 Pradet Timor Lorosae
Table 2.2 Language of Timor Leste Residents and Dili District Timor Leste Dili
Total 741,530 141,783
% %Portuguese 702 0.1 344 0.2
Tetum 45,362 6.1 34,218 24.1
Indonesian 2,411 0.3 1,838 1.3
English 808 0.1 523 0.4
Tetum
Prasa 133,102 17.9 80,237 56.6 Dili, Emera, Baucau, Manufahu, Aileu
Mambai 131,472 17.7 6,670 4.7 Emers, Ainaro, Aileu,Manufahi
Makasai 90,018 12.1 4,162 2.9 Baucau, Viqueque, Lautem
Resuk 2,017 0.3 1,963 1.4 Dili
Raklungu 1,780 0.2 1,768 1.2 Dili
Rahesuk 1,654 0.2 1,585 1.1 DiliTetum-
terik 45,944 6.2 1,036 0.7 Cova Lima, Bobonaro, Ainaro, Manufahi
Kemek 51,057 6.9 934 0.7 Bobonaro, Emera, Cova Lima
Fataluku 28,893 3.9 849 0.6 Lautem,Dili, Baucau
Bunak 50,631 6.8 839 0.6 Cova Lima, Bobonaro, Ainaro
Naueti 11,321 1.5 617 0.4
Lolein 1,075 0.1 546 0.4
Galoli 10,998 1.5 500 0.4
Baikenu 28,235 3.8 468 0.3
Chinese 511 0.1 396 0.3
Nanaek 320 0.0 295 0.2
Makalero 5,981 0.8 292 0.2
Waima' a 14,506 2.0 255 0.2
Other 354 0.0 252 0.2
Idate 9,717 1.3 220 0.2
Tokodede 31,814 4.3 194 0.1
Midiki 9,262 1.2 188 0.1
Dadu'a 1,242 0.2 168 0.1
Kairui 4,278 0.6 129 0.1
Atoni 17,470 2.4 72 0.1
Lakalei 2,753 0.4 49 0.0
Malay 146 0.0 48 0.0
Habun 1,586 0.2 38 0.0
Bekais 3,222 0.4 30 0.0
Atauran 96 0.0 25 0.0
Makuva 100 0.0 14 0.0
Isni 647 0.1 12 0.0
Adabe 29 0.0 9 0.0
Idalaka 9 0.0 0 0.0
Kawaimina 7 0.0 0 0.0
8/3/2019 Census 2004 Overview
http://slidepdf.com/reader/full/census-2004-overview 33/48
33 © 2006 Pradet Timor Lorosae
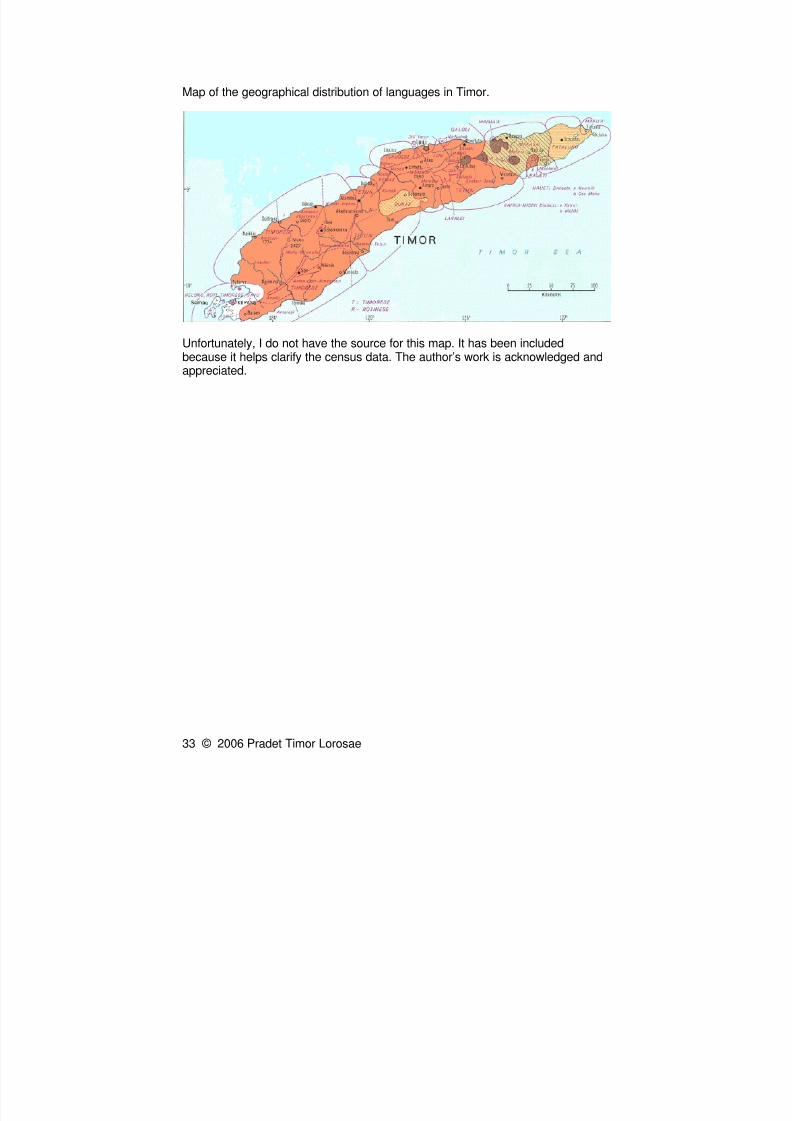
Map of the geographical distribution of languages in Timor.
Unfortunately, I do not have the source for this map. It has been includedbecause it helps clarify the census data. The author’s work is acknowledged andappreciated.
8/3/2019 Census 2004 Overview
http://slidepdf.com/reader/full/census-2004-overview 34/48
34 © 2006 Pradet Timor Lorosae
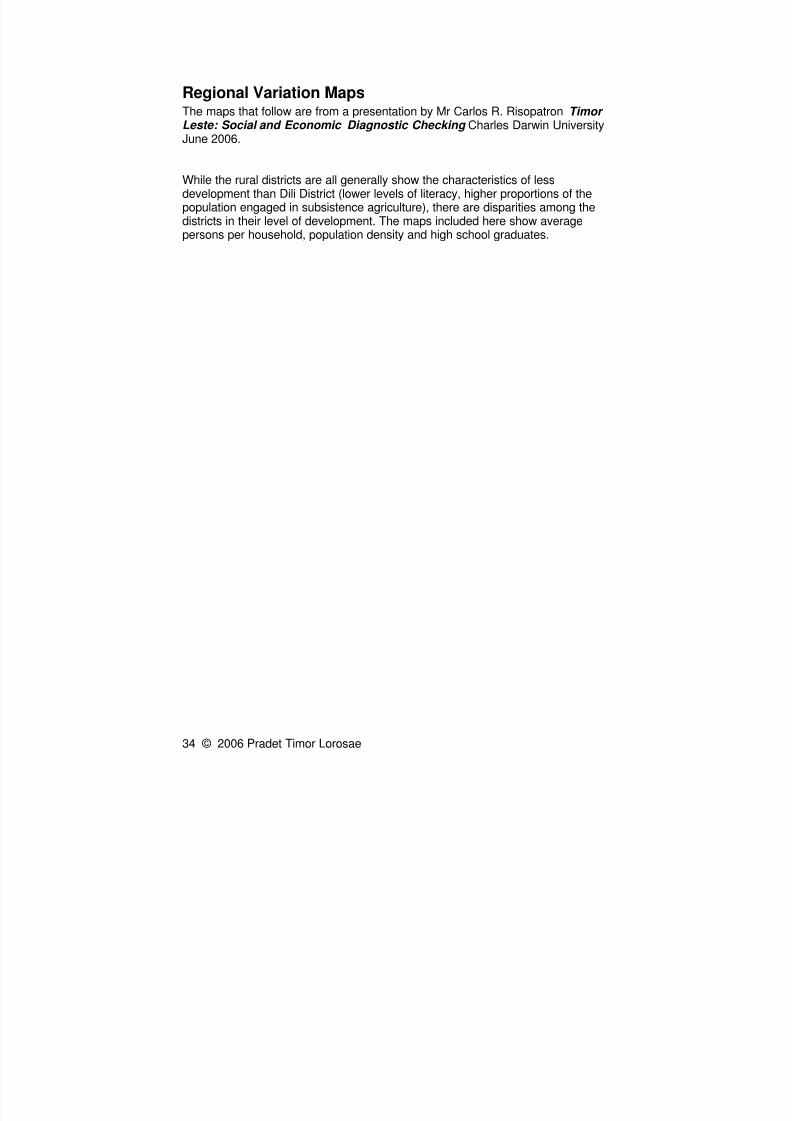
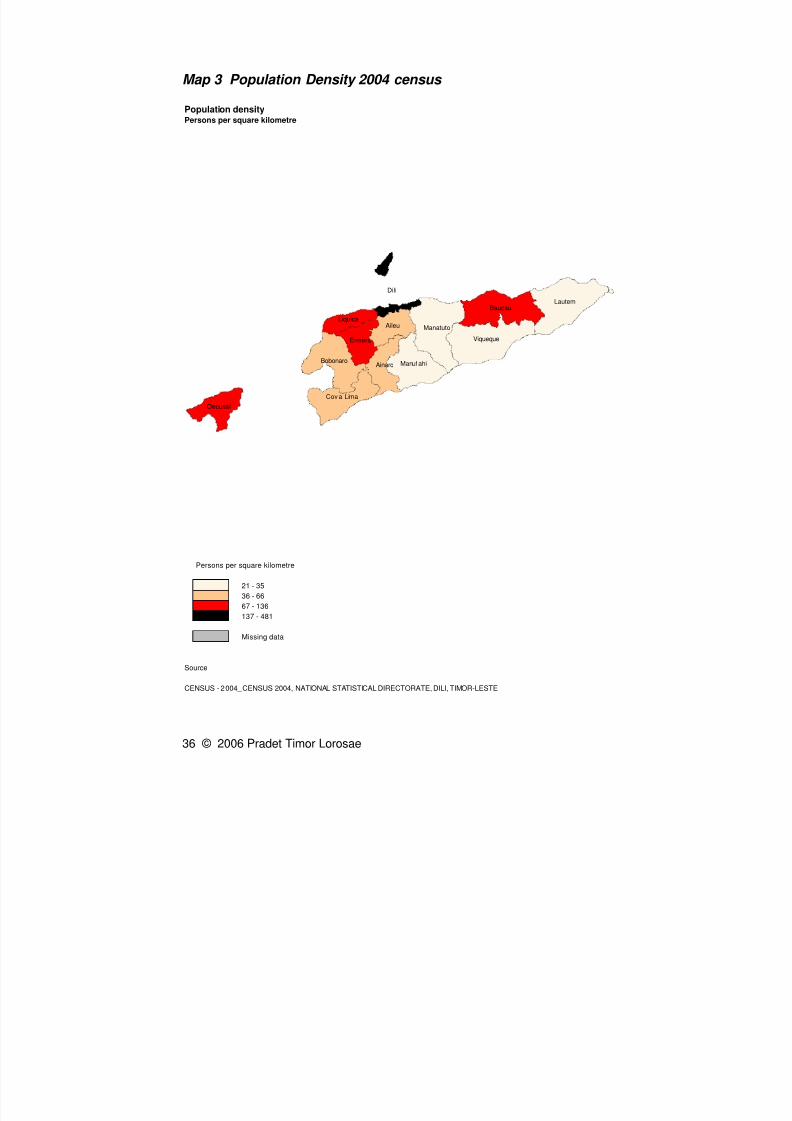
Regional Variation MapsThe maps that follow are from a presentation by Mr Carlos R. Risopatron Timor Leste: Social and Economic Diagnostic Checking Charles Darwin UniversityJune 2006.
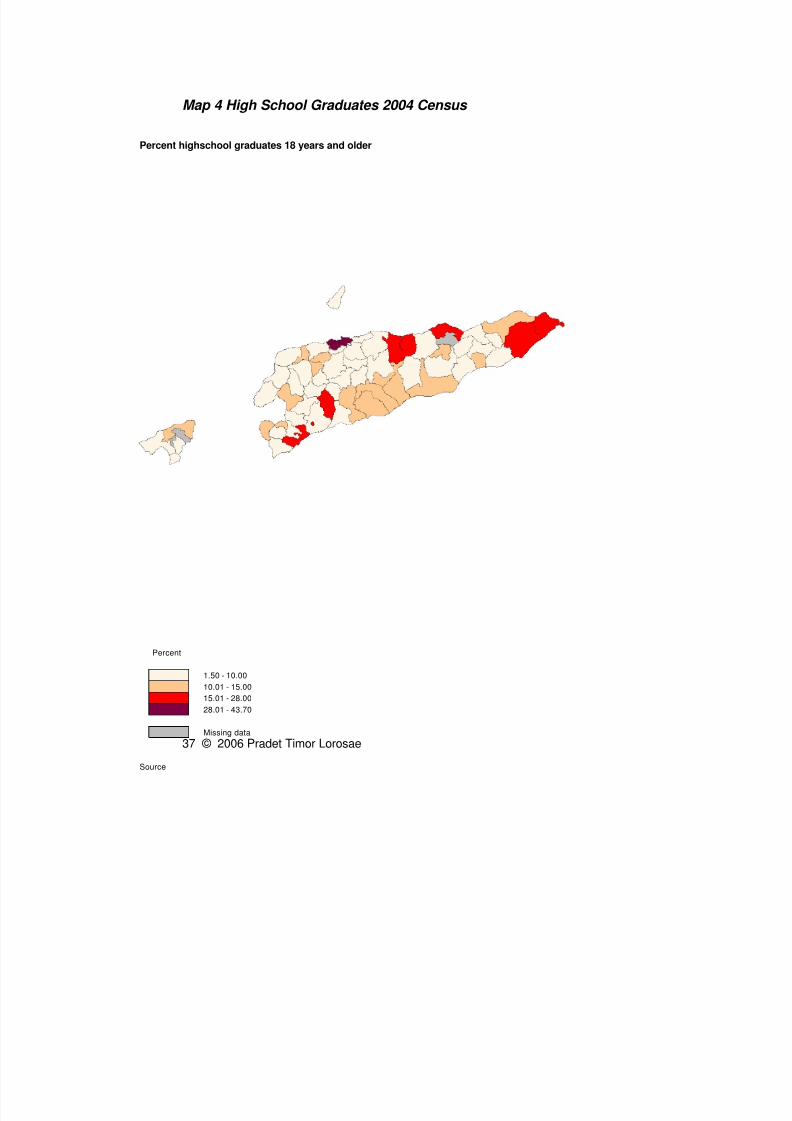
While the rural districts are all generally show the characteristics of lessdevelopment than Dili District (lower levels of literacy, higher proportions of thepopulation engaged in subsistence agriculture), there are disparities among thedistricts in their level of development. The maps included here show averagepersons per household, population density and high school graduates.
8/3/2019 Census 2004 Overview
http://slidepdf.com/reader/full/census-2004-overview 35/48
35 © 2006 Pradet Timor Lorosae
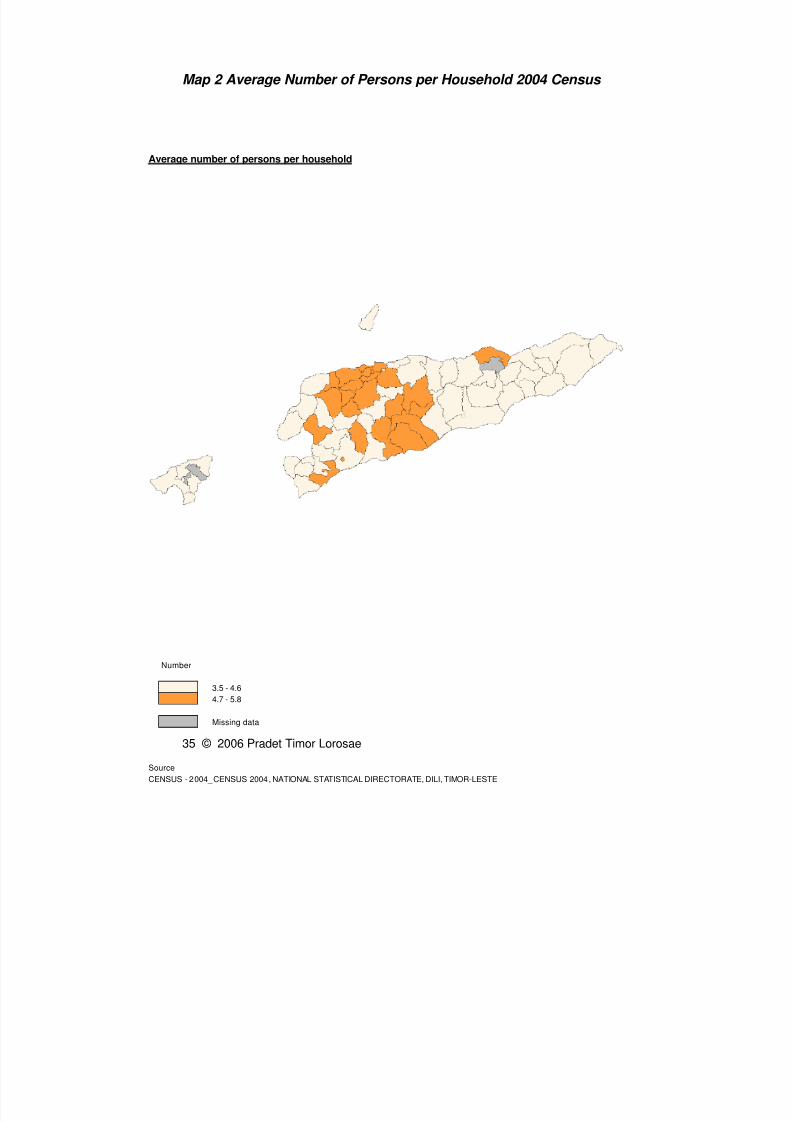
Map 2 Average Number of Persons per Household 2004 Census
Average number of persons per household
Number
3.5 - 4.6
4.7 - 5.8
Missing data
Source
CENSUS - 2004_CENSUS 2004, NATIONAL STATISTICAL DIRECTORATE, DILI, TIMOR-LESTE
8/3/2019 Census 2004 Overview
http://slidepdf.com/reader/full/census-2004-overview 36/48
36 © 2006 Pradet Timor Lorosae
Map 3 Population Density 2004 census
Population densityPersons per square kilometre
Persons per square kilometre
21 - 35
36 - 66
67 - 136137 - 481
Missing data
Source
CENSUS - 2004_CENSUS 2004, NATIONAL STATISTICAL DIRECTORATE, DILI, TIMOR-LESTE
AinaroBobonaro
Oecussi
Cov a Lima
Liquica
Ermera Viqueque
Manuf ahi
Manatuto
Dili
Aileu
LautemBaucau
8/3/2019 Census 2004 Overview
http://slidepdf.com/reader/full/census-2004-overview 37/48
37 © 2006 Pradet Timor Lorosae
Map 4 High School Graduates 2004 Census
Percent highschool graduates 18 years and older
Percent
1.50 - 10.00
10.01 - 15.00
15.01 - 28.00
28.01 - 43.70
Missing data
Source
8/3/2019 Census 2004 Overview
http://slidepdf.com/reader/full/census-2004-overview 38/48
38 © 2006 Pradet Timor Lorosae
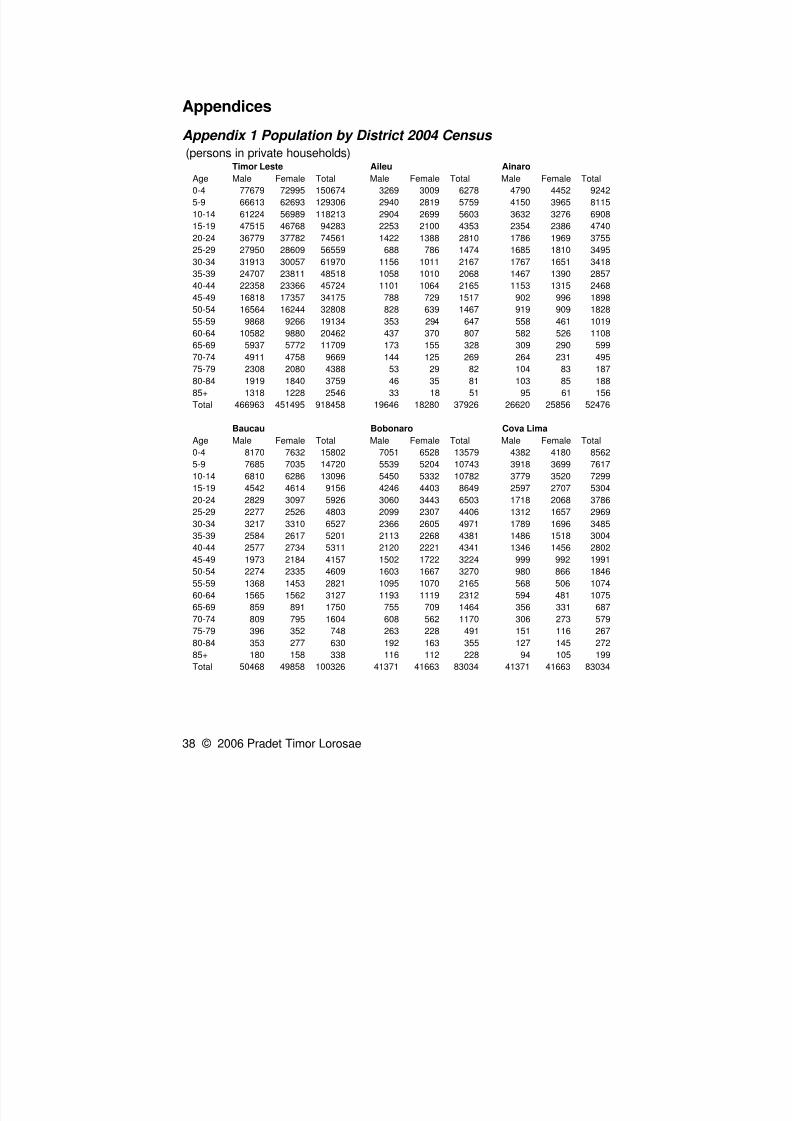
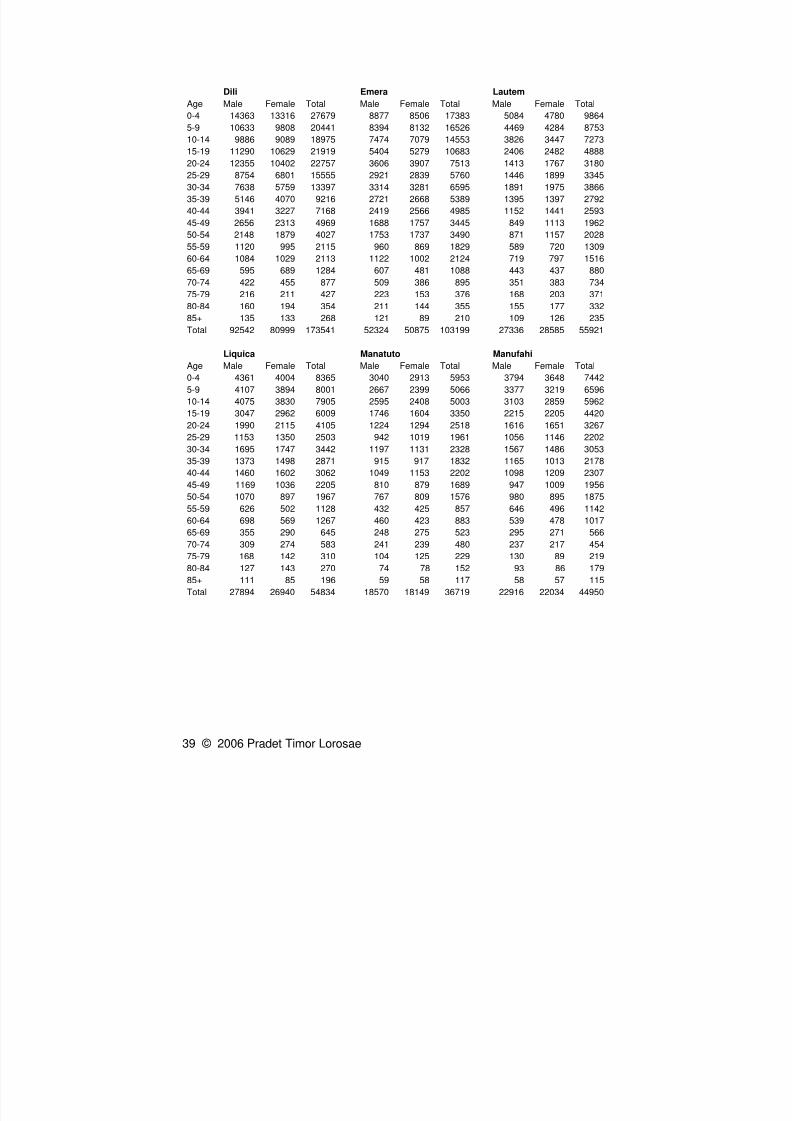
Appendices
Appendix 1 Population by District 2004 Census
(persons in private households)Timor Leste Aileu Ainaro
Age Male Female Total Male Female Total Male Female Total
0-4 77679 72995 150674 3269 3009 6278 4790 4452 9242
5-9 66613 62693 129306 2940 2819 5759 4150 3965 8115
10-14 61224 56989 118213 2904 2699 5603 3632 3276 6908
15-19 47515 46768 94283 2253 2100 4353 2354 2386 4740
20-24 36779 37782 74561 1422 1388 2810 1786 1969 3755
25-29 27950 28609 56559 688 786 1474 1685 1810 3495
30-34 31913 30057 61970 1156 1011 2167 1767 1651 3418
35-39 24707 23811 48518 1058 1010 2068 1467 1390 2857
40-44 22358 23366 45724 1101 1064 2165 1153 1315 2468
45-49 16818 17357 34175 788 729 1517 902 996 1898
50-54 16564 16244 32808 828 639 1467 919 909 1828
55-59 9868 9266 19134 353 294 647 558 461 1019
60-64 10582 9880 20462 437 370 807 582 526 1108
65-69 5937 5772 11709 173 155 328 309 290 599
70-74 4911 4758 9669 144 125 269 264 231 495
75-79 2308 2080 4388 53 29 82 104 83 187
80-84 1919 1840 3759 46 35 81 103 85 188
85+ 1318 1228 2546 33 18 51 95 61 156
Total 466963 451495 918458 19646 18280 37926 26620 25856 52476
Baucau Bobonaro Cova Lima
Age Male Female Total Male Female Total Male Female Total
0-4 8170 7632 15802 7051 6528 13579 4382 4180 85625-9 7685 7035 14720 5539 5204 10743 3918 3699 7617
10-14 6810 6286 13096 5450 5332 10782 3779 3520 7299
15-19 4542 4614 9156 4246 4403 8649 2597 2707 5304
20-24 2829 3097 5926 3060 3443 6503 1718 2068 3786
25-29 2277 2526 4803 2099 2307 4406 1312 1657 2969
30-34 3217 3310 6527 2366 2605 4971 1789 1696 3485
35-39 2584 2617 5201 2113 2268 4381 1486 1518 3004
40-44 2577 2734 5311 2120 2221 4341 1346 1456 2802
45-49 1973 2184 4157 1502 1722 3224 999 992 1991
50-54 2274 2335 4609 1603 1667 3270 980 866 1846
55-59 1368 1453 2821 1095 1070 2165 568 506 1074
60-64 1565 1562 3127 1193 1119 2312 594 481 1075
65-69 859 891 1750 755 709 1464 356 331 68770-74 809 795 1604 608 562 1170 306 273 579
75-79 396 352 748 263 228 491 151 116 267
80-84 353 277 630 192 163 355 127 145 272
85+ 180 158 338 116 112 228 94 105 199
Total 50468 49858 100326 41371 41663 83034 41371 41663 83034
8/3/2019 Census 2004 Overview
http://slidepdf.com/reader/full/census-2004-overview 39/48
39 © 2006 Pradet Timor Lorosae
Dili Emera Lautem
Age Male Female Total Male Female Total Male Female Total
0-4 14363 13316 27679 8877 8506 17383 5084 4780 9864
5-9 10633 9808 20441 8394 8132 16526 4469 4284 8753
10-14 9886 9089 18975 7474 7079 14553 3826 3447 7273
15-19 11290 10629 21919 5404 5279 10683 2406 2482 488820-24 12355 10402 22757 3606 3907 7513 1413 1767 3180
25-29 8754 6801 15555 2921 2839 5760 1446 1899 3345
30-34 7638 5759 13397 3314 3281 6595 1891 1975 3866
35-39 5146 4070 9216 2721 2668 5389 1395 1397 2792
40-44 3941 3227 7168 2419 2566 4985 1152 1441 2593
45-49 2656 2313 4969 1688 1757 3445 849 1113 1962
50-54 2148 1879 4027 1753 1737 3490 871 1157 2028
55-59 1120 995 2115 960 869 1829 589 720 1309
60-64 1084 1029 2113 1122 1002 2124 719 797 1516
65-69 595 689 1284 607 481 1088 443 437 880
70-74 422 455 877 509 386 895 351 383 734
75-79 216 211 427 223 153 376 168 203 371
80-84 160 194 354 211 144 355 155 177 332
85+ 135 133 268 121 89 210 109 126 235
Total 92542 80999 173541 52324 50875 103199 27336 28585 55921
Liquica Manatuto Manufahi
Age Male Female Total Male Female Total Male Female Total
0-4 4361 4004 8365 3040 2913 5953 3794 3648 7442
5-9 4107 3894 8001 2667 2399 5066 3377 3219 6596
10-14 4075 3830 7905 2595 2408 5003 3103 2859 5962
15-19 3047 2962 6009 1746 1604 3350 2215 2205 4420
20-24 1990 2115 4105 1224 1294 2518 1616 1651 3267
25-29 1153 1350 2503 942 1019 1961 1056 1146 2202
30-34 1695 1747 3442 1197 1131 2328 1567 1486 3053
35-39 1373 1498 2871 915 917 1832 1165 1013 2178
40-44 1460 1602 3062 1049 1153 2202 1098 1209 2307
45-49 1169 1036 2205 810 879 1689 947 1009 1956
50-54 1070 897 1967 767 809 1576 980 895 1875
55-59 626 502 1128 432 425 857 646 496 1142
60-64 698 569 1267 460 423 883 539 478 1017
65-69 355 290 645 248 275 523 295 271 566
70-74 309 274 583 241 239 480 237 217 454
75-79 168 142 310 104 125 229 130 89 219
80-84 127 143 270 74 78 152 93 86 179
85+ 111 85 196 59 58 117 58 57 115
Total 27894 26940 54834 18570 18149 36719 22916 22034 44950
8/3/2019 Census 2004 Overview
http://slidepdf.com/reader/full/census-2004-overview 40/48
40 © 2006 Pradet Timor Lorosae
Oecusse Viqueque
Age Male Female Total Male Female Total
0-4 4803 4741 9544 5695 5286 10981
5-9 3814 3623 7437 4131 3834 7965
10-14 3691 3391 7082 3412 3218 6630
15-19 2913 2923 5836 2546 2464 501020-24 2104 2594 4698 1813 1931 3744
25-29 1761 2181 3942 1175 1499 2674
30-34 1941 2039 3980 1856 2288 4144
35-39 1650 1741 3391 1928 1919 3847
40-44 1464 1549 3013 1503 1521 3024
45-49 1253 1161 2414 1205 1505 2710
50-54 1058 1032 2090 1254 1429 2683
55-59 723 613 1336 879 991 1870
60-64 596 500 1096 1313 1422 2735
65-69 340 325 665 664 704 1368
70-74 225 241 466 851 889 1740
75-79 105 116 221 601 618 1219
80-84 67 82 149 540 628 1168
85+ 63 46 109 364 355 719
Total 28571 28898 57469 31730 32501 64231
Timor Leste Population Percentage Timor Leste Population Cumulative Percentage
Age Male %Female% Total % Age
Male cum.% Female cum. % Total cum. %
0-4 16.6 16.2 16.4 0-4 16.6 16.2 16.4
5-9 14.3 13.9 14.1 5-9 30.9 30.1 30.5
10-14 13.1 12.6 12.9 10-14 44.0 42.7 43.4
15-19 10.2 10.4 10.3 15-19 54.2 53.0 53.6
20-24 7.9 8.4 8.1 20-24 62.1 61.4 61.7
25-29 6.0 6.3 6.2 25-29 68.0 67.7 67.930-34 6.8 6.7 6.7 30-34 74.9 74.4 74.6
35-39 5.3 5.3 5.3 35-39 80.2 79.7 79.9
40-44 4.8 5.2 5.0 40-44 85.0 84.8 84.9
45-49 3.6 3.8 3.7 45-49 88.6 88.7 88.6
50-54 3.5 3.6 3.6 50-54 92.1 92.3 92.2
55-59 2.1 2.1 2.1 55-59 94.2 94.3 94.3
60-64 2.3 2.2 2.2 60-64 96.5 96.5 96.5
65-69 1.3 1.3 1.3 65-69 97.8 97.8 97.8
70-74 1.1 1.1 1.1 70-74 98.8 98.9 98.8
75-79 0.5 0.5 0.5 75-79 99.3 99.3 99.3
80-84 0.4 0.4 0.4 80-84 99.7 99.7 99.7
85+ 0.3 0.3 0.3 85+ 100.0 100.0 100.0Total 100.0 100.0 100.0
8/3/2019 Census 2004 Overview
http://slidepdf.com/reader/full/census-2004-overview 41/48
41 © 2006 Pradet Timor Lorosae
Appendix 2 Marital Status Population in private households, 15 years and older, by marital status
Never
District Total Married Married Widowed Divorced Separated
Aileu 20,286 6,894 11,697 1,597 53 45Ainaro 28,211 8,285 17,430 2,243 135 118
Baucau 56,708 16,253 35,003 4,939 260 253
Bobonaro 47,930 14,655 29,162 3,724 203 186
Cova Lima 29,340 7,957 18,772 2,336 144 131
Dili 106,446 48,620 53,448 3,716 387 275
Ermera 54,737 17,705 31,829 4,796 255 152
Lautem 30,031 8,160 18,515 3,023 166 167
Liquica 30,563 10,638 17,248 2,467 116 94
Manatuto 20,697 6,143 12,559 1,875 57 63
Manufahi 24,950 7,949 14,935 1,898 104 64
Oecussi 33,406 9,114 21,767 2,330 90 105
Viqueque 36,960 9,256 23,217 4,023 218 246Timor Leste 520,265 171,629 305,582 38,967 2,188 1,899
Appendix 3 Sex of Head of Household Sex of head of the head of thehousehold
District Male Female Total
Aileu 6,541 1,204 7,745
Ainaro 9,539 1,988 11,527
Baucau 18,536 4,123 22,659
Bobonaro 14,916 3,481 18,397
Cova Lima 9,709 2,111 11,820Dili 26,053 5,522 31,575
Ermera 16,623 4,542 21,165
Lautem 9,643 3,355 12,998
Liquica 9,435 1,628 11,063
Manatuto 5,691 2,647 8,338
Manufahi 7,765 1,136 8,901
Oecussi 11,219 2,440 13,659
Viqueque 12,393 2,722 15,115
Timor Leste 158,063 36,899 194,962
8/3/2019 Census 2004 Overview
http://slidepdf.com/reader/full/census-2004-overview 42/48
42 © 2006 Pradet Timor Lorosae
Appendix 4 Household size Private households by number of residents
District Total 1 2 3 4 5 6 7 +
Aileu 7,745 768 980 948 992 918 874 2,265
Ainaro 11,527 990 1,640 1,765 1,719 1,628 1,321 2,464
Baucau 22,659 2,138 3,595 3,448 3,375 2,986 2,587 4,530
Bobonaro 18,397 789 2,476 3,348 3,313 2,998 2,258 3,215
Cova Lima 11,820 477 1,630 2,114 2,247 1,956 1,473 1,923
Dili 31,575 1,685 2,821 4,082 4,297 4,296 3,838 10,556
Ermera 21,165 1,967 2,528 2,778 2,916 2,741 2,496 5,739
Lautem 12,998 1,659 2,088 1,937 1,640 1,614 1,454 2,606
Liquica 11,063 534 1,313 1,629 1,687 1,629 1,398 2,873
Manatuto 8,338 727 1,284 1,326 1,322 1,119 973 1,587
Manufahi 8,901 335 1,019 1,273 1,351 1,346 1,220 2,357Oecussi 13,659 938 2,022 2,487 2,472 2,288 1,678 1,774
Viqueque 15,115 1,228 2,464 2,491 2,359 2,223 1,802 2,548
Timor Leste 194,962 14,235 25,860 29,626 29,690 27,742 23,372 44,437
Appendix 5 Fertility
5.1 Women (aged 15-54) reporting a birth in the year prior to the census
WomenTotal reporting Confinements
women births in
per 1000women
aged 15-54 past year aged15-54
Ainaro 12426 2451 197.25
Aileu 8,727 1,642 188.15
Baucau 23417 4299 183.58
Bobonaro 20636 3332 161.47
Cova Lima 12960 2057 158.72
Dili 45080 6923 153.57
Ermera 24034 4694 195.31
Liquica 13207 2118 160.37Lautem 13295 2626 197.52
Manufahi 10614 1831 172.51
Manatuto 8806 1530 173.75
Oecussi 15220 2711 178.12
Viqueque 15636 2954 188.92
Timor Leste 224058 39168 174.81
8/3/2019 Census 2004 Overview
http://slidepdf.com/reader/full/census-2004-overview 43/48
43 © 2006 Pradet Timor Lorosae
5.2 Women in private households by age at first birth and median age at first birth and
Age at Aileu Ainaro Baucau BobonaroCovaLima Dili Emera Lautem Liquica
first birth
2004-
2000
2004-
2000
2004-
2000 2004-2000
2004-
2000
2004-
2000
2004-
2000
2004-
2000
2004-
2000
Totalreportedconfinements 908 1,500 2528 2365 1502 6,605 3188 1440 1,17
<15 1 3 3 7 3 8 27 3
15 18 27 32 36 34 81 117 25 1
16 41 56 52 101 89 169 133 47 3
17 89 123 96 161 132 302 234 72 6
18 128 164 225 252 208 484 260 117 10
19 141 168 243 294 181 681 304 135 15
20 116 155 268 300 195 776 263 167 16
21 101 170 274 268 149 683 275 130 1222 68 122 191 204 120 618 248 127 9
23 50 80 169 140 91 515 258 123 8
24 43 92 145 129 75 444 189 88 7
25 32 64 154 79 43 385 163 98 4
26 15 75 136 77 44 326 133 66 4
27 15 55 112 82 23 290 116 57 3
28 17 40 91 49 30 226 77 51 3
29 16 24 82 41 19 184 81 37 2
30+ 17 82 255 145 66 433 310 97 8
Median age
at first birth 19.3 20.3 21.4 20.1 19.5 21.2 20.9 21.2 20
8/3/2019 Census 2004 Overview
http://slidepdf.com/reader/full/census-2004-overview 44/48
44 © 2006 Pradet Timor Lorosae
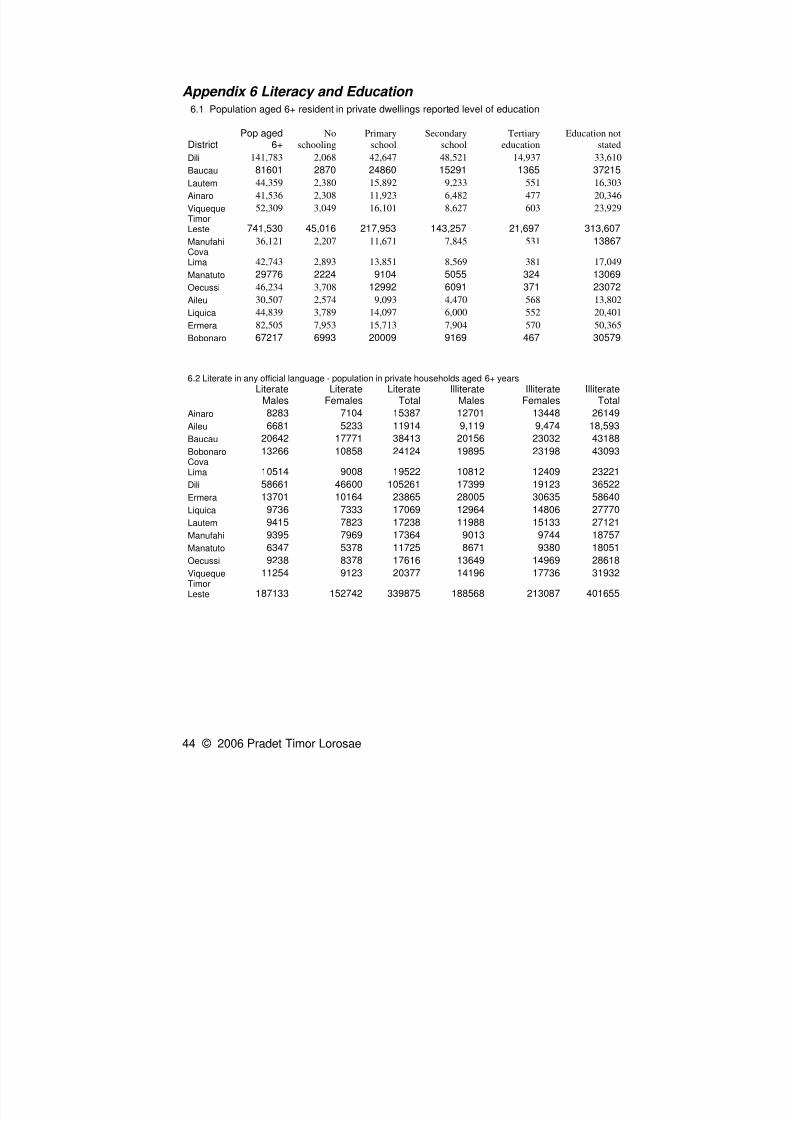
Appendix 6 Literacy and Education 6.1 Population aged 6+ resident in private dwellings reported level of education
DistrictPop aged
6+No
schooling
Primary
school
Secondary
school
Tertiary
education
Education not
stated
Dili 141,783 2,068 42,647 48,521 14,937 33,610
Baucau 81601 2870 24860 15291 1365 37215
Lautem 44,359 2,380 15,892 9,233 551 16,303
Ainaro 41,536 2,308 11,923 6,482 477 20,346
Viqueque 52,309 3,049 16,101 8,627 603 23,929TimorLeste 741,530 45,016 217,953 143,257 21,697 313,607
Manufahi 36,121 2,207 11,671 7,845 531 13867CovaLima 42,743 2,893 13,851 8,569 381 17,049
Manatuto 29776 2224 9104 5055 324 13069
Oecussi 46,234 3,708 12992 6091 371 23072
Aileu 30,507 2,574 9,093 4,470 568 13,802Liquica 44,839 3,789 14,097 6,000 552 20,401
Ermera 82,505 7,953 15,713 7,904 570 50,365
Bobonaro 67217 6993 20009 9169 467 30579
6.2 Literate in any official language - population in private households aged 6+ years
LiterateMales
LiterateFemales
LiterateTotal
IlliterateMales
IlliterateFemales
IlliterateTotal
Ainaro 8283 7104 15387 12701 13448 26149
Aileu 6681 5233 11914 9,119 9,474 18,593
Baucau 20642 17771 38413 20156 23032 43188
Bobonaro 13266 10858 24124 19895 23198 43093CovaLima 10514 9008 19522 10812 12409 23221
Dili 58661 46600 105261 17399 19123 36522
Ermera 13701 10164 23865 28005 30635 58640
Liquica 9736 7333 17069 12964 14806 27770
Lautem 9415 7823 17238 11988 15133 27121
Manufahi 9395 7969 17364 9013 9744 18757
Manatuto 6347 5378 11725 8671 9380 18051
Oecussi 9238 8378 17616 13649 14969 28618
Viqueque 11254 9123 20377 14196 17736 31932TimorLeste 187133 152742 339875 188568 213087 401655
8/3/2019 Census 2004 Overview
http://slidepdf.com/reader/full/census-2004-overview 45/48
45 © 2006 Pradet Timor Lorosae
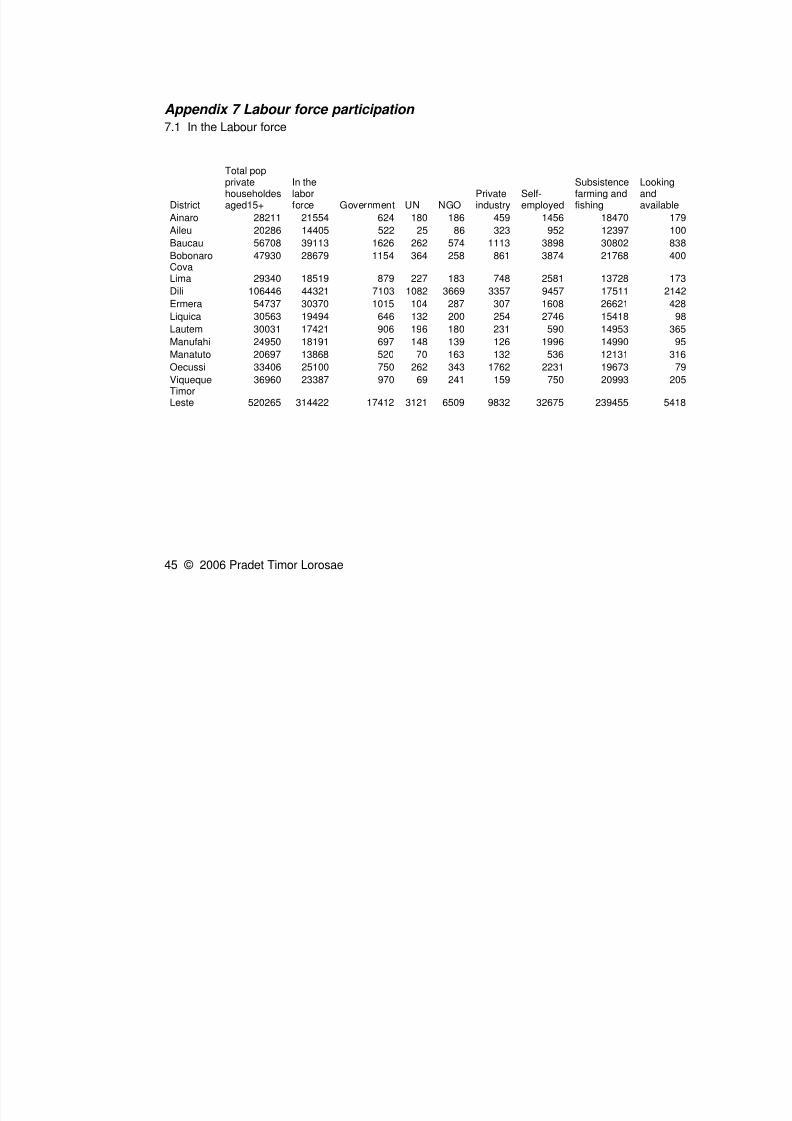
Appendix 7 Labour force participation
7.1 In the Labour force
District
Total popprivatehouseholdesaged15+
In thelaborforce Government UN NGO
Privateindustry
Self-employed
Subsistencefarming andfishing
Lookandavaila
Ainaro 28211 21554 624 180 186 459 1456 18470
Aileu 20286 14405 522 25 86 323 952 12397
Baucau 56708 39113 1626 262 574 1113 3898 30802
Bobonaro 47930 28679 1154 364 258 861 3874 21768CovaLima 29340 18519 879 227 183 748 2581 13728
Dili 106446 44321 7103 1082 3669 3357 9457 17511
Ermera 54737 30370 1015 104 287 307 1608 26621Liquica 30563 19494 646 132 200 254 2746 15418
Lautem 30031 17421 906 196 180 231 590 14953
Manufahi 24950 18191 697 148 139 126 1996 14990
Manatuto 20697 13868 520 70 163 132 536 12131
Oecussi 33406 25100 750 262 343 1762 2231 19673
Viqueque 36960 23387 970 69 241 159 750 20993TimorLeste 520265 314422 17412 3121 6509 9832 32675 239455
8/3/2019 Census 2004 Overview
http://slidepdf.com/reader/full/census-2004-overview 46/48
46 © 2006 Pradet Timor Lorosae
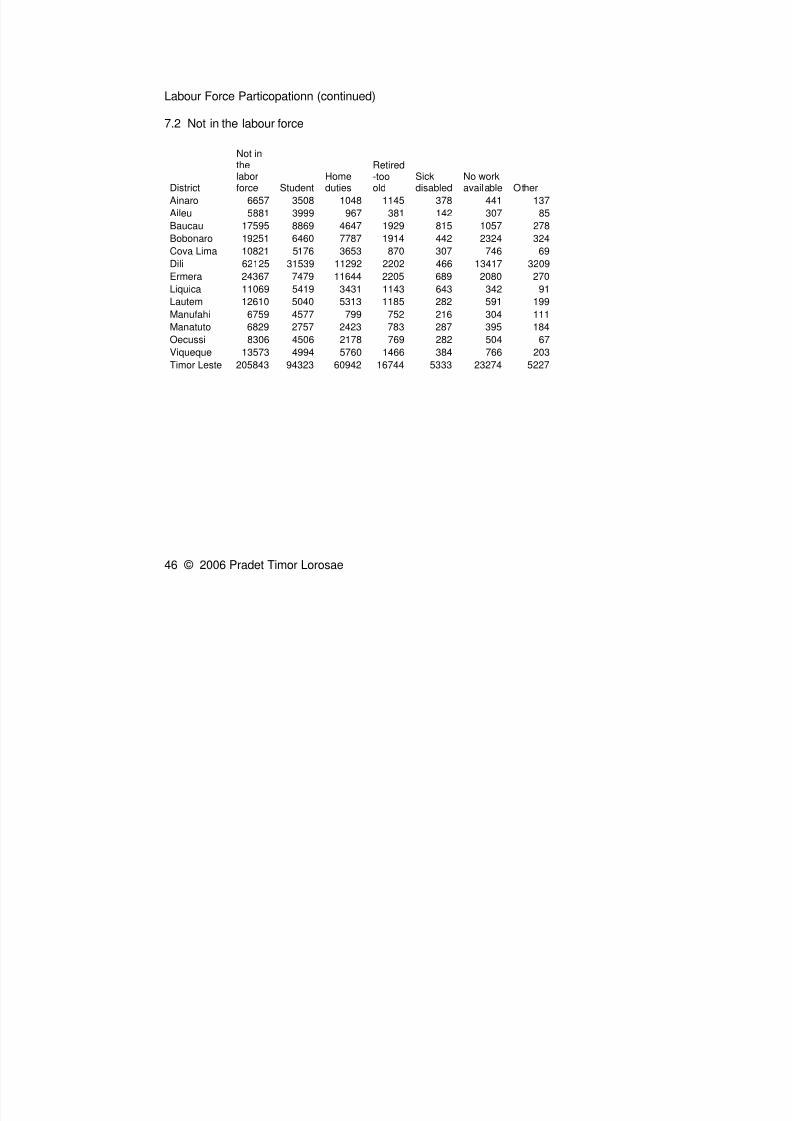
Labour Force Particopationn (continued)
7.2 Not in the labour force
District
Not inthelaborforce Student
Homeduties
Retired-tooold
Sickdisabled
No workavailable Other
Ainaro 6657 3508 1048 1145 378 441 137
Aileu 5881 3999 967 381 142 307 85
Baucau 17595 8869 4647 1929 815 1057 278
Bobonaro 19251 6460 7787 1914 442 2324 324
Cova Lima 10821 5176 3653 870 307 746 69
Dili 62125 31539 11292 2202 466 13417 3209
Ermera 24367 7479 11644 2205 689 2080 270
Liquica 11069 5419 3431 1143 643 342 91
Lautem 12610 5040 5313 1185 282 591 199Manufahi 6759 4577 799 752 216 304 111
Manatuto 6829 2757 2423 783 287 395 184
Oecussi 8306 4506 2178 769 282 504 67
Viqueque 13573 4994 5760 1466 384 766 203
Timor Leste 205843 94323 60942 16744 5333 23274 5227
8/3/2019 Census 2004 Overview
http://slidepdf.com/reader/full/census-2004-overview 47/48
47 © 2006 Pradet Timor Lorosae
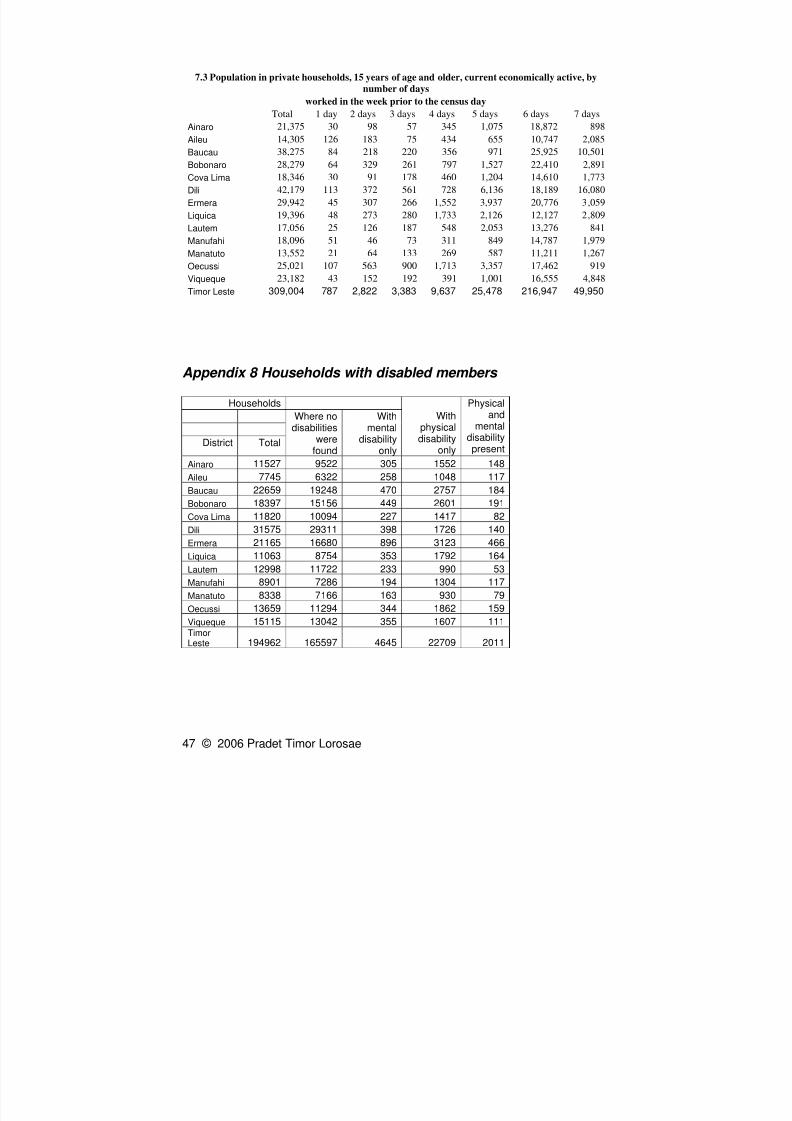
7.3 Population in private households, 15 years of age and older, current economically active, by
number of days
worked in the week prior to the census day
Total 1 day 2 days 3 days 4 days 5 days 6 days 7 days
Ainaro 21,375 30 98 57 345 1,075 18,872 898
Aileu 14,305 126 183 75 434 655 10,747 2,085
Baucau 38,275 84 218 220 356 971 25,925 10,501Bobonaro 28,279 64 329 261 797 1,527 22,410 2,891
Cova Lima 18,346 30 91 178 460 1,204 14,610 1,773
Dili 42,179 113 372 561 728 6,136 18,189 16,080
Ermera 29,942 45 307 266 1,552 3,937 20,776 3,059
Liquica 19,396 48 273 280 1,733 2,126 12,127 2,809
Lautem 17,056 25 126 187 548 2,053 13,276 841
Manufahi 18,096 51 46 73 311 849 14,787 1,979
Manatuto 13,552 21 64 133 269 587 11,211 1,267
Oecussi 25,021 107 563 900 1,713 3,357 17,462 919
Viqueque 23,182 43 152 192 391 1,001 16,555 4,848
Timor Leste 309,004 787 2,822 3,383 9,637 25,478 216,947 49,950
Appendix 8 Households with disabled members
Households
District Total
Where nodisabilities
were
found
Withmental
disability
only
Withphysicaldisability
only
Physicaland
mentaldisabilitypresent
Ainaro 11527 9522 305 1552 148
Aileu 7745 6322 258 1048 117
Baucau 22659 19248 470 2757 184
Bobonaro 18397 15156 449 2601 191
Cova Lima 11820 10094 227 1417 82
Dili 31575 29311 398 1726 140
Ermera 21165 16680 896 3123 466
Liquica 11063 8754 353 1792 164
Lautem 12998 11722 233 990 53
Manufahi 8901 7286 194 1304 117
Manatuto 8338 7166 163 930 79
Oecussi 13659 11294 344 1862 159Viqueque 15115 13042 355 1607 111TimorLeste 194962 165597 4645 22709 2011
8/3/2019 Census 2004 Overview
http://slidepdf.com/reader/full/census-2004-overview 48/48
Appendix 9 Construction material of the floor of dwellings
Private dwellings (occupied only) by the construction material of the
floor
Concrete or tile Wood Soil TotalAinaro 1,265 166 8,393 9,824
Aileu 1,058 74 5,271 6,403
Baucau 2,866 332 16,715 19,913
Bobonaro 4405 334 10435 15,174
Cova Lima 3923 425 5253 9,601
Dili 20962 135 5770 26,867
Ermera 2765 196 15941 18,902
Liquica 2087 20 7432 9,539
Lautem 2223 239 8625 11,087
Manufahi 2119 101 5398 7,618
Manatuto 1600 110 4892 6,602
Oecussi 1715 22 11086 12,823Viqueque 1530 140 11627 13,297
Timor Leste 48,518 2,294 116,838 167,650