Embed Size (px)
Citation preview
Report No. 11-02-01 (2002)
Department of Agriculture
Census of commercial agriculture
20022002Financial and production statistics
Census of commercial agriculture, 2002 Financial and production statistics
Report No. 11-02-01 (2002)
Department of Agriculture
Published by Statistics South Africa, Private Bag X44, Pretoria 0001 © Statistics South Africa, 2005 Users may apply or process this data, provided Statistics South Africa (Stats SA) is acknowledged as the original source of the data; that it is specified that the application and/or analysis is the result of the user's independent processing of the data; and that neither the basic data nor any reprocessed version or application thereof may be sold or offered for sale in any form whatsoever without prior permission from Stats SA. Stats SA Library Cataloguing-in-Publication (CIP) Data Census of commercial agriculture 2002: Financial and production statistics / Statistics South Africa, Pretoria, Statistics South Africa, 2005 XXX p. (Report No. 11-02-01 (2002)). ISBN-621-35432-5 1. Agriculture I. Statistics South Africa (LCSH 16) A complete set of Stats SA publications is available at Stats SA Library and the following libraries: National Library of South Africa, Pretoria Division Eastern Cape Library Services, King William’s Town National Library of South Africa, Cape Town Division Central Regional Library, Polokwane Library of Parliament, Cape Town Central Reference Library, Nelspruit Bloemfontein Public Library Central Reference Collection, Kimberley Natal Society Library, Pietermaritzburg Central Reference Library, Mmabatho Johannesburg Public Library This report is available on the Stats SA website: www.statssa.gov.za Copies are also available from: Printing and Distribution, Statistics South Africa Tel: (012) 310 8044 Fax: (012) 321 7381 Email: [email protected]
Corrected Edition20 April 2005
Other enquiries: Tel: (012) 310 8600/ 8390/ 8351/ 4892/ 8496/ 8095 (user information services) (012) 310 8984/ 310 2180 (technical enquiries) (012) 310 8891 (switchboard) Fax: (012) 310 8310 (technical enquiries) Email: [email protected] (user information services) [email protected] (technical enquiries)
Statistics South Africa
Census of commercial agriculture, Report No. 11-02-01 (2002)
i
Introduction
This report contains the detailed results of the 2002 Census of Commercial Agriculture, undertaken in the Republic of South Africa. The census covered commercial farming units in the entire country, including the former TBVC states (i.e. Transkei, Bophuthatswana, Venda and Ciskei) and so-called ‘self-governing territories’, which were not included in the last census of 1993. The following sectors were not included: forestry (e.g. timber, wattle, wood and other plantations), ocean fishing and agricultural services. Further details of the scope and methodology can be found at the end of the report.
The results of this census are used primarily by the National Department of Agriculture for planning purposes and by Statistics South Africa for purposes of compiling South Africa’s National Accounts, e.g. the Gross Domestic Product (GDP), fixed capital formation, supply and use tables and changes in inventories. The results are also extensively used by the private sector.
This volume contains two sets of tables. Part 1 contains detailed information regarding the financial performance of all the farmers included in the census. Part 2 contains detailed information regarding area and production among only those farmers who responded. The tables are preceded by the key findings of the census. All results are presented at provincial level.
This report was commissioned by the National Department of Agriculture. Stats SA wishes to express its sincere appreciation to the people involved from that department for their assistance and cooperation.
PJ Lehohla Statistician-General: Statistics South Africa
Pretoria 2005
Statistics South Africa
Census of commercial agriculture, Report No. 11-02-01 (2002)
ii
ContentsPage
Key findings ................................................................................................................................................................................................................................................. 1
Tables
Part 1 Financial information
Table 1 Selected principal statistics Table 1.1 Comparison between 1993 and 2002 ..................................................................................................................................................................................... 8Table 1.2 Gross farming income, expenditure, market value of assets and farming debt ...................................................................................................................... 9Table 1.3 Principal statistics by type of ownership ................................................................................................................................................................................ 10Table 1.4 Principal statistics by income group ....................................................................................................................................................................................... 10
Table 2 Employment on 28 February 2002 Table 2.1 Owners who farm themselves and unpaid family members involved in farming operations................................................................................................. 11Table 2.2 Paid employees according to occupation ............................................................................................................................................................................... 11
Table 3 Employee remuneration ...................................................................................................................................................................................................... 12
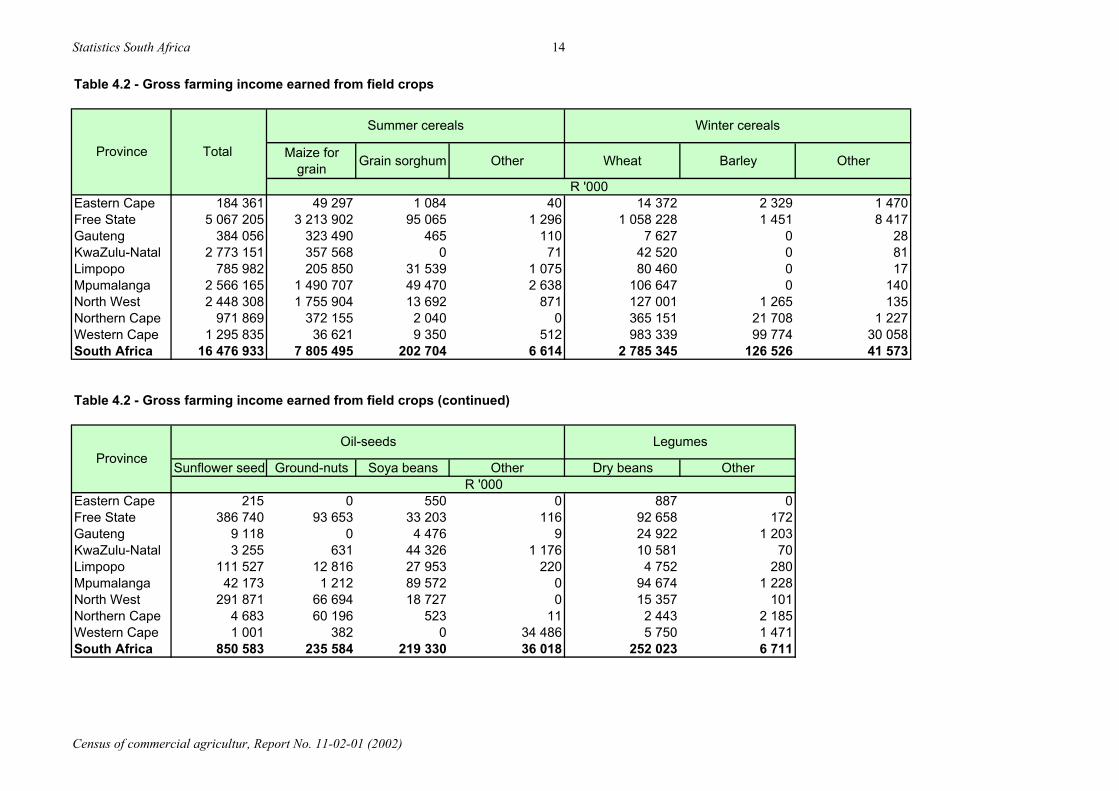
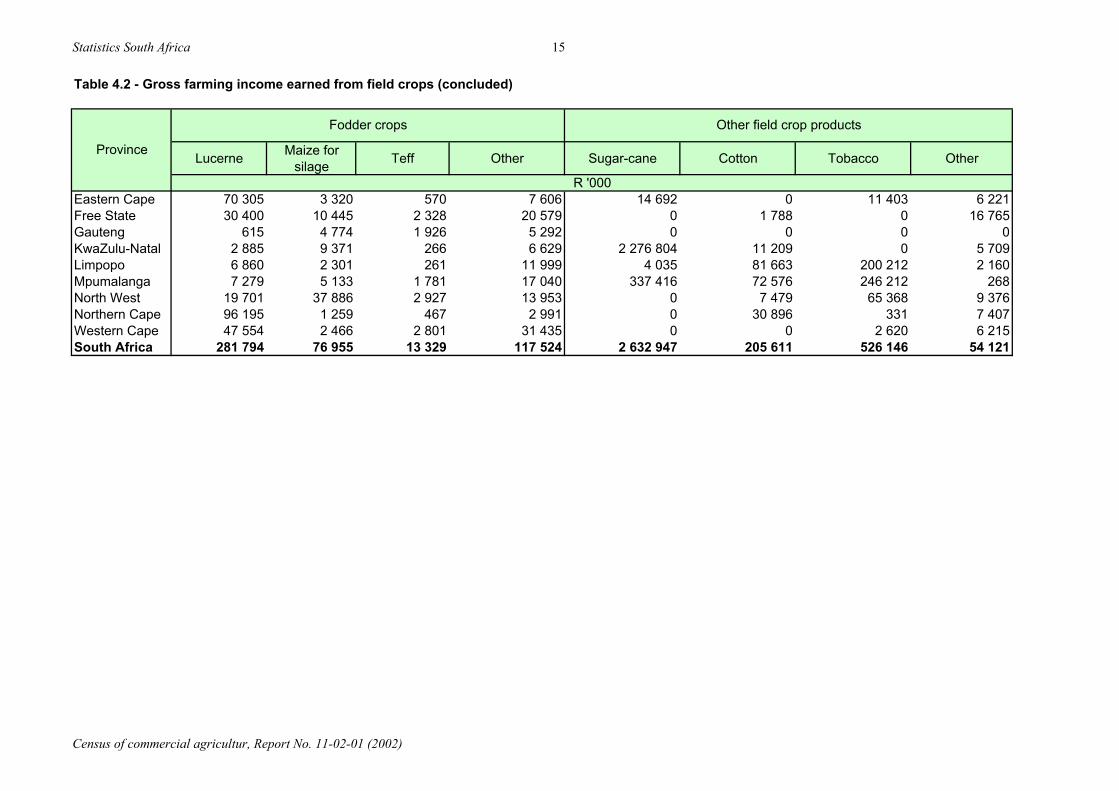
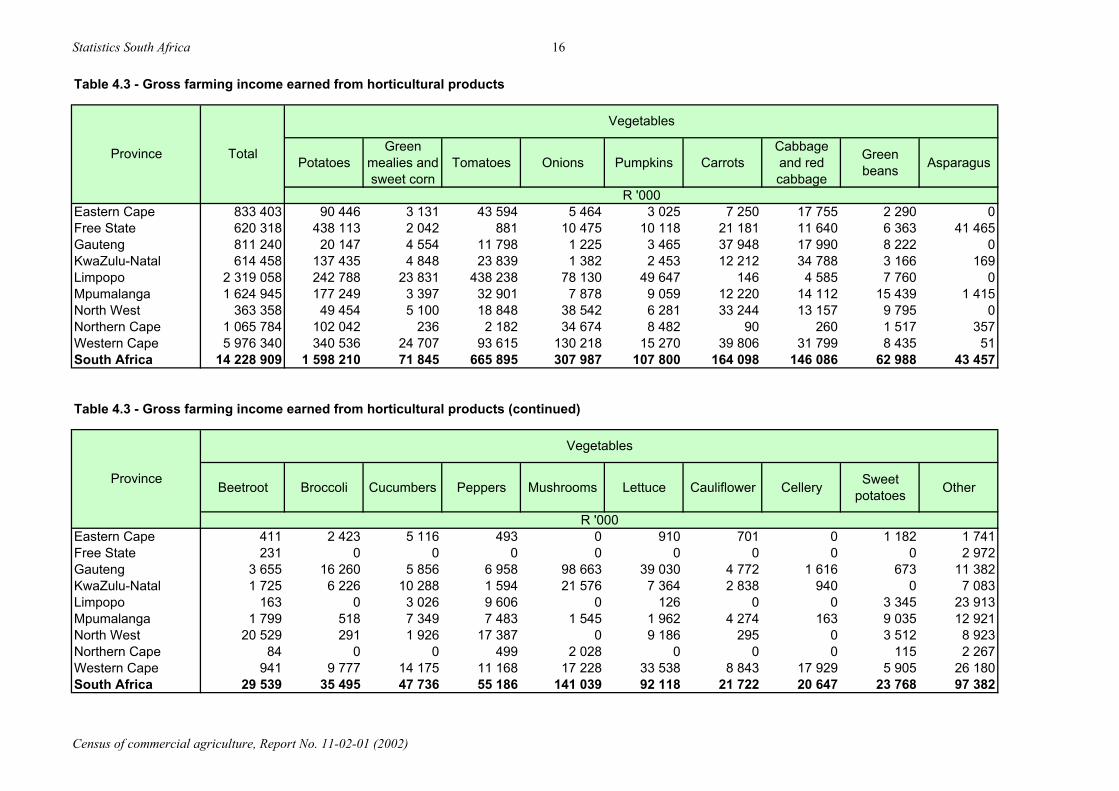
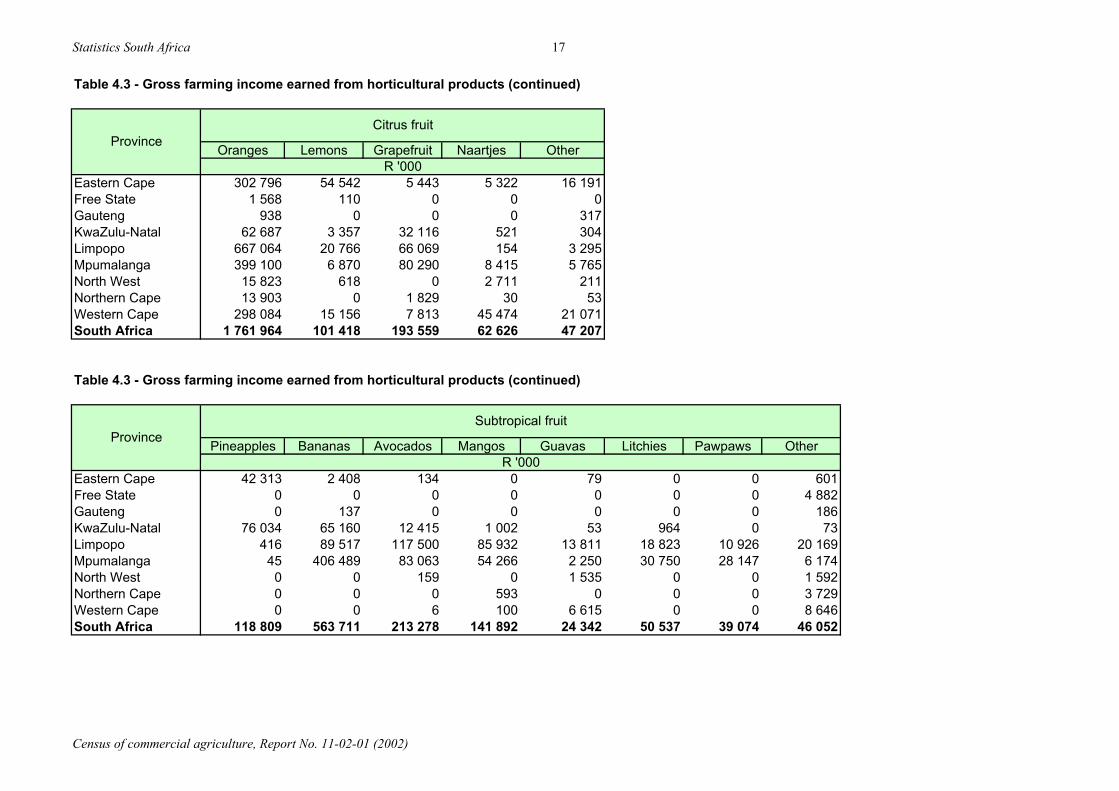
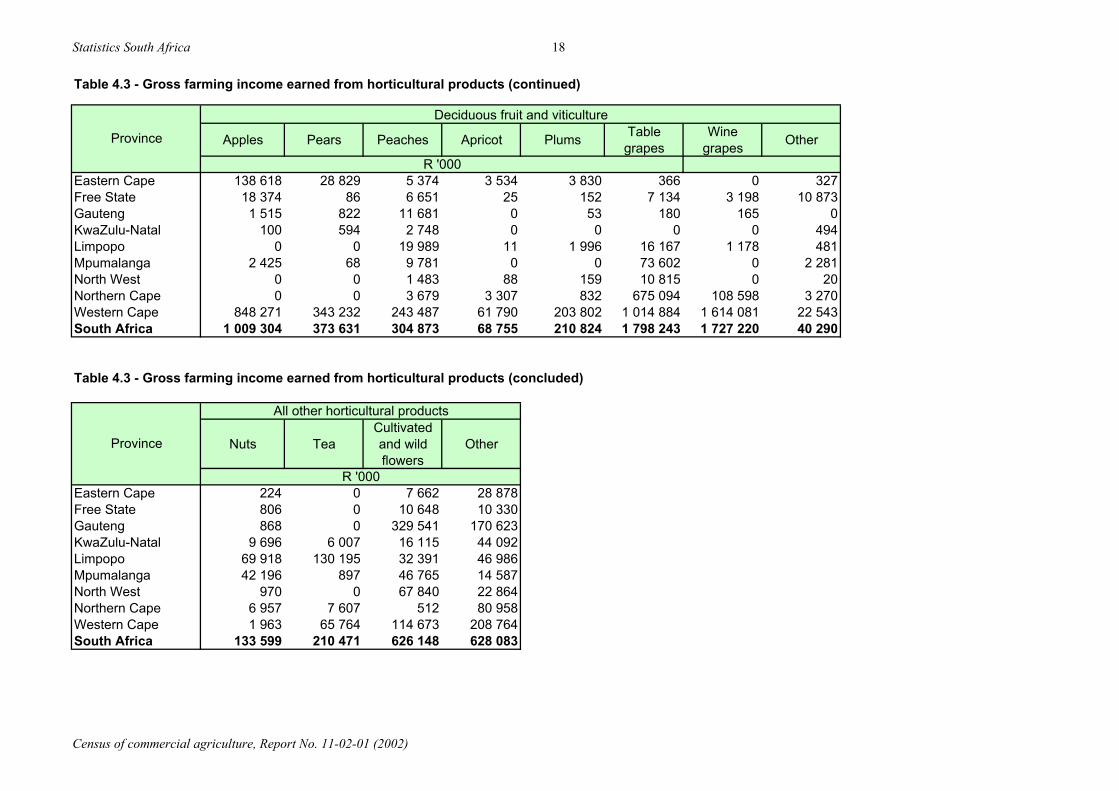
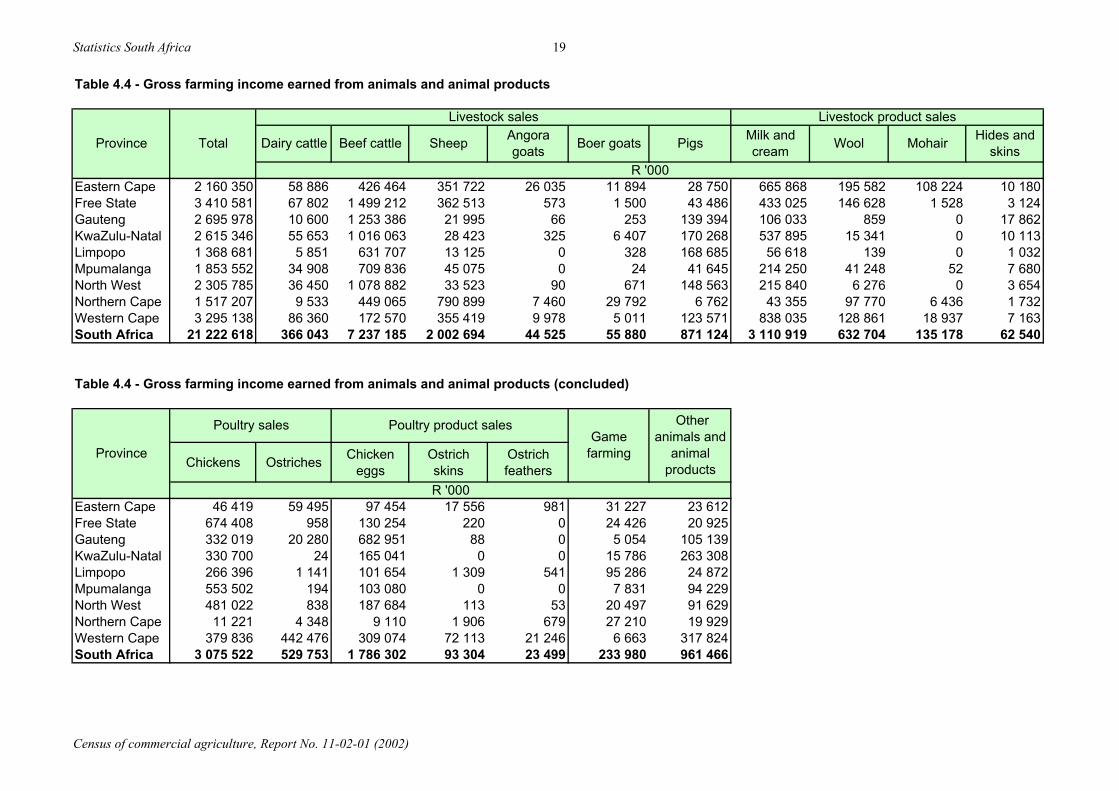
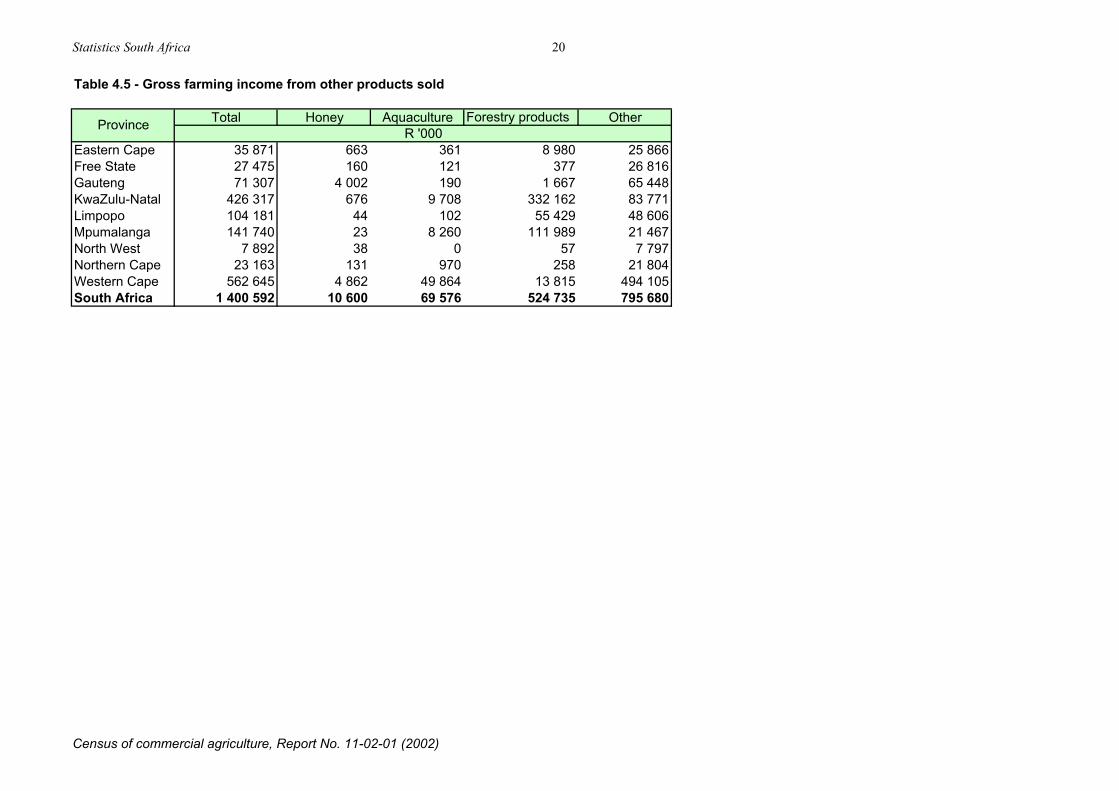
Table 4 Gross farming income Table 4.1 Gross farming income by main division................................................................................................................................................................................. 13Table 4.2 Gross farming income earned from field crops ...................................................................................................................................................................... 14Table 4.3 Gross farming income earned from horticultural products..................................................................................................................................................... 16Table 4.4 Gross farming income earned from animals and animal products ......................................................................................................................................... 19Table 4.5 Gross farming income from other products sold .................................................................................................................................................................... 20
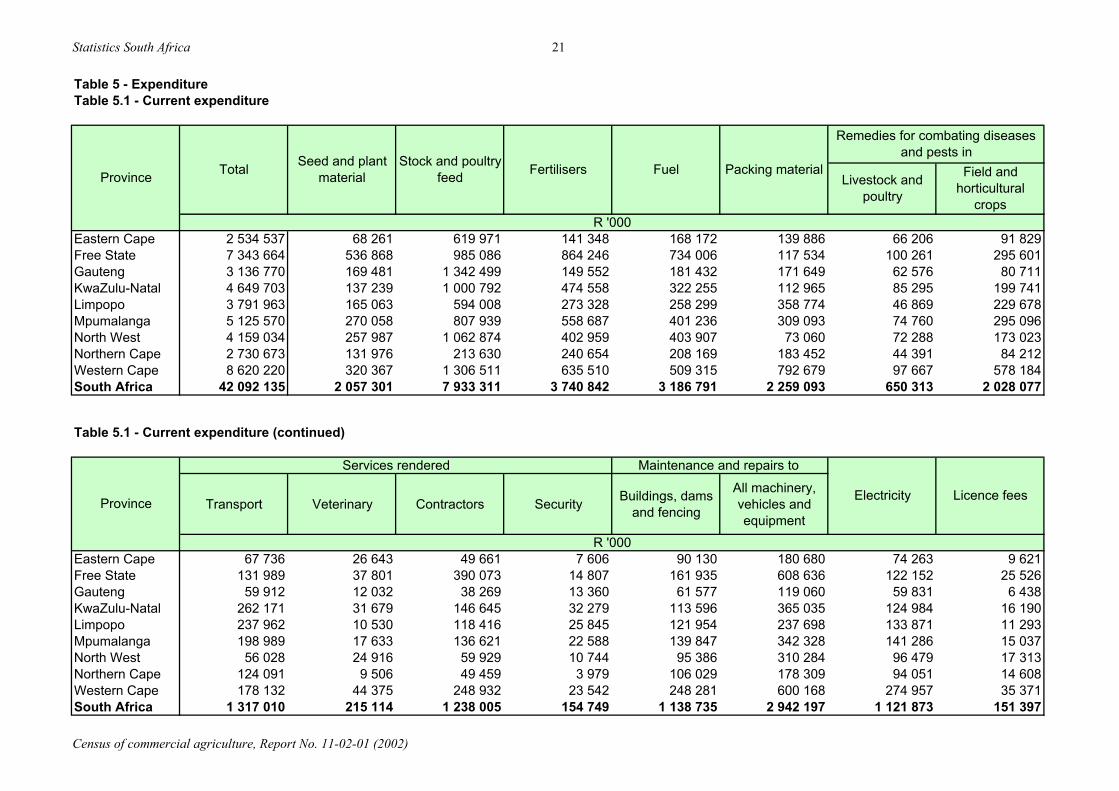
Table 5 Expenditure Table 5.1 Current expenditure................................................................................................................................................................................................................ 21Table 5.2 Losses during the financial year ............................................................................................................................................................................................. 23Table 5.3 Capital expenditure Table 5.3.1 New buildings erected and developed work done.................................................................................................................................................................. 24Table 5.3.2 New equipment purchased ..................................................................................................................................................................................................... 25Table 5.3.3 Pre-owned equipment purchased............................................................................................................................................................................................ 25
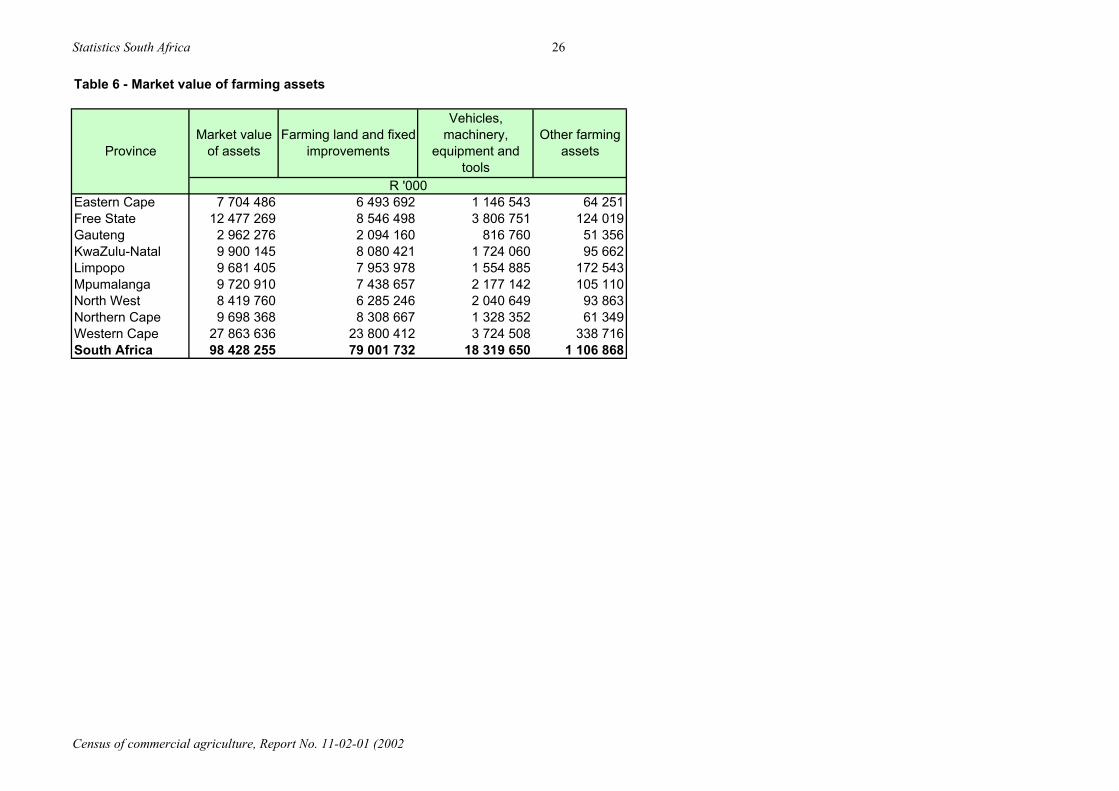
Table 6 Market value of farming assets .......................................................................................................................................................................................... 26
Statistics South Africa
Census of commercial agriculture, Report No. 11-02-01 (2002)
iii
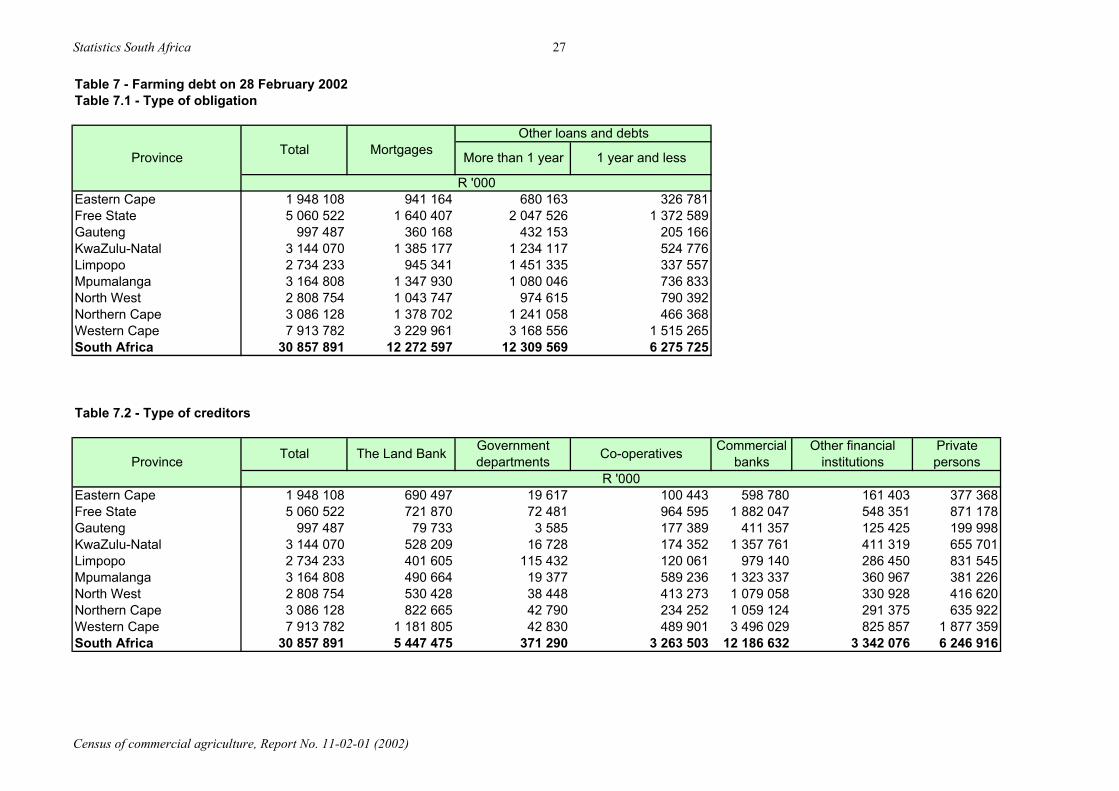
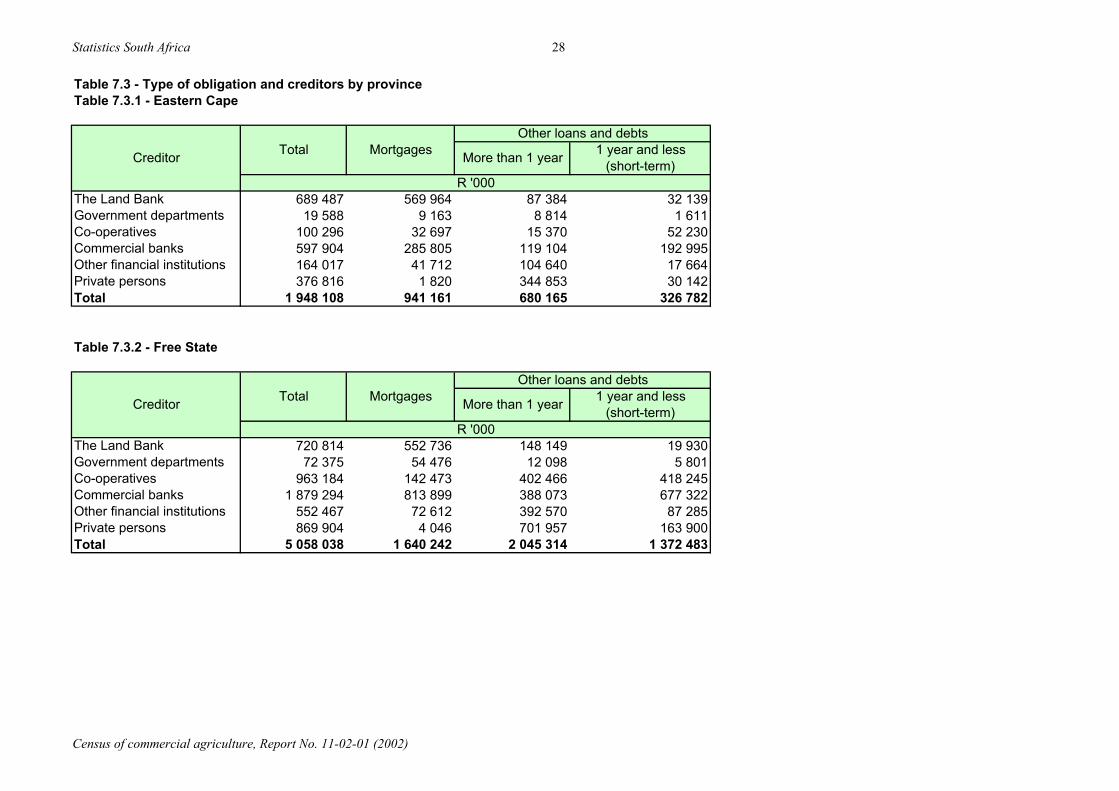
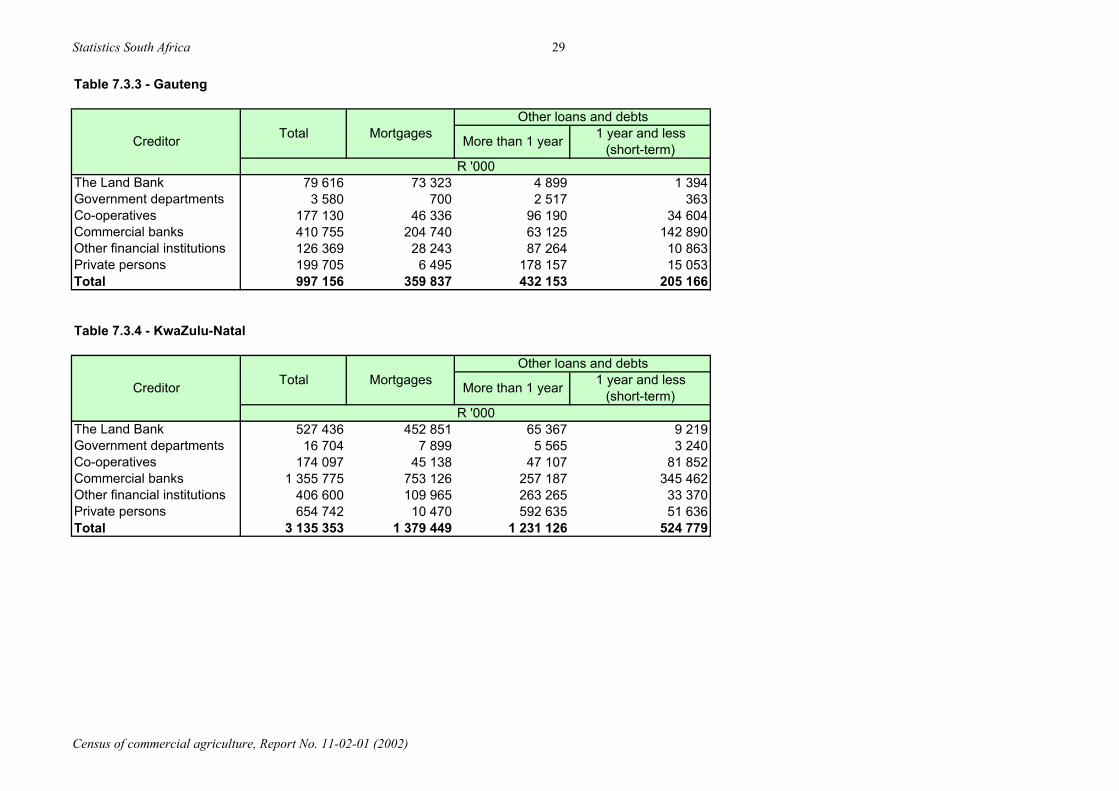
Table 7 Farming debt on 28 February 2002 Table 7.1 Type of obligation .................................................................................................................................................................................................................. 27Table 7.2 Type of creditors .................................................................................................................................................................................................................... 27Table 7.3 Type of obligation and creditors by province Table 7.3.1 Table 7.3.2 Table 7.3.3 Table 7.3.4 Table 7.3.5 Table 7.3.6 Table 7.3.7 Table 7.3.8 Table 7.3.9 Table 7.3.10
Eastern Cape...........................................................................................................................................................................................................................Free State................................................................................................................................................................................................................................Gauteng ..................................................................................................................................................................................................................................KwaZulu-Natal.......................................................................................................................................................................................................................Limpopo .................................................................................................................................................................................................................................Mpumalanga...........................................................................................................................................................................................................................North West .............................................................................................................................................................................................................................Northern Cape ........................................................................................................................................................................................................................Western Cape .........................................................................................................................................................................................................................South Africa ...........................................................................................................................................................................................................................
28282929303031313232
Part 2 Area and production information of those farmers who responded
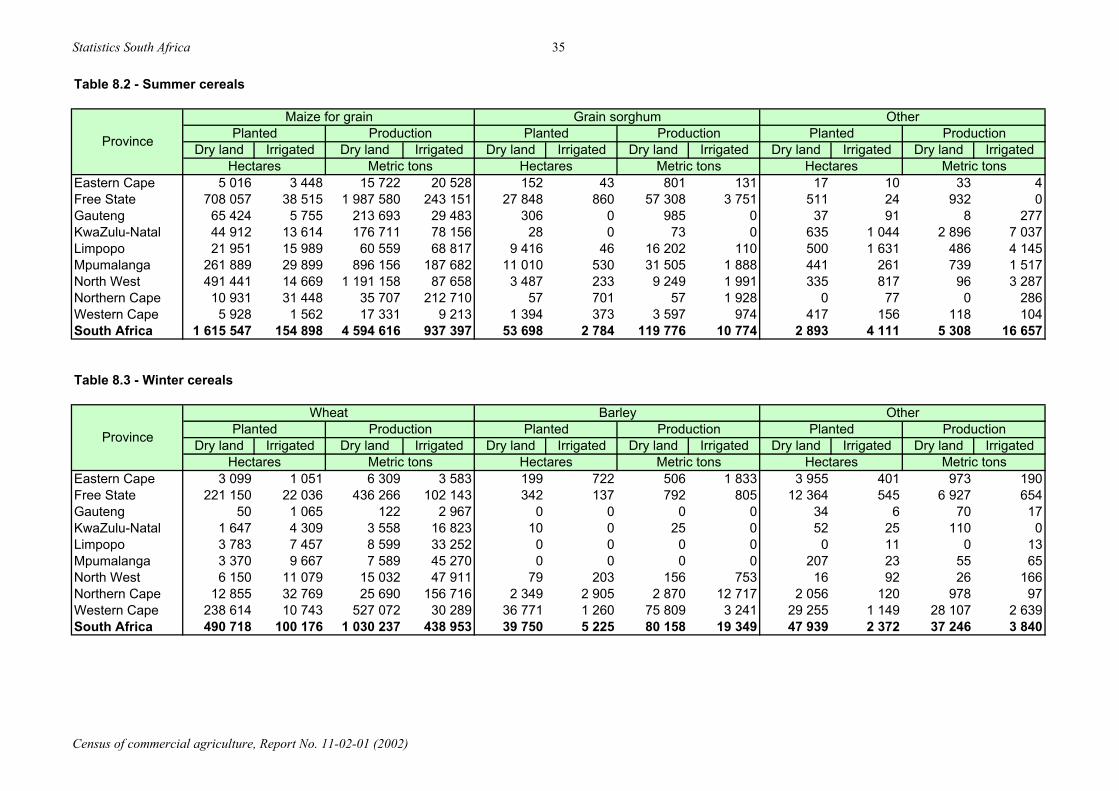
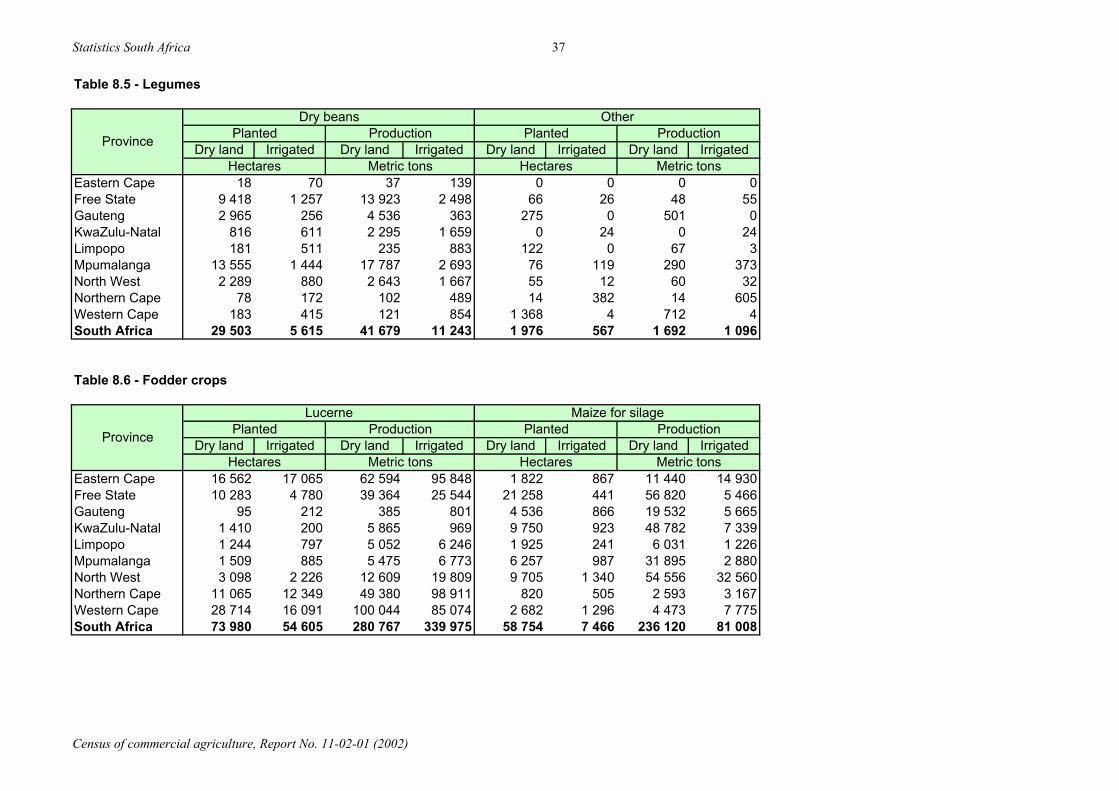
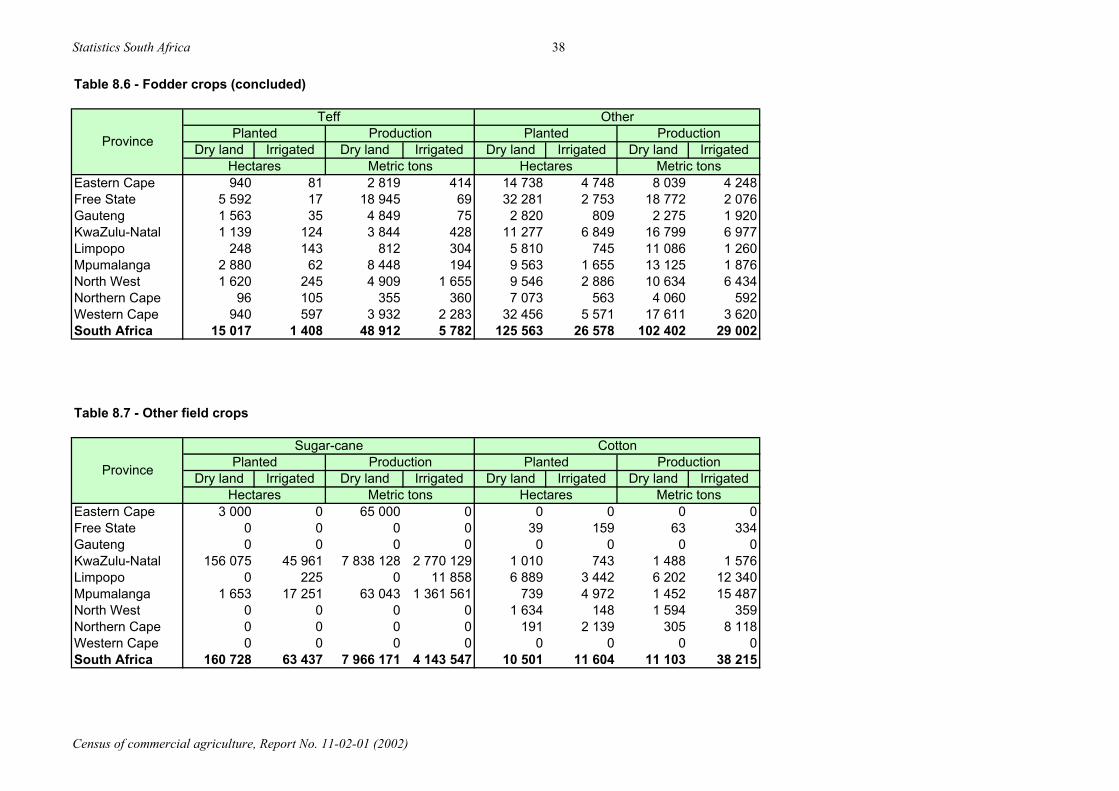
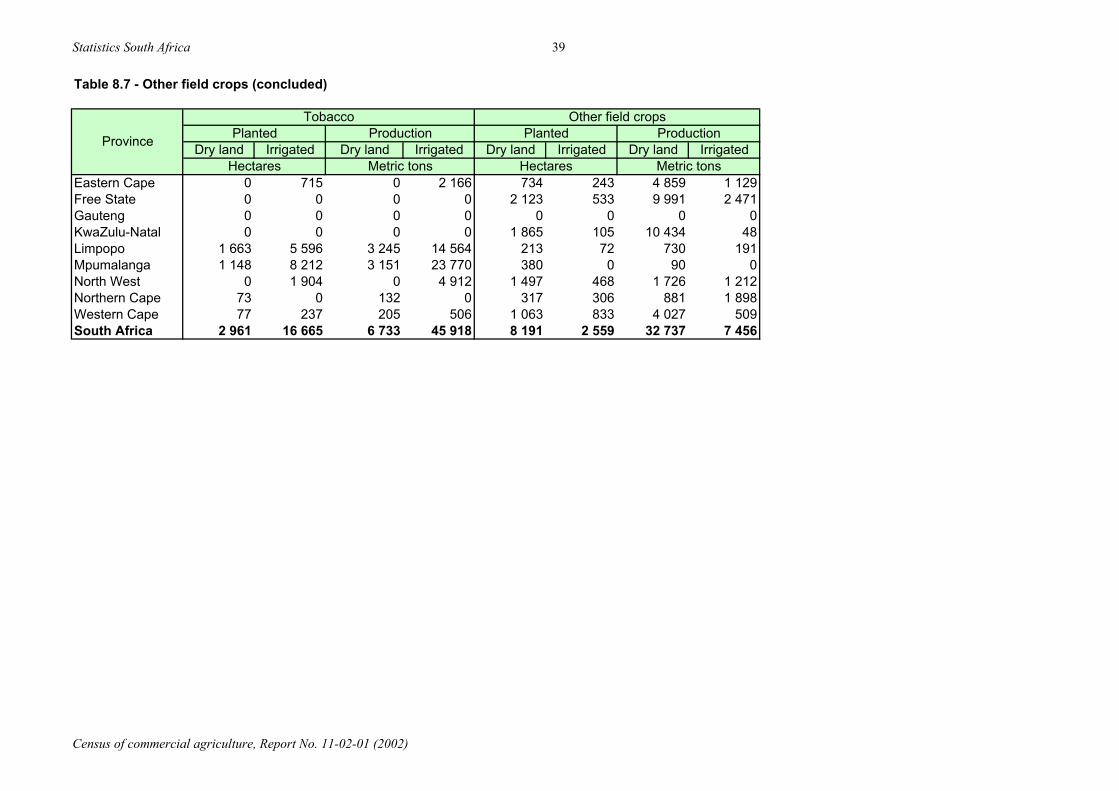
Table 8 Field crop products: Area planted and volume of production Table 8.1 Total field crop products ........................................................................................................................................................................................................ 34Table 8.2 Summer cereals ...................................................................................................................................................................................................................... 35Table 8.3 Winter cereals......................................................................................................................................................................................................................... 35Table 8.4 Oil-seed .................................................................................................................................................................................................................................. 36Table 8.5 Legumes ................................................................................................................................................................................................................................. 37Table 8.6 Fodder crops........................................................................................................................................................................................................................... 37Table 8.7 Other field crops..................................................................................................................................................................................................................... 38
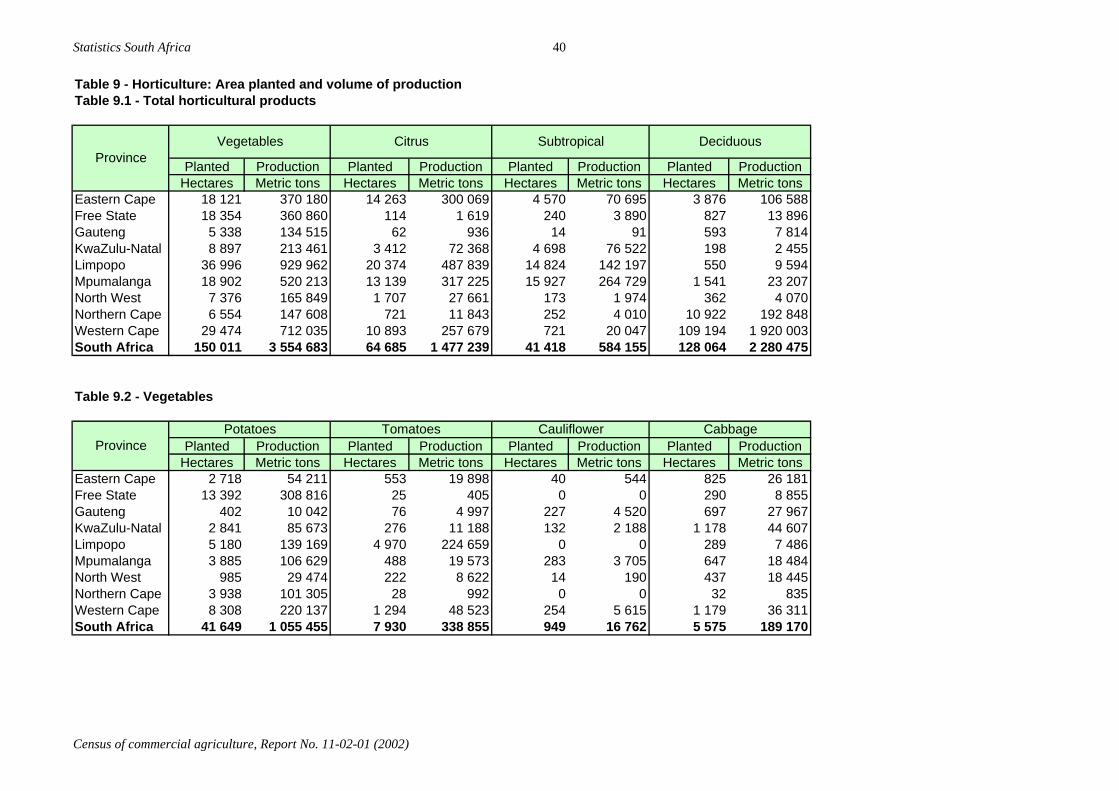
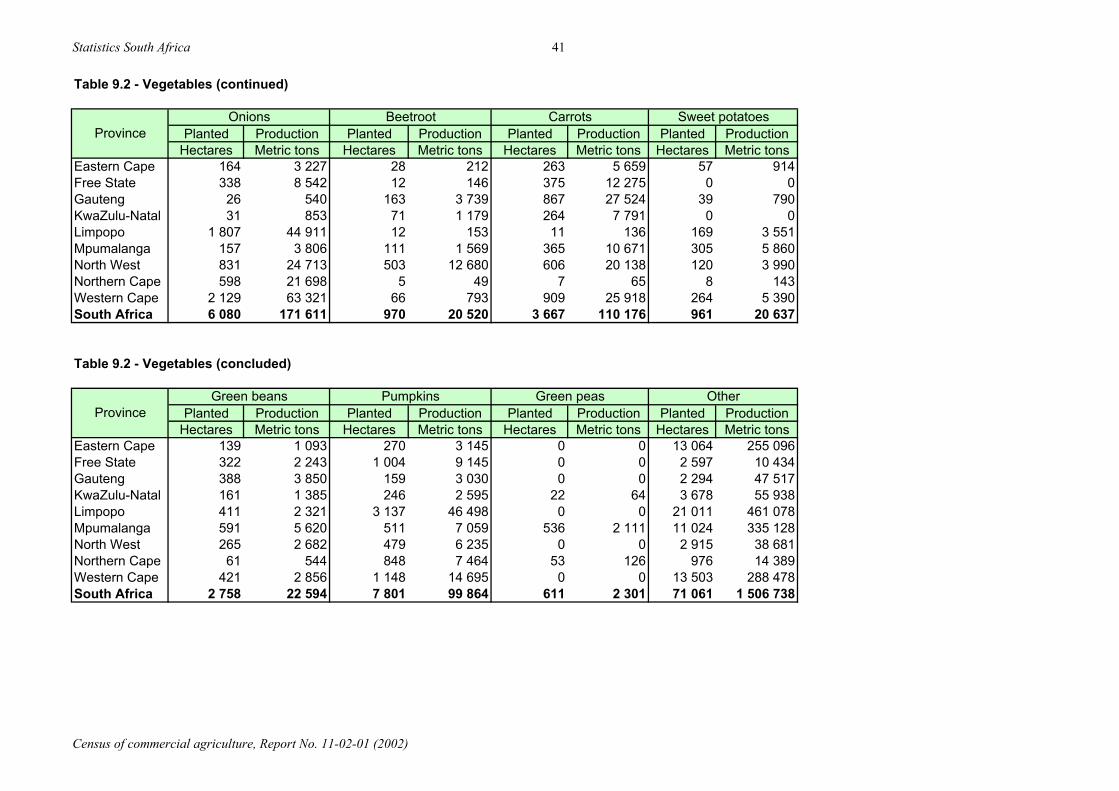
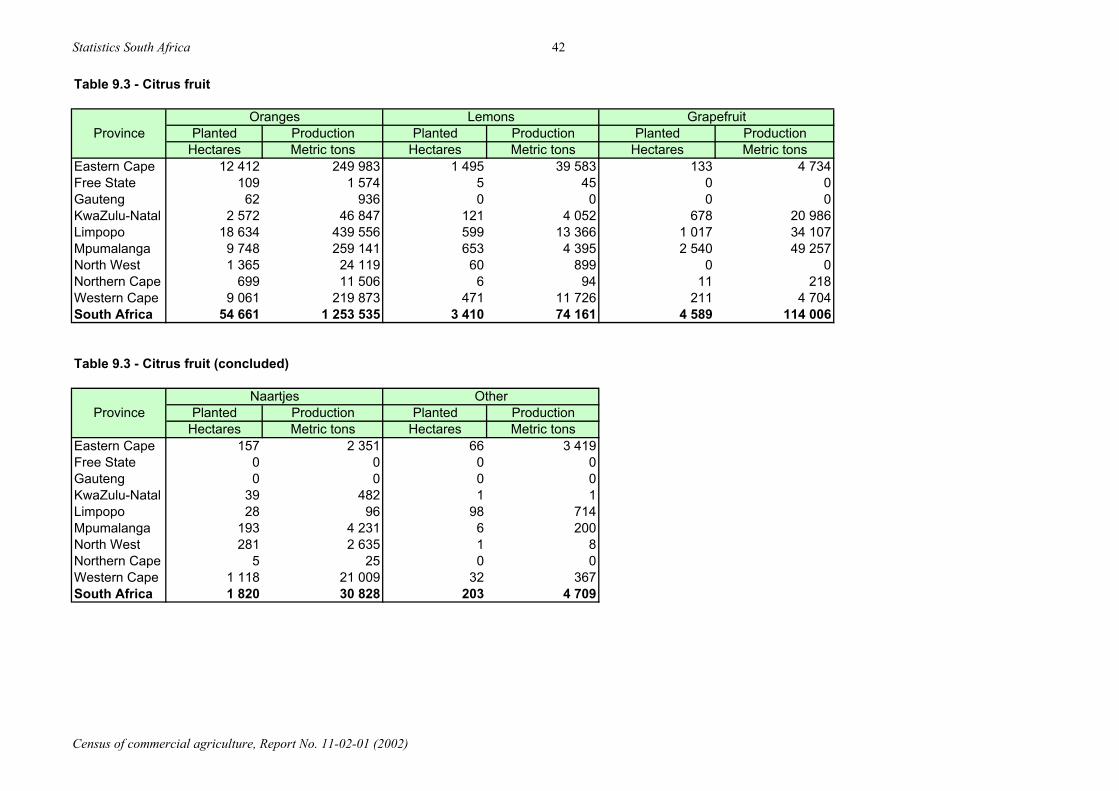
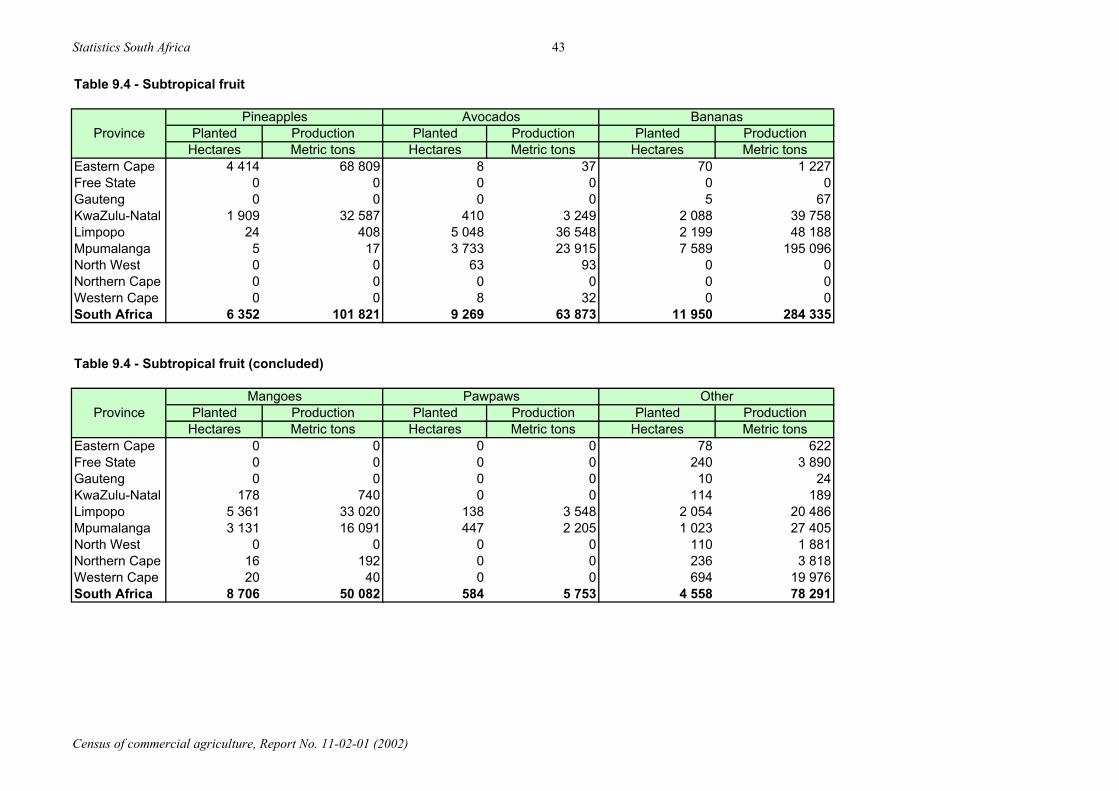
Table 9 Horticulture: Area planted and volume of production Table 9.1 Total horticultural products .................................................................................................................................................................................................... 40Table 9.2 Vegetables .............................................................................................................................................................................................................................. 40Table 9.3 Citrus fruit .............................................................................................................................................................................................................................. 42Table 9.4 Subtropical fruit...................................................................................................................................................................................................................... 43Table 9.5 Deciduous and other fruit ....................................................................................................................................................................................................... 44Table 9.6 Nuts, coffee and tea ................................................................................................................................................................................................................ 45
Table 10 Animals and animal products: Volume of production Table 10.1 Number of livestock sold ....................................................................................................................................................................................................... 47Table 10.2 Livestock products sold ......................................................................................................................................................................................................... 47Table 10.3 Poultry, ostriches and poultry and ostrich products sold ....................................................................................................................................................... 48Table 10.4 Other products sold ............................................................................................................................................................................................................... 48
Statistics South Africa
Census of commercial agriculture, Report No. 11-02-01 (2002)
iv
Table 11 Livestock on 28 February 2002 Table 11.1 Cattle ...................................................................................................................................................................................................................................... 49Table 11.2 Sheep and goats ...................................................................................................................................................................................................................... 49Table 11.3 Other animals ......................................................................................................................................................................................................................... 50
Methods and explanatory notes .................................................................................................................................................................................................................. 51
Statistics South Africa
1
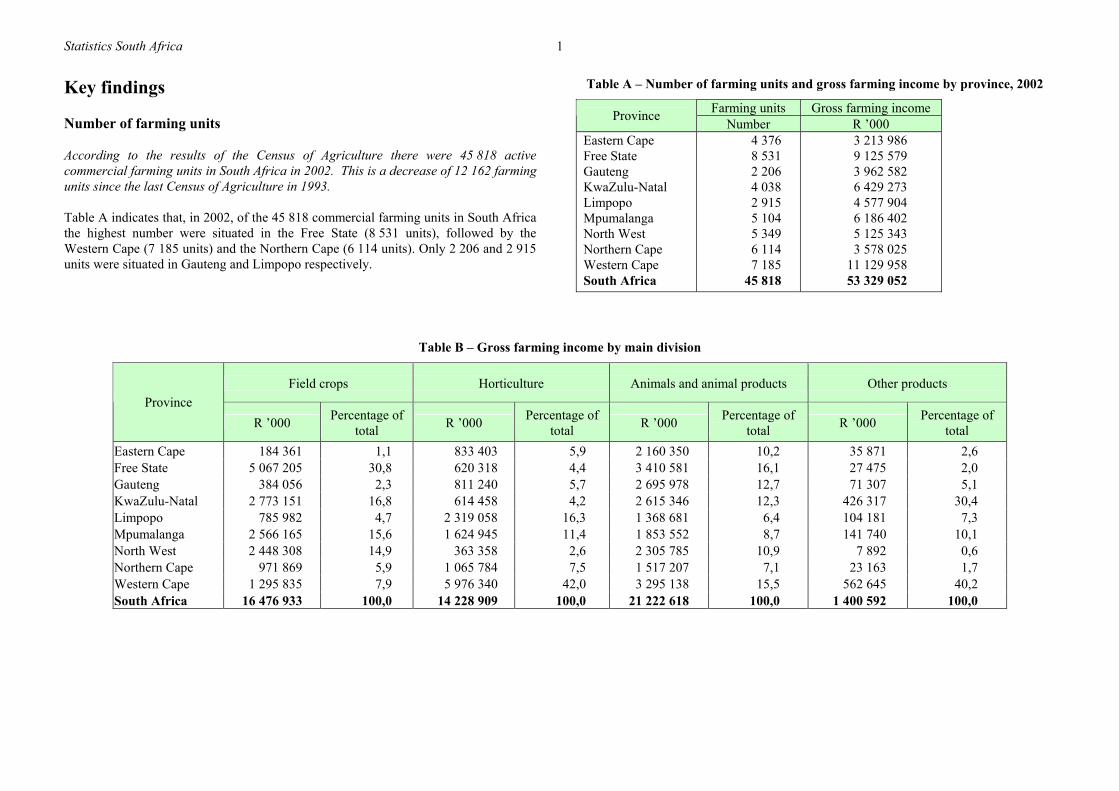
Key findings Number of farming units According to the results of the Census of Agriculture there were 45 818 active commercial farming units in South Africa in 2002. This is a decrease of 12 162 farming units since the last Census of Agriculture in 1993. Table A indicates that, in 2002, of the 45 818 commercial farming units in South Africa the highest number were situated in the Free State (8 531 units), followed by the Western Cape (7 185 units) and the Northern Cape (6 114 units). Only 2 206 and 2 915 units were situated in Gauteng and Limpopo respectively.
Table A – Number of farming units and gross farming income by province, 2002
Farming units Gross farming income Province Number R ’000 Eastern Cape Free State Gauteng KwaZulu-Natal Limpopo Mpumalanga North West Northern Cape Western Cape South Africa
4 376 8 531 2 206 4 038 2 915 5 104 5 349 6 114 7 185 45 818
3 213 986 9 125 579 3 962 582 6 429 273 4 577 904 6 186 402 5 125 343 3 578 025 11 129 958 53 329 052
Table B – Gross farming income by main division
Field crops Horticulture Animals and animal products Other products Province
R ’000 Percentage of total R ’000 Percentage of
total R ’000 Percentage of total R ’000 Percentage of
total Eastern Cape 184 361 1,1 833 403 5,9 2 160 350 10,2 35 871 2,6 Free State 5 067 205 30,8 620 318 4,4 3 410 581 16,1 27 475 2,0 Gauteng 384 056 2,3 811 240 5,7 2 695 978 12,7 71 307 5,1 KwaZulu-Natal 2 773 151 16,8 614 458 4,2 2 615 346 12,3 426 317 30,4 Limpopo 785 982 4,7 2 319 058 16,3 1 368 681 6,4 104 181 7,3 Mpumalanga 2 566 165 15,6 1 624 945 11,4 1 853 552 8,7 141 740 10,1 North West 2 448 308 14,9 363 358 2,6 2 305 785 10,9 7 892 0,6 Northern Cape 971 869 5,9 1 065 784 7,5 1 517 207 7,1 23 163 1,7 Western Cape 1 295 835 7,9 5 976 340 42,0 3 295 138 15,5 562 645 40,2 South Africa 16 476 933 100,0 14 228 909 100,0 21 222 618 100,0 1 400 592 100,0
Statistics South Africa
2
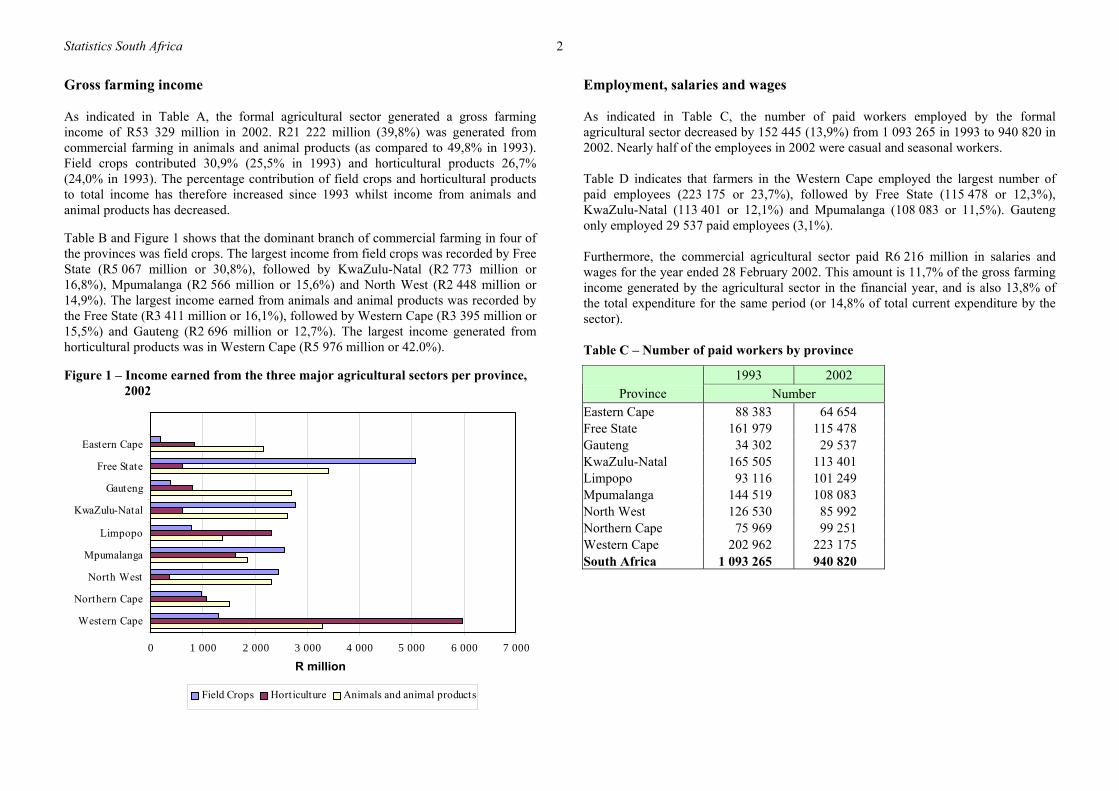
Gross farming income As indicated in Table A, the formal agricultural sector generated a gross farming income of R53 329 million in 2002. R21 222 million (39,8%) was generated from commercial farming in animals and animal products (as compared to 49,8% in 1993). Field crops contributed 30,9% (25,5% in 1993) and horticultural products 26,7% (24,0% in 1993). The percentage contribution of field crops and horticultural products to total income has therefore increased since 1993 whilst income from animals and animal products has decreased. Table B and Figure 1 shows that the dominant branch of commercial farming in four of the provinces was field crops. The largest income from field crops was recorded by Free State (R5 067 million or 30,8%), followed by KwaZulu-Natal (R2 773 million or 16,8%), Mpumalanga (R2 566 million or 15,6%) and North West (R2 448 million or 14,9%). The largest income earned from animals and animal products was recorded by the Free State (R3 411 million or 16,1%), followed by Western Cape (R3 395 million or 15,5%) and Gauteng (R2 696 million or 12,7%). The largest income generated from horticultural products was in Western Cape (R5 976 million or 42.0%). Figure 1 – Income earned from the three major agricultural sectors per province, 2002
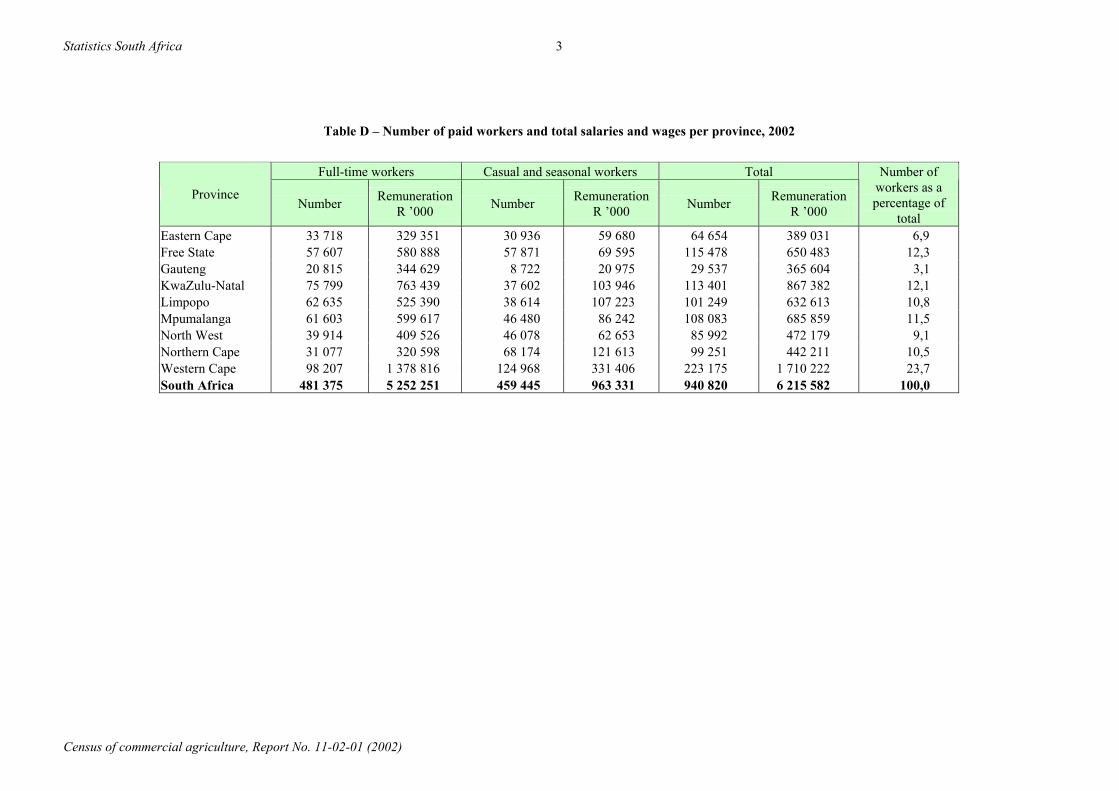
Employment, salaries and wages As indicated in Table C, the number of paid workers employed by the formal agricultural sector decreased by 152 445 (13,9%) from 1 093 265 in 1993 to 940 820 in 2002. Nearly half of the employees in 2002 were casual and seasonal workers. Table D indicates that farmers in the Western Cape employed the largest number of paid employees (223 175 or 23,7%), followed by Free State (115 478 or 12,3%), KwaZulu-Natal (113 401 or 12,1%) and Mpumalanga (108 083 or 11,5%). Gauteng only employed 29 537 paid employees (3,1%). Furthermore, the commercial agricultural sector paid R6 216 million in salaries and wages for the year ended 28 February 2002. This amount is 11,7% of the gross farming income generated by the agricultural sector in the financial year, and is also 13,8% of the total expenditure for the same period (or 14,8% of total current expenditure by the sector). Table C – Number of paid workers by province
1993 2002 Province Number
Eastern Cape 88 383 64 654 Free State 161 979 115 478 Gauteng 34 302 29 537 KwaZulu-Natal 165 505 113 401 Limpopo 93 116 101 249 Mpumalanga 144 519 108 083 North West 126 530 85 992 Northern Cape 75 969 99 251 Western Cape 202 962 223 175 South Africa 1 093 265 940 820
0 1 000 2 000 3 000 4 000 5 000 6 000 7 000
Eastern Cape
Free State
Gauteng
KwaZulu-Natal
Limpopo
Mpumalanga
North West
Northern Cape
Western Cape
Field Crops Horticulture Animals and animal products
R million
Statistics South Africa
Census of commercial agriculture, Report No. 11-02-01 (2002)
3
Table D – Number of paid workers and total salaries and wages per province, 2002
Full-time workers Casual and seasonal workers Total
Province Number Remuneration
R ’000 Number Remuneration R ’000 Number Remuneration
R ’000
Number of workers as a percentage of
total Eastern Cape 33 718 329 351 30 936 59 680 64 654 389 031 6,9 Free State 57 607 580 888 57 871 69 595 115 478 650 483 12,3 Gauteng 20 815 344 629 8 722 20 975 29 537 365 604 3,1 KwaZulu-Natal 75 799 763 439 37 602 103 946 113 401 867 382 12,1 Limpopo 62 635 525 390 38 614 107 223 101 249 632 613 10,8 Mpumalanga 61 603 599 617 46 480 86 242 108 083 685 859 11,5 North West 39 914 409 526 46 078 62 653 85 992 472 179 9,1 Northern Cape 31 077 320 598 68 174 121 613 99 251 442 211 10,5 Western Cape 98 207 1 378 816 124 968 331 406 223 175 1 710 222 23,7 South Africa 481 375 5 252 251 459 445 963 331 940 820 6 215 582 100,0
Statistics South Africa
Census of commercial agriculture, Report No. 11-02-01 (2002)
4
Expenditure
Table E shows that total expenditure by the formal agriculture sector amounted to R45 039 million. Only 6,5% or R2 947 million of this amount was capital expenditure on assets whilst 93,5% or R42 092 million was current expenditure. Western Cape contributed 20,7% to the total expenditure for agricultural products.
Table E – Number of farming units and expenditure per province, 2002
Expenditure Farming units
Current Capital Total
Province Number R ’000 R ’000
Eastern Cape 4 376 2 534 537 239 452 2 773 989 Free State 8 531 7 343 664 376 883 7 720 547 Gauteng 2 206 3 136 770 114 264 3 251 034 KwaZulu-Natal 4 038 4 649 703 407 744 5 057 447 Limpopo 2 915 3 791 963 326 118 4 118 081 Mpumalanga 5 104 5 125 570 335 448 5 461 018 North West 5 349 4 159 034 205 049 4 364 083 Northern Cape 6 114 2 730 673 259 240 2 989 913 Western Cape 7 185 8 620 220 682 572 9 302 792 South Africa 45 818 42 092 135 2 946 773 45 038 908
Farming debt
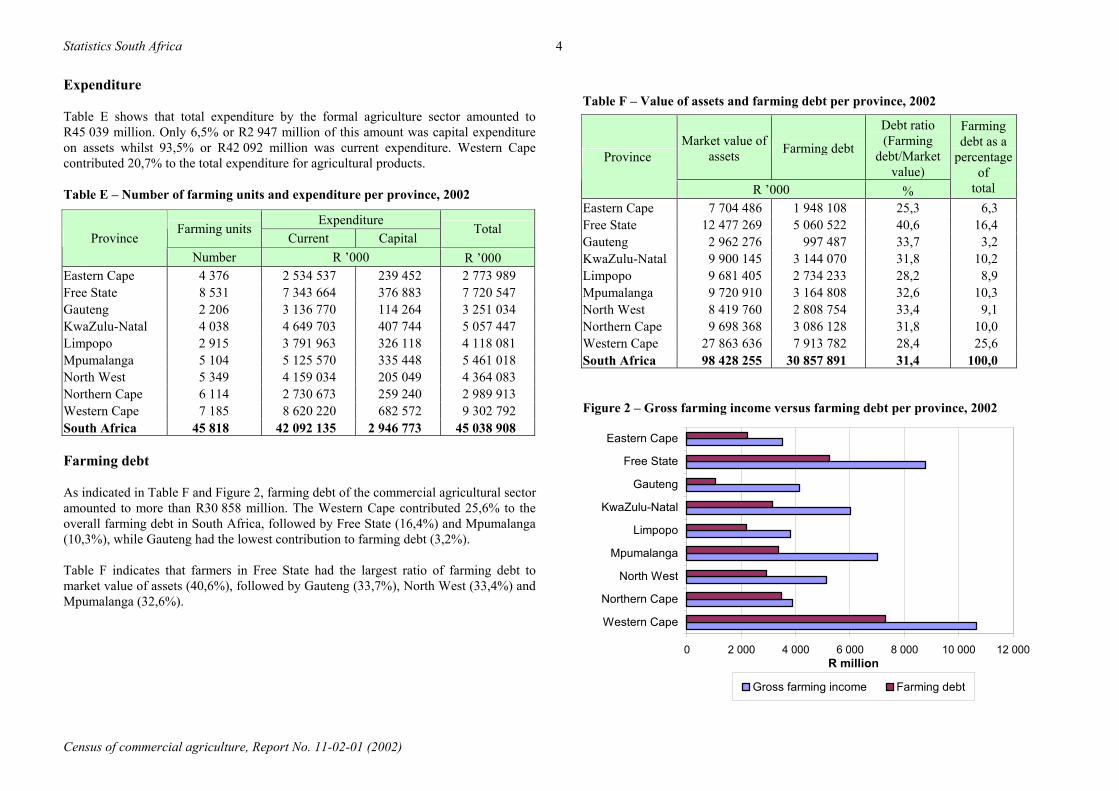
As indicated in Table F and Figure 2, farming debt of the commercial agricultural sector amounted to more than R30 858 million. The Western Cape contributed 25,6% to the overall farming debt in South Africa, followed by Free State (16,4%) and Mpumalanga (10,3%), while Gauteng had the lowest contribution to farming debt (3,2%).
Table F indicates that farmers in Free State had the largest ratio of farming debt to market value of assets (40,6%), followed by Gauteng (33,7%), North West (33,4%) and Mpumalanga (32,6%).
Table F – Value of assets and farming debt per province, 2002
Market value of assets Farming debt
Debt ratio (Farming
debt/Market value)
Province
R ’000 %
Farming debt as a
percentage of
total Eastern Cape 7 704 486 1 948 108 25,3 6,3 Free State 12 477 269 5 060 522 40,6 16,4 Gauteng 2 962 276 997 487 33,7 3,2 KwaZulu-Natal 9 900 145 3 144 070 31,8 10,2 Limpopo 9 681 405 2 734 233 28,2 8,9 Mpumalanga 9 720 910 3 164 808 32,6 10,3 North West 8 419 760 2 808 754 33,4 9,1 Northern Cape 9 698 368 3 086 128 31,8 10,0 Western Cape 27 863 636 7 913 782 28,4 25,6 South Africa 98 428 255 30 857 891 31,4 100,0
Figure 2 – Gross farming income versus farming debt per province, 2002
0 2 000 4 000 6 000 8 000 10 000 12 000
Western Cape
Northern Cape
North West
Mpumalanga
Limpopo
KwaZulu-Natal
Gauteng
Free State
Eastern Cape
R million
Gross farming income Farming debt
Statistics South Africa
5
Table G – Interest paid and type of creditors by province, 2002
Type of creditors Interest paid
Commercial banks Land Bank Co-operatives Government departments Private persons Province
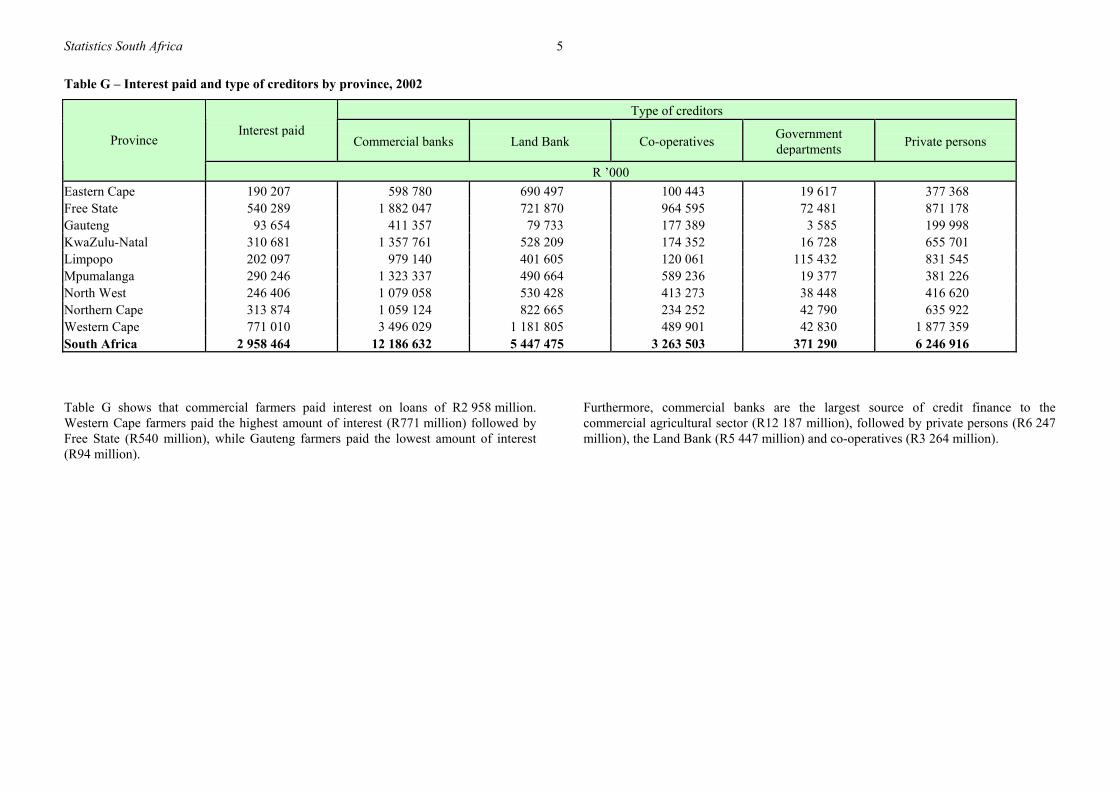
R ’000 Eastern Cape 190 207 598 780 690 497 100 443 19 617 377 368 Free State 540 289 1 882 047 721 870 964 595 72 481 871 178 Gauteng 93 654 411 357 79 733 177 389 3 585 199 998 KwaZulu-Natal 310 681 1 357 761 528 209 174 352 16 728 655 701 Limpopo 202 097 979 140 401 605 120 061 115 432 831 545 Mpumalanga 290 246 1 323 337 490 664 589 236 19 377 381 226 North West 246 406 1 079 058 530 428 413 273 38 448 416 620 Northern Cape 313 874 1 059 124 822 665 234 252 42 790 635 922 Western Cape 771 010 3 496 029 1 181 805 489 901 42 830 1 877 359 South Africa 2 958 464 12 186 632 5 447 475 3 263 503 371 290 6 246 916 Table G shows that commercial farmers paid interest on loans of R2 958 million. Western Cape farmers paid the highest amount of interest (R771 million) followed by Free State (R540 million), while Gauteng farmers paid the lowest amount of interest (R94 million).
Furthermore, commercial banks are the largest source of credit finance to the commercial agricultural sector (R12 187 million), followed by private persons (R6 247 million), the Land Bank (R5 447 million) and co-operatives (R3 264 million).
Census of commercial agriculture, Report No. 11-02-01 (2002)
6
Census of commercial agriculture, Report No. 11-02-01 (2002)
7
Part 1
Financial information
Statistics South Africa 8
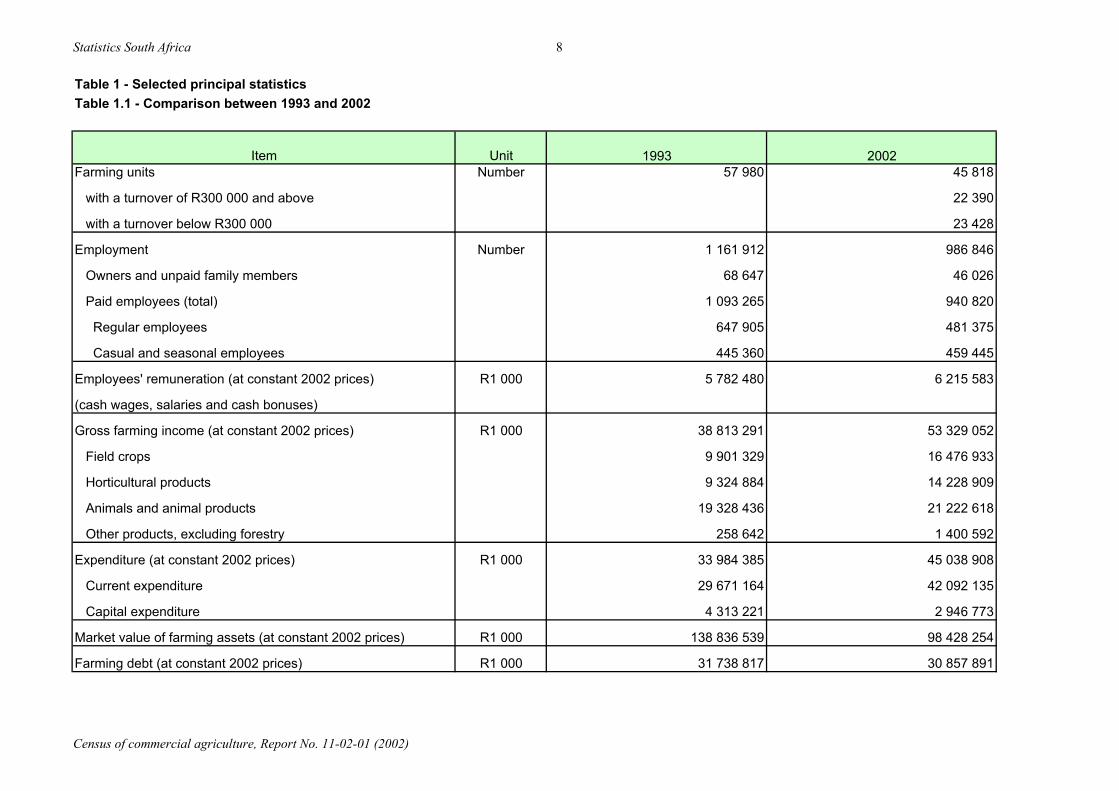
Table 1 - Selected principal statisticsTable 1.1 - Comparison between 1993 and 2002
1993 2002Farming units Number 57 980 45 818
with a turnover of R300 000 and above 22 390
with a turnover below R300 000 23 428
Employment Number 1 161 912 986 846
Owners and unpaid family members 68 647 46 026
Paid employees (total) 1 093 265 940 820
Regular employees 647 905 481 375
Casual and seasonal employees 445 360 459 445
Employees' remuneration (at constant 2002 prices) R1 000 5 782 480 6 215 583
(cash wages, salaries and cash bonuses)
Gross farming income (at constant 2002 prices) R1 000 38 813 291 53 329 052
Field crops 9 901 329 16 476 933
Horticultural products 9 324 884 14 228 909
Animals and animal products 19 328 436 21 222 618
Other products, excluding forestry 258 642 1 400 592
Expenditure (at constant 2002 prices) R1 000 33 984 385 45 038 908
Current expenditure 29 671 164 42 092 135
Capital expenditure 4 313 221 2 946 773
Market value of farming assets (at constant 2002 prices) R1 000 138 836 539 98 428 254
Farming debt (at constant 2002 prices) R1 000 31 738 817 30 857 891
Item Unit
Census of commercial agriculture, Report No. 11-02-01 (2002)
Statistics South Africa 9
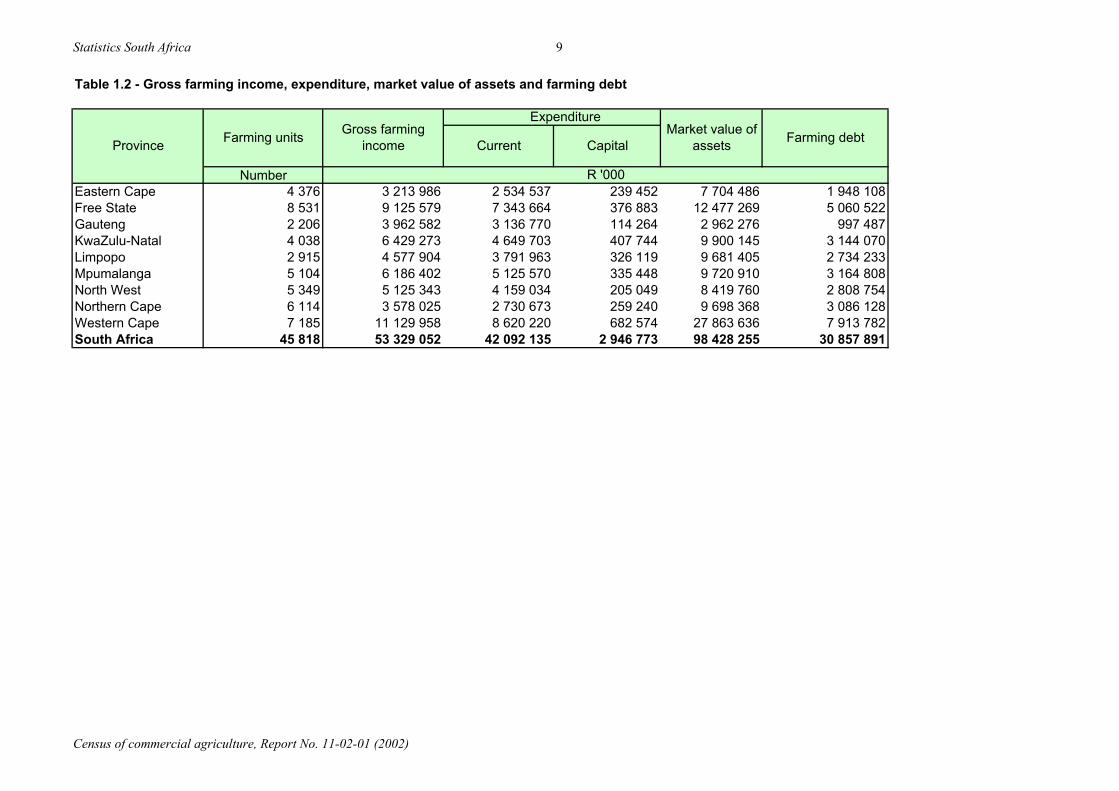
Table 1.2 - Gross farming income, expenditure, market value of assets and farming debt
NumberEastern Cape 4 376 3 213 986 2 534 537 239 452 7 704 486 1 948 108Free State 8 531 9 125 579 7 343 664 376 883 12 477 269 5 060 522Gauteng 2 206 3 962 582 3 136 770 114 264 2 962 276 997 487KwaZulu-Natal 4 038 6 429 273 4 649 703 407 744 9 900 145 3 144 070Limpopo 2 915 4 577 904 3 791 963 326 119 9 681 405 2 734 233Mpumalanga 5 104 6 186 402 5 125 570 335 448 9 720 910 3 164 808North West 5 349 5 125 343 4 159 034 205 049 8 419 760 2 808 754Northern Cape 6 114 3 578 025 2 730 673 259 240 9 698 368 3 086 128Western Cape 7 185 11 129 958 8 620 220 682 574 27 863 636 7 913 782South Africa 45 818 53 329 052 42 092 135 2 946 773 98 428 255 30 857 891
ProvinceGross farming
income
Expenditure
R '000
Farming units Current CapitalMarket value of
assets Farming debt
Census of commercial agriculture, Report No. 11-02-01 (2002)
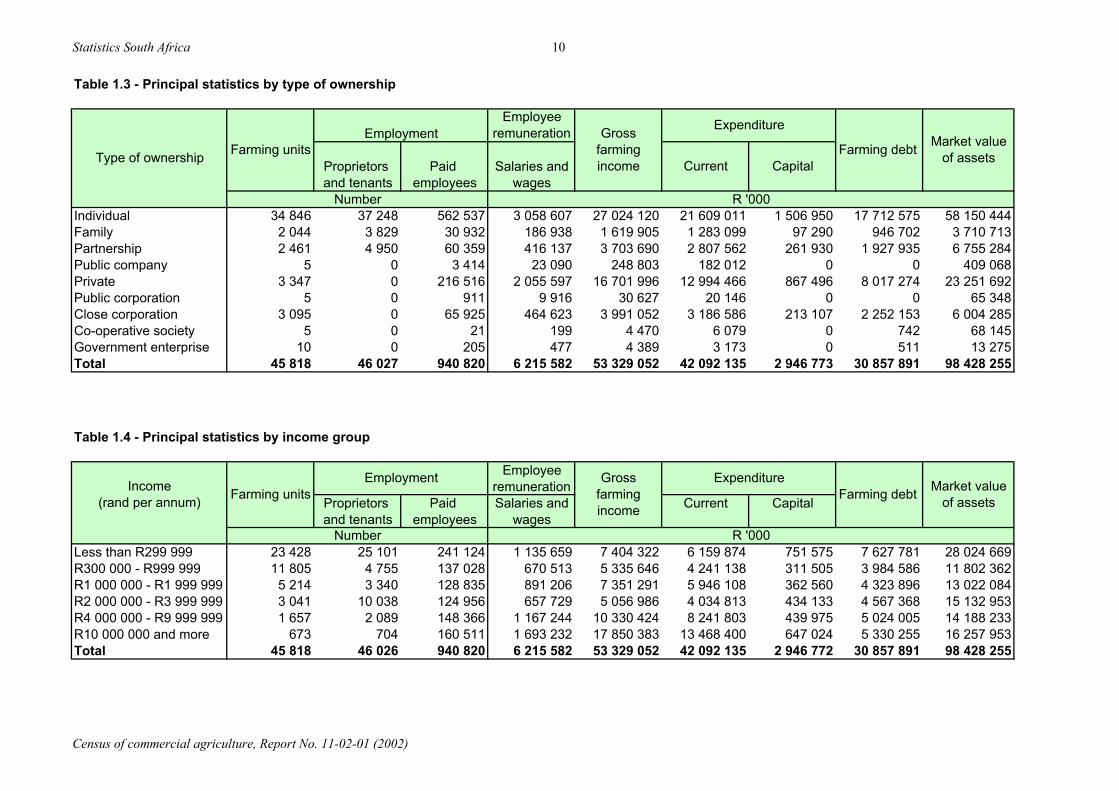
Statistics South Africa 10
Table 1.3 - Principal statistics by type of ownership
Employeeremuneration
Proprietors Paid Salaries andand tenants employees wages
Individual 34 846 37 248 562 537 3 058 607 27 024 120 21 609 011 1 506 950 17 712 575 58 150 444Family 2 044 3 829 30 932 186 938 1 619 905 1 283 099 97 290 946 702 3 710 713Partnership 2 461 4 950 60 359 416 137 3 703 690 2 807 562 261 930 1 927 935 6 755 284Public company 5 0 3 414 23 090 248 803 182 012 0 0 409 068Private 3 347 0 216 516 2 055 597 16 701 996 12 994 466 867 496 8 017 274 23 251 692Public corporation 5 0 911 9 916 30 627 20 146 0 0 65 348Close corporation 3 095 0 65 925 464 623 3 991 052 3 186 586 213 107 2 252 153 6 004 285Co-operative society 5 0 21 199 4 470 6 079 0 742 68 145Government enterprise 10 0 205 477 4 389 3 173 0 511 13 275Total 45 818 46 027 940 820 6 215 582 53 329 052 42 092 135 2 946 773 30 857 891 98 428 255
Table 1.4 - Principal statistics by income group
Employeeremuneration
Proprietors Paid Salaries and Current Capitaland tenants employees wages
Less than R299 999 23 428 25 101 241 124 1 135 659 7 404 322 6 159 874 751 575 7 627 781 28 024 669R300 000 - R999 999 11 805 4 755 137 028 670 513 5 335 646 4 241 138 311 505 3 984 586 11 802 362R1 000 000 - R1 999 999 5 214 3 340 128 835 891 206 7 351 291 5 946 108 362 560 4 323 896 13 022 084R2 000 000 - R3 999 999 3 041 10 038 124 956 657 729 5 056 986 4 034 813 434 133 4 567 368 15 132 953R4 000 000 - R9 999 999 1 657 2 089 148 366 1 167 244 10 330 424 8 241 803 439 975 5 024 005 14 188 233R10 000 000 and more 673 704 160 511 1 693 232 17 850 383 13 468 400 647 024 5 330 255 16 257 953Total 45 818 46 026 940 820 6 215 582 53 329 052 42 092 135 2 946 772 30 857 891 98 428 255
Income(rand per annum)
Grossfarmingincome
Expenditure
Type of ownership
Employment Grossfarmingincome
Expenditure
Farming units
Number
Farming units
Farming debt Market value of assetsCurrent Capital
Employment
Number
R '000
Farming debt Market value of assets
R '000
Census of commercial agriculture, Report No. 11-02-01 (2002)
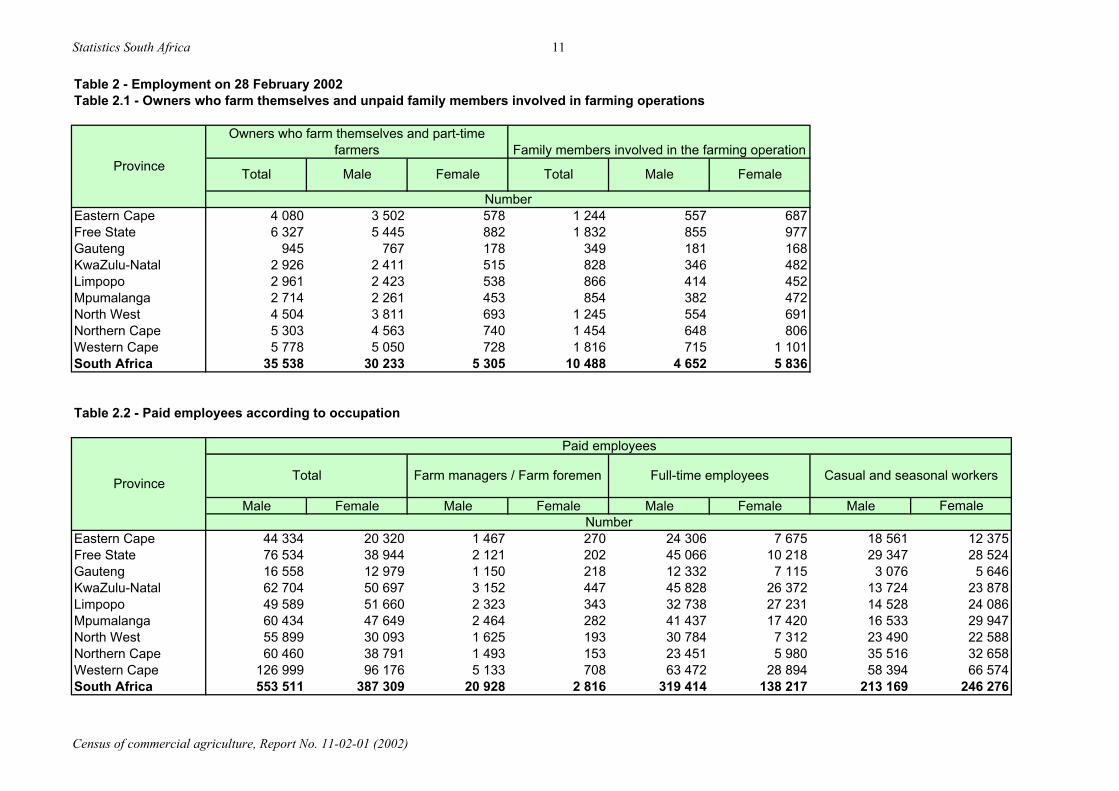
Statistics South Africa 11
Table 2 - Employment on 28 February 2002Table 2.1 - Owners who farm themselves and unpaid family members involved in farming operations
Eastern Cape 4 080 3 502 578 1 244 557 687Free State 6 327 5 445 882 1 832 855 977Gauteng 945 767 178 349 181 168KwaZulu-Natal 2 926 2 411 515 828 346 482Limpopo 2 961 2 423 538 866 414 452Mpumalanga 2 714 2 261 453 854 382 472North West 4 504 3 811 693 1 245 554 691Northern Cape 5 303 4 563 740 1 454 648 806Western Cape 5 778 5 050 728 1 816 715 1 101South Africa 35 538 30 233 5 305 10 488 4 652 5 836
Table 2.2 - Paid employees according to occupation
Male Female Male Female Male Female Male Female
Eastern Cape 44 334 20 320 1 467 270 24 306 7 675 18 561 12 375Free State 76 534 38 944 2 121 202 45 066 10 218 29 347 28 524Gauteng 16 558 12 979 1 150 218 12 332 7 115 3 076 5 646KwaZulu-Natal 62 704 50 697 3 152 447 45 828 26 372 13 724 23 878Limpopo 49 589 51 660 2 323 343 32 738 27 231 14 528 24 086Mpumalanga 60 434 47 649 2 464 282 41 437 17 420 16 533 29 947North West 55 899 30 093 1 625 193 30 784 7 312 23 490 22 588Northern Cape 60 460 38 791 1 493 153 23 451 5 980 35 516 32 658Western Cape 126 999 96 176 5 133 708 63 472 28 894 58 394 66 574South Africa 553 511 387 309 20 928 2 816 319 414 138 217 213 169 246 276
Province
Owners who farm themselves and part-time farmers
Number
Family members involved in the farming operation
Total Male Female Total Male Female
Paid employees
Number
Province Full-time employees Casual and seasonal workersFarm managers / Farm foremenTotal
Census of commercial agriculture, Report No. 11-02-01 (2002)
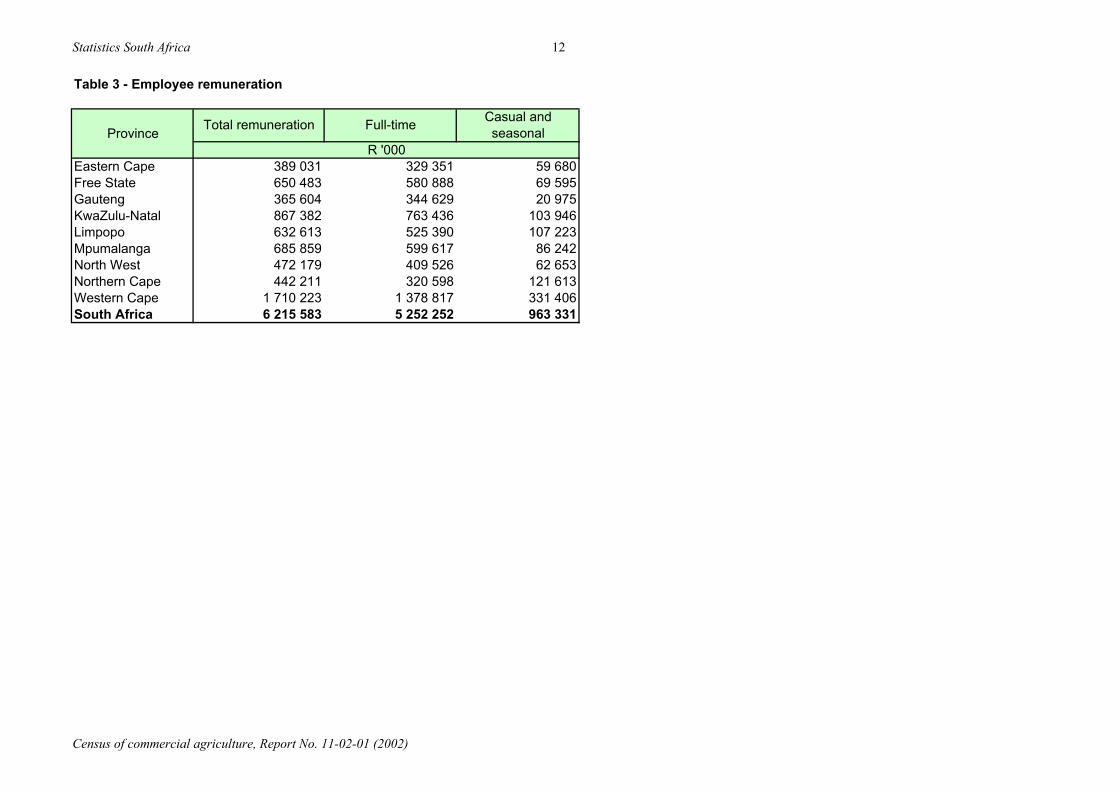
Statistics South Africa 12
Table 3 - Employee remuneration
Eastern Cape 389 031 329 351 59 680Free State 650 483 580 888 69 595Gauteng 365 604 344 629 20 975KwaZulu-Natal 867 382 763 436 103 946Limpopo 632 613 525 390 107 223Mpumalanga 685 859 599 617 86 242North West 472 179 409 526 62 653Northern Cape 442 211 320 598 121 613Western Cape 1 710 223 1 378 817 331 406South Africa 6 215 583 5 252 252 963 331
R '000Province Total remuneration Full-time Casual and
seasonal
Census of commercial agriculture, Report No. 11-02-01 (2002)
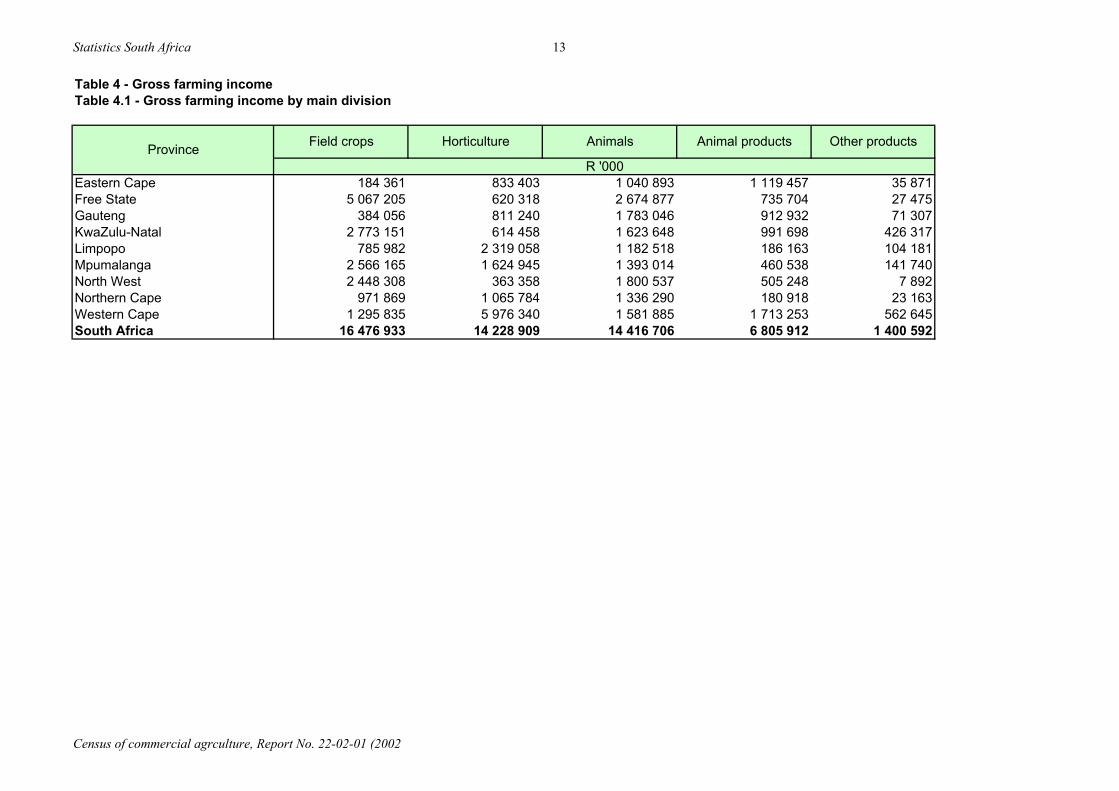
Statistics South Africa 13
Table 4 - Gross farming incomeTable 4.1 - Gross farming income by main division
Eastern Cape 35 871Free State 27 475Gauteng 71 307KwaZulu-Natal 426 317Limpopo 104 181Mpumalanga 141 740North West 7 892Northern Cape 23 163Western Cape 562 645South Africa 1 400 59214 228 909
2 319 0581 624 945
363 3581 065 784
833 403620 318811 240614 458
Animal products Other productsProvince Field crops Horticulture Animals
R '000184 361
5 067 205384 056
2 773 151785 982
2 566 1652 448 308
971 8691 295 835
16 476 9335 976 340
1 040 8932 674 8771 783 0461 623 6481 182 5181 393 0141 800 5371 336 290
186 163460 538505 248180 918
1 119 457735 704912 932991 698
1 713 2536 805 912
1 581 88514 416 706
Census of commercial agrculture, Report No. 22-02-01 (2002
Statistics South Africa 14
Table 4.2 - Gross farming income earned from field crops
Maize for grain Grain sorghum Other Wheat Barley Other
Eastern Cape 184 361 49 297 1 084 40 14 372 2 329 1 470Free State 5 067 205 3 213 902 95 065 1 296 1 058 228 1 451 8 417Gauteng 384 056 323 490 465 110 7 627 0 28KwaZulu-Natal 2 773 151 357 568 0 71 42 520 0 81Limpopo 785 982 205 850 31 539 1 075 80 460 0 17Mpumalanga 2 566 165 1 490 707 49 470 2 638 106 647 0 140North West 2 448 308 1 755 904 13 692 871 127 001 1 265 135Northern Cape 971 869 372 155 2 040 0 365 151 21 708 1 227Western Cape 1 295 835 36 621 9 350 512 983 339 99 774 30 058South Africa 16 476 933 7 805 495 202 704 6 614 2 785 345 126 526 41 573
Table 4.2 - Gross farming income earned from field crops (continued)
Sunflower seed Ground-nuts Soya beans Other Dry beans Other
Eastern Cape 215 0 550 0 887 0Free State 386 740 93 653 33 203 116 92 658 172Gauteng 9 118 0 4 476 9 24 922 1 203KwaZulu-Natal 3 255 631 44 326 1 176 10 581 70Limpopo 111 527 12 816 27 953 220 4 752 280Mpumalanga 42 173 1 212 89 572 0 94 674 1 228North West 291 871 66 694 18 727 0 15 357 101Northern Cape 4 683 60 196 523 11 2 443 2 185Western Cape 1 001 382 0 34 486 5 750 1 471South Africa 850 583 235 584 219 330 36 018 252 023 6 711
Province
Province
Oil-seeds
Summer cereals
Total
R '000
R '000
Winter cereals
Legumes
Census of commercial agricultur, Report No. 11-02-01 (2002)
Statistics South Africa 15
Table 4.2 - Gross farming income earned from field crops (concluded)
Lucerne Maize for silage Teff Other Sugar-cane Cotton Tobacco Other
Eastern Cape 70 305 3 320 570 7 606 14 692 0 11 403 6 221Free State 30 400 10 445 2 328 20 579 0 1 788 0 16 765Gauteng 615 4 774 1 926 5 292 0 0 0 0KwaZulu-Natal 2 885 9 371 266 6 629 2 276 804 11 209 0 5 709Limpopo 6 860 2 301 261 11 999 4 035 81 663 200 212 2 160Mpumalanga 7 279 5 133 1 781 17 040 337 416 72 576 246 212 268North West 19 701 37 886 2 927 13 953 0 7 479 65 368 9 376Northern Cape 96 195 1 259 467 2 991 0 30 896 331 7 407Western Cape 47 554 2 466 2 801 31 435 0 0 2 620 6 215South Africa 281 794 76 955 13 329 117 524 2 632 947 205 611 526 146 54 121
R '000
Province
Fodder crops Other field crop products
Census of commercial agricultur, Report No. 11-02-01 (2002)
Statistics South Africa 16
Table 4.3 - Gross farming income earned from horticultural products
PotatoesGreen
mealies and sweet corn
Tomatoes Onions Pumpkins CarrotsCabbageand red cabbage
Greenbeans Asparagus
Eastern Cape 833 403 90 446 3 131 43 594 5 464 3 025 7 250 17 755 2 290 0Free State 620 318 438 113 2 042 881 10 475 10 118 21 181 11 640 6 363 41 465Gauteng 811 240 20 147 4 554 11 798 1 225 3 465 37 948 17 990 8 222 0KwaZulu-Natal 614 458 137 435 4 848 23 839 1 382 2 453 12 212 34 788 3 166 169Limpopo 2 319 058 242 788 23 831 438 238 78 130 49 647 146 4 585 7 760 0Mpumalanga 1 624 945 177 249 3 397 32 901 7 878 9 059 12 220 14 112 15 439 1 415North West 363 358 49 454 5 100 18 848 38 542 6 281 33 244 13 157 9 795 0Northern Cape 1 065 784 102 042 236 2 182 34 674 8 482 90 260 1 517 357Western Cape 5 976 340 340 536 24 707 93 615 130 218 15 270 39 806 31 799 8 435 51South Africa 14 228 909 1 598 210 71 845 665 895 307 987 107 800 164 098 146 086 62 988 43 457
Table 4.3 - Gross farming income earned from horticultural products (continued)
Beetroot Broccoli Cucumbers Peppers Mushrooms Lettuce Cauliflower Cellery Sweetpotatoes Other
Eastern Cape 411 2 423 5 116 493 0 910 701 0 1 182 1 741Free State 231 0 0 0 0 0 0 0 0 2 972Gauteng 3 655 16 260 5 856 6 958 98 663 39 030 4 772 1 616 673 11 382KwaZulu-Natal 1 725 6 226 10 288 1 594 21 576 7 364 2 838 940 0 7 083Limpopo 163 0 3 026 9 606 0 126 0 0 3 345 23 913Mpumalanga 1 799 518 7 349 7 483 1 545 1 962 4 274 163 9 035 12 921North West 20 529 291 1 926 17 387 0 9 186 295 0 3 512 8 923Northern Cape 84 0 0 499 2 028 0 0 0 115 2 267Western Cape 941 9 777 14 175 11 168 17 228 33 538 8 843 17 929 5 905 26 180South Africa 29 539 35 495 47 736 55 186 141 039 92 118 21 722 20 647 23 768 97 382
R '000
Province
Vegetables
Total
R '000
Province
Vegetables
Census of commercial agriculture, Report No. 11-02-01 (2002)
Statistics South Africa 17
Table 4.3 - Gross farming income earned from horticultural products (continued)
Oranges Lemons Grapefruit Naartjes Other
Eastern Cape 302 796 54 542 5 443 5 322 16 191Free State 1 568 110 0 0 0Gauteng 938 0 0 0 317KwaZulu-Natal 62 687 3 357 32 116 521 304Limpopo 667 064 20 766 66 069 154 3 295Mpumalanga 399 100 6 870 80 290 8 415 5 765North West 15 823 618 0 2 711 211Northern Cape 13 903 0 1 829 30 53Western Cape 298 084 15 156 7 813 45 474 21 071South Africa 1 761 964 101 418 193 559 62 626 47 207
Table 4.3 - Gross farming income earned from horticultural products (continued)
Pineapples Bananas Avocados Mangos Guavas Litchies Pawpaws Other
Eastern Cape 42 313 2 408 134 0 79 0 0 601Free State 0 0 0 0 0 0 0 4 882Gauteng 0 137 0 0 0 0 0 186KwaZulu-Natal 76 034 65 160 12 415 1 002 53 964 0 73Limpopo 416 89 517 117 500 85 932 13 811 18 823 10 926 20 169Mpumalanga 45 406 489 83 063 54 266 2 250 30 750 28 147 6 174North West 0 0 159 0 1 535 0 0 1 592Northern Cape 0 0 0 593 0 0 0 3 729Western Cape 0 0 6 100 6 615 0 0 8 646South Africa 118 809 563 711 213 278 141 892 24 342 50 537 39 074 46 052
Province
R '000
R '000
Subtropical fruit
ProvinceCitrus fruit
Census of commercial agriculture, Report No. 11-02-01 (2002)
Statistics South Africa 18
Table 4.3 - Gross farming income earned from horticultural products (continued)
Apples Pears Peaches Apricot Plums Tablegrapes
Winegrapes Other
Eastern Cape 138 618 28 829 5 374 3 534 3 830 366 0 327Free State 18 374 86 6 651 25 152 7 134 3 198 10 873Gauteng 1 515 822 11 681 0 53 180 165 0KwaZulu-Natal 100 594 2 748 0 0 0 0 494Limpopo 0 0 19 989 11 1 996 16 167 1 178 481Mpumalanga 2 425 68 9 781 0 0 73 602 0 2 281North West 0 0 1 483 88 159 10 815 0 20Northern Cape 0 0 3 679 3 307 832 675 094 108 598 3 270Western Cape 848 271 343 232 243 487 61 790 203 802 1 014 884 1 614 081 22 543South Africa 1 009 304 373 631 304 873 68 755 210 824 1 798 243 1 727 220 40 290
Table 4.3 - Gross farming income earned from horticultural products (concluded)
Nuts TeaCultivatedand wild flowers
Other
Eastern Cape 224 0 7 662 28 878Free State 806 0 10 648 10 330Gauteng 868 0 329 541 170 623KwaZulu-Natal 9 696 6 007 16 115 44 092Limpopo 69 918 130 195 32 391 46 986Mpumalanga 42 196 897 46 765 14 587North West 970 0 67 840 22 864Northern Cape 6 957 7 607 512 80 958Western Cape 1 963 65 764 114 673 208 764South Africa 133 599 210 471 626 148 628 083
All other horticultural products
R '000
Province
R '000
Deciduous fruit and viticulture
Province
Census of commercial agriculture, Report No. 11-02-01 (2002)
Statistics South Africa 19
Table 4.4 - Gross farming income earned from animals and animal products
Eastern Cape 2 160 350 58 886 426 464 351 722 26 035 11 894 28 750 665 868 195 582 108 224 10 180Free State 3 410 581 67 802 1 499 212 362 513 573 1 500 43 486 433 025 146 628 1 528 3 124Gauteng 2 695 978 10 600 1 253 386 21 995 66 253 139 394 106 033 859 0 17 862KwaZulu-Natal 2 615 346 55 653 1 016 063 28 423 325 6 407 170 268 537 895 15 341 0 10 113Limpopo 1 368 681 5 851 631 707 13 125 0 328 168 685 56 618 139 0 1 032Mpumalanga 1 853 552 34 908 709 836 45 075 0 24 41 645 214 250 41 248 52 7 680North West 2 305 785 36 450 1 078 882 33 523 90 671 148 563 215 840 6 276 0 3 654Northern Cape 1 517 207 9 533 449 065 790 899 7 460 29 792 6 762 43 355 97 770 6 436 1 732Western Cape 3 295 138 86 360 172 570 355 419 9 978 5 011 123 571 838 035 128 861 18 937 7 163South Africa 21 222 618 366 043 7 237 185 2 002 694 44 525 55 880 871 124 3 110 919 632 704 135 178 62 540
Table 4.4 - Gross farming income earned from animals and animal products (concluded)
Chickens Ostriches Chicken eggs
Ostrich skins
Ostrich feathers
Eastern Cape 46 419 59 495 97 454 17 556 981 31 227 23 612Free State 674 408 958 130 254 220 0 24 426 20 925Gauteng 332 019 20 280 682 951 88 0 5 054 105 139KwaZulu-Natal 330 700 24 165 041 0 0 15 786 263 308Limpopo 266 396 1 141 101 654 1 309 541 95 286 24 872Mpumalanga 553 502 194 103 080 0 0 7 831 94 229North West 481 022 838 187 684 113 53 20 497 91 629Northern Cape 11 221 4 348 9 110 1 906 679 27 210 19 929Western Cape 379 836 442 476 309 074 72 113 21 246 6 663 317 824South Africa 3 075 522 529 753 1 786 302 93 304 23 499 233 980 961 466
Livestock sales
Dairy cattle Beef cattle Sheep Boer goats Pigs Milk and cream
Hides and skins
Livestock product sales
Wool Mohair
Other animals and
animal products
Province Angora goats
Province
Poultry sales Poultry product salesGame
farming
R '000
R '000
Total
Census of commercial agriculture, Report No. 11-02-01 (2002)
Statistics South Africa 20
Table 4.5 - Gross farming income from other products sold
Total Honey Aquaculture Forestry products Other
Eastern Cape 35 871 663 361 8 980 25 866Free State 27 475 160 121 377 26 816Gauteng 71 307 4 002 190 1 667 65 448KwaZulu-Natal 426 317 676 9 708 332 162 83 771Limpopo 104 181 44 102 55 429 48 606Mpumalanga 141 740 23 8 260 111 989 21 467North West 7 892 38 0 57 7 797Northern Cape 23 163 131 970 258 21 804Western Cape 562 645 4 862 49 864 13 815 494 105South Africa 1 400 592 10 600 69 576 524 735 795 680
Province R '000
Census of commercial agriculture, Report No. 11-02-01 (2002)
Statistics South Africa 21
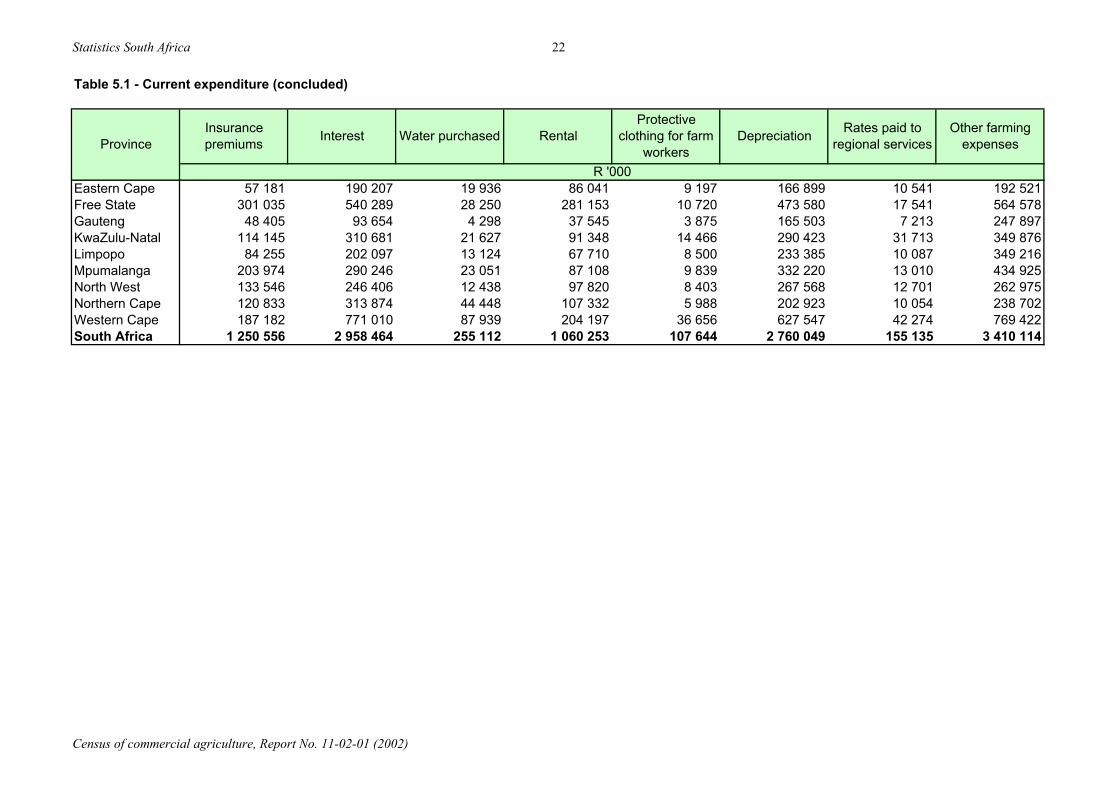
Table 5 - ExpenditureTable 5.1 - Current expenditure
Eastern Cape 2 534 537 68 261 619 971 141 348 168 172 139 886 66 206 91 829Free State 7 343 664 536 868 985 086 864 246 734 006 117 534 100 261 295 601Gauteng 3 136 770 169 481 1 342 499 149 552 181 432 171 649 62 576 80 711KwaZulu-Natal 4 649 703 137 239 1 000 792 474 558 322 255 112 965 85 295 199 741Limpopo 3 791 963 165 063 594 008 273 328 258 299 358 774 46 869 229 678Mpumalanga 5 125 570 270 058 807 939 558 687 401 236 309 093 74 760 295 096North West 4 159 034 257 987 1 062 874 402 959 403 907 73 060 72 288 173 023Northern Cape 2 730 673 131 976 213 630 240 654 208 169 183 452 44 391 84 212Western Cape 8 620 220 320 367 1 306 511 635 510 509 315 792 679 97 667 578 184South Africa 42 092 135 2 057 301 7 933 311 3 740 842 3 186 791 2 259 093 650 313 2 028 077
Table 5.1 - Current expenditure (continued)
Transport Veterinary Contractors Security Buildings, dams and fencing
All machinery, vehicles and equipment
Eastern Cape 67 736 26 643 49 661 7 606 90 130 180 680 74 263 9 621Free State 131 989 37 801 390 073 14 807 161 935 608 636 122 152 25 526Gauteng 59 912 12 032 38 269 13 360 61 577 119 060 59 831 6 438KwaZulu-Natal 262 171 31 679 146 645 32 279 113 596 365 035 124 984 16 190Limpopo 237 962 10 530 118 416 25 845 121 954 237 698 133 871 11 293Mpumalanga 198 989 17 633 136 621 22 588 139 847 342 328 141 286 15 037North West 56 028 24 916 59 929 10 744 95 386 310 284 96 479 17 313Northern Cape 124 091 9 506 49 459 3 979 106 029 178 309 94 051 14 608Western Cape 178 132 44 375 248 932 23 542 248 281 600 168 274 957 35 371South Africa 1 317 010 215 114 1 238 005 154 749 1 138 735 2 942 197 1 121 873 151 397
R '000
Electricity Licence fees
Packing material
Province
Services rendered Maintenance and repairs to
Province Total Seed and plant material
Stock and poultry feed
R '000
Remedies for combating diseases and pests in
Livestock and poultry
Field and horticultural
crops
Fertilisers Fuel
Census of commercial agriculture, Report No. 11-02-01 (2002)
Statistics South Africa 22
Table 5.1 - Current expenditure (concluded)
Eastern Cape 57 181 190 207 19 936 86 041 9 197 166 899 10 541 192 521Free State 301 035 540 289 28 250 281 153 10 720 473 580 17 541 564 578Gauteng 48 405 93 654 4 298 37 545 3 875 165 503 7 213 247 897KwaZulu-Natal 114 145 310 681 21 627 91 348 14 466 290 423 31 713 349 876Limpopo 84 255 202 097 13 124 67 710 8 500 233 385 10 087 349 216Mpumalanga 203 974 290 246 23 051 87 108 9 839 332 220 13 010 434 925North West 133 546 246 406 12 438 97 820 8 403 267 568 12 701 262 975Northern Cape 120 833 313 874 44 448 107 332 5 988 202 923 10 054 238 702Western Cape 187 182 771 010 87 939 204 197 36 656 627 547 42 274 769 422South Africa 1 250 556 2 958 464 255 112 1 060 253 107 644 2 760 049 155 135 3 410 114
Other farming expenses
Rates paid to regional servicesInterestInsurance
premiums DepreciationProtective
clothing for farm workersProvince
R '000
Water purchased Rental
Census of commercial agriculture, Report No. 11-02-01 (2002)
Statistics South Africa 23
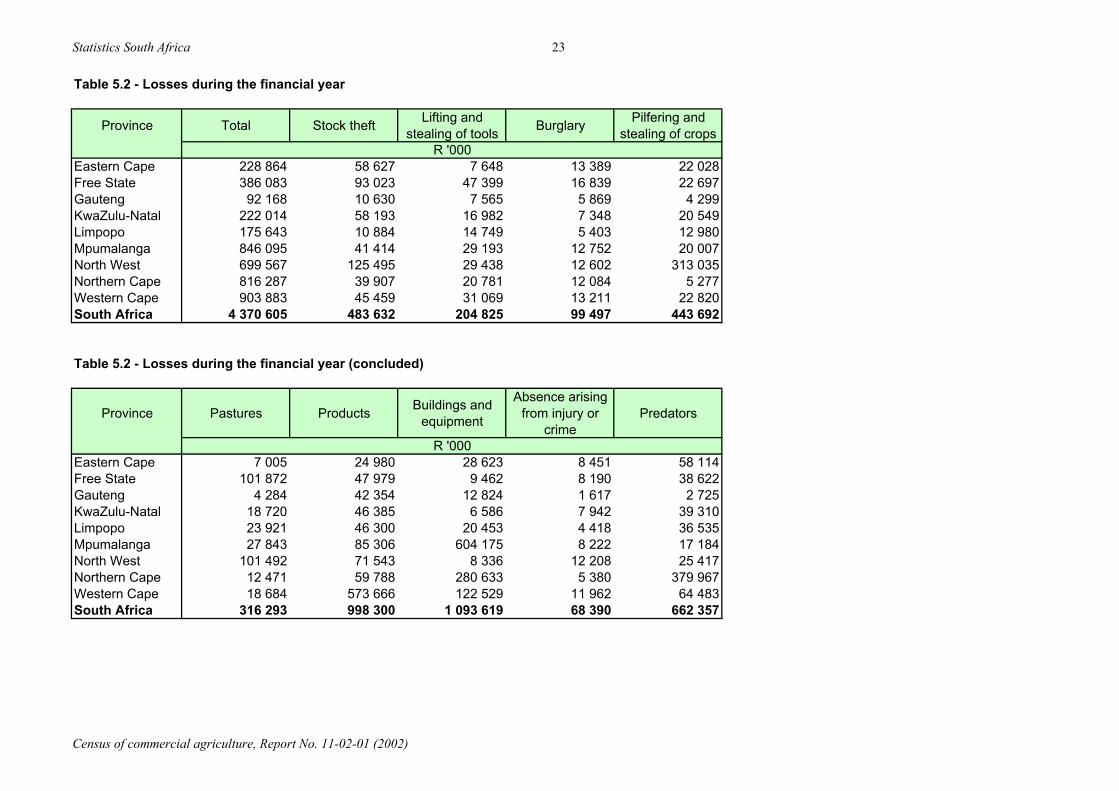
Table 5.2 - Losses during the financial year
Province Total Stock theft Lifting and stealing of tools Burglary Pilfering and
stealing of crops
Eastern Cape 228 864 58 627 7 648 13 389 22 028Free State 386 083 93 023 47 399 16 839 22 697Gauteng 92 168 10 630 7 565 5 869 4 299KwaZulu-Natal 222 014 58 193 16 982 7 348 20 549Limpopo 175 643 10 884 14 749 5 403 12 980Mpumalanga 846 095 41 414 29 193 12 752 20 007North West 699 567 125 495 29 438 12 602 313 035Northern Cape 816 287 39 907 20 781 12 084 5 277Western Cape 903 883 45 459 31 069 13 211 22 820South Africa 4 370 605 483 632 204 825 99 497 443 692
Table 5.2 - Losses during the financial year (concluded)
Province Pastures Products Buildings and equipment
Absence arising from injury or
crimePredators
Eastern Cape 7 005 24 980 28 623 8 451 58 114Free State 101 872 47 979 9 462 8 190 38 622Gauteng 4 284 42 354 12 824 1 617 2 725KwaZulu-Natal 18 720 46 385 6 586 7 942 39 310Limpopo 23 921 46 300 20 453 4 418 36 535Mpumalanga 27 843 85 306 604 175 8 222 17 184North West 101 492 71 543 8 336 12 208 25 417Northern Cape 12 471 59 788 280 633 5 380 379 967Western Cape 18 684 573 666 122 529 11 962 64 483South Africa 316 293 998 300 1 093 619 68 390 662 357
R '000
R '000
Census of commercial agriculture, Report No. 11-02-01 (2002)
Statistics South Africa 24
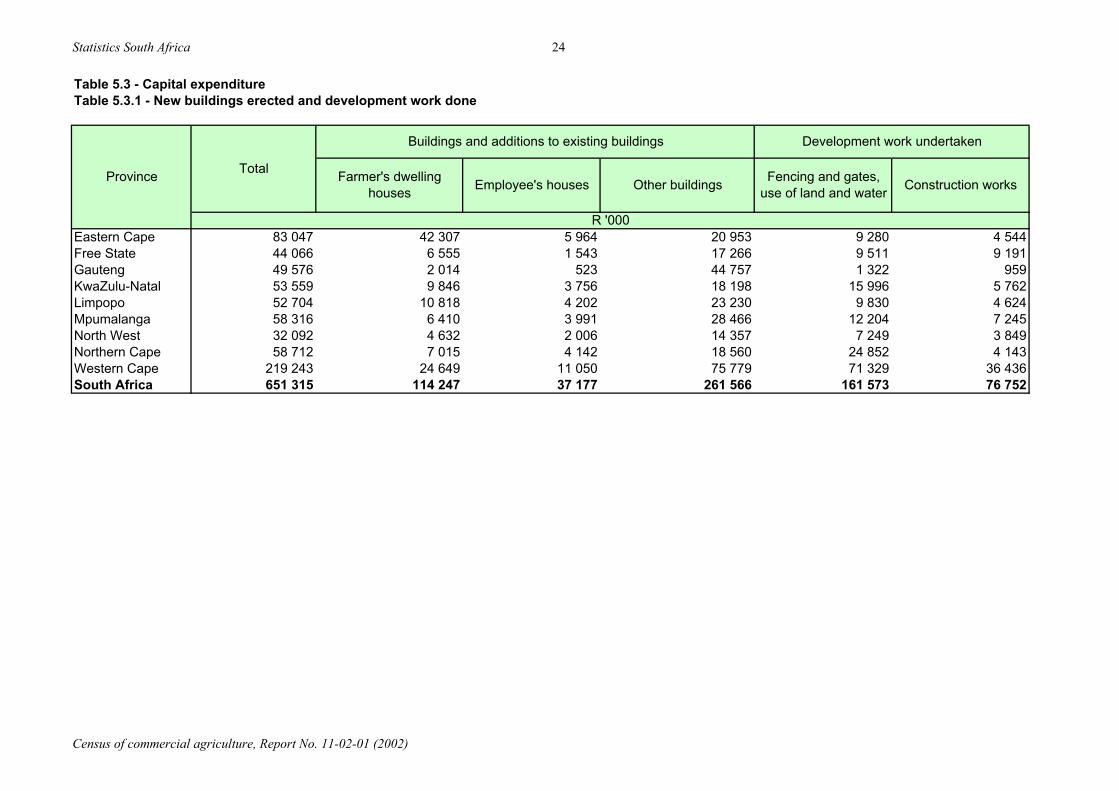
Table 5.3 - Capital expenditureTable 5.3.1 - New buildings erected and development work done
Eastern Cape 83 047 42 307 5 964 20 953 9 280 4 544Free State 44 066 6 555 1 543 17 266 9 511 9 191Gauteng 49 576 2 014 523 44 757 1 322 959KwaZulu-Natal 53 559 9 846 3 756 18 198 15 996 5 762Limpopo 52 704 10 818 4 202 23 230 9 830 4 624Mpumalanga 58 316 6 410 3 991 28 466 12 204 7 245North West 32 092 4 632 2 006 14 357 7 249 3 849Northern Cape 58 712 7 015 4 142 18 560 24 852 4 143Western Cape 219 243 24 649 11 050 75 779 71 329 36 436South Africa 651 315 114 247 37 177 261 566 161 573 76 752
Fencing and gates, use of land and water
Development work undertaken
Other buildings Construction worksProvince Farmer's dwelling houses Employee's houses
Total
R '000
Buildings and additions to existing buildings
Census of commercial agriculture, Report No. 11-02-01 (2002)
Statistics South Africa 25
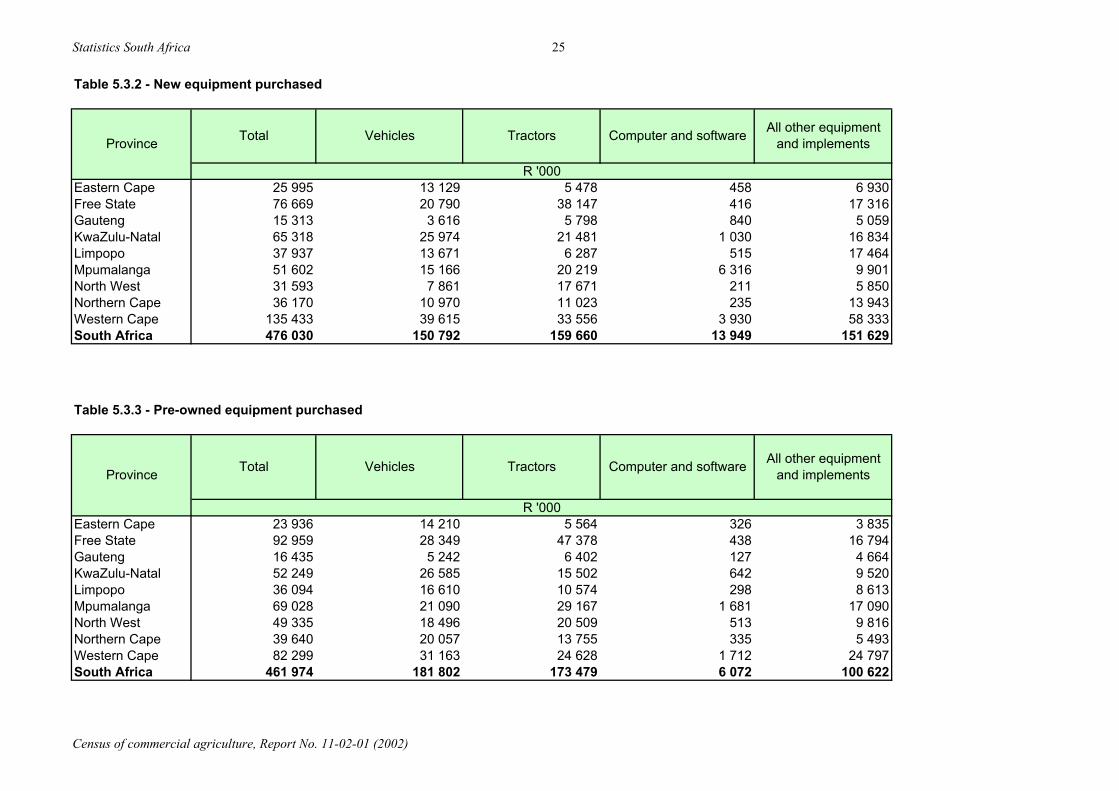
Table 5.3.2 - New equipment purchased
Eastern Cape 25 995 13 129 5 478 458 6 930Free State 76 669 20 790 38 147 416 17 316Gauteng 15 313 3 616 5 798 840 5 059KwaZulu-Natal 65 318 25 974 21 481 1 030 16 834Limpopo 37 937 13 671 6 287 515 17 464Mpumalanga 51 602 15 166 20 219 6 316 9 901North West 31 593 7 861 17 671 211 5 850Northern Cape 36 170 10 970 11 023 235 13 943Western Cape 135 433 39 615 33 556 3 930 58 333South Africa 476 030 150 792 159 660 13 949 151 629
Table 5.3.3 - Pre-owned equipment purchased
Eastern Cape 23 936 14 210 5 564 326 3 835Free State 92 959 28 349 47 378 438 16 794Gauteng 16 435 5 242 6 402 127 4 664KwaZulu-Natal 52 249 26 585 15 502 642 9 520Limpopo 36 094 16 610 10 574 298 8 613Mpumalanga 69 028 21 090 29 167 1 681 17 090North West 49 335 18 496 20 509 513 9 816Northern Cape 39 640 20 057 13 755 335 5 493Western Cape 82 299 31 163 24 628 1 712 24 797South Africa 461 974 181 802 173 479 6 072 100 622
R '000
R '000
Computer and software
Computer and software All other equipment and implements
All other equipment and implements
Province Total Vehicles Tractors
Province Total Vehicles Tractors
Census of commercial agriculture, Report No. 11-02-01 (2002)
Statistics South Africa 26
Table 6 - Market value of farming assets
Eastern Cape 7 704 486 6 493 692 1 146 543 64 251Free State 12 477 269 8 546 498 3 806 751 124 019Gauteng 2 962 276 2 094 160 816 760 51 356KwaZulu-Natal 9 900 145 8 080 421 1 724 060 95 662Limpopo 9 681 405 7 953 978 1 554 885 172 543Mpumalanga 9 720 910 7 438 657 2 177 142 105 110North West 8 419 760 6 285 246 2 040 649 93 863Northern Cape 9 698 368 8 308 667 1 328 352 61 349Western Cape 27 863 636 23 800 412 3 724 508 338 716South Africa 98 428 255 79 001 732 18 319 650 1 106 868
ProvinceOther farming
assets
R '000
Market value of assets
Farming land and fixed improvements
Vehicles,machinery,
equipment and tools
Census of commercial agriculture, Report No. 11-02-01 (2002
Statistics South Africa 27
Table 7 - Farming debt on 28 February 2002Table 7.1 - Type of obligation
Eastern Cape 1 948 108 941 164 680 163 326 781Free State 5 060 522 1 640 407 2 047 526 1 372 589Gauteng 997 487 360 168 432 153 205 166KwaZulu-Natal 3 144 070 1 385 177 1 234 117 524 776Limpopo 2 734 233 945 341 1 451 335 337 557Mpumalanga 3 164 808 1 347 930 1 080 046 736 833North West 2 808 754 1 043 747 974 615 790 392Northern Cape 3 086 128 1 378 702 1 241 058 466 368Western Cape 7 913 782 3 229 961 3 168 556 1 515 265South Africa 30 857 891 12 272 597 12 309 569 6 275 725
Table 7.2 - Type of creditors
Eastern Cape 1 948 108 690 497 19 617 100 443 598 780 161 403 377 368Free State 5 060 522 721 870 72 481 964 595 1 882 047 548 351 871 178Gauteng 997 487 79 733 3 585 177 389 411 357 125 425 199 998KwaZulu-Natal 3 144 070 528 209 16 728 174 352 1 357 761 411 319 655 701Limpopo 2 734 233 401 605 115 432 120 061 979 140 286 450 831 545Mpumalanga 3 164 808 490 664 19 377 589 236 1 323 337 360 967 381 226North West 2 808 754 530 428 38 448 413 273 1 079 058 330 928 416 620Northern Cape 3 086 128 822 665 42 790 234 252 1 059 124 291 375 635 922Western Cape 7 913 782 1 181 805 42 830 489 901 3 496 029 825 857 1 877 359South Africa 30 857 891 5 447 475 371 290 3 263 503 12 186 632 3 342 076 6 246 916
Province Total Mortgages
Province Total The Land Bank Government departments
Other loans and debts
More than 1 year 1 year and less
R '000
Commercial banks
Other financial institutions
Private persons
R '000
Co-operatives
Census of commercial agriculture, Report No. 11-02-01 (2002)
Statistics South Africa 28
Table 7.3 - Type of obligation and creditors by provinceTable 7.3.1 - Eastern Cape
The Land Bank 689 487 569 964 87 384 32 139Government departments 19 588 9 163 8 814 1 611Co-operatives 100 296 32 697 15 370 52 230Commercial banks 597 904 285 805 119 104 192 995Other financial institutions 164 017 41 712 104 640 17 664Private persons 376 816 1 820 344 853 30 142Total 1 948 108 941 161 680 165 326 782
Table 7.3.2 - Free State
The Land Bank 720 814 552 736 148 149 19 930Government departments 72 375 54 476 12 098 5 801Co-operatives 963 184 142 473 402 466 418 245Commercial banks 1 879 294 813 899 388 073 677 322Other financial institutions 552 467 72 612 392 570 87 285Private persons 869 904 4 046 701 957 163 900Total 5 058 038 1 640 242 2 045 314 1 372 483
Creditor Total MortgagesOther loans and debts
More than 1 year 1 year and less(short-term)
R '000
Creditor Total MortgagesOther loans and debts
More than 1 year 1 year and less(short-term)
R '000
Census of commercial agriculture, Report No. 11-02-01 (2002)
Statistics South Africa 29
Table 7.3.3 - Gauteng
The Land Bank 79 616 73 323 4 899 1 394Government departments 3 580 700 2 517 363Co-operatives 177 130 46 336 96 190 34 604Commercial banks 410 755 204 740 63 125 142 890Other financial institutions 126 369 28 243 87 264 10 863Private persons 199 705 6 495 178 157 15 053Total 997 156 359 837 432 153 205 166
Table 7.3.4 - KwaZulu-Natal
The Land Bank 527 436 452 851 65 367 9 219Government departments 16 704 7 899 5 565 3 240Co-operatives 174 097 45 138 47 107 81 852Commercial banks 1 355 775 753 126 257 187 345 462Other financial institutions 406 600 109 965 263 265 33 370Private persons 654 742 10 470 592 635 51 636Total 3 135 353 1 379 449 1 231 126 524 779
Creditor Total MortgagesOther loans and debts
More than 1 year 1 year and less(short-term)
R '000
Creditor MortgagesOther loans and debts
More than 1 year 1 year and less(short-term)
R '000
Total
Census of commercial agriculture, Report No. 11-02-01 (2002)
Statistics South Africa 30
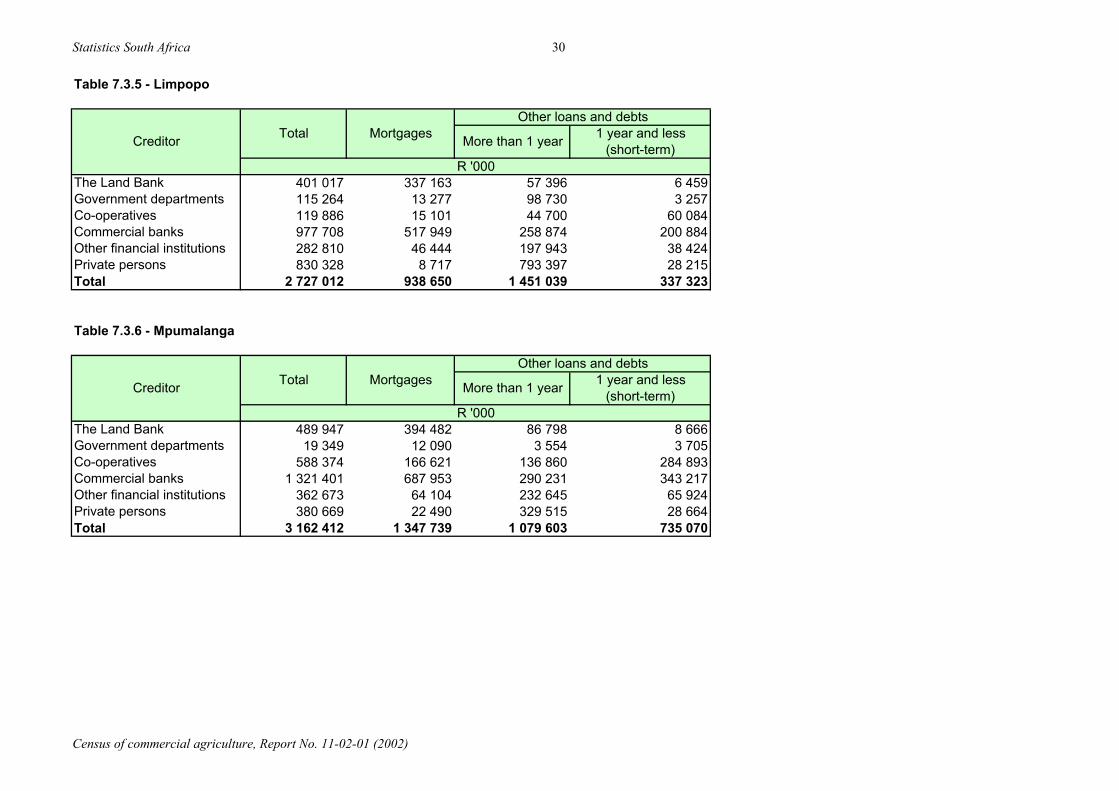
Table 7.3.5 - Limpopo
The Land Bank 401 017 337 163 57 396 6 459Government departments 115 264 13 277 98 730 3 257Co-operatives 119 886 15 101 44 700 60 084Commercial banks 977 708 517 949 258 874 200 884Other financial institutions 282 810 46 444 197 943 38 424Private persons 830 328 8 717 793 397 28 215Total 2 727 012 938 650 1 451 039 337 323
Table 7.3.6 - Mpumalanga
The Land Bank 489 947 394 482 86 798 8 666Government departments 19 349 12 090 3 554 3 705Co-operatives 588 374 166 621 136 860 284 893Commercial banks 1 321 401 687 953 290 231 343 217Other financial institutions 362 673 64 104 232 645 65 924Private persons 380 669 22 490 329 515 28 664Total 3 162 412 1 347 739 1 079 603 735 070
Creditor Total MortgagesOther loans and debts
More than 1 year 1 year and less(short-term)
R '000
Creditor Total MortgagesOther loans and debts
More than 1 year 1 year and less(short-term)
R '000
Census of commercial agriculture, Report No. 11-02-01 (2002)

Statistics South Africa 31
Table 7.3.7 - North West
The Land Bank 529 652 404 314 111 029 14 308Government departments 38 392 19 128 10 297 8 967Co-operatives 412 668 87 830 80 845 243 993Commercial banks 1 077 479 461 138 220 214 396 127Other financial institutions 320 723 63 336 224 335 33 052Private persons 416 011 5 760 317 793 92 458Total 2 794 925 1 041 506 964 514 788 905
Table 7.3.8 - Northern Cape
The Land Bank 821 461 724 521 91 384 5 557Government departments 42 728 19 533 16 462 6 733Co-operatives 233 910 55 745 70 857 107 308Commercial banks 1 057 575 514 317 248 824 294 433Other financial institutions 291 070 50 422 214 537 26 111Private persons 634 992 11 601 597 250 26 141Total 3 081 735 1 376 140 1 239 313 466 282
Creditor Total MortgagesOther loans and debts
More than 1 year 1 year and less(short-term)
R '000
Creditor Total MortgagesOther loans and debts
More than 1 year 1 year and less(short-term)
R '000
Census of commercial agriculture, Report No. 11-02-01 (2002)
Statistics South Africa 32
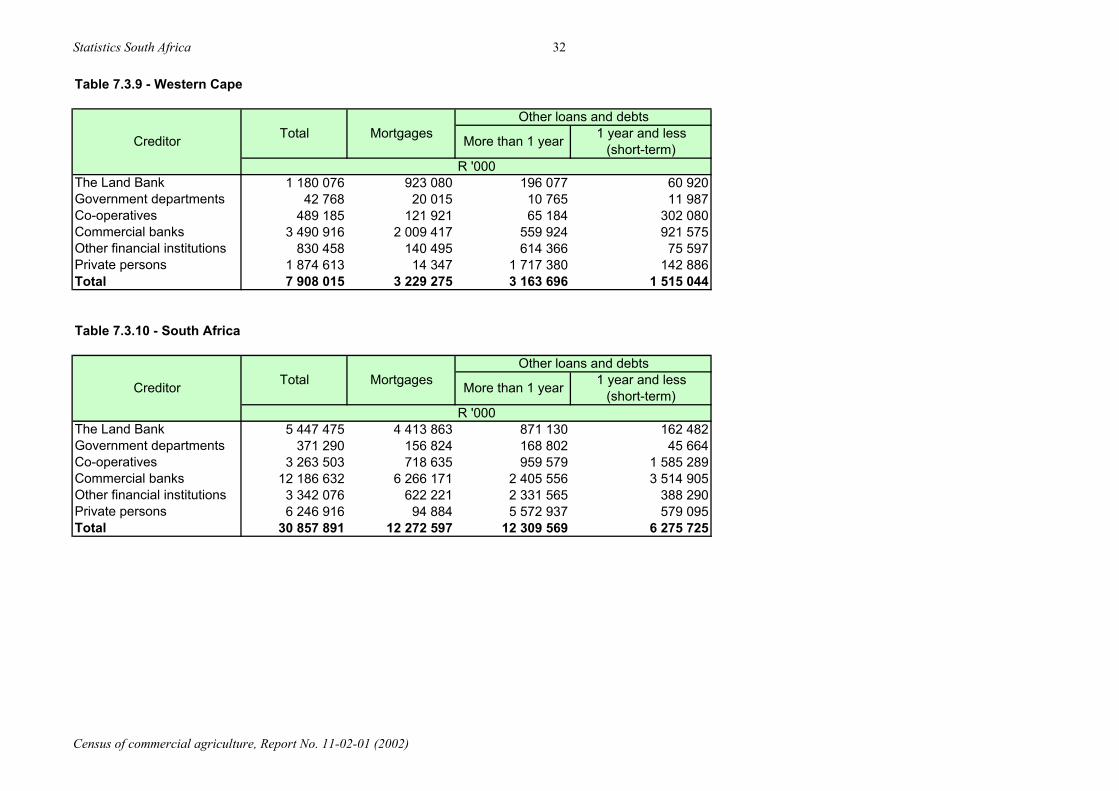
Table 7.3.9 - Western Cape
The Land Bank 1 180 076 923 080 196 077 60 920Government departments 42 768 20 015 10 765 11 987Co-operatives 489 185 121 921 65 184 302 080Commercial banks 3 490 916 2 009 417 559 924 921 575Other financial institutions 830 458 140 495 614 366 75 597Private persons 1 874 613 14 347 1 717 380 142 886Total 7 908 015 3 229 275 3 163 696 1 515 044
Table 7.3.10 - South Africa
The Land Bank 5 447 475 4 413 863 871 130 162 482Government departments 371 290 156 824 168 802 45 664Co-operatives 3 263 503 718 635 959 579 1 585 289Commercial banks 12 186 632 6 266 171 2 405 556 3 514 905Other financial institutions 3 342 076 622 221 2 331 565 388 290Private persons 6 246 916 94 884 5 572 937 579 095Total 30 857 891 12 272 597 12 309 569 6 275 725
R '000
Creditor Total MortgagesOther loans and debts
More than 1 year 1 year and less (short-term)
Creditor Total MortgagesOther loans and debts
More than 1 year 1 year and less (short-term)
R '000
Census of commercial agriculture, Report No. 11-02-01 (2002)
Census of commercial agriculture, Report No. 11-02-01 (2002)
33
Part 2
Area and production information of those farmers who responded
Statistics South Africa 34
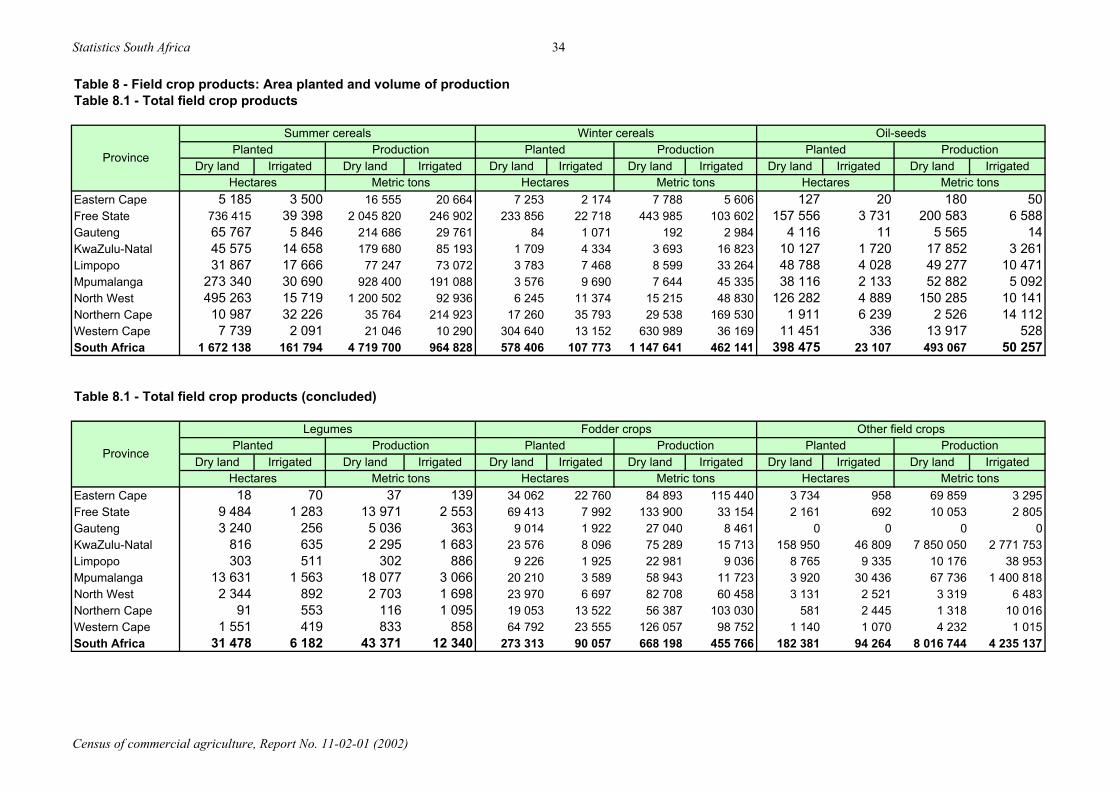
Table 8 - Field crop products: Area planted and volume of productionTable 8.1 - Total field crop products
Dry land Irrigated Dry land Irrigated Dry land Irrigated Dry land Irrigated Dry land Irrigated Dry land Irrigated
Eastern Cape 5 185 3 500 16 555 20 664 7 253 2 174 7 788 5 606 127 20 180 50Free State 736 415 39 398 2 045 820 246 902 233 856 22 718 443 985 103 602 157 556 3 731 200 583 6 588Gauteng 65 767 5 846 214 686 29 761 84 1 071 192 2 984 4 116 11 5 565 14KwaZulu-Natal 45 575 14 658 179 680 85 193 1 709 4 334 3 693 16 823 10 127 1 720 17 852 3 261Limpopo 31 867 17 666 77 247 73 072 3 783 7 468 8 599 33 264 48 788 4 028 49 277 10 471Mpumalanga 273 340 30 690 928 400 191 088 3 576 9 690 7 644 45 335 38 116 2 133 52 882 5 092North West 495 263 15 719 1 200 502 92 936 6 245 11 374 15 215 48 830 126 282 4 889 150 285 10 141Northern Cape 10 987 32 226 35 764 214 923 17 260 35 793 29 538 169 530 1 911 6 239 2 526 14 112Western Cape 7 739 2 091 21 046 10 290 304 640 13 152 630 989 36 169 11 451 336 13 917 528South Africa 1 672 138 161 794 4 719 700 964 828 578 406 107 773 1 147 641 462 141 398 475 23 107 493 067 50 257
Table 8.1 - Total field crop products (concluded)
Dry land Irrigated Dry land Irrigated Dry land Irrigated Dry land Irrigated Dry land Irrigated Dry land Irrigated
Eastern Cape 18 70 37 139 34 062 22 760 84 893 115 440 3 734 958 69 859 3 295Free State 9 484 1 283 13 971 2 553 69 413 7 992 133 900 33 154 2 161 692 10 053 2 805Gauteng 3 240 256 5 036 363 9 014 1 922 27 040 8 461 0 0 0 0KwaZulu-Natal 816 635 2 295 1 683 23 576 8 096 75 289 15 713 158 950 46 809 7 850 050 2 771 753Limpopo 303 511 302 886 9 226 1 925 22 981 9 036 8 765 9 335 10 176 38 953Mpumalanga 13 631 1 563 18 077 3 066 20 210 3 589 58 943 11 723 3 920 30 436 67 736 1 400 818North West 2 344 892 2 703 1 698 23 970 6 697 82 708 60 458 3 131 2 521 3 319 6 483Northern Cape 91 553 116 1 095 19 053 13 522 56 387 103 030 581 2 445 1 318 10 016Western Cape 1 551 419 833 858 64 792 23 555 126 057 98 752 1 140 1 070 4 232 1 015South Africa 31 478 6 182 43 371 12 340 273 313 90 057 668 198 455 766 182 381 94 264 8 016 744 4 235 137
Hectares Metric tons
Legumes Fodder crops
Hectares Hectares Metric tons
Planted Production Planted Production
Planted ProductionWinter cereals
PlantedOil-seeds
ProductionProvince
Summer cerealsPlanted Production
Metric tons
Province
Other field cropsPlanted Production
Hectares Metric tonsHectares Metric tons Hectares Metric tons
Census of commercial agriculture, Report No. 11-02-01 (2002)
Statistics South Africa 35
Table 8.2 - Summer cereals
Dry land Irrigated Dry land Irrigated Dry land Irrigated Dry land Irrigated Dry land Irrigated Dry land Irrigated
Eastern Cape 5 016 3 448 15 722 20 528 152 43 801 131 17 10 33 4Free State 708 057 38 515 1 987 580 243 151 27 848 860 57 308 3 751 511 24 932 0Gauteng 65 424 5 755 213 693 29 483 306 0 985 0 37 91 8 277KwaZulu-Natal 44 912 13 614 176 711 78 156 28 0 73 0 635 1 044 2 896 7 037Limpopo 21 951 15 989 60 559 68 817 9 416 46 16 202 110 500 1 631 486 4 145Mpumalanga 261 889 29 899 896 156 187 682 11 010 530 31 505 1 888 441 261 739 1 517North West 491 441 14 669 1 191 158 87 658 3 487 233 9 249 1 991 335 817 96 3 287Northern Cape 10 931 31 448 35 707 212 710 57 701 57 1 928 0 77 0 286Western Cape 5 928 1 562 17 331 9 213 1 394 373 3 597 974 417 156 118 104South Africa 1 615 547 154 898 4 594 616 937 397 53 698 2 784 119 776 10 774 2 893 4 111 5 308 16 657
Table 8.3 - Winter cereals
Dry land Irrigated Dry land Irrigated Dry land Irrigated Dry land Irrigated Dry land Irrigated Dry land Irrigated
Eastern Cape 3 099 1 051 6 309 3 583 199 722 506 1 833 3 955 401 973 190Free State 221 150 22 036 436 266 102 143 342 137 792 805 12 364 545 6 927 654Gauteng 50 1 065 122 2 967 0 0 0 0 34 6 70 17KwaZulu-Natal 1 647 4 309 3 558 16 823 10 0 25 0 52 25 110 0Limpopo 3 783 7 457 8 599 33 252 0 0 0 0 0 11 0 13Mpumalanga 3 370 9 667 7 589 45 270 0 0 0 0 207 23 55 65North West 6 150 11 079 15 032 47 911 79 203 156 753 16 92 26 166Northern Cape 12 855 32 769 25 690 156 716 2 349 2 905 2 870 12 717 2 056 120 978 97Western Cape 238 614 10 743 527 072 30 289 36 771 1 260 75 809 3 241 29 255 1 149 28 107 2 639South Africa 490 718 100 176 1 030 237 438 953 39 750 5 225 80 158 19 349 47 939 2 372 37 246 3 840
OtherPlanted Production
Hectares Metric tons
Hectares Metric tons
Other
Hectares
Wheat
Hectares Metric tons
Production Planted Production
Maize for grain
Production PlantedBarley
ProductionProvince
Grain sorghum
Hectares Metric tons Hectares Metric tons
Planted Production Planted
Province Planted
Metric tons
Census of commercial agriculture, Report No. 11-02-01 (2002)

Statistics South Africa 36
Table 8.4 - Oil-seeds
Dry land Irrigated Dry land Irrigated Dry land Irrigated Dry land Irrigated
Eastern Cape 23 20 36 50 0 0 0 0Free State 126 604 2 033 158 868 3 236 20 146 1 375 27 390 2 871Gauteng 2 945 0 3 854 0 0 0 0 0KwaZulu-Natal 744 14 1 347 18 188 10 194 29Limpopo 44 951 328 44 085 625 2 255 738 2 590 1 500Mpumalanga 11 716 1 019 14 851 2 546 243 77 254 196North West 106 037 791 130 800 1 055 19 662 1 269 18 517 2 010Northern Cape 508 506 665 802 1 403 5 696 1 862 13 242Western Cape 213 66 268 86 90 0 117 0South Africa 293 742 4 777 354 774 8 418 43 988 9 165 50 924 19 847
Table 8.4 - Oil-seeds (concluded)
Dry land Irrigated Dry land Irrigated Dry land Irrigated Dry land Irrigated
Eastern Cape 104 0 145 0 0 0 0 0Free State 10 776 322 14 287 481 30 0 38 0Gauteng 1 161 8 1 694 12 10 3 17 2KwaZulu-Natal 9 109 1 637 16 080 3 106 86 60 231 108Limpopo 1 543 2 963 2 549 8 347 38 0 53 0Mpumalanga 26 157 1 037 37 777 2 350 0 0 0 0North West 583 2 829 967 7 076 0 0 0 0Northern Cape 0 30 0 60 0 7 0 8Western Cape 0 0 0 0 11 148 270 13 532 442South Africa 49 433 8 825 73 499 21 432 11 312 340 13 871 560
Province
Metric tons
Production
Hectares
Planted Production
Metric tons
Irrigated
Soya beansPlanted Production
Hectares Metric tons
Other
Planted Production
Hectares
Ground nuts
Province
Hectares
PlantedSunflower seed
Census of commercial agriculture, Report No. 11-02-01 (2002)
Statistics South Africa 37
Table 8.5 - Legumes
Dry land Irrigated Dry land Irrigated Dry land Irrigated Dry land Irrigated
Eastern Cape 18 70 37 139 0 0 0 0Free State 9 418 1 257 13 923 2 498 66 26 48 55Gauteng 2 965 256 4 536 363 275 0 501 0KwaZulu-Natal 816 611 2 295 1 659 0 24 0 24Limpopo 181 511 235 883 122 0 67 3Mpumalanga 13 555 1 444 17 787 2 693 76 119 290 373North West 2 289 880 2 643 1 667 55 12 60 32Northern Cape 78 172 102 489 14 382 14 605Western Cape 183 415 121 854 1 368 4 712 4South Africa 29 503 5 615 41 679 11 243 1 976 567 1 692 1 096
Table 8.6 - Fodder crops
Dry land Irrigated Dry land Irrigated Dry land Irrigated Dry land Irrigated
Eastern Cape 16 562 17 065 62 594 95 848 1 822 867 11 440 14 930Free State 10 283 4 780 39 364 25 544 21 258 441 56 820 5 466Gauteng 95 212 385 801 4 536 866 19 532 5 665KwaZulu-Natal 1 410 200 5 865 969 9 750 923 48 782 7 339Limpopo 1 244 797 5 052 6 246 1 925 241 6 031 1 226Mpumalanga 1 509 885 5 475 6 773 6 257 987 31 895 2 880North West 3 098 2 226 12 609 19 809 9 705 1 340 54 556 32 560Northern Cape 11 065 12 349 49 380 98 911 820 505 2 593 3 167Western Cape 28 714 16 091 100 044 85 074 2 682 1 296 4 473 7 775South Africa 73 980 54 605 280 767 339 975 58 754 7 466 236 120 81 008
Planted
Hectares
Production
Hectares Metric tons
Dry beans
Metric tons
Hectares Metric tons
Planted ProductionOther
Province
Lucerne Maize for silagePlanted Production
Hectares Metric tons
Province Planted Production
Census of commercial agriculture, Report No. 11-02-01 (2002)
Statistics South Africa 38
Table 8.6 - Fodder crops (concluded)
Dry land Irrigated Dry land Irrigated Dry land Irrigated Dry land Irrigated
Eastern Cape 940 81 2 819 414 14 738 4 748 8 039 4 248Free State 5 592 17 18 945 69 32 281 2 753 18 772 2 076Gauteng 1 563 35 4 849 75 2 820 809 2 275 1 920KwaZulu-Natal 1 139 124 3 844 428 11 277 6 849 16 799 6 977Limpopo 248 143 812 304 5 810 745 11 086 1 260Mpumalanga 2 880 62 8 448 194 9 563 1 655 13 125 1 876North West 1 620 245 4 909 1 655 9 546 2 886 10 634 6 434Northern Cape 96 105 355 360 7 073 563 4 060 592Western Cape 940 597 3 932 2 283 32 456 5 571 17 611 3 620South Africa 15 017 1 408 48 912 5 782 125 563 26 578 102 402 29 002
Table 8.7 - Other field crops
Dry land Irrigated Dry land Irrigated Dry land Irrigated Dry land Irrigated
Eastern Cape 3 000 0 65 000 0 0 0 0 0Free State 0 0 0 0 39 159 63 334Gauteng 0 0 0 0 0 0 0 0KwaZulu-Natal 156 075 45 961 7 838 128 2 770 129 1 010 743 1 488 1 576Limpopo 0 225 0 11 858 6 889 3 442 6 202 12 340Mpumalanga 1 653 17 251 63 043 1 361 561 739 4 972 1 452 15 487North West 0 0 0 0 1 634 148 1 594 359Northern Cape 0 0 0 0 191 2 139 305 8 118Western Cape 0 0 0 0 0 0 0 0South Africa 160 728 63 437 7 966 171 4 143 547 10 501 11 604 11 103 38 215
Province
Metric tons
Production
Planted
Hectares
Other
Hectares Metric tons
Metric tons
ProductionSugar-cane Cotton
Planted ProductionTeff
Province Planted Production
Hectares Metric tons Hectares
Planted
Census of commercial agriculture, Report No. 11-02-01 (2002)
Statistics South Africa 39
Table 8.7 - Other field crops (concluded)
Dry land Irrigated Dry land Irrigated Dry land Irrigated Dry land Irrigated
Eastern Cape 0 715 0 2 166 734 243 4 859 1 129Free State 0 0 0 0 2 123 533 9 991 2 471Gauteng 0 0 0 0 0 0 0 0KwaZulu-Natal 0 0 0 0 1 865 105 10 434 48Limpopo 1 663 5 596 3 245 14 564 213 72 730 191Mpumalanga 1 148 8 212 3 151 23 770 380 0 90 0North West 0 1 904 0 4 912 1 497 468 1 726 1 212Northern Cape 73 0 132 0 317 306 881 1 898Western Cape 77 237 205 506 1 063 833 4 027 509South Africa 2 961 16 665 6 733 45 918 8 191 2 559 32 737 7 456
Province
HectaresMetric tons
Production
Metric tonsHectares
Planted Planted ProductionOther field cropsTobacco
Census of commercial agriculture, Report No. 11-02-01 (2002)
Statistics South Africa 40
Table 9 - Horticulture: Area planted and volume of productionTable 9.1 - Total horticultural products
ProvinceVegetables Citrus Subtropical Deciduous
Planted Production Planted Production Planted Production Planted ProductionHectares Metric tons Hectares Metric tons Hectares Metric tons Hectares Metric tons
Eastern Cape 18 121 370 180 14 263 300 069 4 570 70 695 3 876 106 588Free State 18 354 360 860 114 1 619 240 3 890 827 13 896Gauteng 5 338 134 515 62 936 14 91 593 7 814KwaZulu-Natal 8 897 213 461 3 412 72 368 4 698 76 522 198 2 455Limpopo 36 996 929 962 20 374 487 839 14 824 142 197 550 9 594Mpumalanga 18 902 520 213 13 139 317 225 15 927 264 729 1 541 23 207North West 7 376 165 849 1 707 27 661 173 1 974 362 4 070Northern Cape 6 554 147 608 721 11 843 252 4 010 10 922 192 848Western Cape 29 474 712 035 10 893 257 679 721 20 047 109 194 1 920 003South Africa 150 011 3 554 683 64 685 1 477 239 41 418 584 155 128 064 2 280 475
Table 9.2 - Vegetables
ProvincePotatoes Tomatoes Cauliflower Cabbage
Planted Production Planted Production Planted Production Planted ProductionHectares Metric tons Hectares Metric tons Hectares Metric tons Hectares Metric tons
Eastern Cape 2 718 54 211 553 19 898 40 544 825 26 181Free State 13 392 308 816 25 405 0 0 290 8 855Gauteng 402 10 042 76 4 997 227 4 520 697 27 967KwaZulu-Natal 2 841 85 673 276 11 188 132 2 188 1 178 44 607Limpopo 5 180 139 169 4 970 224 659 0 0 289 7 486Mpumalanga 3 885 106 629 488 19 573 283 3 705 647 18 484North West 985 29 474 222 8 622 14 190 437 18 445Northern Cape 3 938 101 305 28 992 0 0 32 835Western Cape 8 308 220 137 1 294 48 523 254 5 615 1 179 36 311South Africa 41 649 1 055 455 7 930 338 855 949 16 762 5 575 189 170
Census of commercial agriculture, Report No. 11-02-01 (2002)
Statistics South Africa 41
Table 9.2 - Vegetables (continued)
Planted Production Planted Production Planted Production Planted ProductionHectares Metric tons Hectares Metric tons Hectares Metric tons Hectares Metric tons
Eastern Cape 164 3 227 28 212 263 5 659 57 914Free State 338 8 542 12 146 375 12 275 0 0Gauteng 26 540 163 3 739 867 27 524 39 790KwaZulu-Natal 31 853 71 1 179 264 7 791 0 0Limpopo 1 807 44 911 12 153 11 136 169 3 551Mpumalanga 157 3 806 111 1 569 365 10 671 305 5 860North West 831 24 713 503 12 680 606 20 138 120 3 990Northern Cape 598 21 698 5 49 7 65 8 143Western Cape 2 129 63 321 66 793 909 25 918 264 5 390South Africa 6 080 171 611 970 20 520 3 667 110 176 961 20 637
Table 9.2 - Vegetables (concluded)
Planted Production Planted Production Planted Production Planted ProductionHectares Metric tons Hectares Metric tons Hectares Metric tons Hectares Metric tons
Eastern Cape 139 1 093 270 3 145 0 0 13 064 255 096Free State 322 2 243 1 004 9 145 0 0 2 597 10 434Gauteng 388 3 850 159 3 030 0 0 2 294 47 517KwaZulu-Natal 161 1 385 246 2 595 22 64 3 678 55 938Limpopo 411 2 321 3 137 46 498 0 0 21 011 461 078Mpumalanga 591 5 620 511 7 059 536 2 111 11 024 335 128North West 265 2 682 479 6 235 0 0 2 915 38 681Northern Cape 61 544 848 7 464 53 126 976 14 389Western Cape 421 2 856 1 148 14 695 0 0 13 503 288 478South Africa 2 758 22 594 7 801 99 864 611 2 301 71 061 1 506 738
Carrots
ProvinceGreen peas Other
Sweet potatoes
Green beans Pumpkins
OnionsProvince
Beetroot
Census of commercial agriculture, Report No. 11-02-01 (2002)
Statistics South Africa 42
Table 9.3 - Citrus fruit
Eastern Cape 12 412 249 983 1 495 39 583 133 4 734Free State 109 1 574 5 45 0 0Gauteng 62 936 0 0 0 0KwaZulu-Natal 2 572 46 847 121 4 052 678 20 986Limpopo 18 634 439 556 599 13 366 1 017 34 107Mpumalanga 9 748 259 141 653 4 395 2 540 49 257North West 1 365 24 119 60 899 0 0Northern Cape 699 11 506 6 94 11 218Western Cape 9 061 219 873 471 11 726 211 4 704South Africa 54 661 1 253 535 3 410 74 161 4 589 114 006
Table 9.3 - Citrus fruit (concluded)
Eastern Cape 157 2 351 66 3 419Free State 0 0 0 0Gauteng 0 0 0 0KwaZulu-Natal 39 482 1 1Limpopo 28 96 98 714Mpumalanga 193 4 231 6 200North West 281 2 635 1 8Northern Cape 5 25 0 0Western Cape 1 118 21 009 32 367South Africa 1 820 30 828 203 4 709
ProductionMetric tonsMetric tons Hectares
ProvinceOranges Lemons
Metric tons
ProvinceNaartjes Other
HectaresPlanted Production Planted
Grapefruit
Hectares Metric tonsPlanted Production Planted Production Planted Production
Hectares Hectares Metric tons
Census of commercial agriculture, Report No. 11-02-01 (2002)
Statistics South Africa 43
Table 9.4 - Subtropical fruit
Eastern Cape 4 414 68 809 8 37 70 1 227Free State 0 0 0 0 0 0Gauteng 0 0 0 0 5 67KwaZulu-Natal 1 909 32 587 410 3 249 2 088 39 758Limpopo 24 408 5 048 36 548 2 199 48 188Mpumalanga 5 17 3 733 23 915 7 589 195 096North West 0 0 63 93 0 0Northern Cape 0 0 0 0 0 0Western Cape 0 0 8 32 0 0South Africa 6 352 101 821 9 269 63 873 11 950 284 335
Table 9.4 - Subtropical fruit (concluded)
Eastern Cape 0 0 0 0 78 622Free State 0 0 0 0 240 3 890Gauteng 0 0 0 0 10 24KwaZulu-Natal 178 740 0 0 114 189Limpopo 5 361 33 020 138 3 548 2 054 20 486Mpumalanga 3 131 16 091 447 2 205 1 023 27 405North West 0 0 0 0 110 1 881Northern Cape 16 192 0 0 236 3 818Western Cape 20 40 0 0 694 19 976South Africa 8 706 50 082 584 5 753 4 558 78 291
Hectares Metric tonsProduction
Hectares
Planted Production Planted Production
Metric tons Hectares Metric tons
Planted ProductionMetric tons
PlantedProvincePineapples Avocados Bananas
Planted Production Planted Production
ProvinceMangoes Pawpaws Other
Hectares Metric tons Hectares HectaresMetric tons
Census of commercial agriculture, Report No. 11-02-01 (2002)
Statistics South Africa 44
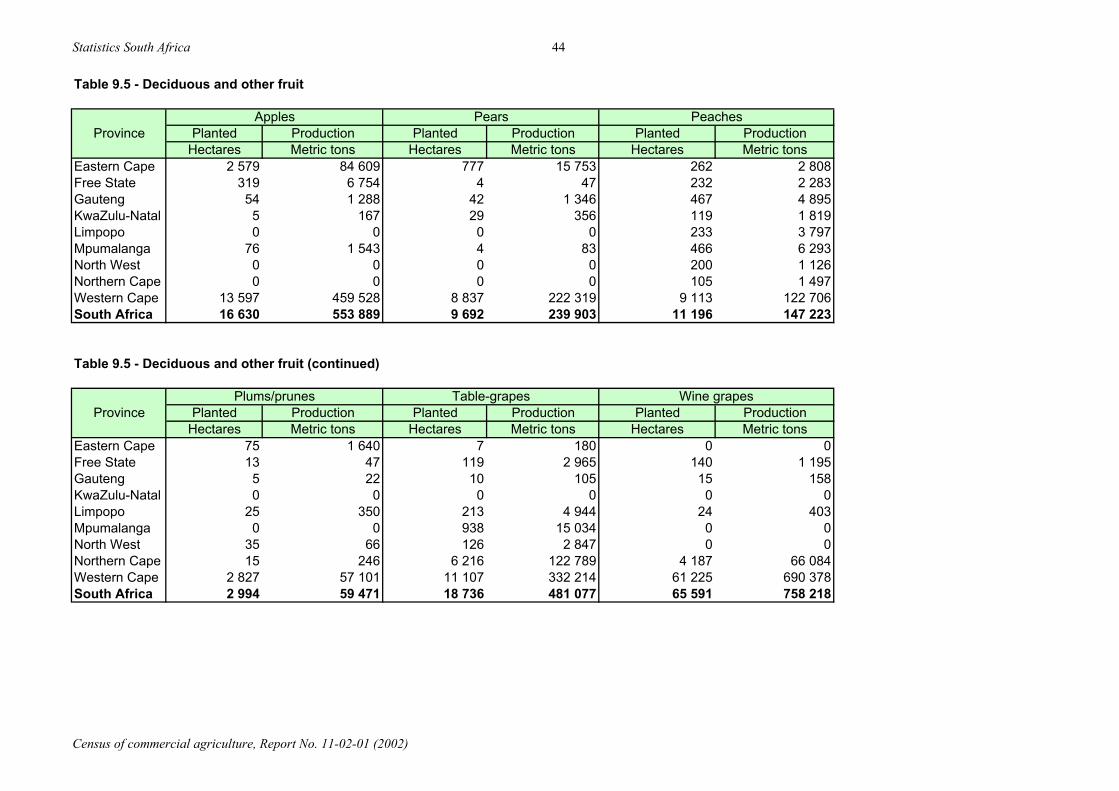
Table 9.5 - Deciduous and other fruit
Eastern Cape 2 579 84 609 777 15 753 262 2 808Free State 319 6 754 4 47 232 2 283Gauteng 54 1 288 42 1 346 467 4 895KwaZulu-Natal 5 167 29 356 119 1 819Limpopo 0 0 0 0 233 3 797Mpumalanga 76 1 543 4 83 466 6 293North West 0 0 0 0 200 1 126Northern Cape 0 0 0 0 105 1 497Western Cape 13 597 459 528 8 837 222 319 9 113 122 706South Africa 16 630 553 889 9 692 239 903 11 196 147 223
Table 9.5 - Deciduous and other fruit (continued)
Eastern Cape 75 1 640 7 180 0 0Free State 13 47 119 2 965 140 1 195Gauteng 5 22 10 105 15 158KwaZulu-Natal 0 0 0 0 0 0Limpopo 25 350 213 4 944 24 403Mpumalanga 0 0 938 15 034 0 0North West 35 66 126 2 847 0 0Northern Cape 15 246 6 216 122 789 4 187 66 084Western Cape 2 827 57 101 11 107 332 214 61 225 690 378South Africa 2 994 59 471 18 736 481 077 65 591 758 218
Metric tons Hectares HectaresMetric tonsProductionMetric tons
Wine grapes
ProvinceApples Pears Peaches
Planted Production Planted Planted ProductionMetric tons
ProductionMetric tons Metric tons
Planted Planted ProductionHectares
Hectares
PlantedProductionPlums/prunes
HectaresHectares
Table-grapesProvince
Census of commercial agriculture, Report No. 11-02-01 (2002)
Statistics South Africa 45
Table 9.5 - Deciduous and other fruit (concluded)
Eastern Cape 177 1 598Free State 351 604Gauteng 0 0KwaZulu-Natal 46 114Limpopo 55 100Mpumalanga 57 254North West 3 32Northern Cape 400 2 234Western Cape 2 489 35 758South Africa 3 577 40 693
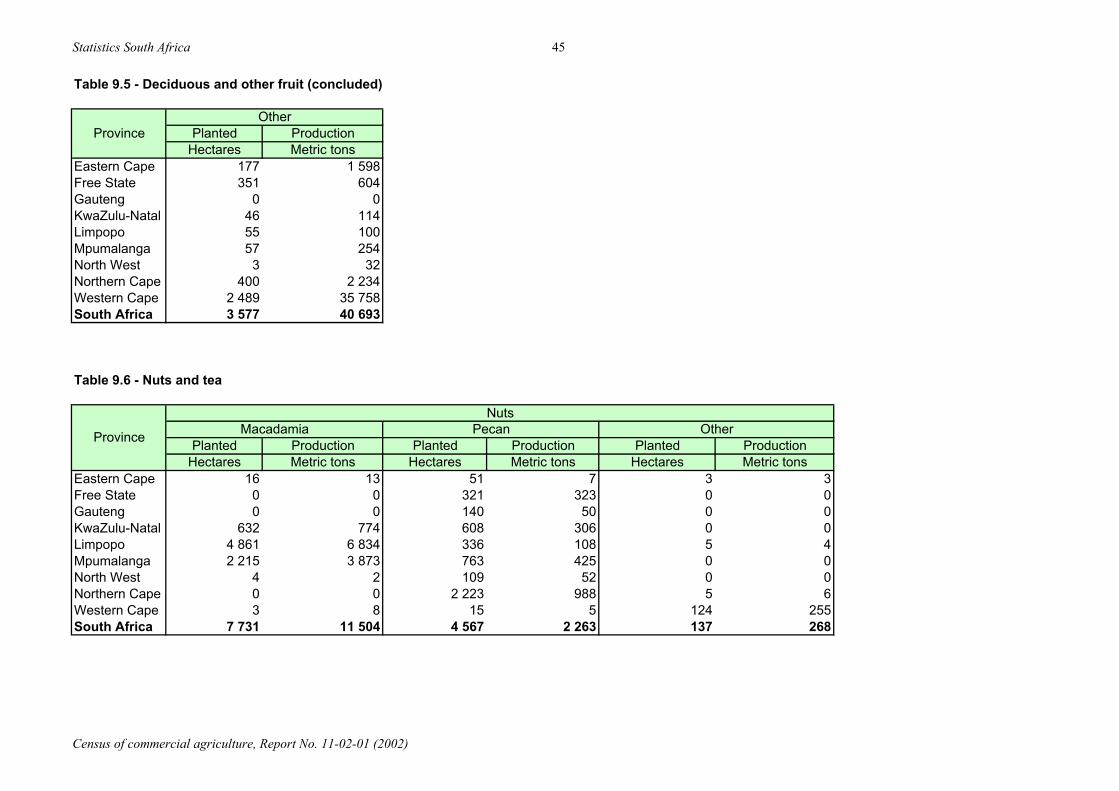
Table 9.6 - Nuts and tea
Eastern Cape 16 13 51 7 3 3Free State 0 0 321 323 0 0Gauteng 0 0 140 50 0 0KwaZulu-Natal 632 774 608 306 0 0Limpopo 4 861 6 834 336 108 5 4Mpumalanga 2 215 3 873 763 425 0 0North West 4 2 109 52 0 0Northern Cape 0 0 2 223 988 5 6Western Cape 3 8 15 5 124 255South Africa 7 731 11 504 4 567 2 263 137 268
Nuts
Planted ProductionProvinceOther
Hectares Metric tons
Planted PlantedOther
ProductionProvince Macadamia PecanProduction
Hectares Metric tonsHectaresProductionPlanted
Metric tons Hectares Metric tons
Census of commercial agriculture, Report No. 11-02-01 (2002)
Statistics South Africa 46
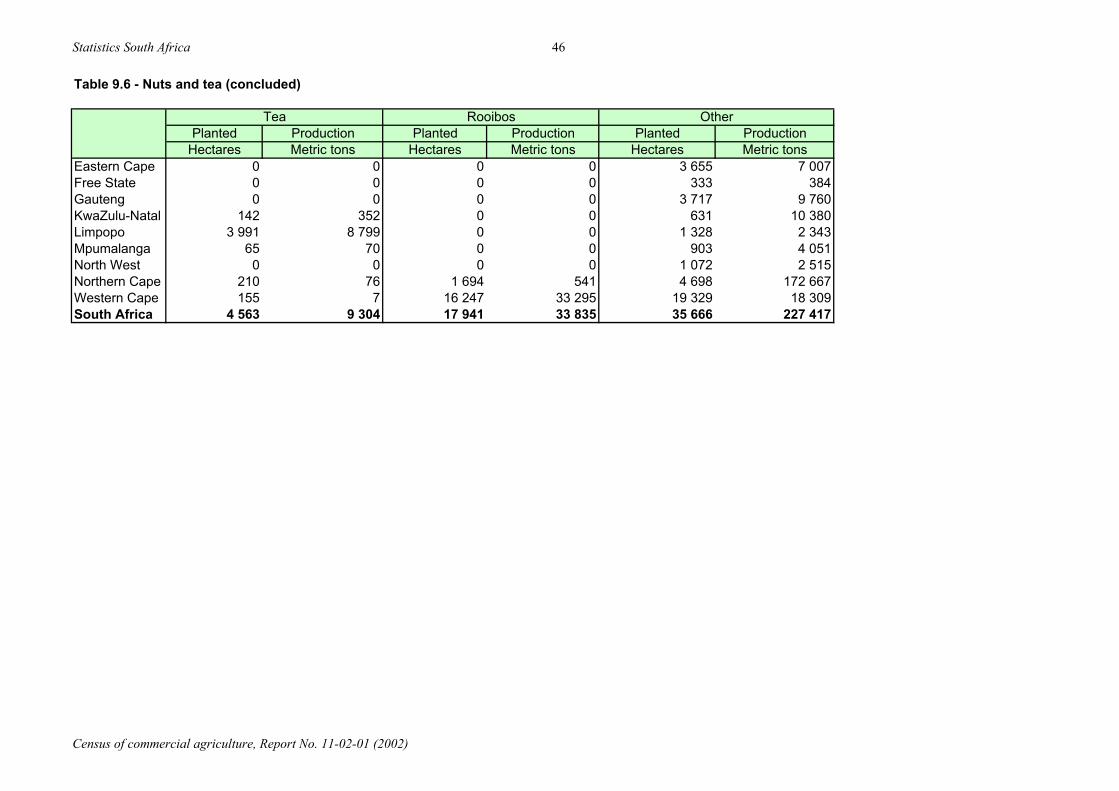
Table 9.6 - Nuts and tea (concluded)
Eastern Cape 0 0 0 0 3 655 7 007Free State 0 0 0 0 333 384Gauteng 0 0 0 0 3 717 9 760KwaZulu-Natal 142 352 0 0 631 10 380Limpopo 3 991 8 799 0 0 1 328 2 343Mpumalanga 65 70 0 0 903 4 051North West 0 0 0 0 1 072 2 515Northern Cape 210 76 1 694 541 4 698 172 667Western Cape 155 7 16 247 33 295 19 329 18 309South Africa 4 563 9 304 17 941 33 835 35 666 227 417
Hectares Metric tons
OtherTea Rooibos
Hectares Metric tons Hectares Metric tonsPlanted Production Planted Production Planted Production
Census of commercial agriculture, Report No. 11-02-01 (2002)
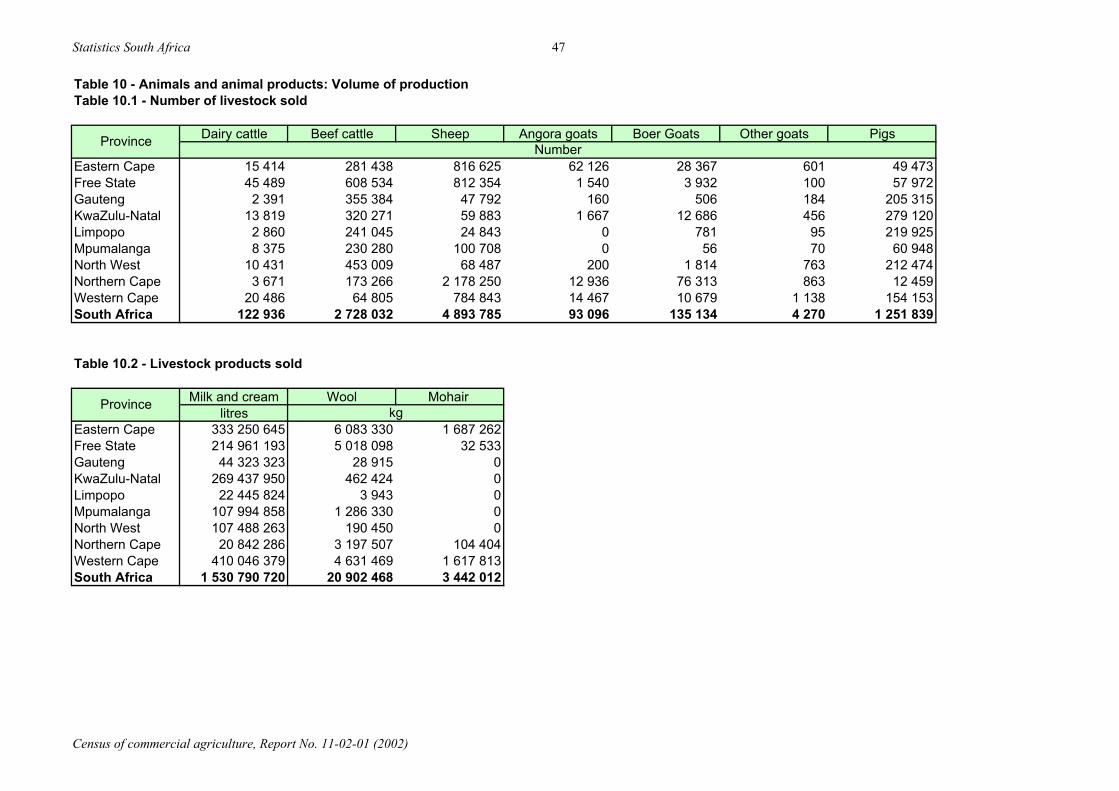
Statistics South Africa 47
Table 10 - Animals and animal products: Volume of productionTable 10.1 - Number of livestock sold
Dairy cattle Beef cattle Sheep Angora goats Boer Goats Other goats Pigs
Eastern Cape 15 414 281 438 816 625 62 126 28 367 601 49 473Free State 45 489 608 534 812 354 1 540 3 932 100 57 972Gauteng 2 391 355 384 47 792 160 506 184 205 315KwaZulu-Natal 13 819 320 271 59 883 1 667 12 686 456 279 120Limpopo 2 860 241 045 24 843 0 781 95 219 925Mpumalanga 8 375 230 280 100 708 0 56 70 60 948North West 10 431 453 009 68 487 200 1 814 763 212 474Northern Cape 3 671 173 266 2 178 250 12 936 76 313 863 12 459Western Cape 20 486 64 805 784 843 14 467 10 679 1 138 154 153South Africa 122 936 2 728 032 4 893 785 93 096 135 134 4 270 1 251 839
Table 10.2 - Livestock products sold
Milk and cream Wool Mohair litres
Eastern Cape 333 250 645 6 083 330 1 687 262Free State 214 961 193 5 018 098 32 533Gauteng 44 323 323 28 915 0KwaZulu-Natal 269 437 950 462 424 0Limpopo 22 445 824 3 943 0Mpumalanga 107 994 858 1 286 330 0North West 107 488 263 190 450 0Northern Cape 20 842 286 3 197 507 104 404Western Cape 410 046 379 4 631 469 1 617 813South Africa 1 530 790 720 20 902 468 3 442 012
Province
Province
kg
Number
Census of commercial agriculture, Report No. 11-02-01 (2002)
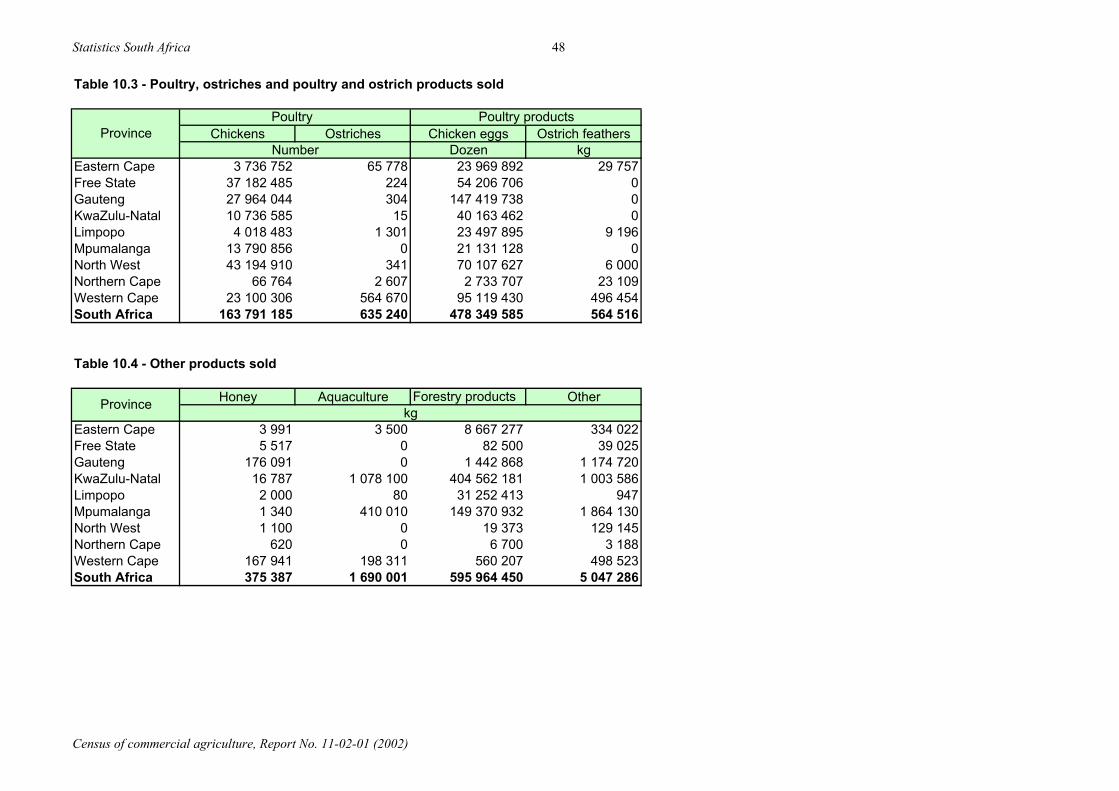
Statistics South Africa 48
Table 10.3 - Poultry, ostriches and poultry and ostrich products sold
Chickens Ostriches Chicken eggs Ostrich feathersDozen kg
Eastern Cape 3 736 752 65 778 23 969 892 29 757Free State 37 182 485 224 54 206 706 0Gauteng 27 964 044 304 147 419 738 0KwaZulu-Natal 10 736 585 15 40 163 462 0Limpopo 4 018 483 1 301 23 497 895 9 196Mpumalanga 13 790 856 0 21 131 128 0North West 43 194 910 341 70 107 627 6 000Northern Cape 66 764 2 607 2 733 707 23 109Western Cape 23 100 306 564 670 95 119 430 496 454South Africa 163 791 185 635 240 478 349 585 564 516
Table 10.4 - Other products sold
Honey Aquaculture Forestry products Other
Eastern Cape 3 991 3 500 8 667 277 334 022Free State 5 517 0 82 500 39 025Gauteng 176 091 0 1 442 868 1 174 720KwaZulu-Natal 16 787 1 078 100 404 562 181 1 003 586Limpopo 2 000 80 31 252 413 947Mpumalanga 1 340 410 010 149 370 932 1 864 130North West 1 100 0 19 373 129 145Northern Cape 620 0 6 700 3 188Western Cape 167 941 198 311 560 207 498 523South Africa 375 387 1 690 001 595 964 450 5 047 286
Province kg
ProvincePoultry
Number
Poultry products
Census of commercial agriculture, Report No. 11-02-01 (2002)
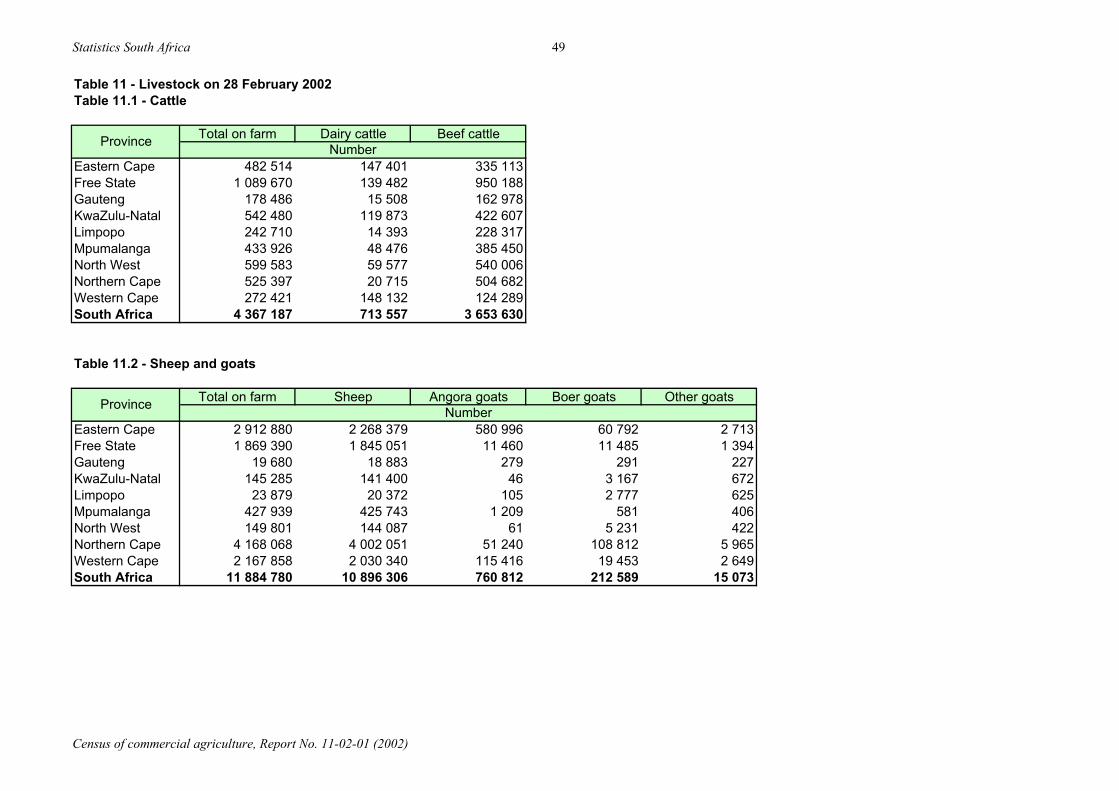
Statistics South Africa 49
Table 11 - Livestock on 28 February 2002Table 11.1 - Cattle
Total on farm Dairy cattle Beef cattle
Eastern Cape 482 514 147 401 335 113Free State 1 089 670 139 482 950 188Gauteng 178 486 15 508 162 978KwaZulu-Natal 542 480 119 873 422 607Limpopo 242 710 14 393 228 317Mpumalanga 433 926 48 476 385 450North West 599 583 59 577 540 006Northern Cape 525 397 20 715 504 682Western Cape 272 421 148 132 124 289South Africa 4 367 187 713 557 3 653 630
Table 11.2 - Sheep and goats
Total on farm Sheep Angora goats Boer goats Other goats
Eastern Cape 2 912 880 2 268 379 580 996 60 792 2 713Free State 1 869 390 1 845 051 11 460 11 485 1 394Gauteng 19 680 18 883 279 291 227KwaZulu-Natal 145 285 141 400 46 3 167 672Limpopo 23 879 20 372 105 2 777 625Mpumalanga 427 939 425 743 1 209 581 406North West 149 801 144 087 61 5 231 422Northern Cape 4 168 068 4 002 051 51 240 108 812 5 965Western Cape 2 167 858 2 030 340 115 416 19 453 2 649South Africa 11 884 780 10 896 306 760 812 212 589 15 073
Province
Province
Number
Number
Census of commercial agriculture, Report No. 11-02-01 (2002)
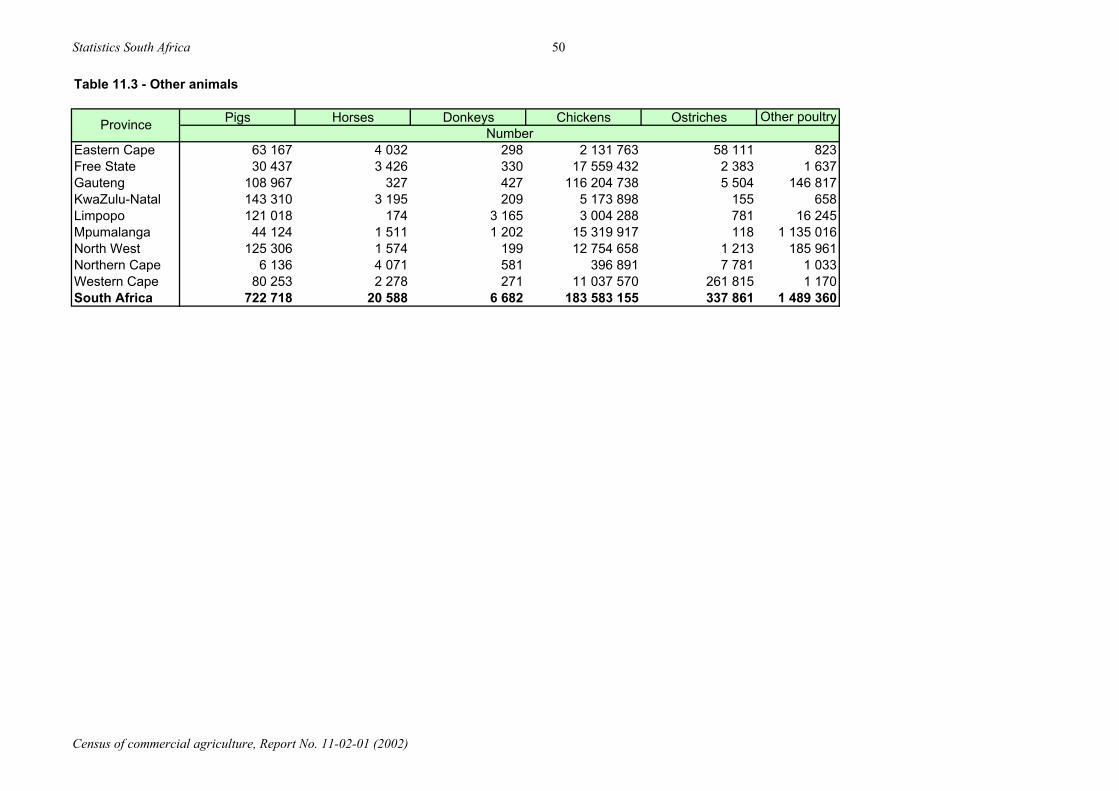
Statistics South Africa 50
Table 11.3 - Other animals
Pigs Horses Donkeys Chickens Ostriches Other poultry
Eastern Cape 63 167 4 032 298 2 131 763 58 111 823Free State 30 437 3 426 330 17 559 432 2 383 1 637Gauteng 108 967 327 427 116 204 738 5 504 146 817KwaZulu-Natal 143 310 3 195 209 5 173 898 155 658Limpopo 121 018 174 3 165 3 004 288 781 16 245Mpumalanga 44 124 1 511 1 202 15 319 917 118 1 135 016North West 125 306 1 574 199 12 754 658 1 213 185 961Northern Cape 6 136 4 071 581 396 891 7 781 1 033Western Cape 80 253 2 278 271 11 037 570 261 815 1 170South Africa 722 718 20 588 6 682 183 583 155 337 861 1 489 360
Province Number
Census of commercial agriculture, Report No. 11-02-01 (2002)

Census of commercial agriculture, Report No. 11-02-01 (2002)
51
Methods and explanatory notes
Universe 1 The population of the 2002 Census of Commercial Agriculture differed from agriculture censuses in the past. This census covered the whole country, including the former TBVC states and so-called self-governing territories. Moreover the census was based on a new businessregister containing all businesses registered for VAT with the South African Revenue Service (SARS).
All enterprises are legally bound to register for VAT when their turnover for a period of twelve months equals or exceeds R300 000. However, those with a turnover of less than R300 000 may register for VAT voluntarily. From the commercial farming units registered for VAT, a total of 45 818 were identified as live and active at the time of the census, and formed the population for the census.
Scope 2 Information was obtained from commercial farmers who worked on their own farms or rented farms or farmed land on shares.
For the purpose of the census, farming means: the growing of field crops, fruit, grapes, nuts, seeds, trees in a nursery, bulbs, vegetables and flowers in the open air or under cover; operations at nurseries excluding those predominantly engaged in reselling; the operation of tea, coffee and sugar plantations; the raising of livestock, game, poultry, rabbits, freshwater fish, furbearing and other animals; and the production of milk, wool, pelt/fur, eggs and honey
for commercial purposes.
Forestry (e.g. timber, wattle, wood and other plantations), ocean fishing and agricultural services were not included in the census. Data in respect of agricultural smallholdings such as nurseries, vegetable gardens, flower farms and dairy farms are included in this report only in those cases where products were intended for sale.
Response rate 3 As indicated in Table H below, of the 45 818 farming units that formed the population, 2 330 had an income of more than R4 million each per annum, whereas 23 428 had an income of less than R300 000 each per annum.
Farming units in the largest income group had the highest response rate, namely 94,4%. The groups with the lowest response rates were income groups 3 and 4, with response rates of 51,6% and 57,0% respectively.
Table H – Number of farming units per income group and the response rate
Cut-off points Income group Number of farming units
Response rate (%)
R4 000 000 and more 1 2 330 94,4 R2 000 000 N < R4 000 000 2 3 041 69,5 R1 000 000 N < R2 000 000 3 5 214 57,0 R300 000 N < R1 000 000 4 11 805 51,6 Less than R300 000 5 23 428 65,6
Total 45 818 62,7
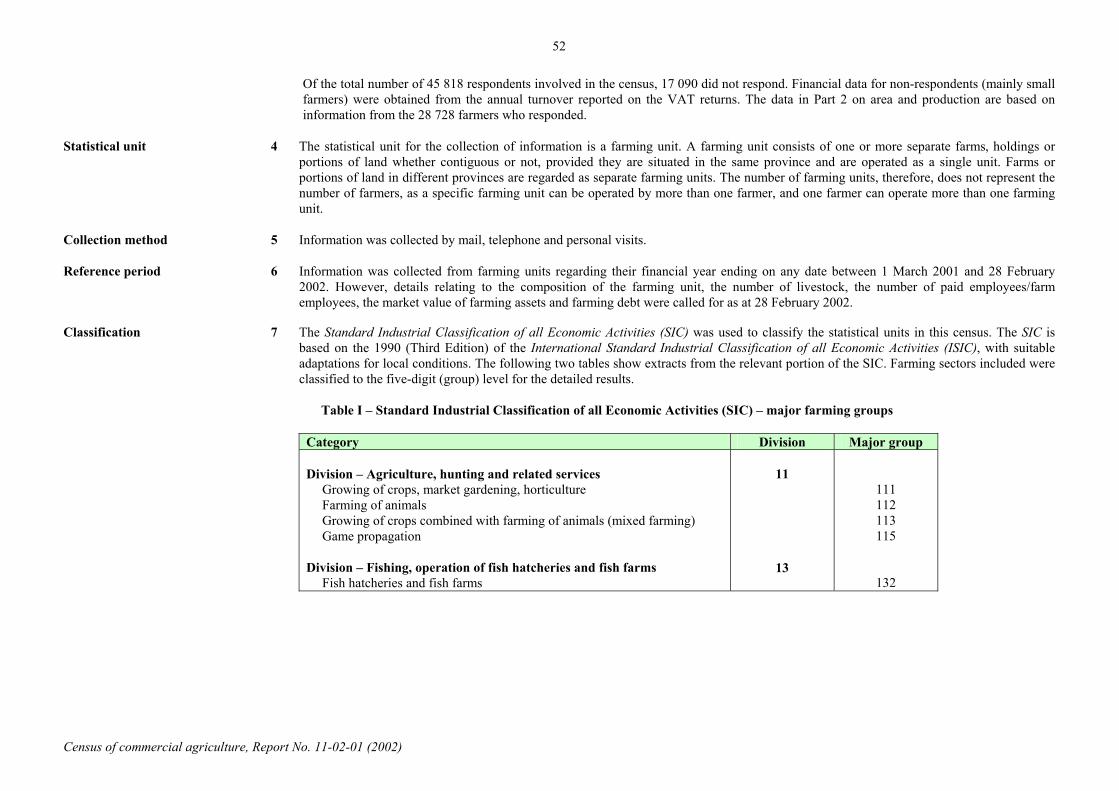
Census of commercial agriculture, Report No. 11-02-01 (2002)
52
Of the total number of 45 818 respondents involved in the census, 17 090 did not respond. Financial data for non-respondents (mainly small farmers) were obtained from the annual turnover reported on the VAT returns. The data in Part 2 on area and production are based on information from the 28 728 farmers who responded.
Statistical unit 4 The statistical unit for the collection of information is a farming unit. A farming unit consists of one or more separate farms, holdings or portions of land whether contiguous or not, provided they are situated in the same province and are operated as a single unit. Farms or portions of land in different provinces are regarded as separate farming units. The number of farming units, therefore, does not represent the number of farmers, as a specific farming unit can be operated by more than one farmer, and one farmer can operate more than one farming unit.
Collection method 5 Information was collected by mail, telephone and personal visits.
Reference period 6 Information was collected from farming units regarding their financial year ending on any date between 1 March 2001 and 28 February 2002. However, details relating to the composition of the farming unit, the number of livestock, the number of paid employees/farm employees, the market value of farming assets and farming debt were called for as at 28 February 2002.
Classification 7 The Standard Industrial Classification of all Economic Activities (SIC) was used to classify the statistical units in this census. The SIC is based on the 1990 (Third Edition) of the International Standard Industrial Classification of all Economic Activities (ISIC), with suitable adaptations for local conditions. The following two tables show extracts from the relevant portion of the SIC. Farming sectors included were classified to the five-digit (group) level for the detailed results.
Table I – Standard Industrial Classification of all Economic Activities (SIC) – major farming groups
Category Division Major group
Division – Agriculture, hunting and related services Growing of crops, market gardening, horticulture Farming of animals Growing of crops combined with farming of animals (mixed farming) Game propagation
Division – Fishing, operation of fish hatcheries and fish farms Fish hatcheries and fish farms
11
13
111112113115
132
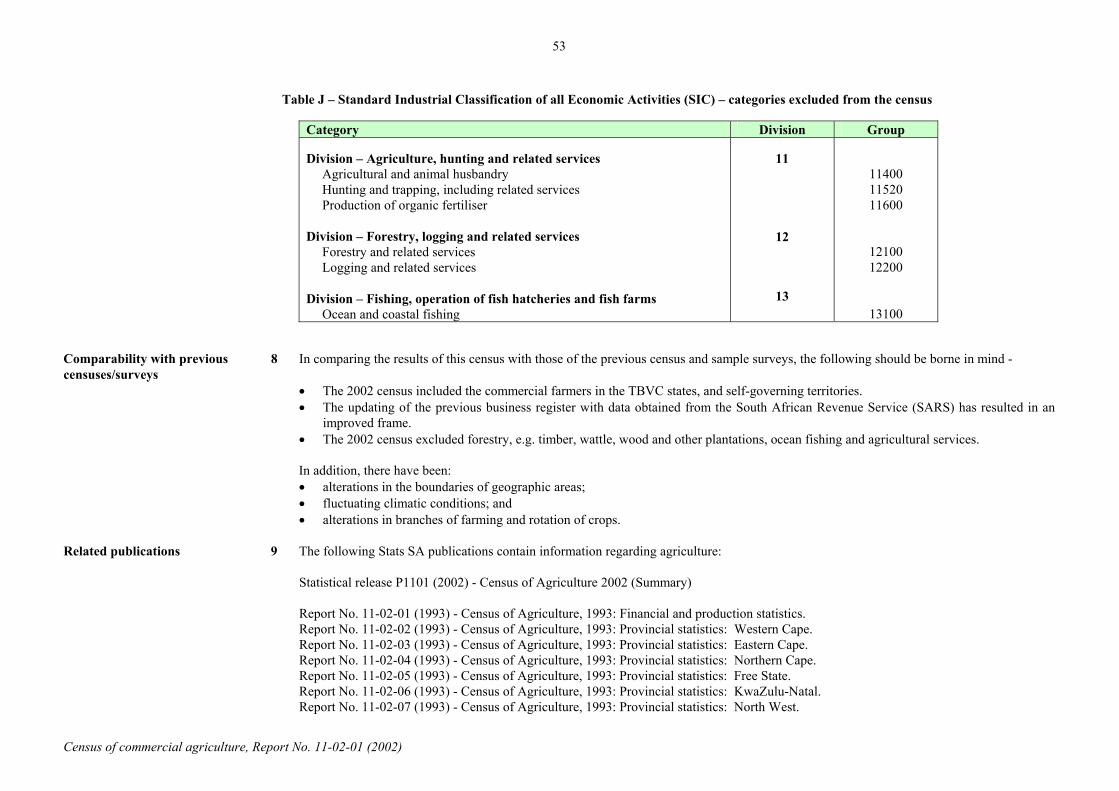
Census of commercial agriculture, Report No. 11-02-01 (2002)
53
Table J – Standard Industrial Classification of all Economic Activities (SIC) – categories excluded from the census
Category Division Group
Division – Agriculture, hunting and related services Agricultural and animal husbandry Hunting and trapping, including related services Production of organic fertiliser
Division – Forestry, logging and related services Forestry and related services
Logging and related services
Division – Fishing, operation of fish hatcheries and fish farms Ocean and coastal fishing
11
12
13
114001152011600
1210012200
13100
Comparability with previous 8 In comparing the results of this census with those of the previous census and sample surveys, the following should be borne in mind - censuses/surveys
The 2002 census included the commercial farmers in the TBVC states, and self-governing territories. The updating of the previous business register with data obtained from the South African Revenue Service (SARS) has resulted in an improved frame. The 2002 census excluded forestry, e.g. timber, wattle, wood and other plantations, ocean fishing and agricultural services.
In addition, there have been: alterations in the boundaries of geographic areas; fluctuating climatic conditions; and alterations in branches of farming and rotation of crops.
Related publications 9 The following Stats SA publications contain information regarding agriculture:
Statistical release P1101 (2002) - Census of Agriculture 2002 (Summary)
Report No. 11-02-01 (1993) - Census of Agriculture, 1993: Financial and production statistics. Report No. 11-02-02 (1993) - Census of Agriculture, 1993: Provincial statistics: Western Cape. Report No. 11-02-03 (1993) - Census of Agriculture, 1993: Provincial statistics: Eastern Cape. Report No. 11-02-04 (1993) - Census of Agriculture, 1993: Provincial statistics: Northern Cape. Report No. 11-02-05 (1993) - Census of Agriculture, 1993: Provincial statistics: Free State. Report No. 11-02-06 (1993) - Census of Agriculture, 1993: Provincial statistics: KwaZulu-Natal. Report No. 11-02-07 (1993) - Census of Agriculture, 1993: Provincial statistics: North West.
Census of commercial agriculture, Report No. 11-02-01 (2002)
54
Report No. 11-02-08 (1993) - Census of Agriculture, 1993: Provincial statistics: Gauteng. Report No. 11-02-09 (1993) - Census of Agriculture, 1993: Provincial statistics: Mpumalanga. Report No. 11-02-10 (1993) - Census of Agriculture, 1993: Provincial statistics: Limpopo. Report No. 11-01-01 (1996) - Agriculture Surveys, 1994, 1995 and 1996.
Unpublished data 10 In some cases Stats SA can also make available statistics which are not published. This information can be made available as computer printouts or diskette. Generally a charge is made for providing unpublished statistics.
Symbols and abbreviations 11 Stats SA Statistics South Africa 0 Nil or less than half the final digit shown
No. Number - not available GDP Gross Domestic Product TBVC Transkei, Bophuthatswana, Venda and Ciskei kg kilogram
litres SARS South African Revenue Service
Rounding-off of figures 12 The figures in the tables have, where necessary, been rounded off to the nearest final digit shown. There may, therefore, be slight discrepancies between the sums of the constituent items of the totals shown.