Embed Size (px)
Citation preview

1
Massachusetts Adult Proficiency Tests Technical Manual Supplement: 2008-20091
April L. Zenisky, Stephen G. Sireci, Andrea Martone, Peter Baldwin, and Wendy Lam
Center for Educational Assessment
University of Massachusetts Amherst
Prepared under a contract awarded by the Massachusetts Department of Elementary and Secondary Education
7/7/09
© copyright 2009 Center for Educational Assessment, University of Massachusetts Amherst
all rights reserved
1 Center for Educational Assessment Research Report No. 715. Amherst, MA: University of Massachusetts, Center for Educational Assessment. Funding for this research was provided by the Massachusetts Department of Education under Project/Grant #S39000000700000. The opinions expressed in this report are those of the authors and do not necessarily represent official positions of the Massachusetts Department of Education.
2
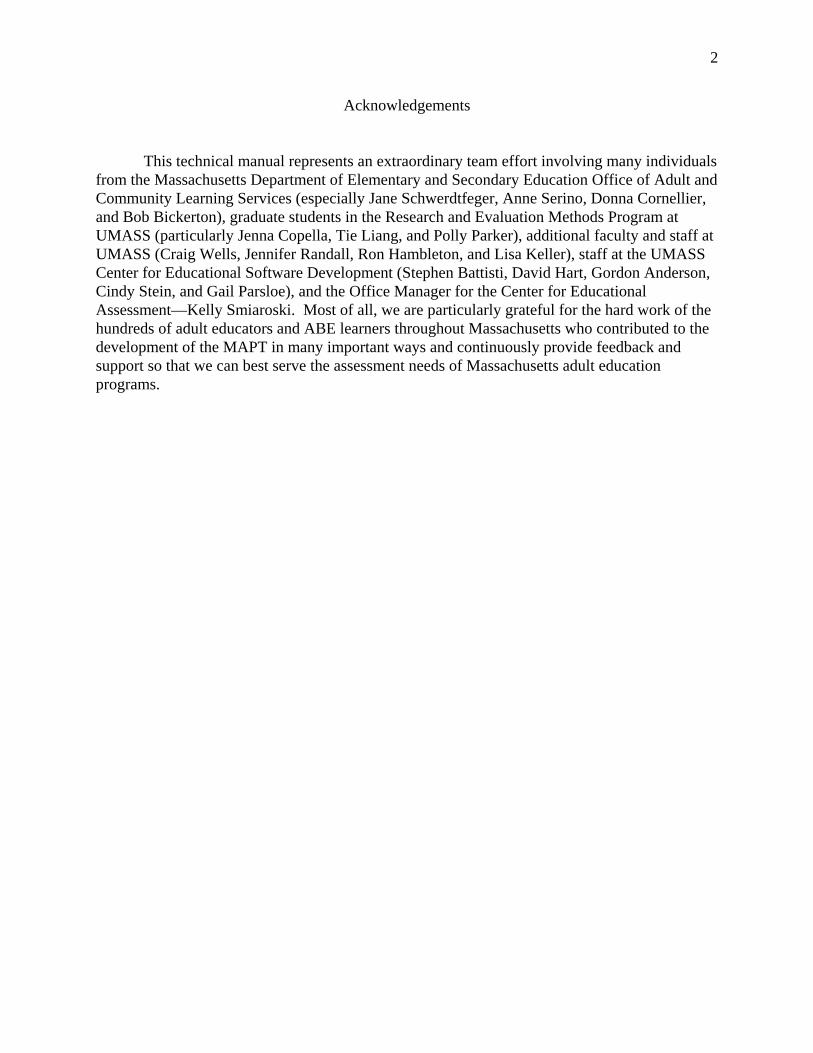
Acknowledgements
This technical manual represents an extraordinary team effort involving many individuals
from the Massachusetts Department of Elementary and Secondary Education Office of Adult and Community Learning Services (especially Jane Schwerdtfeger, Anne Serino, Donna Cornellier, and Bob Bickerton), graduate students in the Research and Evaluation Methods Program at UMASS (particularly Jenna Copella, Tie Liang, and Polly Parker), additional faculty and staff at UMASS (Craig Wells, Jennifer Randall, Ron Hambleton, and Lisa Keller), staff at the UMASS Center for Educational Software Development (Stephen Battisti, David Hart, Gordon Anderson, Cindy Stein, and Gail Parsloe), and the Office Manager for the Center for Educational Assessment—Kelly Smiaroski. Most of all, we are particularly grateful for the hard work of the hundreds of adult educators and ABE learners throughout Massachusetts who contributed to the development of the MAPT in many important ways and continuously provide feedback and support so that we can best serve the assessment needs of Massachusetts adult education programs.

3
Massachusetts Adult Proficiency Tests Technical Manual Supplement: 2008-2009
Table of Contents
I. INTRODUCTION AND PURPOSE OF THIS SUPPLEMENT ........................................... 4
II. DEVELOPING THE FISCAL 2009 MAPT ASSESSMENTS ............................................ 6
ITEM RESPONSE THEORY (IRT) CALIBRATION ................................................................................ 6 SCALING AND EQUATING ............................................................................................................... 9 DEVELOPMENT OF MAPT MODULES AND PANELS ....................................................................... 10 CREATING PARALLEL PANELS ...................................................................................................... 13
III. CHARACTERISTICS OF OPERATIONAL ITEM BANKS ......................................... 16
DISTRIBUTIONS OF ITEM DIFFICULTY .......................................................................................... 16 ITEM EXPOSURE RATES ................................................................................................................ 17
IV. STANDARD SETTING: REVISING CUT-SCORES FOR THE NRS EDUCATIONAL FUNCTIONING LEVELS ......................................................................................................... 20
V. MEASUREMENT PRECISION .......................................................................................... 25
TEST INFORMATION FUNCTIONS .................................................................................................. 25 CONDITIONAL STANDARD ERROR OF ESTIMATION ........................................................................ 28 DECISION CONSISTENCY AND DECISION ACCURACY ..................................................................... 32
VI. VALIDITY STUDIES .......................................................................................................... 35
TEST SESSIONS ANALYSIS ............................................................................................................. 35 TEST AND ITEM RESPONSE TIME ANALYSES .................................................................................. 41
REFERENCES ............................................................................................................................ 65
APPENDICES ............................................................................................................................. 67
APPENDIX A .............................................................................................................................. 67
LIST OF CENTER FOR EDUCATIONAL ASSESSMENT RESEARCH REPORTS RELATED TO MAPT .. 67
APPENDIX B .............................................................................................................................. 69
MAPT TEST ADMINISTRATIONS BY MONTH: FISCAL 2008 AND FISCAL 2009 .......................... 69

4
I. Introduction and Purpose of this Supplement
Since January 2003, the Center for Educational Assessment at the University of Massachusetts Amherst (UMASS), under a contract awarded by the Massachusetts Department of Elementary and Secondary Education, has worked closely with the Department’s Office of Adult and Community Learning Services (ACLS) to develop achievement tests in math and reading that are appropriate for adult learners in Massachusetts. These tests, called the Massachusetts Adult Proficiency Tests (MAPT), have been operational since September 2006. Key features of these tests are that they are (a) aligned to the National Reporting System’s (NRS) Educational Functioning Levels (EFLs), (b) aligned with the curriculum frameworks established by ACLS and the adult basic education (ABE) community in Massachusetts, (c) designed to measure gain across the EFLs within the NRS, (d) consistent with the instruction in ABE classrooms as directed by these frameworks, and (e) developed with comprehensive input from teachers and administrators from the ABE community in Massachusetts.
In accordance with the Standards for Educational and Psychological Testing (American Educational Research Association (AERA), American Psychological Association, & National Council on Measurement in Education, 1999), we have published several reports (see Appendix A) and two Technical Manuals (Sireci et al. 2006; Sireci et al., 2008) to inform test users about the technical characteristics of the MAPT assessments and to facilitate the interpretation of test scores. This Technical Supplement is designed to continue the important tradition of documenting the important and complex information on the MAPT testing program. We created this supplement instead of a new technical manual because many of the characteristics of the assessment remain the same. The tests continue to be targeted to the most recent versions of the MA ABE Curriculum Frameworks and are linked to the EFLs designated in the NRS. However, there have been several improvements in the MAPT during the 2008-2009 fiscal year and these improvements require documentation. Thus, this Technical Supplement describes changes that were introduced in the MAPT system since the last Technical Manual was written (Sireci et al. 2008). These chapters in this supplement include descriptions of our current procedures for recalibrating the item banks, assembling test forms, and establishing the cut-points for the EFLs. In addition, we document the technical characteristics of the assessments that were in place for the 2008-2009 fiscal year.
Like the earlier Technical Manuals, the purpose of this Supplement is to do the best job
we can to inform current and potential users of MAPT assessments of its technical characteristics. This Supplement, in conjunction with the most recent version of the Technical Manual (Sireci et al., 2008) will provide interested parties with all relevant information for evaluating the basic and technical characteristics of the MAPT including (a) the purpose of the tests and their intended uses; (b) the content of the tests; (c) the processes used to develop, validate, and set standards on the tests, (d) the processes used to ensure assessment equity across diverse learners; (e) the technical characteristics of the test such as measurement precision, score scale characteristics, and multistage test administration design; and (f) how to properly interpret the test scores. Given that the Standards stress the importance of publicly available technical documentation, we believe it is important to maintain the tradition of comprehensive documentation of the MAPT testing program. Additional information regarding test administration and other policies related to assessing the proficiencies of adult learners in

5
Massachusetts can be found on the ACLS web site (http://www.doe.mass.edu/acls/assessment). That web site contains links to practice test and other information regarding the MAPT, as well as the Assessment Policies and Procedures Manual.
Although this Supplement contains comprehensive information about the MAPT, readers
unfamiliar with the basic operations and characteristics of the MAPT will want to first review the MAPT Technical Manual (Version 2) (Sireci et al., 2008), since most of the important information pertaining to the design and content of the MAPT is not repeated here. The purpose of this Supplement is to document changes in the technical characteristics that occurred since fiscal 2008 and to document statistical information regarding test and item characteristics for fiscal 2008.
This Technical Manual is intended to be informative to several audiences; however, some sections may require familiarity with statistics and other aspects of psychometrics. The types of professionals who may be interested in the material in this manual include ABE teachers, administrators, and staff; representatives from the US Department of Education and other organizations interested in evaluating the technical merits of the MAPT; representatives from ABE programs in other states who want to understand the strengths and limitations of MAPT; and members of the psychometric and educational research communities who are interested in test evaluation and computer-based testing.
Although this manual represents a comprehensive description of the technical qualities
and features of the MAPT, these tests are not intended to remain static. We expect the MAPT to evolve and improve as we continue to monitor its functioning. As changes occur, additional documentation will be produced to inform interested parties.

6
II. Developing the Fiscal 2009 MAPT Assessments Item Response Theory (IRT) Calibration
The initial item calibrations for the MAPT in 2006 used a one-parameter (Rasch) model to place all items on a common scale. This model was chosen primarily because the sample sizes for the items tended to be small. After piloting items in the operational context and administering operational items for a year, sample sizes for many items were considerably larger and so we explored finding the most appropriate IRT models for MAPT data. Specifically, we evaluated the fit of 1-, 2-, and 3-parameter IRT models to the data for each item and even explored modifications of these models such as fixing one or more parameters to predetermined values or using item-specific priors. Based on analyses of model fit and measurement precision, we concluded the 3-parameter logistic (3PL) IRT model was best for estimating most item parameters and for estimating proficiency scores for examinees. For items with small sample sizes or estimation problems a modification of the 3PL model was used where the discrimination and/or lower-asymptote parameters were fixed to reasonable values. The typical (unmodified) 3PL model is defined as (Hambleton & Swaminathan, 1985):
Pi (θ ) = ci + (1− ci )eDai (θ−bi )
1+ eDai (θ−bi )
where:
Pi is probability of a correct answer on item i; θ (theta) is the examinee proficiency parameter; ai is the item discrimination parameter; bi is the item difficulty parameter; ci is the lower asymptote or “pseudo-guessing” parameter; D is a scaling factor equal to 1.7; e is base of the natural logarithm.
Discrimination parameters (a-parameters) and pseudo-guessing parameters (c-parameters) can be difficult to estimate when examinee samples are small and so in some cases the model was further constrained by either fixing a- and/or c-parameters to a predetermined value (1.0 or .20, respectively) or placing a relatively informative prior distribution on parameters as needed. After fitting initial models to the data, we comprehensively reviewed the fit of the model for each item to the examinee data and evaluated the residual plots for each item. The priors were, in some cases, revised. Analysis and comparison of residuals across various models was a key determinant in deciding the best IRT model for each item. These analyses also eliminated some items from the operational pool if they were judged to have poor fit. This process of calibrating and evaluating all items in the item pool for each MAPT test (Math or Reading) is repeated once each year, typically at the start of the fiscal year (July) to add new items to the MAPT item banks and reconstitute the panels. Every student who takes a MAPT test responds to 5 pilot items that do not count toward their score. All pilot items are

7
monitored and once their sample sizes reach a threshold of 300 examinees, they are evaluated using classical item analysis. If their classical statistics (i.e., item difficulty and discrimination estimates) seem appropriate, they will be replaced with other pretest items and are considered ready for calibration during the summer when all items are calibrated onto the IRT scale and evaluated for appropriateness for inclusion in the operational tests. In this way, we can continuously try out items throughout the year. Steps Involved in the Calibration Process The calibration process for each subject area involves several steps. First, a data file for each subject area is created that contains all students’ responses to all MAPT items, both operational and pilot items. Next, these files are cleaned by eliminating illegitimate cases (e.g., administrative records. We then exclude any items that
(a) were responded to by less than 150 students, (b) had point-biserial statistics less than .10, or (c) prevented the calibration run from converging.
Once the data are cleaned an initial calibration is conducted. To maximize the
probability that the calibration will successfully converge, we fix the slope and asymptote parameters for some items according to the following rules:
(a) items with exposure < 400 had slopes fixed to 1.0 (b) items with exposure < 700 had lower asymptotes fixed to .20
The dataset is then calibrated using BILOG-MG (Zimowski, Muraki, Mislevy, & Bock,
2002). The default BILOG priors were used, except as mentioned above. This initial calibration allows the item parameter estimates for the operational items to be updated based on the most recent data, and obtains item parameter estimates for the pilot items on the same scale.
The initial calibration is then evaluated by examining how well the model fits the data for each item. Items that are not fit well by the model may be eliminated, or if their slopes or asymptotes were fixed, they may be freely estimated in a subsequent calibration where their fit is re-evaluated. All items that “survive” the various iterations after the initial calibration are entered into a final calibration, again using BILOG-MG with its default priors, except as mentioned above. Refreshing the MAPT Item Banks: Fiscal 2008 The content specifications for the MAPT Assessments are described in current version of the MAPT Technical Manual (Sireci et al., 2008). In this Supplement we describe how the item banks were refreshed in fiscal 2008 to develop new panels for the MAPT for Reading and the MAPT for Math.
With respect to items that are refreshed or replaced each year, all items in the operational bank are calibrated and evaluated (for fit to the IRT model) along with all freshly piloted items

8
to select the items that will become operational when new test panels are rolled out each year. New test panels are scheduled to be released just prior to September 1 each year. This schedule allows us to take advantage of all items that are pilot-tested during a given fiscal year. The majority of items that comprise the new panels will be items that were operational the previous year, but the modules and paths are uniquely reconfigured each year. Details regarding the degree of rolled-over and new operational items for the current MAPT are provided in Table II-1. For fiscal year 2008, there were 362 operational math items. Sixty-nine of these items (19%) were replaced in FY09. Only 5% of the items that were rolled over from FY08 to FY09 remained in the same module (i.e., same level, same stage). For Reading, there were 341 operational items in FY08. Of these items, 115 (34%) were replaced in FY09. Nine percent of the items that were rolled over from FY08 to FY09 remained in the same module (same level, same stage). These data are summarized in TableII-1. Currently (fiscal year 2009), 70 new math items and 94 new reading items became operational. These new items represent 19% and 29%, respectively, of the operational items in each subject area. We also have a pool of items that are ready to be integrated into operational tests (126 math items and 219 reading items) beginning in fiscal year 2010.
Table II-1
Comparison of FY08 and FY09 Operational Items
Math Reading
# Items # Items
FY08 Operational Items 362 341 Items Rolled Over to FY09 293 226 Rollovers that remained in the same module 16 21 Same item order in module 0 0 New Operational Items for FY09 70 94 FY09 Operational Items 363 320 Future Potential Operational Items 126 219
While we have no fixed number or percentage of items that are refreshed each year, we continue to embed pilot items on the operational tests and expect to add 70-100 new items each year. At the end of fiscal 2007, 13% of the piloted math items and 6% of the piloted reading items were retired due to poor statistics. The fiscal 2008 pool of operational items includes 51% of the math items and 45% of the reading items that we piloted in the previous fiscal year. The remaining items that were piloted, but did not become operational in fiscal 2009, will be recalibrated along with the items being piloted this year and could become operational in fiscal 2010 or some other point in the future.

9
Scaling and Equating
In this section, we explain how items are calibrated onto the MAPT score scale, including how new items are added to the item banks and placed on the appropriate scale. We also describe the transformation from the item response theory (theta) scale to the 200-700 MAPT score scale.
The MAPT for Reading and the MAPT for Mathematics and Numeracy each have their own unique score scale. Each score scale ranges from 200 to 700, with each 100-point interval corresponding to an EFL. Regardless of subject, the underlying IRT proficiency (theta) scale was defined by fixing the mean difficulty level of all items written for Low Intermediate to be zero (i.e., the theta scale was centered at the mean difficulty of all items written for Level 3). This occurred during the 2006 Rasch calibration, so defining the origin of the scale was sufficient to identify the model.
Two advantages of IRT models are that item difficulty and examinee proficiency are on a common, equal-interval scale and that the model parameters are invariant—up to a linear transformation—for a given population of examinees. The qualifier up to a linear transformation is necessary because linearly transforming the scale does not affect the probability of a correct response. That is,
Pi (θ ) = ci + (1− ci )eDai (θ−bi )
1+ eDai (θ−bi ) = ci + (1− ci )e
D aim
[(mθ+n )−(mbi+n )]
1+ eD ai
m[(mθ+n )−(mbi+n )] ,
where m and n are some arbitrary constants. (Note that the pseudo-guessing parameter is unaffected by the transformation because it is on the probability scale not the proficiency/difficulty scale.) The consequence of this scale indeterminacy is that separate estimations of the model parameters cannot be assumed to be on a common scale without making an additional adjustment called equating or scaling. This was the case with item parameters for fiscal year 2008, which were estimated independently from the parameters estimated in the base year for the MAPT, which was fiscal year 2006. Therefore, after the final 2008 calibration, the parameter estimates must be placed onto the original MAPT score scale through a process called equating.
To place fiscal 2008 item parameter estimates on the original (i.e., fiscal 2006) MAPT scale, the relationship between the two arbitrarily defined scales was estimated. This relationship can be described by a linear function (i.e., a slope and an intercept). To estimate this linear transformation function, a common element—or link—must exist on both scales. In this case, the equating link is made using a common person equating design. That is, all examinees who responded to MAPT items in a fiscal year are scored twice—once with the operational item parameters in place that fiscal year, and once with the updated parameters that came out of the final calibration done at the end of the year. Because the same examinees are being scored twice—it’s only the item parameter estimates that differ—the examinee proficiency distribution should be the same for both sets of item parameter estimates, except for the arbitrary scale difference due to the indeterminancy. Therefore, the linear transformation that makes the mean

10
and standard deviation of the “new” proficiency distribution equal to the “old” proficiency distribution is the same transformation that places the new item parameter estimates on the original MAPT scale.
Several steps were involved in this equating. First, the data are cleaned by excluding any
examinees who answered all items correctly or all items incorrectly, or who created an estimation problem (these are always a small number of examinees). Next, all examinees were rescored twice where the first rescore is based on maximum likelihood estimation using old operational parameters, and the second rescore is based on maximum likelihood estimation using parameter estimates obtained in the new calibration. A small percentage (>1%) of examinees with outlying theta estimates were removed by identifying cases where the standard error of the current theta estimate was larger than the standard deviation of the theta estimate derived from the old parameters. The transformation constants are then estimated using the means and standard deviations of all examinees’ scores (theta estimates) from the two rescored samples. The transformation constants are then applied to the new item parameter estimates.
To summarize the common person equating, examinees were rescored twice, where the first rescore uses a maximum likelihood estimation (MLE) using the “old” item parameters and the second rescore uses MLE estimates using the “new” item parameters. Using the two sets of theta scores for the examinees, transformation constants are derived using the means and standard deviations (SDs) of all examinee thetas from the two rescored samples. These transformation constants are then applied to the item parameter estimates obtained in the most recent (re)calibration run. Development of MAPT Modules and Panels
To address the challenge of testing a population with a heterogeneous distribution of proficiency scores, the MAPT uses a multistage adaptive test design. The basic concepts underlying multistage testing are described in Sireci et al. (2008). In this section, we describe how the MAPT modules and panels were developed. A module is a set of items administered to learners at a particular stage of the test. A panel is a collection of modules that spans the learner levels and stages.
Before describing panel/module development, a few words on multistage adaptive testing
are needed. A multistage adaptive test (MST) is a special type of computer-adaptive test (CAT). A traditional CAT is adaptive by item, while a MST is adaptive by sets of items. It is important to bear in mind that each individual set of items cannot be considered as if it were a standalone assessment that is reflective of the test specifications in and of itself. These sets of items at any given stage of an MST are referred to as “testlets” or “modules.” On the MAPT for Mathematics and Numeracy and the MAPT for Reading, each module corresponds to a specific educational functioning level (EFL), as described below. There are five entry points for the MAPT for Mathematics and Numeracy: Beginning Basic Education, Low Intermediate, High Intermediate, Low Adult Secondary, and High Adult Secondary. For the MAPT for Reading, there are four entry points because Low and High Adult Secondary students begin at the same entry point. However, students who start at that point on

11
the Reading test and do well will be routed into the High Adult Secondary range of the MAPT score scale.
Given a common scale for all items, and test specifications for each EFL in each subject area, panels were put together by creating sets of modules that would represent the test specifications for each EFL. These sets of modules were “straight paths” that represented a learner starting at one EFL and remaining at that EFL for each stage of the test. For example, the 2-2-2-2-2-2 path represents a learner who starts the test at Beginning Basic, and remains at that level for the remaining five stages. The 3-3-3-3-3-3 path represents a learner who starts the test at Low Intermediate, and remains at that level for the remaining five stages, etc. This strategy ensured the content specifications would be represented for each EFL. Learners who are routed to different EFLs as they take an exam (i.e., follow a “crooked path”) will take tests that are a combination of the test specifications for the different EFL paths that they travel (see Kaira & Sireci, 2007).
MAPT for Mathematics and Numeracy
In the current MAPT for Math, there are five entry point modules (see Figure II-1). All
modules labeled ‘2’ in Figure 1 measure the Beginning Basic Education EFL, while all modules labeled ‘3’ are targeted to the Low Intermediate EFL. All modules labeled ‘4’ assess students at the High Intermediate EFL, all modules labeled ‘5’ are at the Low Adult Secondary EFL, and lastly, all modules labeled ‘6’ measure student performance at the High Adult Secondary EFL.
There are two parallel panels operational for the MAPT for Math. On each of these
panels, there are six modules in place for each of five EFLs (Beginning Basic Education, Low Intermediate Basic Education, High Intermediate Basic Education, Low Adult Secondary Education, and High Adult Secondary). Across two panels, this results in 12 modules at each of the five EFLs for a grand total of 60 modules for the entire MAPT for Math for fiscal 2009 and beyond.
As described above and illustrated in Figure II-1, across the two parallel panels, there is a 15-item entry-point module (testlet) for each panel at each entry point, which results in 10 15-item entry point modules total. For the modules at stages 2 through 6, across the two panels, there are two 5-item testlets at each EFL at each stage. This results in 10 5-item modules for each EFL, and 50 5-item testlets total for the MAPT for Math (60 modules total).
MAPT for Reading As described above and shown in Figure II-2, in the current MAPT for Reading, there are
four entry points. Low and High Adult Secondary students start at the same entry point2. All modules labeled ‘2’ in Figure 2 measure the Beginning Basic Education EFL, all modules labeled ‘3’ measure the Low Intermediate EFL, and all modules labeled ‘4’ measure High
2 It should be noted there are no High Adult Secondary students at pretest, and so there are only a very few students classified as High Adult Secondary who start at this entry point (i.e., those few students who achieved High Adult Secondary status on a pretest, and came back for a posttest).

12
Intermediate Basic Education EFL. Modules labeled ‘5’ span the Low and High Adult Secondary EFLs, as the content specifications for those two levels are the same. The distinguishing feature between Low Adult and High Adult Secondary levels is the difficulty of the reading items.
There are two parallel panels operational for the MAPT for Reading. On each panel, there are six modules in place for each of four EFL paths (Beginning Basic, Low Intermediate, High Intermediate, and Low/High Adult Secondary Education). As illustrated in Figure II-2, across the two parallel panels, there are 8 modules associated with each of the four entry points, and 40 modules at subsequent stages. Thus, for fiscal 2009 and beyond there is a grand total of 48 modules for the entire MAPT for Reading (8 5-item modules at stage 1, and 40 15-item modules at stages 2 through 6).

13
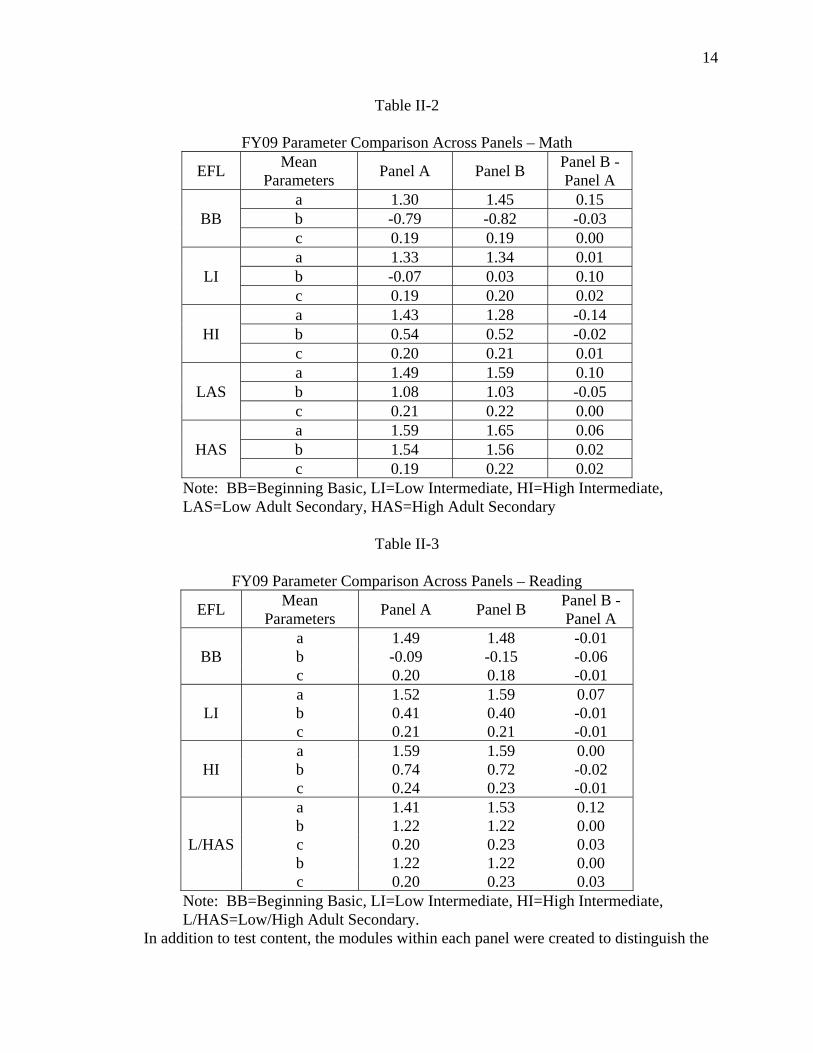
Creating Parallel Panels MAPT paths and panels were constructed to balance both content and psychometric considerations. Each panel was aligned with the test specifications and the panels had relatively minor variations in their content coverage. From the psychometric perspective, the panels were created to balance the information and difficulty levels across panels and between levels. Tables II-2 and II-3 illustrate the average parameter values for each panel across each EFL for Math and Reading, respectively. Each panel was designed to be similar with respect to item difficulty and discrimination. As can be seen in Table II-2, the average item difficulties (b-parameters) were nearly identical across the two panels for each subject (maximum difference of .05 for Math and .06 for Reading) and the average item discriminations (a-parameter) were also very similar (within .15 for Math and .12 for Reading). The average lower asymptote parameters (c-parameters) were also similar across panels (maximum of .02 for Math and .03 for Reading). As is also evident from Tables 10 and 11, the average item difficulty increases as EFL increases
14
Table II-2
FY09 Parameter Comparison Across Panels – Math
EFL Mean Parameters Panel A Panel B Panel B -
Panel A
BB a 1.30 1.45 0.15 b -0.79 -0.82 -0.03 c 0.19 0.19 0.00
LI a 1.33 1.34 0.01 b -0.07 0.03 0.10 c 0.19 0.20 0.02
HI a 1.43 1.28 -0.14 b 0.54 0.52 -0.02 c 0.20 0.21 0.01
LAS a 1.49 1.59 0.10 b 1.08 1.03 -0.05 c 0.21 0.22 0.00
HAS a 1.59 1.65 0.06 b 1.54 1.56 0.02 c 0.19 0.22 0.02
Note: BB=Beginning Basic, LI=Low Intermediate, HI=High Intermediate, LAS=Low Adult Secondary, HAS=High Adult Secondary
Table II-3
FY09 Parameter Comparison Across Panels – Reading
EFL Mean Parameters Panel A Panel B Panel B -
Panel A
BB a 1.49 1.48 -0.01 b -0.09 -0.15 -0.06 c 0.20 0.18 -0.01
LI a 1.52 1.59 0.07 b 0.41 0.40 -0.01 c 0.21 0.21 -0.01
HI a 1.59 1.59 0.00 b 0.74 0.72 -0.02 c 0.24 0.23 -0.01
L/HAS
a 1.41 1.53 0.12 b 1.22 1.22 0.00 c 0.20 0.23 0.03 b 1.22 1.22 0.00 c 0.20 0.23 0.03
Note: BB=Beginning Basic, LI=Low Intermediate, HI=High Intermediate, L/HAS=Low/High Adult Secondary.
In addition to test content, the modules within each panel were created to distinguish the

15
different difficulty levels associated with each EFL. Specifically, we assembled the modules to maximize test information (described in Chapter V) over the midpoint of each EFL interval. Thus, each straight path of modules represents the average difficulty of the items at that EFL and the test specifications for that EFL. Each panel is created in the same manner and so they are parallel with respect to content and difficulty. For each panel, the average difficulty of the items within each EFL is approximately equal, as are the test content specifications.
Routing Examinees Across Stages
During stage 1 of the MAPT, students respond to the 15 items in the first module (testlet). Their responses are scored and an estimate of their proficiency is calculated based on item response theory (IRT). At that point, the student is routed to a stage 2 module that provides the most measurement information about the student’s current proficiency estimate. This strategy is applied at each decision point: module information functions for each module within the subsequent stage are compared and the learner is routed to whichever module yields the most information for their provisional theta estimate (routing is not limited to adjacent modules). For the purpose of routing, provisional IRT proficiency estimates are computed for a student at a given decision (branching) point based on all of their responses up to that point in their test administration. That is, at the end of stage 1, a learner’s proficiency estimate is based on the 15 items taken at stage 1; at the end of stage 2, the learner’s proficiency estimate is based on 20 items (15 at stage 1 + 5 at stage 2, etc.). Upon completion of the entire test (i.e., all six stages), students’ IRT proficiency estimate (and EFL classification) is based on their responses to all 40 scored items.

16
III. Characteristics of Operational Item Banks Distributions of Item Difficulty Figures III.1 and III.2 present the distributions of IRT b-parameters (difficulty parameters) for Math and Reading, respectively, for fiscal 2008. The distributions for all items, as well as separate distributions for each NRS level, are presented. Currently, 3,002 items have been written for the MAPT—1,763 for Math and 1,239 for Reading. However, not all items have been field-tested, and some were deemed not suitable for content or statistical reasons. The total number of operational items for fiscal 2008 is 400 Math items and 320 Reading items.
Figure III.1
0.00
0.05
0.10
0.15
0.20
0.25
‐2.5 ‐2.0 ‐1.5 ‐1.0 ‐0.5 0.0 0.5 1.0 1.5 2.0 2.5
All
Level 2
Level 3
Level 4
Level 5
Level 6
All
Beginning Basic
Low Inter. High Inter. LAS
HAS
Distribution of IRT Difficulty Level: MAPT for Math
y
IRT Difficulty (b-parameter)
Rel
ativ
e Fr
eque
nc

17
Figure III.2
Distribution of IRT Difficulty Level: MAPT for Reading (Fiscal
0.00
0.05
0.10
0.15
0.20
0.25
0.30
0.35
‐2.5 ‐2.0 ‐1.5 ‐1.0 ‐0.5 0.0 0.5 1.0 1.5 2.0 2.5
All
Level 2
Level 3
Item exposure rates Item exposure refers to the number or proportion of examinees to which a test item is administered. On a paper-based test, the item exposure rate is typically 100%; that is, all students who sit for the test take the same items. On an adaptive test, the exposure rates differ depending on where a student begins the test and how s/he is routed through the test. Given the structure of the MAPT (illustrated in Figures II-1 and II-2), items within the modules at the first stage are likely to have higher exposure rates than items administered at the other stages. This greater exposure is due to the fact that all students who begin at a certain EFL will take one of the two stage 1 modules (i.e., the one on Panel A or the one on Panel B). Beginning with the second stage, students can be routed to different modules. It is important to note that there is no overlap of items between Panels A and B and so the maximum exposure for an item on the MAPT is theoretically 50%, although since students start at different entry points, the actual maximum is much lower than that. Students are randomly assigned to a MAPT panel the first time they take the test. If they take the test twice, they will be assigned to the other panel and will not see any of the same items.
We report item exposure information in Tables III-1 through III-4. We present descriptive statistics (mean, median, and standard deviation) for all of the operational items for Math and Reading, respectively. When looking within each EFL, we see average exposure rates between 14 students (Table III-1 for Beginning ABE where we have relatively few students taking the tests in Math) to 375 students (Table III-2 for the Low Intermediate EFL on the Reading test, where we have the most MAPT test takers). Thus, the exposure rates are obviously
IRT Difficulty (b-parameter)
mLevel 4
Level 5
All Beginning Basic
Low Inter.
High Inter. LAS/HAS
Rel
ativ
e

18
influenced by the distribution of students with respect to the EFLs. The last row in each table summarizes the data across all items and EFLs, since many items are taken by students from more than one EFL. For example, the mean exposure for the math items was 748.4 students.
Table III-1
Descriptive Statistics for MAPT for Math Item Exposure (Fiscal 2008)
Level Mean SD Median
Beginning ABE 13.8 20.2 1 Low Intermediate 89.4 104.7 24 High Intermediate 247.4 211.7 249 Low Adult Secondary 274.0 232.2 227 High Adult Secondary 124.0 123.3 74 Total 748.4 388.3 680
Note: Cell entries are in terms of number of students.
Table III-2
Descriptive Statistics for MAPT for Reading Item Exposure (Fiscal 2008)
Level Mean SD Median Beginning ABE 46.7 58.6 9 Low Intermediate 151.6 129.9 148 High Intermediate 374.9 308.5 301 Low Adult Secondary 359.6 363.9 168 High Adult Secondary 142.6 165.4 46 Total 1,075.3 663.9 958
Note: Cell entries are in terms of number of students.
More detailed analysis of item exposure is provided in Tables III-3 (Math) and III-4 (Reading). In these tables we report the number of items with exposure rates within specific intervals determined by (a) the percentage of total test takers, and (b) the percentage of test takers within each EFL. Very few items have overall exposure rates greater than 30%. When exposure is calculated across all students (i.e., across all EFLs) only one math item and 6 reading items had exposures above 30%. When exposures are calculated within EFLs (i.e., conditional exposure), 49 items (13% of the items) had conditional exposures above 30% for the Low Intermediate EFL in Math, and 48 items (14% of the items) had conditional exposures above 30% for the High Adult Secondary EFL in Reading. In general, the statistics provided in Tables III-1 through III-4 indicate both good pool usage and adequate control over item exposure.
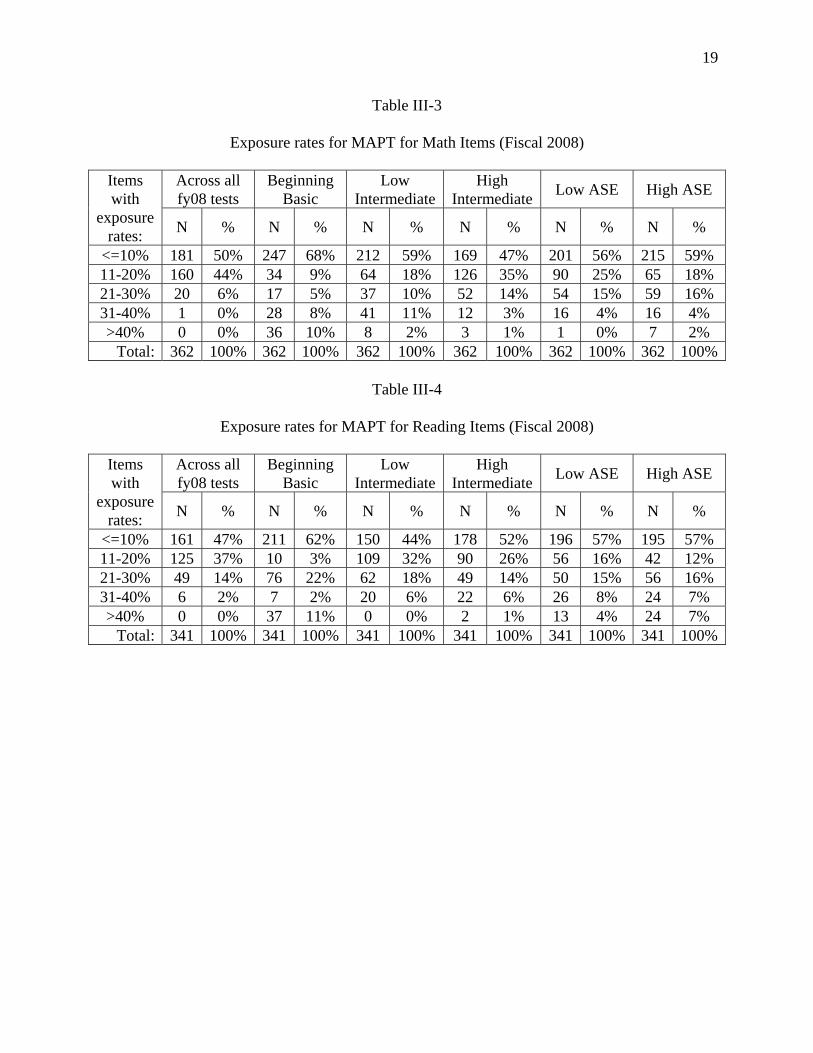
19
Table III-3
Exposure rates for MAPT for Math Items (Fiscal 2008)
Items with
exposure rates:
Across all fy08 tests
Beginning Basic
Low Intermediate
High Intermediate Low ASE High ASE
N % N % N % N % N % N %
<=10% 181 50% 247 68% 212 59% 169 47% 201 56% 215 59% 11-20% 160 44% 34 9% 64 18% 126 35% 90 25% 65 18% 21-30% 20 6% 17 5% 37 10% 52 14% 54 15% 59 16% 31-40% 1 0% 28 8% 41 11% 12 3% 16 4% 16 4% >40% 0 0% 36 10% 8 2% 3 1% 1 0% 7 2%
Total: 362 100% 362 100% 362 100% 362 100% 362 100% 362 100%
Table III-4
Exposure rates for MAPT for Reading Items (Fiscal 2008)
Items with
exposure rates:
Across all fy08 tests
Beginning Basic
Low Intermediate
High Intermediate Low ASE High ASE
N % N % N % N % N % N %
<=10% 161 47% 211 62% 150 44% 178 52% 196 57% 195 57% 11-20% 125 37% 10 3% 109 32% 90 26% 56 16% 42 12% 21-30% 49 14% 76 22% 62 18% 49 14% 50 15% 56 16% 31-40% 6 2% 7 2% 20 6% 22 6% 26 8% 24 7% >40% 0 0% 37 11% 0 0% 2 1% 13 4% 24 7%
Total: 341 100% 341 100% 341 100% 341 100% 341 100% 341 100%

20
IV. Standard Setting: Revising Cut-Scores for the NRS Educational Functioning Levels
A primary purpose of the MAPT is to measure learners’ educational gains for both evaluation of individual learners’ progress and for program accountability. In the National Reporting System (NRS), educational gain is a core outcome measure that is defined by a set of Educational Functioning Levels (EFLs). There are six EFLs defined in the NRS that relate to Mathematics and Reading—Beginning ABE Literacy, Beginning Basic Education, Low Intermediate Basic Education, High Intermediate Basic Education, Low Adult Secondary Education, and High Adult Secondary Education (Division of Adult Education and Literacy (DAEL), 2006). Under the NRS, learners’ educational gains are measured by comparing their pretest EFL with their posttest EFL. Although the Beginning ABE Literacy level is not measured by the MAPT, the tests are designed for all other EFLs and so cut-scores on the MAPT score scale are necessary to demarcate the EFLs for each subject area. The process of establishing cut-scores on a continuous test score scale is called standard setting.
In the MAPT Technical Manual (Sireci et al. 2008) full descriptions of the EFLs and the
standard setting studies that were conducted on the MAPT are provided. In this Supplement, we describe the modifications of the original cut-scores on the MAPT to document the current cut-scores that were implemented in fiscal 2008 and will remain in place for the foreseeable future (i.e., until some point in time where content changes or changes in the NRS EFLs might warrant reconsidering the standards). Modifications were made to the original EFL cut-scores after analyzing measurement precision and impact data on the MAPT after its first year of operational use. The current cut-scores are based on all information gathered on the MAPT to evaluate the validity of the EFL cut-scores. This information includes the outcomes of the standard setting studies (one for math, two for reading), consideration of variability in the standard setting panelists’ judgments, consideration of measurement error, and a desire to maintain roughly equal interval properties on the MAPT score reporting scale across the EFLs.
A comparison of the original MAPT and revised EFL cut-scores are presented in Tables
IV-1 and IV-2 for Reading, and Math, respectively. Confidence intervals for the original cut-scores are also presented. For Reading, two cut-score intervals are reported. The first represents the cut-scores (and their standard errors) based on the original standard setting study conducted in 2006 (see Sireci et al., 2006). The results from this study became the operational standards that were originally used for the MAPT for Reading. The second set of cut-scores is based on a follow-up standard setting study that was conducted in 2007 (see Sireci et al., 2008). Although these standards were never implemented, the results were used to evaluate the original standards and to inform the updated standards implemented in fiscal 2008.
As is evident in Tables IV-1 and IV-2, the revised cut-scores are within the 68%
confidence intervals of the original cut-scores for all EFLs except the Math Low/High Adult secondary cut-score, which used a 98% confidence interval.

21
Table IV-1
Comparing Original and Revised Cut-Scores: MAPT for Reading
NRS EFL Boundary Original Cut-Score Confidence Interval
Cut-Scores From June 2007 Study
Current Cut-Score Implemented FY08
Beginning Basic/Low Intermediate -.370 < -.170 < .030 -.336 < -.146 < .044 -0.36
Low Intermediate/High Intermediate .188 < .378 < .568 .404 < .554 < .704 0.24
High Intermediate/Low Adult Secondary .748 < .938 <1.129 1.129 < 1.329 < 1.529 0.84
Low Adult Secondary /High Adult Secondary 1.318 < 1.538 < 1.758 1.453 <1.703 < 1.953 1.45
Notes: Confidence intervals were determined by adding and subtracting one conditional standard error of measurement. The original cut-scores are the midpoints of each confidence interval.
Table IV-2
Comparing Original and Revised Cut-Scores: MAPT for Math
NRS EFL Boundary Original Cut-Score Confidence Interval
Current Cut-Score Implemented FY08
Beginning Basic/Low Intermediate -1.335 < -1.115 < -.895 -0.53
Low Intermediate/High Intermediate -.456 < -.228 < 0.00 0.00
High Intermediate/Low Adult Secondary .326 < .526 < .726 0.52
Low Adult Secondary /High Adult Secondary .969 < 1.349 < 1.729 1.04
Notes: Confidence intervals were determined by adding and subtracting one conditional standard error of measurement except for the Low Adult/High Adult Secondary cut-score where two standard errors were used. The original cut-scores are the midpoints of the confidence interval.
One concern about the original cut-scores set on the MAPT for Math and MAPT for
Reading in 2006 was that the cut-scores led to unequal score intervals between the EFLs, which was evidenced by non-linearity in the theta-to-scale score transformation. Although the 100-point intervals on the MAPT score scale made the EFLs look equally spaced, the cut-scores on the theta scale were not evenly spaced and so the improvements in proficiency needed to move from one EFL to the next varied at different points along the theta score scale. That nonlinearity could have an undesirable effect on students moving from one EFL to another. The revised cut-scores reduced the nonlinearity in the theta-to-scale score transformations. Tables IV.3 and IV.4 compare the EFL interval widths of the original and revised cut-scores, for Reading and Math,

22
respectively. Clearly, the revised cut-scores represent nearly equal intervals. The theta-to-raw score transformations using the original and revised cut-scores are presented in Figures IV.1 (Reading) and IV.2 (Math). These figures contrast the nonlinearity of the original cut-scores with the linear transformations based on the revised cut-scores.
Table IV.3
Comparison of EFL Interval Widths: Original and Revised MAPT for Reading Cut-Scores
MAPT Score Original Cut-Scores Revised Cut-Scores Cut-Score Distance to Next Cut Cut-Score Distance to Next Cut
200 -0.87 .71 -0.96 .60 300 -0.16 .71 -0.36 .60 400 0.55 .76 0.24 .60 500 1.31 .39 0.84 .61 600 1.70 .40 1.45 .60 700 2.10 N/A 2.05 N/A
Table IV.4
Comparison of EFL Interval Widths: Original and Revised MAPT for Math Cut-Scores
MAPT Score Original Cut-Scores Revised Cut-Scores Cut-Score Distance to Next Cut Cut-Score Distance to Next Cut
200 -2.00 .88 -1.05 .52 300 -1.12 .89 -0.53 .53 400 -0.23 .76 0.00 .52 500 0.53 .82 0.52 .52 600 1.35 .82 1.04 .53 700 2.17 N/A 1.57 N/A

23
Figure IV.1
Original and Revised Theta-to-MAPT Scale Transformations for Reading
-0.87
-0.16
0.55
1.31
1.70
2.10
-0.96
-0.36
0.24
0.84
1.45
2.05
0
100
200
300
400
500
600
700
-1.50 -1.00 -0.50 0.00 0.50 1.00 1.50 2.00 2.50
theta
MA
PT
Original Cut-ScoresRevised Cut-Scoresproficiency distribution

24
Figure IV.2
Original and Revised Theta-to-MAPT Scale Transformations for Math
1.35
2.171.57
-1.12
-0.23
0.53
1.04
0.00
-0.53
-1.05
0.52
0
100
200
300
400
500
600
700
-2.00 -1.50 -1.00 -0.50 0.00 0.50 1.00 1.50 2.00 2.50
theta
MA
PT
Original Cut-ScoresRevised Cut-Scoresproficiency distribution
Summary of MAPT Standard Setting: Fiscal 2008 and Beyond To determine the most appropriate points along the MAPT score scale to set the boundaries for the NRS EFLs, three separate standard setting studies were conducted (2 for Reading, one for Math, see Sireci et al., 2006, 2008), consequences data from the first year of operational administration were considered, the standard errors from the standard setting studies, and the conditional standard errors of measurement at each original EFL cut-score were considered. The widths of the score intervals between cut-scores on the theta scale were also considered. Based on all these data, it was decided to revise the cut-scores to achieve more equality of intervals between the EFLs, while staying true to the data obtained from the standard setting studies.

25
V. Measurement Precision
In IRT, the classical concept of reliability is extended and replaced by the concept of test information. Test information takes into account the lack of uniformity in reliability across the proficiency scale. As information increases, measurement precision increases. For the 3PL IRT model used for the MAPT, item information, which represents the contribution an item makes to measurement precision at various points along the proficiency scale, is calculated using
2)ˆ(7.1)ˆ(7.1
2
1
)1(89.2)(
⎥⎦⎤
⎢⎣⎡ +⎥⎦⎤
⎢⎣⎡ +
−=
−−− iiii babai
iii
eec
caI
θθθ
[V.1],
and test information is calculated as
[V.2] )()(
1θθ ∑
==
n
iiII
where )(θI is the information function, θ is examinee proficiency, ai, bi, and ci are the IRT discrimination, difficulty, and pseudo-guessing parameters, respectively, for item i, n is the test length, D is a scaling constant equal to 1.7, and e is the base of the natural logarithm (Hambleton, Swaminathan, & Rogers, 1991). Given a fixed length test and a fixed ai and ci, information is maximized when item difficulty (bi ) equals proficiency (θ ). It is this very property that makes adaptive testing so attractive: by targeting items to learners’ proficiencies, measurement information is maximized.
As described earlier, the concept of a test form does not really apply to MST, but we can think of the paths learners travel when taking the MAPT as forms in some sense. The most important paths, and the most popular (Kaira & Sireci, 2007), are the straight paths where a learner starts at one level and remains at that level throughout the exam. These paths are described as important because they reflect the content specifications designed for learners at that level and are influential in assembling the panels. Thus, it makes sense to evaluate the test information functions for these paths. Test Information Functions The test information curves for the current MAPT exams (FY09) are presented in Figures V.1 and V.2 (Math) and Figures V.3 and V.4 for Reading. Separate figures are provided for each panel in each subject area. There is a separate information curve for the straight path at each EFL. An improvement of the current MAPT over that in FY08 is better separation of the test information functions for each EFL path.

26
Figure V.1
Test Information Curves for MAPT for Math: Panel A (Fiscal 2009)
Figure V.2
Test Information Curves for MAPT for Math: Panel B (Fiscal 2009)

27
Figure V.3
Test Information Curves for MAPT for Reading: Panel A (Fiscal 2009)
Figure V.4
Test Information Curves for MAPT for Reading: Panel B (Fiscal 2009)

28
Conditional Standard Error of Estimation Conditional standard error refers to estimates of measurement error at specific points
along the score scale. Test information and conditional standard errors of estimation ( SE()θ ) )
are inversely related as
( )( )21θ
θSE
I = [VI.3]
where ( )θSE is standard error of estimation for a given examinee proficiency estimate )θ .
Figures V.5 (a-c) and V.6 (a-c) provide scatterplots for Mathematics and Numeracy and Reading, respectively, that illustrate the standard errors of estimation for the MAPT broken out by administration. For each subject area, the first scatterplot shows the standard errors for first-time test takers, the second scattterplot is data from examinees’ second MAPT administration, and the third scatterplot contains information about standard errors from the third time examinees’ took the test. The standard errors are generally low for the second and third test administrations—the vast majority are below 0.30. For the first test administration, most are below 0.30, but there are many above that threshold, particularly at the upper end. This increased error could be due to misplacement of students with respect to starting point the first time they take the MAPT. It is interesting to note that the estimates of error decrease for subsequent administrations of the MAPT in both subject areas.

29
Figure V.5a
Standard Error of Estimation vs. Proficiency (Mathematics and Numeracy, First Administration)
Figure V.5b
Standard Error of Estimation vs. Proficiency (Mathematics and Numeracy, Second Administration)

30
Figure V.5c
Standard Error of Estimation vs. Proficiency (Mathematics and Numeracy, Third Administration)
Figure V.6a
Standard Error of Estimation vs. Proficiency (Reading, First Administration)

31
Figure V.6b
Standard Error of Estimation vs. Proficiency (Reading, Second Administration)
Figure V.6c
Standard Error of Estimation vs. Proficiency (Reading, Third Administration)

32
Decision Consistency and Decision Accuracy In the Technical Manual (Version 2) for the MAPT (Sireci et al., 2008), we provided estimates of decision consistency and decision accuracy for fiscal year 2007 (FY07). Estimates of decision consistency and decision accuracy for fiscal year 2008 (FY08) are provided in Tables V.1-2 (Math) and Tables V.3-4 (Reading). Separate estimates are not provided for students who took straight or crooked paths. Students may take any number of different paths and there is no theoretical advantage from a measurement perspective of taking a straight or mixed-path route The decision consistency and accuracy estimates reported below are commonly accepted indices of classification consistency and accuracy that are used by several test publishers (e.g., Pearson, Measured Progress) and meet the recommendations of the Standards for Educational and Psychological Testing (AERA et al., 1999).
The decision consistency results presented in Tables V.1 and V.3 are estimates of the percentages of examinees who would be classified into the same EFL upon repeated testing and so they meet the requirements of this AERA et al. standard. The results in Tables V.2 and V.4 go beyond the standard by providing information regarding the accuracy of these classifications. Sireci et al. (2008) explain how these consistency and accuracy estimates are calculated using the procedures developed by Rudner (2001, 2004) and Li (2006). All are based on item response theory, which is the item calibration and examinee scoring technology underlying the MAPT.
The decision consistency results are presented in Tables V.1 (Math) and V.3 (Reading). The main diagonal of each table reports the proportion of learners consistently classified into the same EFL (.84 for Math and .85 for Reading). Kappa coefficients (percent correctly classified corrected for chance) are also reported, as are the proportions not consistently classified. Across both subject areas, all inconsistent classifications are adjacent to one another. The decision accuracy results are reported in Table V.2 (Math) and V.4 (Reading). Both estimates are high (.89 for Math and .90 for Reading) and the off-diagonal elements are close to zero.

33
Table V.1
Decision Consistency Estimates for MAPT for Math
Hypothetical (Parallel) Form
Actual Form Beginning
Basic Low
Intermediate High
Intermediate
Low Adult Secondary
High Adult Secondary
Total
Beginning Basic .159 .019 .000 .000 .000 .177 Low Intermediate .019 .188 .025 .000 .000 .232 High Intermediate .000 .025 .209 .023 .000 .256
Low Adult Secondary .000 .000 .023 .147 .015 .184 High Adult Secondary .000 .000 .000 .015 .136 .150
Total .177 .232 .256 .184 .150 1.000 DC Estimate .838
Kappa .796
Table V.2
Decision Accuracy Estimates for MAPT for Math
True Score
Observed Score Beginning
Basic Low
Intermediate High
Intermediate
Low Adult Secondary
High Adult Secondary
Total
Beginning Basic .164 .014 .000 .000 .000 .177 Low Intermediate .013 .202 .018 .000 .000 .232 High Intermediate .000 .018 .223 .015 .000 .256
Low Adult Secondary .000 .000 .017 .158 .010 .184 High Adult Secondary .000 .000 .000 .011 .139 .150
Total .176 .233 .257 .184 .149 1.000 DA Estimate .886
False + .056 False - .058

34
Table V.3
Decision Consistency Estimates for MAPT for Reading
Hypothetical (Parallel) Form
Actual Form Beginning
Basic Low
Intermediate High
Intermediate
Low Adult Secondary
High Adult Secondary
Total
Beginning Basic .336 .024 .000 .000 .000 .360 Low Intermediate .024 .187 .024 .000 .000 .235 High Intermediate .000 .024 .163 .017 .000 .204
Low Adult Secondary .000 .000 .017 .100 .010 .127 High Adult Secondary .000 .000 .000 .010 .065 .075
Total .360 .235 .204 .127 .075 1.000 DC Estimate .852
Kappa .803
Table V.4
Decision Accuracy Estimates for MAPT for Reading
True Score
Observed Score Beginning
Basic Low
Intermediate High
Intermediate
Low Adult Secondary
High Adult Secondary
Total
Beginning Basic .343 .017 .000 .000 .000 .360 Low Intermediate .017 .202 .016 .000 .000 .235 High Intermediate .000 .017 .176 .012 .000 .204
Low Adult Secondary .000 .000 .013 .108 .006 .127 High Adult Secondary .000 .000 .000 .007 .067 .075
Total .360 .235 .205 .127 .073 1.000 DA Estimate .895
False + .051 False - .054

35
VI. Validity Studies According to the Standards for Educational and Psychological Testing (AERA, APA, NCME, 1999), “validity refers to the degree to which evidence and theory support the interpretations of test scores entailed by proposed uses of tests” (p. 9). In other words, validity is the extent to which the inferences (interpretations) derived from test scores are justifiable from both scientific and equity perspectives. For decisions based on test scores to be valid, the use of a test for a particular purpose must be supported by theory and empirical evidence, and biases in the measurement process must be ruled out. The previous MAPT Technical Manuals (Sireci et al., 2006, 2008) described several studies that provided comprehensive validity evidence for the use of the MAPT for its intended purposes. These studies represented validity evidence based on (a) test content, (b) internal structure, (c) relations to other variables, and (d) response processes. In this Supplement we provide information on some more recent studies that were conducted to address specific aspects of the MAPT testing program. These special studies provide data on important issues such as the frequency of test administrations that span multiple sittings, an analysis of the different “paths” examinees traveled while taking the test, and analyses of item and test response times. Test Sessions Analysis
In April 2007, a policy decision was implemented stating that students not completing a MAPT test within a single test session could have a 15-day period in which to complete the test. Prior to that, teachers needed to request a time reset from CESD if a student could not finish a MAPT test in one sitting.
To understand how this policy affected MAPT administrations, a simple frequency analysis was run. For each subject area (Reading or Math), tests completed in one day or spanning across more than one day were identified.
In Math, the time periods examined included the period before the policy was implemented, and the time period after the policy was implemented (reflecting a consistent test length and reflecting the three-stage and six-stage test structure). There was also one time period where no pilot items were included on the test and so separate analyses were run for the 40 and 45-item (40 scored items plus 5 pilot items) test administrations.
In Reading, there was a period of time where the tests included 10 pilot items as opposed to 5 pilot items. Thus, in addition to running the analyses before and after the multi-day test completion policy was implemented, we also broke the analyses out by 50-item (40 scored items and 10 pilot items) and 45-item (40 scored items and 5 pilot items) tests. In the time period after the policy was implemented, the use of multi-day testing was examined for a) the 45-item three-stage test, b) the 50-item three-stage test, the 50-item six stage test, and the 45-item six stage test (Spring 2008 panels and Fall 2008 panels).
The results in Table VI.1 suggest that for Math, with the change from 40 to 45 items, the percent of tests taken spanning more than one sitting increased slightly (from about 5% to about

36
8%). However, with the implementation of the six-stage structure, the rate of multiple test session appears to be decreasing.
The results for Reading are given in Table VI.2. Again, as test length increased, the rate of multi-session test administrations increased, and was particularly pronounced with the implemented of the six-stage test structure when it was 50 items long. In February of 2008, however, the number of pilot items was reduced from 10 to 5 in Reading, and there is subsequently a corresponding drop in the rate of multi-day test sessions.
Table VI.1
Descriptive Statistics for Test Sessions (MAPT for Math)
Date Range Test
Length (Items)
Test Structure Total N
Tests Taken on One Day
Tests Taken on More than
One Day N % N %
7/1/06 - 11/19/06 40 Three stage 2499 2365 94.6 134 5.4 11/20/06 - 4/23/07* 45 Three stage 3570 3280 91.9 290 8.1 4/23/07-12/22/07 45 Three stage 5025 4625 92.0 400 8.0 12/23/07-8/22/08 45 Six stage 3713 3453 93.0 260 7.0 8/23/08 – 6/30/09 45 Six stage 7229 6616 91.5 613 8.5
* Through this date, teachers needed to request a reset from CESD if students were unable to finish a MAPT test at a single sitting. Starting on 4/23/07, the policy on resets was changed so that tests completed within a 15-day window to be considered valid.
Table VI.2
Descriptive Statistics for Test Sessions (MAPT for Reading)
Date Range Test
Length (items)
Test Structure Total N
Tests Taken on One Day
Tests Taken on More than
One Day N % N %
7/1/06-3/04/07 40 Three stage 6319 6082 96.2 237 3.8 3/05-07-4/22/07* 45 Three stage 1597 1492 93.4 105 6.6 4/23/07-12/22/07 50 Three stage 6349 5677 89.4 672 10.6 12/23/07-2/27/08 50 Six stage 1364 1184 86.8 180 13.2 2/18/08 – 8/22/08 45 Six stage 3514 3136 89.2 378 10.8 8/23/08 – 6/30/09 45 Six stage 8394 7476 89.1 918 10.9 * Through this date, teachers needed to request a reset from CESD if students were unable to finish a MAPT test at a single sitting. Starting on 4/23/07, the policy on resets was changed so that tests completed within a 15-day window to be considered valid.

37
Analysis of “Path” Frequencies
The frequencies for the various paths examinees took in Fiscal 2008 and Fiscal 2009 (both after the six-stage version of the MAPT was initiated) are presented in Tables VI.3 and VI.4 (Math) and VI.5 and VI.6 (Reading). The summaries presented in these tables provide the frequencies for the “straight” paths (i.e., paths where a student starts at an EFL and remains in that EFL for the entire test) and the frequencies and percentages of paths that span two or more EFLs. For example, “adjacent” paths represent paths where a student starts at one EFL and is routed to only one adjacent level at some point during the subsequent 5 stages. These adjacent paths are not all the same, but it is sensible to combine them to determine the numbers and proportions of students who are experiencing moderate versus large changes in item difficulty as they take the MAPT. Although the data summarized in Tables VI.3, VI.4, VI.5, and VI.6 are interesting, we note that there is no preference for a straight, crooked, or narrow path. The multistage structure is designed to provide the best measurement of a student’s proficiency based on how they answer items during each stage of the test; it is not designed to route examinees in any linear or nonlinear pattern. For the MAPT for Math, approximately 12% of FY09 tests completed followed a “straight” path, and 58% involved adjacent modules only (for example, only Beginning Basic and Low Intermediate, or only High Intermediate and Low Adult Secondary). This accounts for 70% of FY09 MAPT for Math six-stage tests. Paths including modules from three levels represented 27% of tests taken, and just 3% of tests involved modules from four levels. Less that 1% of tests administered included modules from five levels. Only 7% of FY08 tests can be described as representing non-adjacent paths (where at least one module selected for administration was not adjacent to a previous module). For the MAPT for Reading, approximately 20% of the tests completed in FY09 followed “straight” paths. About 58% of tests completed involved adjacent modules only (e.g., examinees saw only Beginning Basic and Low Intermediate modules, or only Low Intermediate and High Intermediate modules). These two groups (straight and adjacent) account for 78% of MAPT for Reading tests administered in FY09. Of the remainder, approximately 16% followed paths involving three adjacent MAPT levels (for example, Beginning Basic, Low Intermediate, and High Intermediate) and only 1% of tests administered included modules from four levels. Lastly, just 5% of MAPT for Reading tests followed what might be described as non-adjacent paths.

38
Table VI.3
Summary of 6-Stage MST Paths for MAPT for Math, FY08
Paths N %
Straight Paths
L2-L2-L2-L2-L2-L2 45 1% L3-L3-L3-L3-L3-L3 94 3% L4-L4-L4-L4-L4-L4 216 6% L5-L5-L5-L5-L5-L5 228 7% L6-L6-L6-L6-L6-L6 39 1%
Total 622 18%
Adjacent Paths
L2 and L3 modules only 212 6% L3 and L4 modules only 539 22% L4 and L5 modules only 811 24% L5 and L6 modules only 427 12%
Total 2,189 64%
Paths Across 3 Levels L3, L4, and L5 modules 142 4% L4, L5, and L6 modules 142 4%
Total 284 8%
Paths Across 4 Levels L2, L3, L4, and L5 modules 60 2% L3, L4, L5, and L6 modules 14 <1%
Total 74 2%
Paths Across 5 Levels L2, L3, L4, L5, and L6 modules 3 <1%
Total 3 <1% Other (non-adjacent) paths
Total 250 7%
Total 3,422 100% Notes: L2 = Beginning Basic; L3 = Low Intermediate; L4 = High Intermediate; L5 = Low Adult Secondary; L6 = High Adult Secondary.

39
Table VI.4
Summary of 6-Stage MST Paths for MAPT for Math, FY09
Paths N %
Straight Paths
L2-L2-L2-L2-L2-L2 256 4% L3-L3-L3-L3-L3-L3 208 3% L4-L4-L4-L4-L4-L4 218 3% L5-L5-L5-L5-L5-L5 131 2% L6-L6-L6-L6-L6-L6 36 0.5%
Total 849 12%
Adjacent Paths
L2 and L3 modules only 1225 17% L3 and L4 modules only 1445 20% L4 and L5 modules only 985 14% L5 and L6 modules only 506 7%
Total 4161 58%
Paths Across 3 Levels
L2, L3, and L4 modules 575 8% L3, L4, and L5 modules 610 8% L4, L5, and L6 modules 322 4%
Total 1507 21%
Paths Across 4 Levels L2, L3, L4, and L5 modules 180 2% L3, L4, L5, and L6 modules 43 1%
Total 223 3%
Paths Across 5 Levels L2, L3, L4, L5, and L6 modules 3 .04%
Total 3 .04% Other (non-adjacent) paths
Total 486 7%
Totals 7229 100% Notes: L2 = Beginning Basic; L3 = Low Intermediate; L4 = High Intermediate; L5 = Low Adult Secondary; L6 = High Adult Secondary.

40
Table VI.5
Summary of 6-Stage MST Paths for MAPT for Reading, FY08
Paths N %
Straight Paths
L2-L2-L2-L2-L2-L2 182 4% L3-L3-L3-L3-L3-L3 261 6% L4-L4-L4-L4-L4-L4 0 0% L5-L5-L5-L5-L5-L5 313 7%
Total 756 17%
Adjacent Paths
L2 and L3 modules only 690 15% L3 and L4 modules only 735 16% L4 and L5 modules only 946 21%
Total 2,370 52%
Paths Across 3 Levels L2, L3, and L4 modules 154 3% L3, L4, and L5 modules 818 18%
Total 971 21%
Paths Across 4 levels L2, L3, L4, and L5 modules 86 2% Total 86 2%
Other (non-adjacent) paths Total 356 8% Totals 4,539 100% Notes: L2 = Beginning Basic; L3 = Low Intermediate; L4 = High Intermediate; L5 = Low/High Adult Secondary.

41
Table VI.6
Summary of 6-Stage MST Paths for MAPT for Reading, FY09
Paths N %
Straight Paths
L2-L2-L2-L2-L2-L2 614 7% L3-L3-L3-L3-L3-L3 204 2% L4-L4-L4-L4-L4-L4 510 6% L5-L5-L5-L5-L5-L5 319 4%
Total 1647 20%
Adjacent Paths
L2 and L3 modules only 1234 15% L3 and L4 modules only 1751 21% L4 and L5 modules only 1889 23%
Total 4874 58%
Paths Across 3 Levels L2, L3, and L4 modules 627 7% L3, L4, and L5 modules 754 9%
Total 1381 16%
Paths Across 4 levels L2, L3, L4, and L5 modules 72 1% Total 72 1%
Other (non-adjacent) paths Total 420 5% Totals 8394 100%
Notes: L2 = Beginning Basic; L3 = Low Intermediate; L4 = High Intermediate; L5 = Low/High Adult Secondary.
Test and Item Response Time Analyses An analysis of how long it takes adult learners to respond to MAPT items provides some insight into how they experience the test and how long they take to complete an assessment. In this section, we provide some descriptive statistics and graphical displays describing average amounts of time learners spent on MAPT items and the test as a whole. A complicating issue in displaying these data is that different numbers of pilot items have been used over time, and so we provide an historical analysis by breaking the results out by different time periods. Another factor that we investigated was the change in the MAPT test delivery structure from a 3-stage test prior to December 2007, to a six-stage test after that time period. Therefore, we also break the results out by this design feature. The results for the MAPT for Reading are provided first, followed by the results for the MAPT for Math.
Reading
Provided below are descriptive statistics for test response times observed on the MAPT for Reading since its inception in July of 2006. These results reflect the following time periods:
• 7/1/06-3/4/07 (three stage test with no pilot items) • 3/5/07-4/22/07 (three stage test with 5 pilot items) • 4/23/07-12/22/07 (three stage test with 10 pilot items) • 12/23/07-2/17/08 (six stage test with 10 pilot items)

42
• 2/18/08-8/22/08 (six stage test with 5 pilot items) • 8/23/08- 6/30/09 (six stage test with 5 pilot items, new panels)
For each time period, the overall mean and median response time is provided. Response time
reported here is for all items (operational and pilot items), operational items only, and pilot items only, to help understand the differences in response time observed and how different parts of the test contribute to total test time.
In general terms, as shown in Table VI.7 the total administration time for the MAPT for Reading increased with the addition of 5 and then 10 pilot items, and hit a maximum with the implementation of the six-stage test structure. Between December 2007 and February 2008 it should be noted that pilot items were taking approximately 25 minutes to complete on average. However, since the reduction in pilot items in February 2008, the administration time has decreased, and a large decrease in time spent on pilot items can be seen. At present, the operational items are being completed in slightly more than an hour in the six-stage test structure, but the total response time for pilot items has decreased considerably.
The information in Tables VI.7-13 reflects the breakdown of response time by student performance level for each of the time periods listed above. Figures VI.1 through VI.7 are bar charts of the median response times.
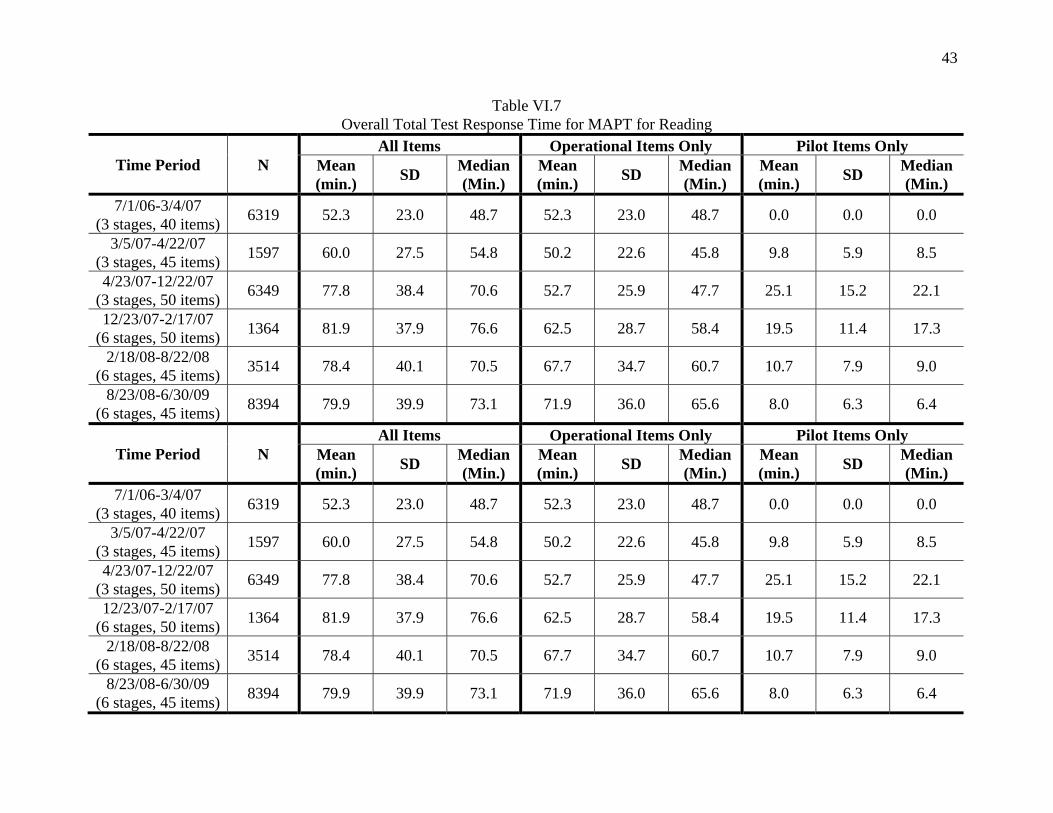
43
Table VI.7 Overall Total Test Response Time for MAPT for Reading
Time Period N All Items Operational Items Only Pilot Items Only
Mean (min.) SD Median
(Min.) Mean (min.) SD Median
(Min.) Mean (min.) SD Median
(Min.) 7/1/06-3/4/07
(3 stages, 40 items) 6319 52.3 23.0 48.7 52.3 23.0 48.7 0.0 0.0 0.0
3/5/07-4/22/07 (3 stages, 45 items) 1597 60.0 27.5 54.8 50.2 22.6 45.8 9.8 5.9 8.5
4/23/07-12/22/07 (3 stages, 50 items) 6349 77.8 38.4 70.6 52.7 25.9 47.7 25.1 15.2 22.1
12/23/07-2/17/07 (6 stages, 50 items) 1364 81.9 37.9 76.6 62.5 28.7 58.4 19.5 11.4 17.3
2/18/08-8/22/08 (6 stages, 45 items) 3514 78.4 40.1 70.5 67.7 34.7 60.7 10.7 7.9 9.0
8/23/08-6/30/09 (6 stages, 45 items) 8394 79.9 39.9 73.1 71.9 36.0 65.6 8.0 6.3 6.4

44
Time Period N All Items Operational Items Only Pilot Items Only
Mean (min.) SD Median
(Min.) Mean (min.) SD Median
(Min.) Mean (min.) SD Median
(Min.) 7/1/06-3/4/07
(3 stages, 40 items) 6319 52.3 23.0 48.7 52.3 23.0 48.7 0.0 0.0 0.0
3/5/07-4/22/07 (3 stages, 45 items) 1597 60.0 27.5 54.8 50.2 22.6 45.8 9.8 5.9 8.5
4/23/07-12/22/07 (3 stages, 50 items) 6349 77.8 38.4 70.6 52.7 25.9 47.7 25.1 15.2 22.1
12/23/07-2/17/07 (6 stages, 50 items) 1364 81.9 37.9 76.6 62.5 28.7 58.4 19.5 11.4 17.3
2/18/08-8/22/08 (6 stages, 45 items) 3514 78.4 40.1 70.5 67.7 34.7 60.7 10.7 7.9 9.0
8/23/08-6/30/09 (6 stages, 45 items) 8394 79.9 39.9 73.1 71.9 36.0 65.6 8.0 6.3 6.4
Table VI.8 Total Test Response Time for MAPT for Reading: 7/1/06-3/04/07
(3 Stage Test, test length=40 items)
Students Scoring in Level N
All Items Operational Items Only Pilot Items Only Mean (min.) SD Median
(Min.) Mean (min.) SD Median
(Min.) Mean (min.) SD Median
(Min.) 200-299 476 57.9 28.4 55.0 57.9 28.4 55.0 0.0 0.0 0.0 300-399 1178 59.5 25.8 56.5 59.5 25.8 56.5 0.0 0.0 0.0 400-499 1920 55.6 23.0 52.4 55.6 23.0 52.4 0.0 0.0 0.0 500-599 2041 49.0 19.1 45.9 49.0 19.1 45.9 0.0 0.0 0.0 600-700 704 37.2 14.7 34.6 37.2 14.7 34.6 0.0 0.0 0.0 Overall 6319 52.3 23.0 48.7 52.3 23.0 48.7 0.0 0.0 0.0
Table VI.9

45
Total Test Response Time for MAPT for Reading: 3/05/07-4/22/07 (3 Stage Test, test length=45 items)
Students Scoring in Level N
All Items Operational Items Only Pilot Items Only Mean (min.) SD Median
(Min.) Mean (min.) SD Median
(Min.) Mean (min.) SD Median
(Min.) 200-299 101 65.4 31.7 64.2 54.3 26.0 54.1 11.2 6.7 10.0 300-399 247 73.5 34.3 72.0 60.5 28.4 58.5 12.9 7.2 11.9 400-499 496 62.7 29.0 57.0 52.6 23.7 47.3 10.1 6.3 8.9 500-599 549 55.7 20.8 52.2 47.1 17.3 44.7 8.7 4.4 7.6 600-700 204 45.8 17.8 42.4 38.2 14.7 35.9 7.6 3.9 6.9 Overall 1597 60.0 27.5 54.8 50.2 22.6 45.8 9.8 5.9 8.5
Table VI.10 Total Test Response Time for MAPT for Reading: 4/23/07-12/22/07
(3 Stage Test, test length=50 items)
Students Scoring in Level N
All Items Operational Items Only Pilot Items Only Mean (min.) SD Median
(Min.) Mean (min.) SD Median
(Min.) Mean (min.) SD Median
(Min.) 200-299 356 88.0 45.0 83.9 57.8 27.5 55.5 30.2 22.4 25.5 300-399 1032 90.2 44.0 85.4 60.5 29.6 56.5 29.7 18.2 26.6 400-499 2077 81.9 39.3 76.4 56.0 26.7 51.7 25.9 15.2 23.4 500-599 2094 73.8 33.5 67.2 50.4 23.0 45.5 23.4 12.5 21.3 600-700 790 56.8 24.8 52.5 37.9 16.3 35.2 18.9 9.8 17.3 Overall 6349 77.8 38.4 70.6 52.7 25.9 47.7 25.1 15.2 22.1

46
Table VI.11 Total Test Response Time for MAPT for Reading: 12/23/07-2/17/08
(6 Stage Test, test length = 50 items)
Students Scoring in Level N
All Items Operational Items Only Pilot Items Only Mean (min.) SD Median
(Min.) Mean (min.) SD Median
(Min.) Mean (min.) SD Median
(Min.) 200-299 58 69.2 40.9 69.4 54.2 30.1 56.2 15.0 12.3 12.8 300-399 171 88.4 37.7 84.8 68.2 29.7 64.3 20.2 10.8 19.2 400-499 539 84.9 38.4 80.4 63.7 28.8 60.5 21.2 12.1 19.4 500-599 428 80.6 36.9 72.7 61.8 27.6 55.9 18.8 10.9 16.7 600-700 168 73.7 36.0 68.7 57.2 28.3 52.9 16.4 8.8 14.4 Overall 1364 81.9 37.9 76.6 62.5 28.7 58.4 19.5 11.4 17.3
Table VI.12 Total Test Response Time for MAPT for Reading: 2/18/08-8/22/08
(6 Stage Test, test length = 45 items)
Students Scoring in Level N
All Items Operational Items Only Pilot Items Only Mean (min.) SD Median
(Min.) Mean (min.) SD Median
(Min.) Mean (min.) SD Median
(Min.) 200-299 142 82.7 49.7 76.0 73.7 45.4 66.6 8.9 6.8 7.8 300-399 472 90.4 45.3 87.3 79.1 39.5 77.8 11.2 8.0 9.5 400-499 1285 82.0 41.7 75.0 70.6 35.9 64.4 11.4 8.4 9.6 500-599 1145 74.3 35.7 67.3 63.9 30.5 57.8 10.4 7.6 8.7 600-700 470 65.1 31.0 59.8 56.0 26.1 51.4 9.1 6.7 8.0 Overall 3514 78.4 40.1 70.5 67.7 34.7 60.7 10.7 7.9 9.0
47
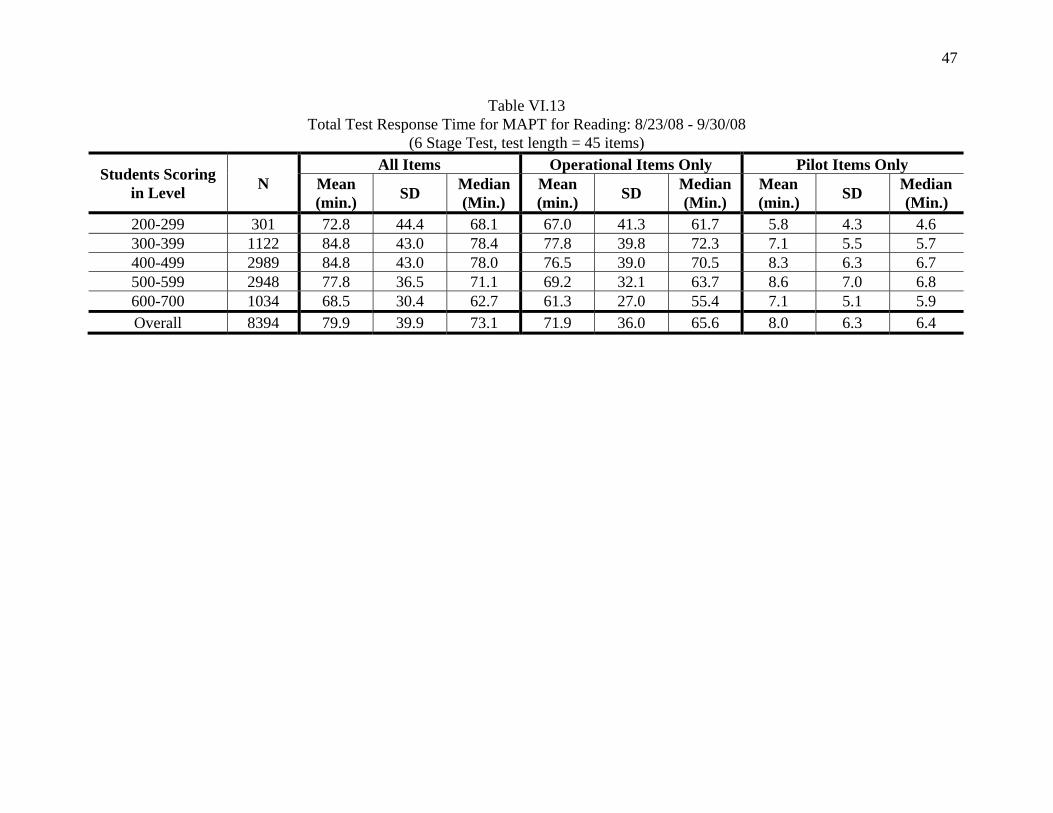
Table VI.13 Total Test Response Time for MAPT for Reading: 8/23/08 - 9/30/08
(6 Stage Test, test length = 45 items)
Students Scoring in Level N
All Items Operational Items Only Pilot Items Only Mean (min.) SD Median
(Min.) Mean (min.) SD Median
(Min.) Mean (min.) SD Median
(Min.) 200-299 301 72.8 44.4 68.1 67.0 41.3 61.7 5.8 4.3 4.6 300-399 1122 84.8 43.0 78.4 77.8 39.8 72.3 7.1 5.5 5.7 400-499 2989 84.8 43.0 78.0 76.5 39.0 70.5 8.3 6.3 6.7 500-599 2948 77.8 36.5 71.1 69.2 32.1 63.7 8.6 7.0 6.8 600-700 1034 68.5 30.4 62.7 61.3 27.0 55.4 7.1 5.1 5.9 Overall 8394 79.9 39.9 73.1 71.9 36.0 65.6 8.0 6.3 6.4

48
Figure VI.1 Median MAPT for Reading Test Response Times by Time Period

49
Figure VI.2 Median MAPT for Reading Test Response Times: 7/1/06-3/4/07 (3 Stage Test, 40 items)
55.0
56.5
52.4
45.9
34.6
55.0
56.5
52.4
45.9
34.6
0.0
0.0
0.0
0.0
0.0
0.0
10.0
20.0
30.0
40.0
50.0
60.0
70.0
80.0
90.0
200-299 300-399 400-499 500-599 600-700Students Scoring in Level
Media
n T
ime (
min
ute
s)
All ItemsOperational Items OnlyPilot Items Only

50
Figure VI.3 Median MAPT for Reading Test Response Times: 3/5/07-4/22/07 (3 Stage Test, 45 items)
64.2
72.0
57.0
52.2
42.4
54.1 58
.5
47.3
44.7
35.9
10.0 11
.9
8.9
7.6
6.9
0.0
10.0
20.0
30.0
40.0
50.0
60.0
70.0
80.0
90.0
200-299 300-399 400-499 500-599 600-700Students Scoring in Level
Media
n T
ime (
min
ute
s)
All ItemsOperational Items OnlyPilot Items Only

51
Figure VI.4 Median MAPT for Reading Test Response Times: 4/23/07-12/22/07 (3 Stage Test, 50 items)
83.9
85.4
76.4
67.2
52.555
.5
56.5
51.7
45.5
35.2
25.5
26.6
23.4
21.3
17.3
0.0
10.0
20.0
30.0
40.0
50.0
60.0
70.0
80.0
90.0
200-299 300-399 400-499 500-599 600-700Students Scoring in Level
Media
n T
ime (
min
ute
s)
All ItemsOperational Items OnlyPilot Items Only

52
Figure VI.5 Median MAPT for Reading Test Response Times: 12/23/07-2/17/08 (6 Stage Test, 50 items)
69.4
84.8
80.4
72.7
67.7
56.2
64.3
60.5
55.9
52.9
12.8
19.2
19.4
16.7
14.4
0.0
10.0
20.0
30.0
40.0
50.0
60.0
70.0
80.0
90.0
200-299 300-399 400-499 500-599 600-700Students Scoring in Level
Media
n T
ime (
min
ute
s)
All ItemsOperational Items OnlyPilot Items Only

53
Figure VI.6 Median MAPT for Reading Test Response Times: 2/18/08-8/22/08 (6 Stage Test, 45 items)
76.0
87.3
75.0
67.3
59.8
66.6
77.8
64.4
57.8
51.4
7.8 9.5
9.6
8.7
8.0
0.0
10.0
20.0
30.0
40.0
50.0
60.0
70.0
80.0
90.0
200-299 300-399 400-499 500-599 600-700Students Scoring in Level
Media
n T
ime (
min
ute
s)
All ItemsOperational Items OnlyPilot Items Only

54
Figure VI.7 Median MAPT for Reading Test Response Times: 8/23/08-6/30/09 (6 Stage Test, 45 items)

55
Math
The descriptive statistics for test response times observed on the MAPT for Math since its inception in July of 2006 are reported in TablesVI.14-VI.18. Like Reading, these results reflect the following time periods:
• 7/1/06-11/19/06 (three stage test with 0 pilot items) • 11/19/06-12/22/07 (three stage test with 5 pilot items) • 12/23/07-8/22/08 (six stage test with 5 pilot items) • 8/23/08- 6/30/09 (six stage test with 5 pilot items, new panels)
For each time period, the overall mean and median response time is provided. Response time
reported here is for all items (operational and pilot items), operational items only, and pilot items only, to help understand the differences in response time observed and how different parts of the test contribute to total test time.
In general terms, as shown in Table VI.14, the administration time for the MAPT for Math increased with the addition of 5 pilot items, but since that time the average administration time has been remarkably consistent. Across all time periods, the overall median response time for operational items has remained around 50 minutes.
The information in Tables VI.14 through VI.18 reflects the breakdown of response time by student performance level for each of the time periods listed above. Figures VI.8 through VI.13 are bar charts of the median response times.

56
Table VI.14 Overall Total Test Response Time for MAPT for Math
Time Period N All Items Operational Items Only Pilot Items Only
Mean (min.) SD Median
(Min.) Mean (min.) SD Median
(Min.) Mean (min.) SD Median
(Min.) 7/1/06-11/19/06
(3 stages, 40 items) 2499 53.8 23.4 49.8 53.8 23.4 49.8 0.0 0.0 0.0
11/19/06-12/22/07 (3 stages, 45 items) 8595 64.9 31.6 58.4 56.8 27.7 51.0 8.1 5.5 6.6
12/23/07-8/22/08 (6 stages, 45 items) 3713 63.3 32.7 55.7 55.4 28.2 48.7 8.0 6.0 6.4
8/23/08-6/30/09 (6 stages, 45 items) Overall 7229 67.8 34.0 60.5 59.7 30.0 52.9 8.1 6.0
Time Period N All Items Operational Items Only Pilot Items Only
Mean (min.) SD Median
(Min.) Mean (min.) SD Median
(Min.) Mean (min.) SD Median
(Min.) 7/1/06-11/19/06
(3 stages, 40 items) 2499 53.8 23.4 49.8 53.8 23.4 49.8 0.0 0.0 0.0
11/19/06-12/22/07 (3 stages, 45 items) 8595 64.9 31.6 58.4 56.8 27.7 51.0 8.1 5.5 6.6
12/23/07-8/22/08 (6 stages, 45 items) 3713 63.3 32.7 55.7 55.4 28.2 48.7 8.0 6.0 6.4
8/23/08-6/30/09 (6 stages, 45 items) 7229 67.8 34.0 60.5 59.7 30.0 52.9 8.1 6.0 6.6
Table VI.15 Total Test Response Time for MAPT for Math: 7/1/06-11/19/06 (3 Stage Test, 40 items)
Students Scoring in Level N
All Items Operational Items Only Pilot Items Only Mean (min.) SD Median
(Min.) Mean (min.) SD Median
(Min.) Mean (min.) SD Median
(Min.)

57
200-299 30 52.4 36.4 40.2 52.4 36.4 40.2 0.0 0.0 0.0 300-399 310 49.5 24.5 47.1 49.5 24.5 47.1 0.0 0.0 0.0 400-499 1007 52.4 23.3 48.1 52.4 23.3 48.1 0.0 0.0 0.0 500-599 950 55.8 22.3 52.9 55.8 22.3 52.9 0.0 0.0 0.0 600-700 202 57.9 23.0 53.4 57.9 23.0 53.4 0.0 0.0 0.0 Overall 2499 53.8 23.4 49.8 53.8 23.4 49.8 0.0 0.0 0.0
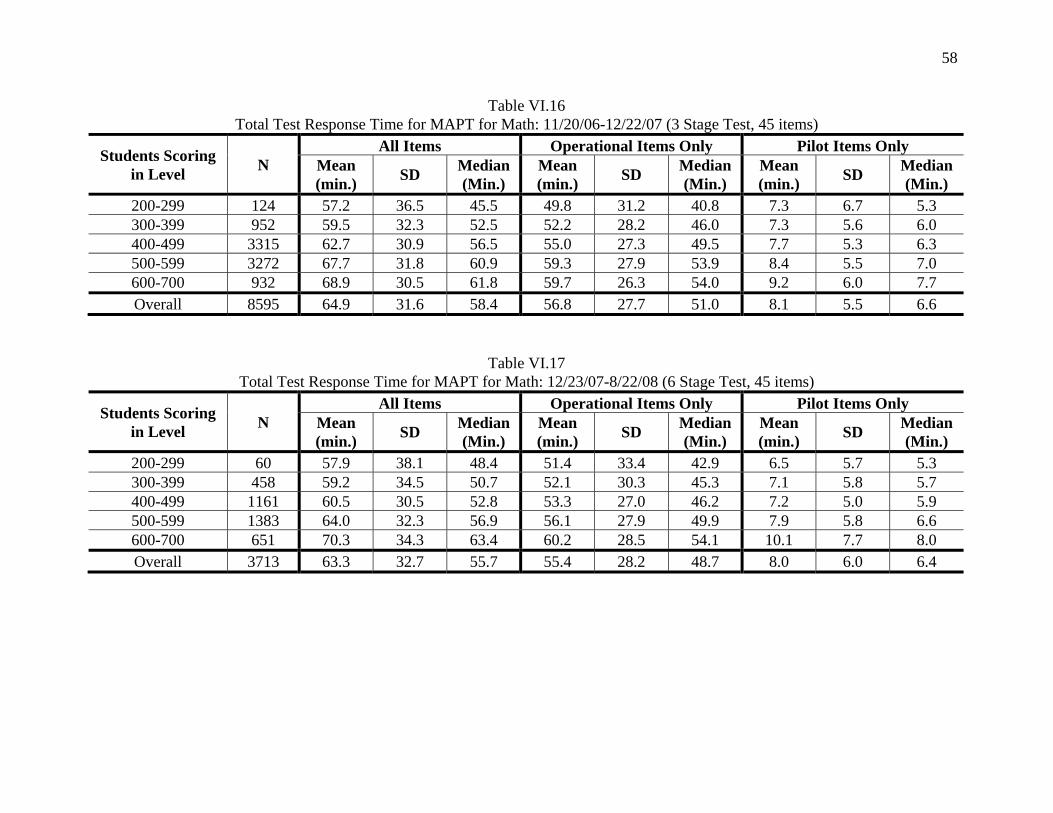
58
Table VI.16 Total Test Response Time for MAPT for Math: 11/20/06-12/22/07 (3 Stage Test, 45 items)
Students Scoring in Level N
All Items Operational Items Only Pilot Items Only Mean (min.) SD Median
(Min.) Mean (min.) SD Median
(Min.) Mean (min.) SD Median
(Min.) 200-299 124 57.2 36.5 45.5 49.8 31.2 40.8 7.3 6.7 5.3 300-399 952 59.5 32.3 52.5 52.2 28.2 46.0 7.3 5.6 6.0 400-499 3315 62.7 30.9 56.5 55.0 27.3 49.5 7.7 5.3 6.3 500-599 3272 67.7 31.8 60.9 59.3 27.9 53.9 8.4 5.5 7.0 600-700 932 68.9 30.5 61.8 59.7 26.3 54.0 9.2 6.0 7.7 Overall 8595 64.9 31.6 58.4 56.8 27.7 51.0 8.1 5.5 6.6
Table VI.17 Total Test Response Time for MAPT for Math: 12/23/07-8/22/08 (6 Stage Test, 45 items)
Students Scoring in Level N
All Items Operational Items Only Pilot Items Only Mean (min.) SD Median
(Min.) Mean (min.) SD Median
(Min.) Mean (min.) SD Median
(Min.) 200-299 60 57.9 38.1 48.4 51.4 33.4 42.9 6.5 5.7 5.3 300-399 458 59.2 34.5 50.7 52.1 30.3 45.3 7.1 5.8 5.7 400-499 1161 60.5 30.5 52.8 53.3 27.0 46.2 7.2 5.0 5.9 500-599 1383 64.0 32.3 56.9 56.1 27.9 49.9 7.9 5.8 6.6 600-700 651 70.3 34.3 63.4 60.2 28.5 54.1 10.1 7.7 8.0 Overall 3713 63.3 32.7 55.7 55.4 28.2 48.7 8.0 6.0 6.4

59
Table VI.18 Total Test Response Time for MAPT for Math: 8/23/08-9/30/08 (6 Stage Test, 45 items)
Students Scoring in Level N
All Items Operational Items Only Pilot Items Only Mean (min.) SD Median
(Min.) Mean (min.) SD Median
(Min.) Mean (min.) SD Median
(Min.) 200-299 84 51.7 38.4 41.6 45.9 34.3 36.6 5.8 5.1 4.4 300-399 782 63.5 35.1 55.4 56.1 31.1 49.4 7.5 5.9 5.9 400-499 2485 64.4 32.6 57.4 57.1 29.2 50.7 7.1 5.4 6.0 500-599 2626 68.3 32.9 61.2 60.1 29.0 53.4 8.2 5.8 6.8 600-700 1251 77.1 35.9 68.7 67.0 31.2 59.7 10.0 7.0 8.5 Overall 7229 67.8 34.0 60.5 59.7 30.0 52.9 8.1 6.0 6.6

60
60
Figure VI.12 Median MAPT for Math Test Response Times by Time Period

61
61
Figure VI.13 Median MAPT for Math Test Response Times: 7/1/06-11/19/06 (3 Stage Test, 40 items)
40.2
47.1
48.1
52.9
53.4
40.2
47.1
48.1
52.9
53.4
0.0
0.0
0.0
0.0
0.0
0.0
10.0
20.0
30.0
40.0
50.0
60.0
70.0
200-299 300-399 400-499 500-599 600-700Students Scoring in Level
Media
n T
ime (
min
ute
s)
All ItemsOperational Items OnlyPilot Items Only

62
62
Figure VI.14 Median MAPT for Math Test Response Times: 11/20/06-12/22/07 (3 Stage Test, 45 items)
45.5
52.5 56
.5
60.9
61.8
40.8
46.0 49
.5
53.9
54.0
5.3 6.0
6.3 7.0 7.7
0.0
10.0
20.0
30.0
40.0
50.0
60.0
70.0
200-299 300-399 400-499 500-599 600-700Students Scoring in Level
Media
n T
ime (
min
ute
s)
All ItemsOperational Items OnlyPilot Items Only

63
63
Figure VI.15 Median MAPT for Math Test Response Times: 12/22/07-8/22/08 (6 Stage Test, 45 items)
48.4 50
.7 52.8 56
.9
63.4
42.9 45
.3
46.2 49
.9
54.1
5.3
5.7
5.9 6.6 8.
00.0
10.0
20.0
30.0
40.0
50.0
60.0
70.0
200-299 300-399 400-499 500-599 600-700Students Scoring in Level
Media
n T
ime (
min
ute
s)
All ItemsOperational Items OnlyPilot Items Only

64
64
Figure VI.16 Median MAPT for Math Test Response Times: 8/23/08-6/30/09 (6 Stage Test, 45 items)

65
65
References American Educational Research Association, American Psychological Association, & National
Council on Measurement in Education (1999). Standards for educational and psychological testing. Washington, DC: American Educational Research Association.
Division of Adult Education and Literacy (2006, July). Implementation guidelines: Measures
and methods for the national reporting system in adult education. Office of Vocational and Adult Education, U.S. Department of Education, Washington: DC. Available at http://www.nrsweb.org/foundations/implementation_guidelines.aspx.
Hambleton, R. K., & Swaminathan, H. (1985). Item response theory: principles and
applications. Boston, MA: Kluwer Academic Publishers. Hambleton, R. K., Swaminathan, H., & Rogers, H. J. (1991). Fundamentals of item response
theory. Newbury Park, CA: Sage. Kaira, L. T., & Sireci, S. B. (2007). Evaluating the content validity of a multistage adaptive test.
Center for Educational Assessment Research Report No. 656. Amherst, MA: Center for Educational Assessment, University of Massachusetts.
Li, S. (2006). Evaluating the consistency and accuracy of the proficiency classifications using
item response theory. Unpublished doctoral dissertation, University of Massachusetts Amherst.
Rudner, L.M. (2001). Computing the expected proportions of misclassified examinees. Practical
Assessment, Research & Evaluation, 7(14).
Rudner, L.M. (2004). Expected classification accuracy. Paper presented at the annual meeting of the National council on Measurement in Education. San Diego, CA.
Sireci, S.G, Baldwin, P., Martone, A., Zenisky, A., Hambleton, R.K., & Han, K. T. (October, 2006) Massachusetts Adult Proficiency Tests Technical Manual. Center for Educational Assessment, University of Massachusetts Amherst.
Sireci, S. G., Baldwin, P., Martone, A., Zenisky, A. L., Kaira, L., Lam, W., Shea, C. L., Han, K.
T., Deng, N., Delton, J., & Hambleton, R. K. (2008). Massachusetts Adult Proficiency Tests technical manual: Version 2. Center for Educational Assessment Research Report No. 677. Amherst, MA: University of Massachusetts, Center for Educational Assessment. Available at http://www.umass.edu/remp/CEA_TechMan.html.
Zimowski, M., Muraki, E., Mislevy, R. J., & Bock, R. D. (2002). BILOG-MG [Computer
software]. Lincolnwood, IL: Scientific Software International.

66
66
67
67
Appendices
Appendix A List of Center for Educational Assessment Research Reports Related to MAPT
Year CEA Report # Citation
2003 CEA-510 Sireci, S. G., Baldwin, P. Preliminary Specifications for ACLS Mathematics and Numeracy Proficiency Tests
2003 CEA-511 Valle, M., & Sireci, S. G. Preliminary specifications for ACLS Reading Proficiency Tests.
2004 CEA-513 Sireci, S. G., Baldwin, P., Keller, L. A., Valle, M., Goodridge, B., Leonelli, E., Schmitt, M. J., Tamarkin, K., & Titzel, J. Specifications for the ACLS Mathematics and Numeracy Proficiency Tests
2004 CEA-516 Sireci, S. G., Li, S., Martone, A. , Valle, M. Bayer, J., Kelly, J., Hanley, S., Greene, S., Royer, J. M., & Schwerdtfeger, J. Specifications for the ACLS Reading Proficiency Tests.
2004 CEA-535 O’Neil, T., Zenisky, A. L., & Sireci, S. G. Viability analysis of current computer-based testing options for adult basic education in the state of Massachusetts.
2004 CEA-536 Zenisky, A. L., Hambleton, R. K., & Sireci, S. G. Computerized testing options for adult basic education assessment in Massachusetts.
2004 CEA-548 Martone, D., Goodridge, B., Moses, M., & Titzel, J. Refinements to ABE mathematics standards for assessment purposes.
2004 CEA-555 Valle, M., Sireci, S. G., Bayer, J., Kelly, J., Hanley, S., & Greene, S. Proposed refinements to ABE Reading Test Specifications: Revisions to the Reading Standards for Assessment.
2005 CEA-563 Zenisky, A. L., & Sireci, S. G. No adult left behind, either: Creating large-scale computer-based tests for adult basic education students.
2005 CEA-583 Baldwin, P., Martone, D., Zenisky, A., Sireci, S. G., & Hambleton, R. K. Massachusetts Adult Proficiency Tests: Summary of spring 2005 pilot test results.
2006 CEA-593 Zenisky, A. L., & Baldwin, P. Using item response time data in test development and validation: Research with beginning computer users.
2006 CEA-600 Sireci, S. G., Baldwin, P., Martone, D., Hambleton, R. K., & Zenisky, A. L. Massachusetts Adult Proficiency Tests.
2006 CEA-603 Martone, D., & Sireci, S. G. Methods for evaluating the alignment between state curriculum frameworks and state assessments.
2006 CEA-607 Sireci, S. G. Test accommodations and the Massachusetts Proficiency Test for adults.
2006 CEA-612 Han, K., Baldwin, P., & Sireci, S.G. Analyses of differential item functioning of potential MAPT items.
2006 CEA-614 Martone, D., Smith, C., Kaira, L., & Sireci, S. G. Proposed revised specifications for MAPT for reading.
2007 CEA-632 Sireci, S G., Martone, A., Smith, C., Kaira, L., Coffey, N., Haller, L. H.,
68
68
Year CEA Report # Citation
Hartwick, L., O’Brien, A., McGill, D., Stearns, D., & Schwerdtfeger, J. Proposed revisions to the MAPT for reading test specifications.
2007 CEA-634 Sireci, S. G., Baldwin, P., Martone, D., & Han, K. Establishing achievement levels on a multi-stage computerized-adaptive test: An application of the Item Descriptor Matching Method.
2007 CEA-640 Sireci, S. G., Wells, C. S., Baldwin, P., & Han, K. T. Evaluating item parameter drift in computerized-adaptive testing.
2007 CEA-656 Kaira, L. T., & Sireci, S. B. Evaluating the content validity of a multistage adaptive test.
2007 CEA-657 Shea, C. M., & Sireci, S. G. Combining standard setting and content validity studies.
2007 CEA-663 Wells, C. S., Sireci, S. G., & Han, K. T. Identifying item parameter drift in multistage adaptive tests.
2007 CEA-667 Delton, J. Using reponse time to examine examinee effort.
2008 CEA-668 Lam, W., Li, S., & Sireci, S. G. Evaluating decision consistency and decision accuracy on a multistage adaptive test.
2008 CEA-673 Deng, N., & Hambleton, R. K. Checking the dimensionality of the Massachusetts Adult Proficiency Test with both real and simulated data.
2008 CEA-676
Martone, A., Sireci, S. G., & Griffin, L. Exploring the process and results of teachers’ participation in an assessment-standards alignment study. Paper presented at the annual meeting of the New England Educational Research Organization.
2008 CEA-677 Sireci, S. G., Baldwin, P., Martone, A., Zenisky, A. L., Kaira, L., Lam, W., Shea, C. L., Han, K. T., Deng, N., Delton, J., & Hambleton, R. K. Massachusetts Adult Proficiency Tests Technical Manual Version 2.
CEA-685
Martone, A., Marcotte, A., Copella, J., Sireci, S. G., Greene S., McIsaac, M., Crevison E., Kocik, J., Haberstroh, S., and Schwerdtfeger, J. Developing Test Specifications for a Beginning Literacy Reading Assessment for Adult Learners in Massachusetts: Summary of February 2008 Meeting.
CEA-686
Zenisky, A. L., Sireci, S. G., and Martone, A. Test accommodations for the MAPT: Review and recommendations for next steps. Report prepared for the Massachusetts Department of Education Adult and Community Learning Services Office.
CEA-692 Zenisky, A. L., Yoo, H., Meng, Y., Sireci, S.G., and Martone, A. Massachusetts Adult Proficiency Test (MAPT) item bank status report.
CEA-693 Zenisky, A. L., Copella, J., & Marcotte, A. Beginning literacy reading assessment for the Massachusetts Adult Proficiency Test: Assessment design options.
CEA-706 Meng, Y., Schweid, J., and Zenisky A. L. An empirical comparison of measurement precision for two multi-stage test designs.
CEA-711 Martone, A., Zenisky, A. L., Randall, J., Copella, J., Meng, Y., Parker, P., and Sukin, T. Score Reporting for the MAPT: Focus Group Results.

69
69
Appendix B
MAPT Test Administrations by Month: Fiscal 2008 and Fiscal 2009 Figures B-1 and B-2 present the number of MAPT tests taken during fiscal 2008 and fiscal 2009 by month of administration. The total number of tests administered in FY08 was 15,347, which includes learners who took more than one posttest as well as learners who only took a pretest; likewise, for FY09 16,042 tests were completed. Across both years, the busiest assessment months were October and May, which probably correspond to the most frequent pretest and posttest periods for the fiscal year.
Figure B-1
MAPT Tests by Month - July 2007 through June 2008
224 307
1608
2586
1318 1226
15661273 1155
987
2244
862
0
500
1000
1500
2000
2500
3000
Jul-0
7
Aug-07
Sep-07
Oct-07
Nov-07
Dec-07
Jan-08
Feb-08
Mar-08
Apr-08
May-08
Jun-08
Month

70
70
Figure B-2
MAPT Tests by Month - July 2008 through June 2009
272 276
1579
2872
998
17011417 1280
1549
930
2106
1062
0
500
1000
1500
2000
2500
3000
3500
Jul-0
8
Aug-08
Sep-08
Oct-08
Nov-08
Dec-08
Jan-09
Feb-09
Mar-09
Apr-09
May-09
Jun-09
Month