Embed Size (px)
Citation preview

Center for Studying Health System Change
Gary TaylorPrincipal - Equity ResearchPhone: (212) 847-5174, Fax: (212) [email protected]
Banc of America Securities LLC9 West 57th Street, 28th FloorNew York, New York 10019
8th Annual Wall Street Comes to Washington Conference
For Profit Hospitals and Specialty Facilities
June 18, 2003
Please see the important disclosures and analyst certification on page 12 of this report. Investors should assume that Banc of America Securities is seeking or will seek investment banking or other business from companies rated in this report.

Hospital Utilization is Now Rising
Source: American Hospital Association.
Page 1
0
5
10
15
20
25
30
35
40
19
80
19
81
19
82
19
83
19
84
19
85
19
86
19
87
19
88
19
89
19
90
19
91
19
92
19
93
19
94
19
95
19
96
19
97
19
98
19
99
20
00
20
01
PA
TIE
NT
AD
MIS
SIO
NS
(m
illi
on
s)
0
100
200
300
400
500
600
OP
Vis
its
(mil
lio
ns)
TOTAL US OUTPATIENT VISITS
TOTAL US

Hospital Admissions Projections = 1-2% (Not Very Cyclical)
Source: Banc of America Securities LLC, U.S. Census Bureau, National Center for Health Statistics & American Hospital Association.
Page 2
0
10
20
30
40
50
60
70
1946
1951
1956
1961
1966
1971
1976
1981
1986
1991
1996
2001
2006
2011
2016
2021
2026
2031
2036
Ad
mis
sio
ns
(m
illio
ns
)
Base Decade Trend Recent Trend
1982-1994

Peak Operational Occupancy is 75-80% - Will We Get There?
Source: American Hospital Association. Excludes SNF beds and patient days.
Page 3
700,000
800,000
900,000
1,000,000
1975
1976
1977
1978
1979
1980
1981
1982
1983
1984
1985
1986
1987
1988
1989
1990
1991
1992
1993
1994
1995
1996
1997
1998
1999
2000
2001
Inp
ati
en
t B
ed
s
55%
60%
65%
70%
75%
80%
Oc
cu
pa
nc
y %
Licensed Beds Occupancy % Staffed Occupancy %
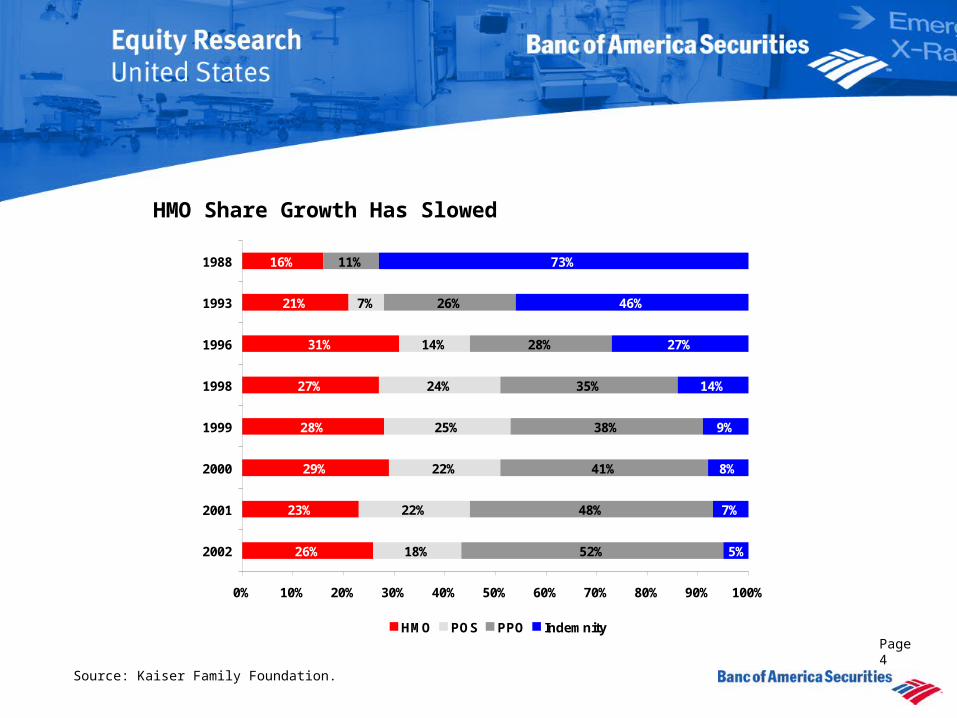
HMO Share Growth Has Slowed
Source: Kaiser Family Foundation.
Page 4
26%
23%
29%
28%
27%
31%
21%
16%
18%
22%
22%
25%
24%
14%
7%
52%
48%
41%
38%
35%
28%
26%
11%
5%
7%
8%
9%
14%
27%
46%
73%
0% 10% 20% 30% 40% 50% 60% 70% 80% 90% 100%
2002
2001
2000
1999
1998
1996
1993
1988
HMO POS PPO Indemnity

1990’s Pricing Decline Indicative of an Industry with Excess Capacity
Source: Milliman and Robertson for Hospital IP and OP Pricing Indices. U.S. Bureau of Labor Statistics for General Med/Surg Hospital PPI Index.
Page 5
0%
2%
4%
6%
8%
10%
12%
14%
1/1/
85
1/1/
86
1/1/
87
1/1/
88
1/1/
89
1/1/
90
1/1/
91
1/1/
92
1/1/
93
1/1/
94
1/1/
95
1/1/
96
1/1/
97
1/1/
98
1/1/
99
1/1/
00
1/1/
01
1/1/
02
1/1/
03
HOSPITAL PPI MMR IP PRICE INDEX MMR OP PRICE INDEX

Peak Operational Occupancy is 75-80% - Will We Get There?
Source: American Hospital Association. Excludes SNF beds and patient days.
Page 6
700,000
800,000
900,000
1,000,000
1975
1976
1977
1978
1979
1980
1981
1982
1983
1984
1985
1986
1987
1988
1989
1990
1991
1992
1993
1994
1995
1996
1997
1998
1999
2000
2001
Inp
ati
en
t B
ed
s
55%
60%
65%
70%
75%
80%
Oc
cu
pa
nc
y %
Licensed Beds Occupancy % Staffed Occupancy %

Industry Margins are Most Correlated (Inversely) to Labor Cost
Source: AHA, U.S. Bureau of Labor Statistics and Banc of America Securities LLC.
Page 7
0%
2%
4%
6%
8%
10%
12%
1987 1988 1989 1990 1991 1992 1993 1994 1995 1996 1997 1998 1999 2000 2001 2002
YT
Y %
Ch
an
ge
0%
2%
4%
6%
8%
10%
12%
Ho
sp
ita
l Ma
rgin
TOTAL MARGIN HOSPITAL LABOR COST HOSPITAL PPI NR/AA
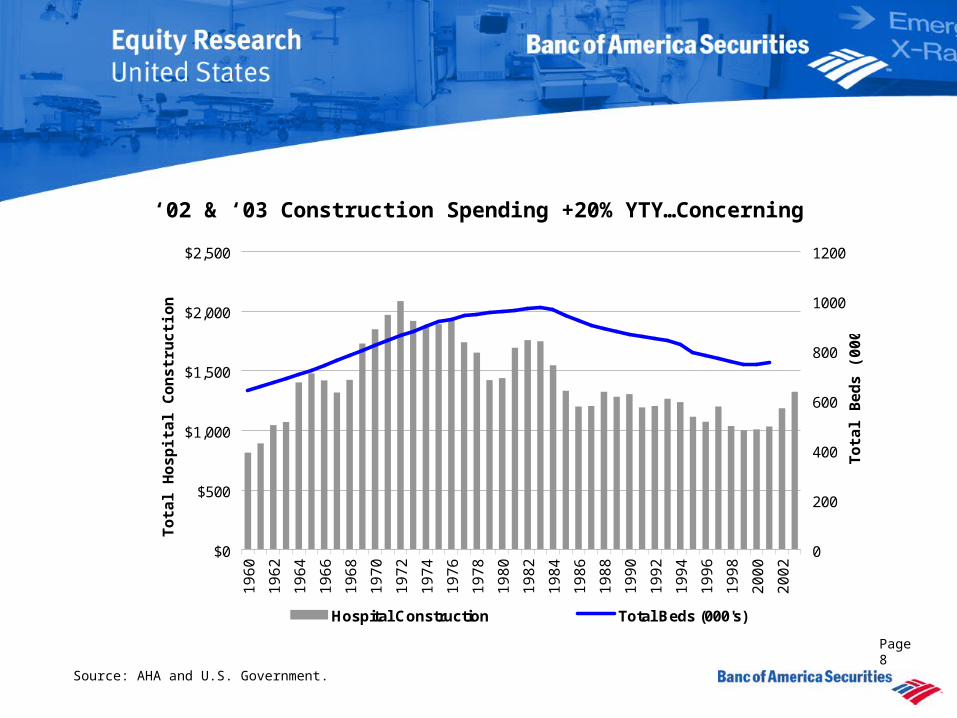
‘02 & ‘03 Construction Spending +20% YTY…Concerning
Source: AHA and U.S. Government.
Page 8
$0
$500
$1,000
$1,500
$2,000
$2,50019
60
1962
1964
1966
1968
1970
1972
1974
1976
1978
1980
1982
1984
1986
1988
1990
1992
1994
1996
1998
2000
2002
Tota
l H
osp
ital
Co
nst
ruct
ion
($m
m)
0
200
400
600
800
1000
1200
Tota
l B
eds
(000
's)
Hospital Construction Total Beds (000's)

Page 9
Source: BAS 2003 Annual Hospital Survey
11.0%
13.5%
5.0%
Suburban Urban Rural
…a Conclusion Supported by our 2003 Hospital Survey
Capital Spending Forecast - YTY % Change

Total Federal Surplus/(Deficit) % of GDP vs. Medicare % of GDP
Source: Congressional Budget Office and Banc of America Securities LLC..
-7%
-6%
-5%
-4%
-3%
-2%
-1%
0%
1%
2%
3%
19
68
19
70
19
72
19
74
19
76
19
78
19
80
19
82
19
84
19
86
19
88
19
90
19
92
19
94
19
96
19
98
20
00
20
02
20
04
E
20
06
E
20
08
E
% o
f G
PD
Deficit w/Iraq War ($50b/yr) Total Surplus/ (Deficit) Medicare
Page 10

Hospital Employment Cost Index
Source: Bureau of Labor Statistics. Private Sector-Hospital Total Compensation Costs (not seasonally adj.).
0%
1%
2%
3%
4%
5%
6%
7%
8%
2Q87
4Q87
2Q88
4Q88
2Q89
4Q89
2Q90
4Q90
2Q91
4Q91
2Q92
4Q92
2Q93
4Q93
2Q94
4Q94
2Q95
4Q95
2Q96
4Q96
2Q97
4Q97
2Q98
4Q98
2Q99
4Q99
2Q00
4Q00
2Q01
4Q01
2Q02
4Q02
YTY% All Private Industry YTY% Private HospitalsPage 11

REG AC - ANALYST CERTIFICATIONThe research analyst whose name appears on the front page of this slide presentation certifies that: (1) all of the views expressed in this research report accurately reflect his or her personal views about any and all of the subject securities or issuers; and (2) no part of the research analyst's compensation was, is, or will be directly or indirectly related to the specific recommendations or views expressed by the research analyst in this research report.IMPORTANT DISCLOSURES
Banc of America Securities LLC Stock Rating SystemThe rating system is based on a stock's forward-12-month expected total return (price appreciation plus dividend yield). The prospective rates of return that help define the Buy, Neutral and Sell ranges are subject to change from time to time, corresponding with changes in prospective rates of return on competing investments. The specific volatility levels that divide our stocks into low, medium, high and extreme ranges are subject to change from time to time, corresponding with changes in the volatility of benchmark indexes and the companies that comprise them.
Volatility RatingsBuy Neutral Sell
Low 0-30% 10%+ 9%-(6)% (7)% or worseMedium 31-40% 15%+ 14%-(10)%(11)% or worseHigh 41-70% 25%+ 24%-(15)%(16)% or worseExtreme 71%+ 50%+ 49%-(25)%(26)% or worse
Source on volatility: Bloomberg.
Page 12

The analysts and associates responsible for preparing this research report receive compensation that is based upon various factors, including Banc of America Securities’ total revenues, a portion of which is generated by Banc of America Securities’ investment banking business. They do not receive compensation based upon revenues from any specific investment banking transaction.
Banc of America Securities prohibits analysts, their associates and members of their households from maintaining a financial interest in the securities or options of any company that the analyst covers or that fall within the analyst’s coverage sector except in limited circumstances (for securities and options acquired prior to July 9, 2002) as permitted by the New York Stock Exchange and the National Association of Securities Dealers. Any such direct stock ownership by an analyst(s) preparing this report in his or her coverage sector is disclosed below. The absence of any such disclosure means the analyst(s) preparing this report do not have any such direct stock ownership in his or her coverage sector. Such persons may own diversified mutual funds. As of the date hereof, Banc of America Securities also permits analysts, their associates and members of their households to maintain financial interests in funds and other private investments that may include companies in a sector the analyst covers if the person acquired the financial interest prior to July 9, 2002.
Banc of America Securities may now or in the future purchase or sell as principal securities or related financial products, options, warrants, rights or derivatives of companies mentioned in this report.
Please see our web site at www.bofasecurities.com for additional company reports and price charts.
Rating DistributionUS Coverage Universe Companies Percent Investment Banking Clients CompaniesPercent*Buy 248 41 Buy 209 84Hold 321 53 Hold 267 83Sell 42 7 Sell 34 81
Health Care SectorCoverage Universe Companies Percent Investment Banking Clients CompaniesPercent*Buy 49 49 Buy 41 84Hold 43 43 Hold 32 74Sell 8 8 Sell 7 88
* Percentage of companies in each rating group that are investment banking clients.
As of 06/01/2003.
Page 13

This report is issued in the U.S. by Banc of America Securities LLC, member NYSE, NASD and SIPC; in Europe by Banc of America Securities Limited; and in Asia by BA Asia Limited (referred to herein collectively as “Banc of America Securities”).
This report has been prepared by Banc of America Securities as part of its research activity and not in connection with any proposed offering of securities or as agent of the issuer of any securities. This report has been prepared independently of any issuer of securities mentioned herein. Neither Banc of America Securities nor its analysts have any authority whatsoever to make any representation or warranty on behalf of the issuer(s). This report is provided for information purposes only and is not an offer or solicitation for the purchase or sale of any financial instrument. Any decision to purchase or subscribe for securities in any offering must be based solely on the information in the prospectus or other offering document issued in connection with such offering, and not on this report.
The information contained in this report has been obtained from sources believed to be reliable, and its accuracy and completeness is not guaranteed. No representation or warranty, express or implied, is made as to the fairness, accuracy, completeness or correctness of the information and opinions contained herein, and Banc of America Securities has no obligation to update or correct any information herein. The views and other information provided are subject to change without notice. Any opinions, projections or forecasts in this report are, unless otherwise stated, those of the author and do not represent the views of the issuer or any other person. This report does not constitute or contain investment advice. This report is issued without regard to the specific investment objectives, financial situation or particular needs of any specific recipient. Neither Banc of America Securities nor any officer or employee of Banc of America Securities or any affiliate thereof accepts any liability whatsoever for any direct, indirect or consequential damages or losses arising from any use of this report or its contents.
Investments in general, and derivatives (i.e., options, futures, warrants and contracts for differences) in particular, involve numerous risks including, among others, market risk, counterparty default risk and liquidity risk. Derivatives are not suitable investments for all investors, and an investor may lose all principal invested and in some cases incur unlimited losses. Foreign currency denominated securities are subject to fluctuation in exchange rates that could have an adverse effect on the value, price or income derived from such investment. In addition, investors in securities such as American Depository Receipts (ADRs), the values of which are influenced by foreign currencies, effectively assume currency risk. It may be difficult to sell an investment and to obtain reliable information about its value or the risks to which it is exposed. Past performance of securities, loans or other financial instruments is not indicative of future performance.
To U.S. Customers: Banc of America Securities LLC has accepted responsibility for the distribution of this report in the United States of America. Any transactions by U.S. persons in any security discussed herein must be carried out through Banc of America Securities LLC. Securities mentioned herein are not FDIC insured, may lose value and are not subject to any bank guarantee. The securities described herein may not have been registered under the U.S. Securities Act of 1933, and in such case, may not be offered or sold in the United States or to U.S. persons unless they are sold in compliance with an exemption from the registration requirements of such Act.
Page 14

To U.K. Customers: This document has been approved for distribution in the U.K. by Banc of America Securities Limited, which is regulated by the Financial Services Authority (including any successor body) for the conduct of investment business in the U.K. Prices, values or income ascribed to investments in this report may fall against your interests. The investments may not be suitable for you and if in any doubt you should seek advice from an investment advisor. Changes in rates of exchange may have an adverse effect on the value, price or income from an investment. Levels and basis for taxation may change. The protection provided by the U.K. regulatory regime, including the Financial Services Scheme, do not generally apply to business coordinated by Banc of America Securities from an office outside the United Kingdom.
To German Customers: In Germany, this report should be read as though BAS has acted as a member of a consortium which has underwritten the most recent offering of securities during the last five years for companies covered in this report and holds 1% or more of the share capital of such companies.
To Canadian Customers: The contents of this report are intended solely for the use of, and may only be issued or passed on to, persons to whom Banc of America Securities LLC (“BAS”) is entitled to distribute this report under applicable Canadian securities laws. In the province of Ontario, any person wishing to effect a transaction should do so with BAS, which is registered as an International Dealer. With few exceptions, BAS may only effect transactions in Ontario with designated institutions in foreign securities as such terms are defined in the Securities Act (Ontario).
To Hong Kong Customers: Any Hong Kong person wishing to effect a transaction in any securities discussed in this report should contact BA Asia Limited.
To Customers in Other Countries: This report, and the securities discussed herein, may not be eligible for distribution or sale in all countries or to certain categories of investors. Generally, this report may only be distributed to professional and institutional investors.
This report may not be reproduced or distributed by any person for any purpose without the prior written consent of Banc of America Securities. Please cite source when quoting. All rights are reserved. Further information on any security or financial instrument mentioned herein is available on request.
BAS (United States)Banc of America Securities LLC 600 Montgomery Street San Francisco, California 94111Tel Contact : 415-627-2000
9 West 57th Street New York, New York 10019Tel. Contact : 212-583-8000
100 North Tryon StreetCharlotte, North Carolina 28225Tel. Contact : 888-279-3457
BASL (United Kingdom)Banc of America Securities Limited
1 Alie StreetLondon E1 8DE, EnglandTel Contact: +44 207 634 4000
BAAL (Hong Kong)BA Asia Limited
Bank of America Tower2nd Floor, Hong KongTel Contact: 852-2847-6175
Equity Web Site: www.bofasecurities.comFixed Income Web Site : http://bofa.com/capitalmarketsBloomberg: Type BAC [GO]FirstCall: www.firstcall.comMultex: www.multex.comTheMarkets.com: www.themarkets.comFor access, please contact your sales representative.
2003 Bank of America Corporation
Page 15