Embed Size (px)
Citation preview
Center for SuStainable HealtH Spending
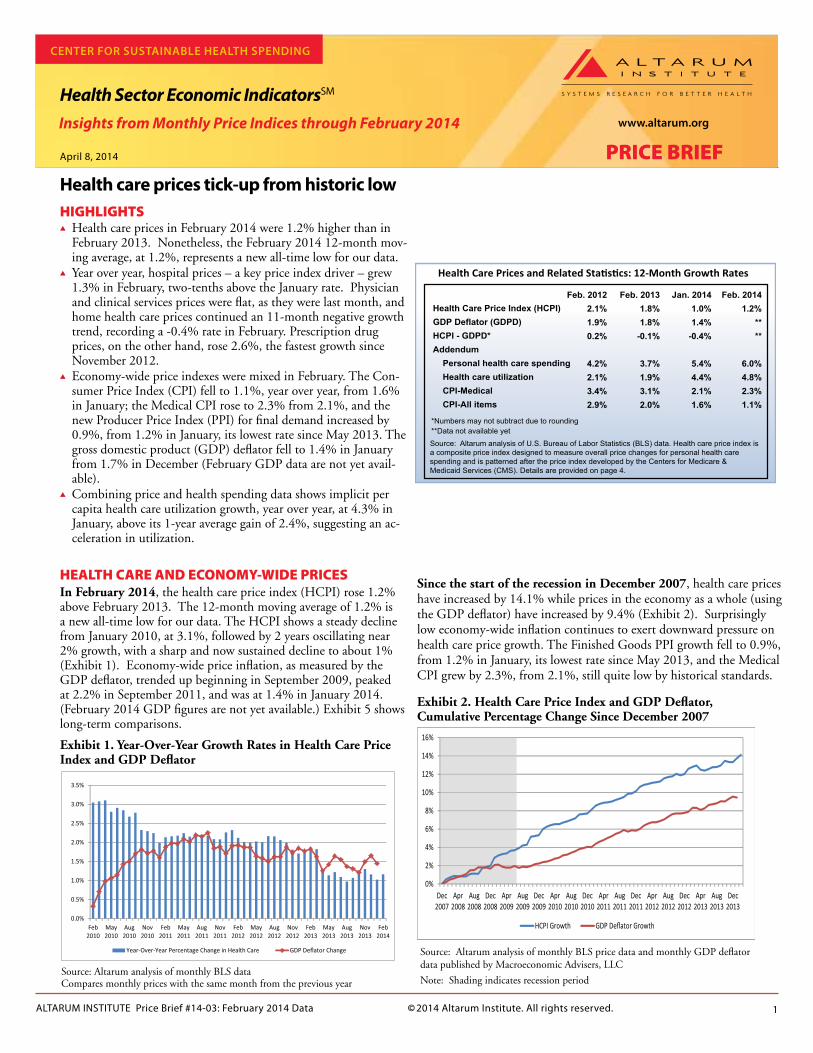
HIGHLIGHTSs Health care prices in February 2014 were 1.2% higher than in
February 2013. Nonetheless, the February 2014 12-month mov-ing average, at 1.2%, represents a new all-time low for our data.
s Year over year, hospital prices – a key price index driver – grew 1.3% in February, two-tenths above the January rate. Physician and clinical services prices were flat, as they were last month, and home health care prices continued an 11-month negative growth trend, recording a -0.4% rate in February. Prescription drug prices, on the other hand, rose 2.6%, the fastest growth since November 2012.
s Economy-wide price indexes were mixed in February. The Con-sumer Price Index (CPI) fell to 1.1%, year over year, from 1.6% in January; the Medical CPI rose to 2.3% from 2.1%, and the new Producer Price Index (PPI) for final demand increased by 0.9%, from 1.2% in January, its lowest rate since May 2013. The gross domestic product (GDP) deflator fell to 1.4% in January from 1.7% in December (February GDP data are not yet avail-able).
s Combining price and health spending data shows implicit per capita health care utilization growth, year over year, at 4.3% in January, above its 1-year average gain of 2.4%, suggesting an ac-celeration in utilization.
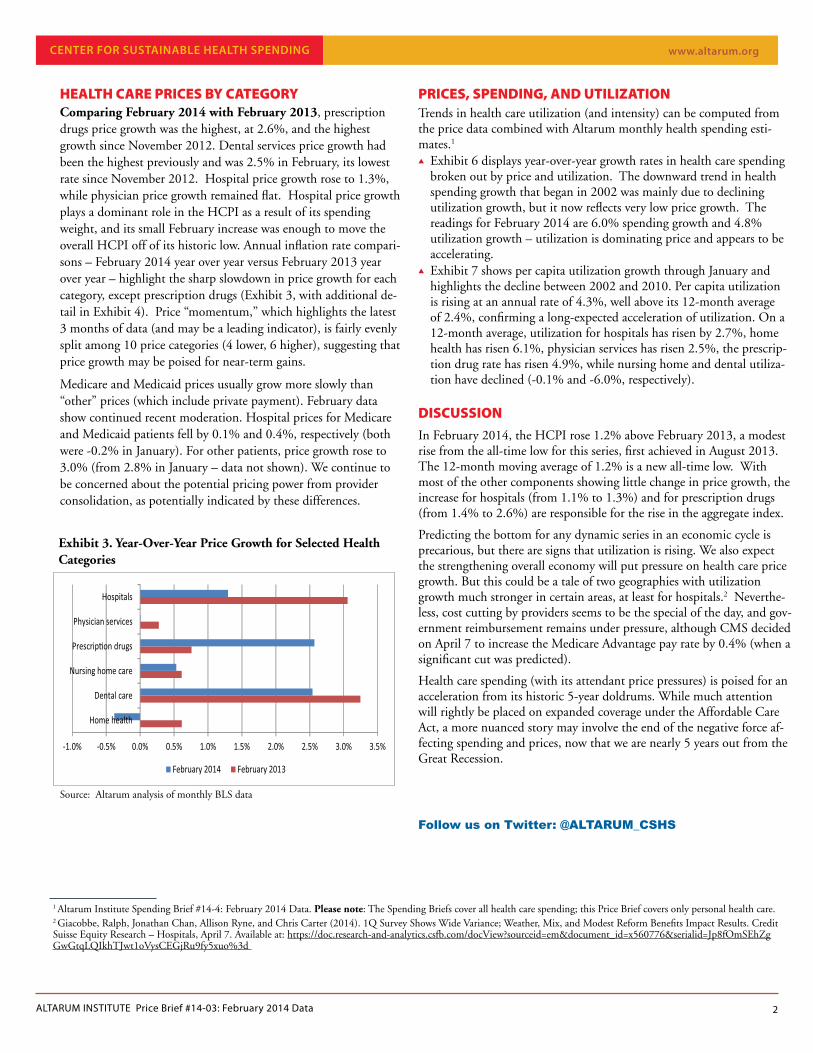
HEALTH CARE AND ECONOMY-WIDE PRICESIn February 2014, the health care price index (HCPI) rose 1.2% above February 2013. The 12-month moving average of 1.2% is a new all-time low for our data. The HCPI shows a steady decline from January 2010, at 3.1%, followed by 2 years oscillating near 2% growth, with a sharp and now sustained decline to about 1% (Exhibit 1). Economy-wide price inflation, as measured by the GDP deflator, trended up beginning in September 2009, peaked at 2.2% in September 2011, and was at 1.4% in January 2014. (February 2014 GDP figures are not yet available.) Exhibit 5 shows long-term comparisons.
Health care prices tick-up from historic low
Health Sector Economic IndicatorsSM
Health Care Prices and Related Sta�s�cs: 12-Month Growth Rates
Source: Altarum analysis of U.S. Bureau of Labor Statistics (BLS) data. Health care price index isa composite price index designed to measure overall price changes for personal health carespending and is patterned after the price index developed by the Centers for Medicare &Medicaid Services (CMS). Details are provided on page 4.
Health Care Price Index (HCPI)GDP Deflator (GDPD)HCPI - GDPD*Addendum Personal health care spending Health care utilization CPI-Medical CPI-All items
Feb. 20122.1%1.9%0.2%
4.2%2.1%3.4%2.9%
Feb. 20131.8%1.8%
-0.1%
3.7%1.9%3.1%2.0%
Jan. 20141.0%1.4%
-0.4%
5.4%4.4%2.1%1.6%
Feb. 20141.2%
****
6.0%4.8%2.3%1.1%
*Numbers may not subtract due to rounding**Data not available yet
Source: Altarum analysis of monthly BLS dataCompares monthly prices with the same month from the previous year
Since the start of the recession in December 2007, health care prices have increased by 14.1% while prices in the economy as a whole (using the GDP deflator) have increased by 9.4% (Exhibit 2). Surprisingly low economy-wide inflation continues to exert downward pressure on health care price growth. The Finished Goods PPI growth fell to 0.9%, from 1.2% in January, its lowest rate since May 2013, and the Medical CPI grew by 2.3%, from 2.1%, still quite low by historical standards.
Exhibit 2. Health Care Price Index and GDP Deflator, Cumulative Percentage Change Since December 2007
www.altarum.org
ALTARUM INSTITUTE Price Brief #14-03: February 2014 Data 1
April 8, 2014
Source: Altarum analysis of monthly BLS price data and monthly GDP deflator data published by Macroeconomic Advisers, LLC
Note: Shading indicates recession period
Exhibit 1. Year-Over-Year Growth Rates in Health Care Price Index and GDP Deflator
PRICE BRIEF
© 2014 Altarum Institute. All rights reserved.
Insights from Monthly Price Indices through February 2014
0%
2%
4%
6%
8%
10%
12%
14%
16%
Dec2007
Apr2008
Aug2008
Dec2008
Apr2009
Aug2009
Dec2009
Apr2010
Aug2010
Dec2010
Apr2011
Aug2011
Dec2011
Apr2012
Aug2012
Dec2012
Apr2013
Aug2013
Dec2013
HCPI Growth GDP Deflator Growth0.0%
0.5%
1.0%
1.5%
2.0%
2.5%
3.0%
3.5%
Feb2010
May2010
Aug2010
Nov2010
Feb2011
May2011
Aug2011
Nov2011
Feb2012
May2012
Aug2012
Nov2012
Feb2013
May2013
Aug2013
Nov2013
Feb2014
Year-Over-Year Percentage Change in Health Care GDP Deflator Change
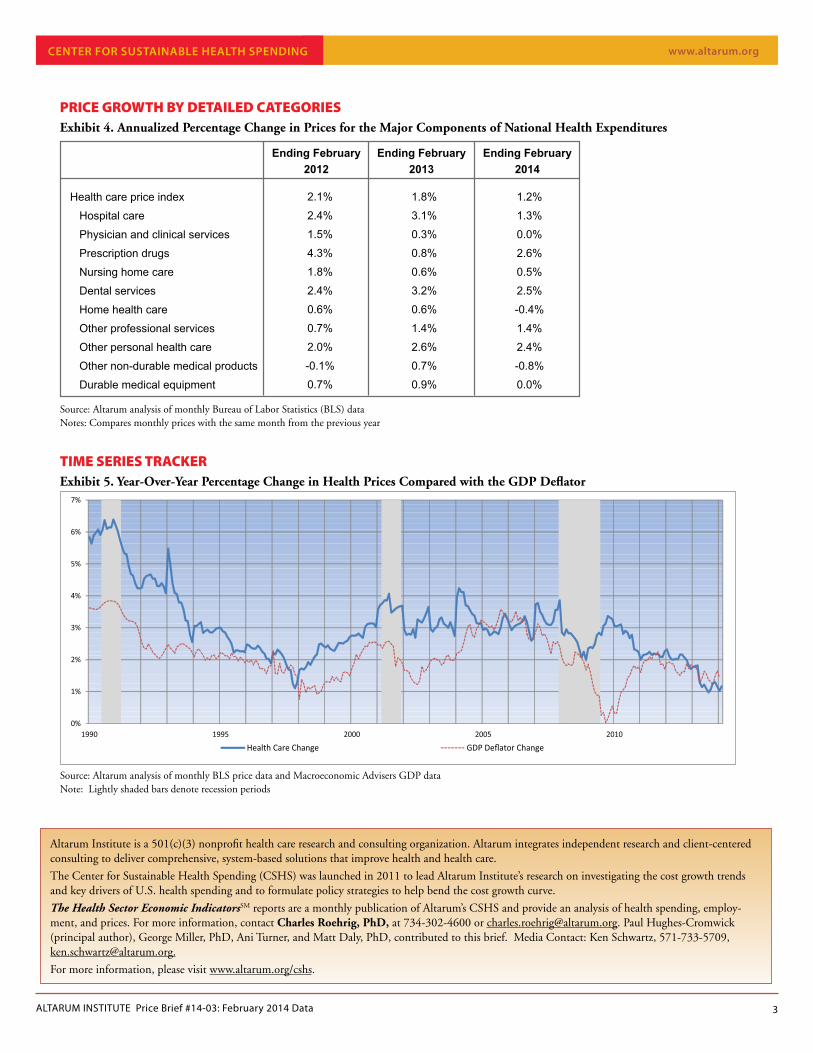
HEALTH CARE PRICES BY CATEGORYComparing February 2014 with February 2013, prescription drugs price growth was the highest, at 2.6%, and the highest growth since November 2012. Dental services price growth had been the highest previously and was 2.5% in February, its lowest rate since November 2012. Hospital price growth rose to 1.3%, while physician price growth remained flat. Hospital price growth plays a dominant role in the HCPI as a result of its spending weight, and its small February increase was enough to move the overall HCPI off of its historic low. Annual inflation rate compari-sons – February 2014 year over year versus February 2013 year over year – highlight the sharp slowdown in price growth for each category, except prescription drugs (Exhibit 3, with additional de-tail in Exhibit 4). Price “momentum,” which highlights the latest 3 months of data (and may be a leading indicator), is fairly evenly split among 10 price categories (4 lower, 6 higher), suggesting that price growth may be poised for near-term gains.
Medicare and Medicaid prices usually grow more slowly than “other” prices (which include private payment). February data show continued recent moderation. Hospital prices for Medicare and Medicaid patients fell by 0.1% and 0.4%, respectively (both were -0.2% in January). For other patients, price growth rose to 3.0% (from 2.8% in January – data not shown). We continue to be concerned about the potential pricing power from provider consolidation, as potentially indicated by these differences.
www.altarum.org
ALTARUM INSTITUTE Price Brief #14-03: February 2014 Data 2
-1.0% -0.5% 0.0% 0.5% 1.0% 1.5% 2.0% 2.5% 3.0% 3.5%
Home health
Dental care
Nursing home care
Prescrip�on drugs
Physician services
Hospitals
February 2014 February 2013
Source: Altarum analysis of monthly BLS data
PRICES, SPENDING, AND UTILIZATIONTrends in health care utilization (and intensity) can be computed from the price data combined with Altarum monthly health spending esti-mates.1 s Exhibit 6 displays year-over-year growth rates in health care spending
broken out by price and utilization. The downward trend in health spending growth that began in 2002 was mainly due to declining utilization growth, but it now reflects very low price growth. The readings for February 2014 are 6.0% spending growth and 4.8% utilization growth – utilization is dominating price and appears to be accelerating.
s Exhibit 7 shows per capita utilization growth through January and highlights the decline between 2002 and 2010. Per capita utilization is rising at an annual rate of 4.3%, well above its 12-month average of 2.4%, confirming a long-expected acceleration of utilization. On a 12-month average, utilization for hospitals has risen by 2.7%, home health has risen 6.1%, physician services has risen 2.5%, the prescrip-tion drug rate has risen 4.9%, while nursing home and dental utiliza-tion have declined (-0.1% and -6.0%, respectively).
DISCUSSION
In February 2014, the HCPI rose 1.2% above February 2013, a modest rise from the all-time low for this series, first achieved in August 2013. The 12-month moving average of 1.2% is a new all-time low. With most of the other components showing little change in price growth, the increase for hospitals (from 1.1% to 1.3%) and for prescription drugs (from 1.4% to 2.6%) are responsible for the rise in the aggregate index.
Predicting the bottom for any dynamic series in an economic cycle is precarious, but there are signs that utilization is rising. We also expect the strengthening overall economy will put pressure on health care price growth. But this could be a tale of two geographies with utilization growth much stronger in certain areas, at least for hospitals.2 Neverthe-less, cost cutting by providers seems to be the special of the day, and gov-ernment reimbursement remains under pressure, although CMS decided on April 7 to increase the Medicare Advantage pay rate by 0.4% (when a significant cut was predicted).
Health care spending (with its attendant price pressures) is poised for an acceleration from its historic 5-year doldrums. While much attention will rightly be placed on expanded coverage under the Affordable Care Act, a more nuanced story may involve the end of the negative force af-fecting spending and prices, now that we are nearly 5 years out from the Great Recession.
1 Altarum Institute Spending Brief #14-4: February 2014 Data. Please note: The Spending Briefs cover all health care spending; this Price Brief covers only personal health care.2 Giacobbe, Ralph, Jonathan Chan, Allison Ryne, and Chris Carter (2014). 1Q Survey Shows Wide Variance; Weather, Mix, and Modest Reform Benefits Impact Results. Credit Suisse Equity Research – Hospitals, April 7. Available at: https://doc.research-and-analytics.csfb.com/docView?sourceid=em&document_id=x560776&serialid=Jp8fOmSEhZgGwGtqLQIkhTJwt1oVysCEGjRu9fy5xuo%3d
Exhibit 3. Year-Over-Year Price Growth for Selected Health Categories
Follow us on Twitter: @ALTARUM_CSHS
Center for SuStainable HealtH Spending
www.altarum.org
ALTARUM INSTITUTE Price Brief #14-03: February 2014 Data 3
Source: Altarum analysis of monthly Bureau of Labor Statistics (BLS) dataNotes: Compares monthly prices with the same month from the previous year
Source: Altarum analysis of monthly BLS price data and Macroeconomic Advisers GDP dataNote: Lightly shaded bars denote recession periods
TIME SERIES TRACKERExhibit 5. Year-Over-Year Percentage Change in Health Prices Compared with the GDP Deflator
0%
1%
2%
3%
4%
5%
6%
7%
1990 1995 2000 2005 2010
Health Care Change GDP Deflator Change
PRICE GROWTH BY DETAILED CATEGORIESExhibit 4. Annualized Percentage Change in Prices for the Major Components of National Health Expenditures
Health care price index
Hospital care
Physician and clinical services
Prescription drugs
Nursing home care
Dental services
Home health care
Other professional services
Other personal health care
Other non-durable medical products
Durable medical equipment
2.1%
2.4%
1.5%
4.3%
1.8%
2.4%
0.6%
0.7%
2.0%
-0.1%
0.7%
1.8%
3.1%
0.3%
0.8%
0.6%
3.2%
0.6%
1.4%
2.6%
0.7%
0.9%
1.2%
1.3%
0.0%
2.6%
0.5%
2.5%
-0.4%
1.4%
2.4%
-0.8%
0.0%
Ending February2012
Ending February2013
Ending February2014
Altarum Institute is a 501(c)(3) nonprofit health care research and consulting organization. Altarum integrates independent research and client-centered consulting to deliver comprehensive, system-based solutions that improve health and health care.
The Center for Sustainable Health Spending (CSHS) was launched in 2011 to lead Altarum Institute’s research on investigating the cost growth trends and key drivers of U.S. health spending and to formulate policy strategies to help bend the cost growth curve.
The Health Sector Economic IndicatorsSM reports are a monthly publication of Altarum’s CSHS and provide an analysis of health spending, employ-ment, and prices. For more information, contact Charles Roehrig, PhD, at 734-302-4600 or [email protected]. Paul Hughes-Cromwick (principal author), George Miller, PhD, Ani Turner, and Matt Daly, PhD, contributed to this brief. Media Contact: Ken Schwartz, 571-733-5709, [email protected].
For more information, please visit www.altarum.org/cshs.
Center for SuStainable HealtH Spending
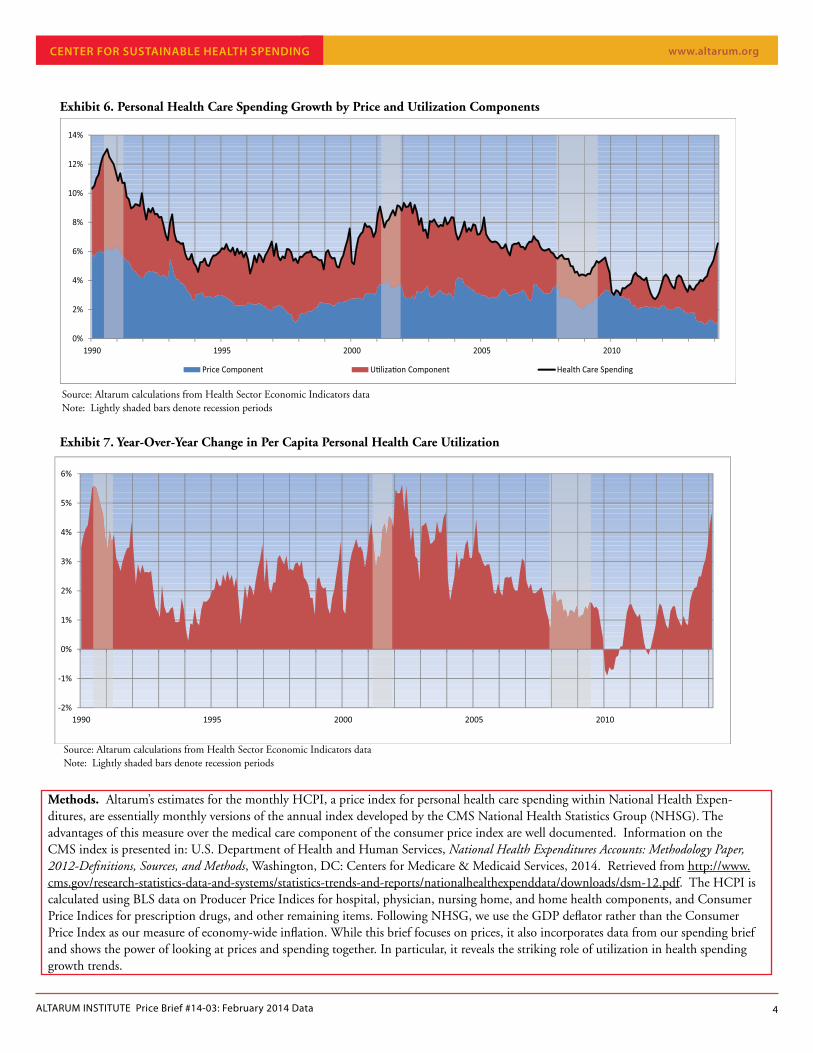
Exhibit 7. Year-Over-Year Change in Per Capita Personal Health Care Utilization
www.altarum.org
ALTARUM INSTITUTE Price Brief #14-03: February 2014 Data 4
0%
2%
4%
6%
8%
10%
12%
14%
1990 1995 2000 2005 2010
Price Component U�liza�on Component Health Care Spending
Source: Altarum calculations from Health Sector Economic Indicators dataNote: Lightly shaded bars denote recession periods
Source: Altarum calculations from Health Sector Economic Indicators dataNote: Lightly shaded bars denote recession periods
Methods. Altarum’s estimates for the monthly HCPI, a price index for personal health care spending within National Health Expen-ditures, are essentially monthly versions of the annual index developed by the CMS National Health Statistics Group (NHSG). The advantages of this measure over the medical care component of the consumer price index are well documented. Information on the CMS index is presented in: U.S. Department of Health and Human Services, National Health Expenditures Accounts: Methodology Paper, 2012-Definitions, Sources, and Methods, Washington, DC: Centers for Medicare & Medicaid Services, 2014. Retrieved from http://www.cms.gov/research-statistics-data-and-systems/statistics-trends-and-reports/nationalhealthexpenddata/downloads/dsm-12.pdf. The HCPI is calculated using BLS data on Producer Price Indices for hospital, physician, nursing home, and home health components, and Consumer Price Indices for prescription drugs, and other remaining items. Following NHSG, we use the GDP deflator rather than the Consumer Price Index as our measure of economy-wide inflation. While this brief focuses on prices, it also incorporates data from our spending brief and shows the power of looking at prices and spending together. In particular, it reveals the striking role of utilization in health spending growth trends.
-2%
-1%
0%
1%
2%
3%
4%
5%
6%
1990 1995 2000 2005 2010
Exhibit 6. Personal Health Care Spending Growth by Price and Utilization Components
Center for SuStainable HealtH Spending