Embed Size (px)
Citation preview
CENTRAL BANK OF NIGERIACENTRAL BANK OF NIGERIA
Economic ReportFor the
First Half of 2012
Economic ReportFor the
First Half of 2012

© 20 Central Bank of Nigeria12
ISSN 1597 - 2976
CBN Half Year Economic Report for 2012
iii
Central Bank of NigeriaCorporate Head Office33 Tafawa Balewa WayCentral Business DistrictP. M. B. 0187, GarkiAbujaWebsite: www.cbn.gov.ng
Tel: +234(0)946239701 +234(0)946239702


CBN Half Year Economic Report for 2012
v
Vision
Mission
e the model central bank delivering price and
financial system stability and
promoting sustainable economic development.
o be proactive in providing a stable framework for the economic development
of Nigeria, through effective, efficient, and transparent implementation of
monetary and exchange rate policy, and management of the financial sector.
T
B

The Central Bank of Nigeria
CBN Half Year Economic Report for 2012
vi
Established by the Central Bank of Nigeria (CBN) Act of 1958, the
Principal objects of the Bank as contained in the new CBN Act, 2007 are to
ensure monetary and price stability
issue legal tender currency in Nigeria
maintain external reserves to safeguard the international value of
the legal tender currency
promote a sound financial system in Nigeria
act as banker and provide economic and financial advice to the
Federal Government of Nigeria
·
·
·
·
·
CBN Half Year Economic Report for 2012
vii
MEMBERS OF THE BOARD OF DIRECTORS OF THE BANKAS AT JUNE 30, 2012
1. Sanusi Lamido Sanusi, CON - Governor (Chairman)2. Suleiman A. Barau - Deputy Governor (Corporate Services)3. Sarah O. Alade (Mrs) - Deputy Governor (Economic Policy)4. Kingsley C. Moghalu - Deputy Governor (Financial System Stability)5. Tunde O. Lemo, OFR - Deputy Governor (Operations)6. Danladi I. Kifasi, mni - Director (Permanent Secretary, Federal Ministry of Finance)7. Jonah O. Otunla - Director (Accountant General of the Federation)8. Dahiru Muhammad - Director9. Samuel O. Olofin - Director10. Joshua O. Omuya - Director11. Stephen O. Oronsaye, CFR - Director
Yunusa M. Sanusi - Secretary to the Board
1. Sanusi Lamido Sanusi, CON - Governor (Chairman)2. Suleiman A. Barau - Deputy Governor (Corporate Services)3. Sarah O. Alade (Mrs) - Deputy Governor (Economic Policy)4. Kingsley C. Moghalu - Deputy Governor (Financial System Stability)5. Tunde O. Lemo, OFR - Deputy Governor (Operations)
Yunusa M. Sanusi - Secretary
MEMBERS OF THE COMMITTEE OF GOVERNORS OFTHE BANK AS AT JUNE 30, 2012

CBN Half Year Economic Report for 2012
ix
TABLE OF CONTENTS
Page
Summary .. .. .. .. .. .. .. .. .. .. xvii.. .. .. .. .. .. .. .. 1
.. .. .. .. 2 Liquidity Management .. .. .. .. .. 2
Monetary Policy Committee (MPC) Decisions .. .. .. 2Developments in the Payments system .. .. .. .. 3
Retail Payments System .. .. .. .. .. 5 Cheque .. .. .. .. .. .. 5 Electronic Payments.. .. .. .. .. 6
ATM Transactions .. .. .. .. 7 Web Transactions. .. .. .. 8 Point of Sale (POS) Transactions.. .. 8 Mobile Payments .. .. .. .. 9
Wholesale Payments System.. .. .. .. .. 9Financial Sector Surveillance .. .. .. .. .. 10
Banking Supervision .. .. .. .. .. 10Target Examination .. .. .. .. .. 11Routine/Special Foreign Exchange Examinations .. .. 11Banking Sector Soundness .. .. .. .. .. 11Compliance with the Code of Corporate
Governance for Banks in Nigeria .. .. .. .. 12Fraud and Forgeries.. .. .. .. .. .. 12Examination of Other Financial Institutions.. .. .. 13
Foreign Exchange Management .. .. .. .. .. 13 Spot Segment of the Foreign Exchange Market.. .. 13 Forward Segment of the Foreign Exchange Market .. 14 Wholesale Dutch Auction (wDAS) Exchange Rate
Movements .. .. .. .. .. .. 15 Spot Exchange Rates .. .. .. .. 15 Forward Exchange Rates .. .. .. .. 16
Foreign Exchange Flows .. .. .. .. .. 17Sectoral Utilization of Foreign Exchange .. .. .. 19Foreign Exchange Receipts by Top Hundred Exporters .. 20Nominal Effective Exchange Rate (NEER) and Real
Effective Exchange Rate (REER) Indices .. .. .. 21Development Finance Operations .. .. .. .. 21
Agricultural Credit Guarantee SchemeFund (ACGSF) .. .. .. .. .. .. 21Interest Drawback Programme (IDP) .. .. .. 23The Trust Fund Model (TFM) .. .. .. .. .. 23
Entrepreneurship Development Centres (EDCs).. .. 23 Commercial Agricultural Credit Scheme (CACS).. .. 23
1.0 INTRODUCTION2.0 OPERATIONS OF THE CENTRAL BANK OF NIGERIA
2.1 2.22.3
2.3.12.3.1.12.3.1.2
2.3.1.2.1 2.3.1.2.2 2.3.1.2.3 2.3.1.2.4
2.3.22.4
2.4.1 2.4.2 2.4.32.4.42.4.5
2.4.62.4.7
2.5
2.5.22.5.3
2.5.3.12.5.3.2
2.5.42.5.52.5.62.5.7
2.6
2.6.1
2.6.22.6.32.6.42.6.5
2.5.1
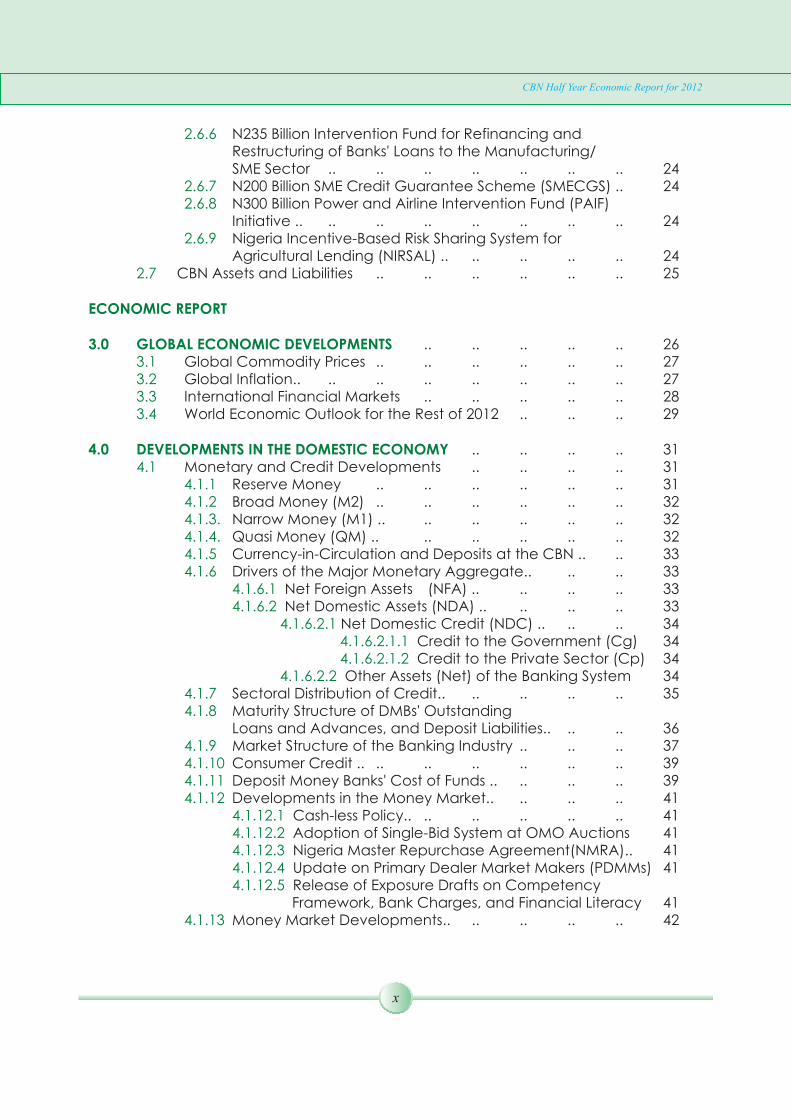
CBN Half Year Economic Report for 2012
x
N235 Billion Intervention Fund for Refinancing and Restructuring of Banks' Loans to the Manufacturing/SME Sector .. .. .. .. .. .. .. 24N200 Billion SME Credit Guarantee Scheme (SMECGS) .. 24N300 Billion Power and Airline Intervention Fund (PAIF)Initiative .. .. .. .. .. .. .. .. 24Nigeria Incentive-Based Risk Sharing System for
Agricultural Lending (NIRSAL) .. .. .. .. .. 24 CBN Assets and Liabilities .. .. .. .. .. .. 25
.. .. .. .. .. 26Global Commodity Prices .. .. .. .. .. .. 27Global Inflation.. .. .. .. .. .. .. .. 27International Financial Markets .. .. .. .. .. 28World Economic Outlook for the Rest of 2012 .. .. .. 29
.. .. .. .. 31 Monetary and Credit Developments .. .. .. .. 31
Reserve Money .. .. .. .. .. .. 31 Broad Money (M2) .. .. .. .. .. .. 32 Narrow Money (M1) .. .. .. .. .. .. 32 Quasi Money (QM) .. .. .. .. .. .. 32
Currency-in-Circulation and Deposits at the CBN .. .. 33Drivers of the Major Monetary Aggregate.. .. .. 33
Net Foreign Assets (NFA) .. .. .. .. 33 Net Domestic Assets (NDA) .. .. .. .. 33
Net Domestic Credit (NDC) .. .. .. 34 Credit to the Government (Cg) 34 Credit to the Private Sector (Cp) 34
Other Assets (Net) of the Banking System 34Sectoral Distribution of Credit.. .. .. .. .. 35Maturity Structure of DMBs' Outstanding Loans and Advances, and Deposit Liabilities.. .. .. 36Market Structure of the Banking Industry .. .. .. 37Consumer Credit .. .. .. .. .. .. .. 39Deposit Money Banks' Cost of Funds .. .. .. .. 39Developments in the Money Market.. .. .. .. 41
Cash-less Policy.. .. .. .. .. .. 41 Adoption of Single-Bid System at OMO Auctions 41 Nigeria Master Repurchase Agreement(NMRA).. 41 Update on Primary Dealer Market Makers (PDMMs) 41 Release of Exposure Drafts on Competency
Framework, Bank Charges, and Financial Literacy 41Money Market Developments.. .. .. .. .. 42
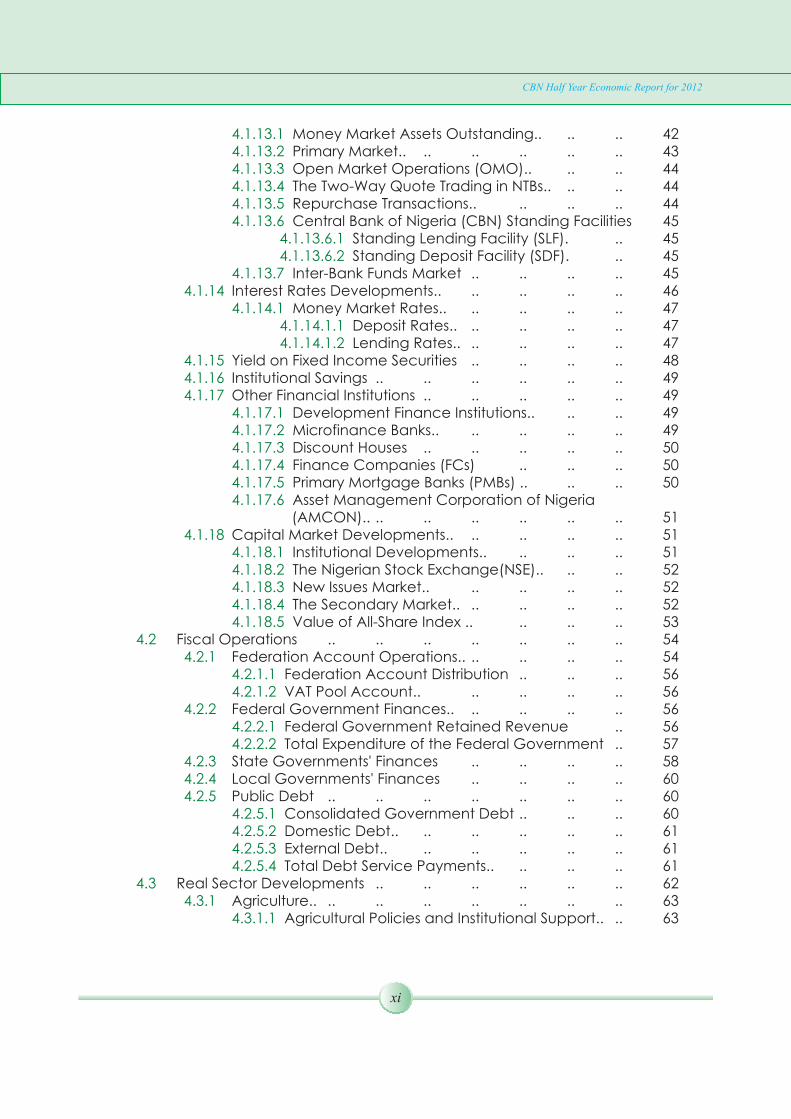
2.6.6
2.6.72.6.8
2.6.9
2.7
ECONOMIC REPORT
3.0 GLOBAL ECONOMIC DEVELOPMENTS3.1 3.2 3.3 3.4
4.0 DEVELOPMENTS IN THE DOMESTIC ECONOMY4.1
4.1.1 4.1.2 4.1.3.4.1.4.4.1.54.1.6
4.1.6.1 4.1.6.2
4.1.6.2.1 4.1.6.2.1.1 4.1.6.2.1.2
4.1.6.2.24.1.74.1.8
4.1.94.1.104.1.114.1.12
4.1.12.14.1.12.24.1.12.34.1.12.44.1.12.5
4.1.13
CBN Half Year Economic Report for 2012
xi
Money Market Assets Outstanding.. .. .. 42 Primary Market.. .. .. .. .. .. 43 Open Market Operations (OMO).. .. .. 44 The Two-Way Quote Trading in NTBs.. .. .. 44 Repurchase Transactions.. .. .. .. 44 Central Bank of Nigeria (CBN) Standing Facilities 45
Standing Lending Facility (SLF). .. 45 Standing Deposit Facility (SDF). .. 45
Inter-Bank Funds Market .. .. .. .. 45 Interest Rates Developments.. .. .. .. .. 46
Money Market Rates.. .. .. .. .. 47 Deposit Rates.. .. .. .. .. 47 Lending Rates.. .. .. .. .. 47
Yield on Fixed Income Securities .. .. .. .. 48 Institutional Savings .. .. .. .. .. .. 49 Other Financial Institutions .. .. .. .. .. 49
Development Finance Institutions.. .. .. 49 Microfinance Banks.. .. .. .. .. 49 Discount Houses .. .. .. .. .. 50 Finance Companies (FCs) .. .. .. 50 Primary Mortgage Banks (PMBs) .. .. .. 50 Asset Management Corporation of Nigeria (AMCON).. .. .. .. .. .. .. 51
Capital Market Developments.. .. .. .. .. 51 Institutional Developments.. .. .. .. 51 The Nigerian Stock Exchange(NSE).. .. .. 52 New Issues Market.. .. .. .. .. 52 The Secondary Market.. .. .. .. .. 52 Value of All-Share Index .. .. .. .. 53
Fiscal Operations .. .. .. .. .. .. .. 54Federation Account Operations.. .. .. .. .. 54
Federation Account Distribution .. .. .. 56 VAT Pool Account.. .. .. .. .. 56
Federal Government Finances.. .. .. .. .. 56 Federal Government Retained Revenue .. 56 Total Expenditure of the Federal Government .. 57
State Governments' Finances .. .. .. .. 58Local Governments' Finances .. .. .. .. 60Public Debt .. .. .. .. .. .. .. 60
Consolidated Government Debt .. .. .. 60 Domestic Debt.. .. .. .. .. .. 61 External Debt.. .. .. .. .. .. 61 Total Debt Service Payments.. .. .. .. 61
Real Sector Developments .. .. .. .. .. .. 62Agriculture.. .. .. .. .. .. .. .. 63
Agricultural Policies and Institutional Support.. .. 63
4.1.13.1 4.1.13.2 4.1.13.3 4.1.13.4 4.1.13.5 4.1.13.6
4.1.13.6.1 4.1.13.6.2
4.1.13.74.1.14
4.1.14.14.1.14.1.14.1.14.1.2
4.1.154.1.164.1.17
4.1.17.14.1.17.24.1.17.34.1.17.44.1.17.54.1.17.6
4.1.18
4.1.18.14.1.18.24.1.18.34.1.18.44.1.18.5
4.2 4.2.1
4.2.1.1 4.2.1.2
4.2.2 4.2.2.1 4.2.2.2
4.2.3 4.2.44.2.5
4.2.5.24.2.5.34.2.5.4
4.3 4.3.1
4.3.1.1
4.2.5.1
CBN Half Year Economic Report for 2012
xii
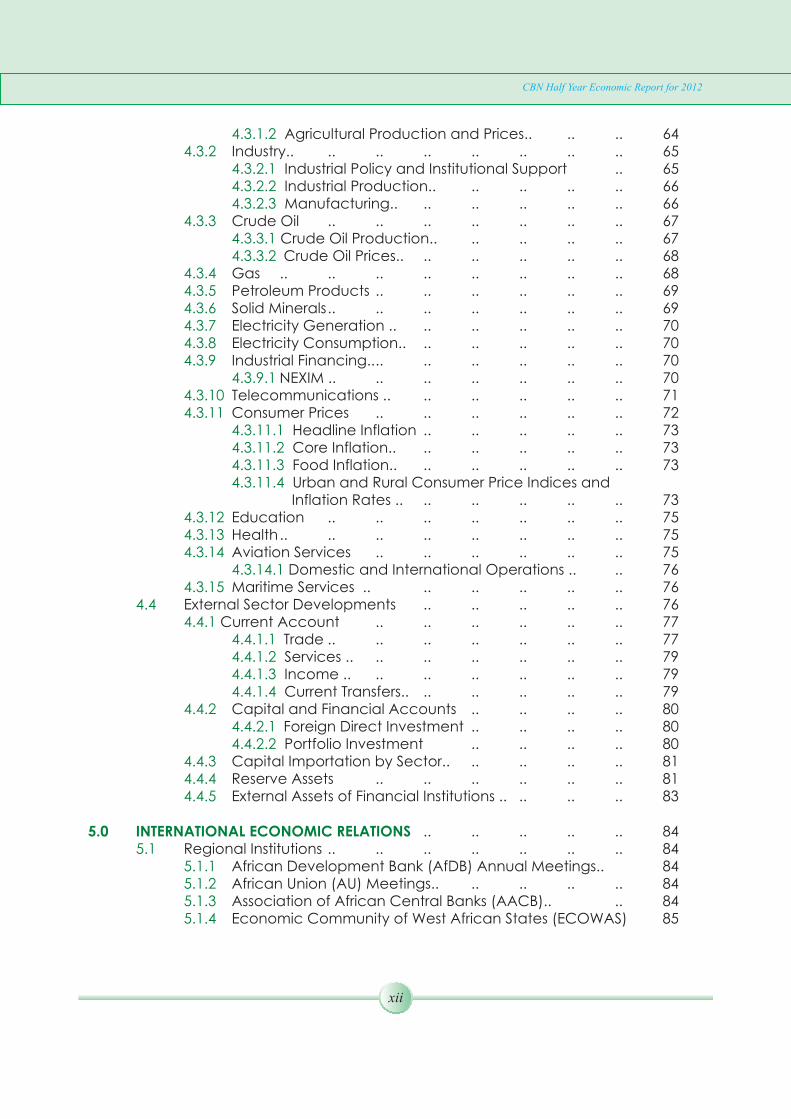
Agricultural Production and Prices.. .. .. 64Industry.. .. .. .. .. .. .. .. 65
Industrial Policy and Institutional Support .. 65 Industrial Production.. .. .. .. .. 66 Manufacturing.. .. .. .. .. .. 66
Crude Oil .. .. .. .. .. .. .. 67 Crude Oil Production.. .. .. .. .. 67 Crude Oil Prices.. .. .. .. .. .. 68
Gas .. .. .. .. .. .. .. .. 68Petroleum Products .. .. .. .. .. .. 69Solid Minerals.. .. .. .. .. .. .. 69Electricity Generation .. .. .. .. .. .. 70Electricity Consumption.. .. .. .. .. .. 70Industrial Financing.... .. .. .. .. .. 70
NEXIM .. .. .. .. .. .. .. 70Telecommunications .. .. .. .. .. .. 71
Consumer Prices .. .. .. .. .. .. 72 Headline Inflation .. .. .. .. .. 73 Core Inflation.. .. .. .. .. .. 73 Food Inflation.. .. .. .. .. .. 73 Urban and Rural Consumer Price Indices and
Inflation Rates .. .. .. .. .. .. 73Education .. .. .. .. .. .. .. 75Health.. .. .. .. .. .. .. .. 75Aviation Services .. .. .. .. .. .. 75
Domestic and International Operations .. .. 76Maritime Services .. .. .. .. .. .. 76
External Sector Developments .. .. .. .. .. 76 Current Account .. .. .. .. .. .. 77
Trade .. .. .. .. .. .. .. 77 Services .. .. .. .. .. .. .. 79 Income .. .. .. .. .. .. .. 79 Current Transfers.. .. .. .. .. .. 79
Capital and Financial Accounts .. .. .. .. 80 Foreign Direct Investment .. .. .. .. 80 Portfolio Investment .. .. .. .. 80
Capital Importation by Sector.. .. .. .. .. 81Reserve Assets .. .. .. .. .. .. 81External Assets of Financial Institutions .. .. .. .. 83
.. .. .. .. .. 84Regional Institutions .. .. .. .. .. .. .. 84
African Development Bank (AfDB) Annual Meetings.. 84African Union (AU) Meetings.. .. .. .. .. 84
Association of African Central Banks (AACB).. .. 84Economic Community of West African States (ECOWAS) 85
4.3.1.24.3.2
4.3.2.1 4.3.2.2 4.3.2.3
4.3.3 4.3.3.14.3.3.2
4.3.4 4.3.5 4.3.6 4.3.7 4.3.8 4.3.9
4.3.9.14.3.104.3.11
4.3.11.14.3.11.24.3.11.34.3.11.4
4.3.124.3.134.3.14
4.3.14.14.3.15
4.44.4.1
4.4.1.14.4.1.24.4.1.34.4.1.4
4.4.24.4.2.14.4.2.2
4.4.34.4.44.4.5
INTERNATIONAL ECONOMIC RELATIONS5.1
5.1.15.1.25.1.35.1.4
5.0

Inter-Governmental Action Group Against MoneyLaundering (GIABA) .. .. .. .. .. 86Bi-lateral Commissions .. .. .. .. .. 87
Nigeria-Niger Joint Commission.. .. .. 87 Nigeria-Iran Joint Commission.. .. .. 87
Multilateral Economic and Financial institutions.. .. .. 88World Economic Forum Annual Meeting .. .. .. 88The World Bank/IMF Spring Meetings.. .. .. .. 88International Monetary Fund (IMF) Article IV Report
on Nigeria .. .. .. .. .. .. .. 89Group of 8 (G-8) Summit.. .. .. .. .. .. 90Group of 20 (G-20) Summit.. .. .. .. 90
.. .. .. 92
5.1.5
5.1.6 5.1.6.15.1.6.2
5.25.2.1 5.2.2 5.2.3
5.2.45.2.5
6.0 ECONOMIC OUTLOOK FOR THE SECOND HALF OF 2012
CBN Half Year Economic Report for 2012
xiii
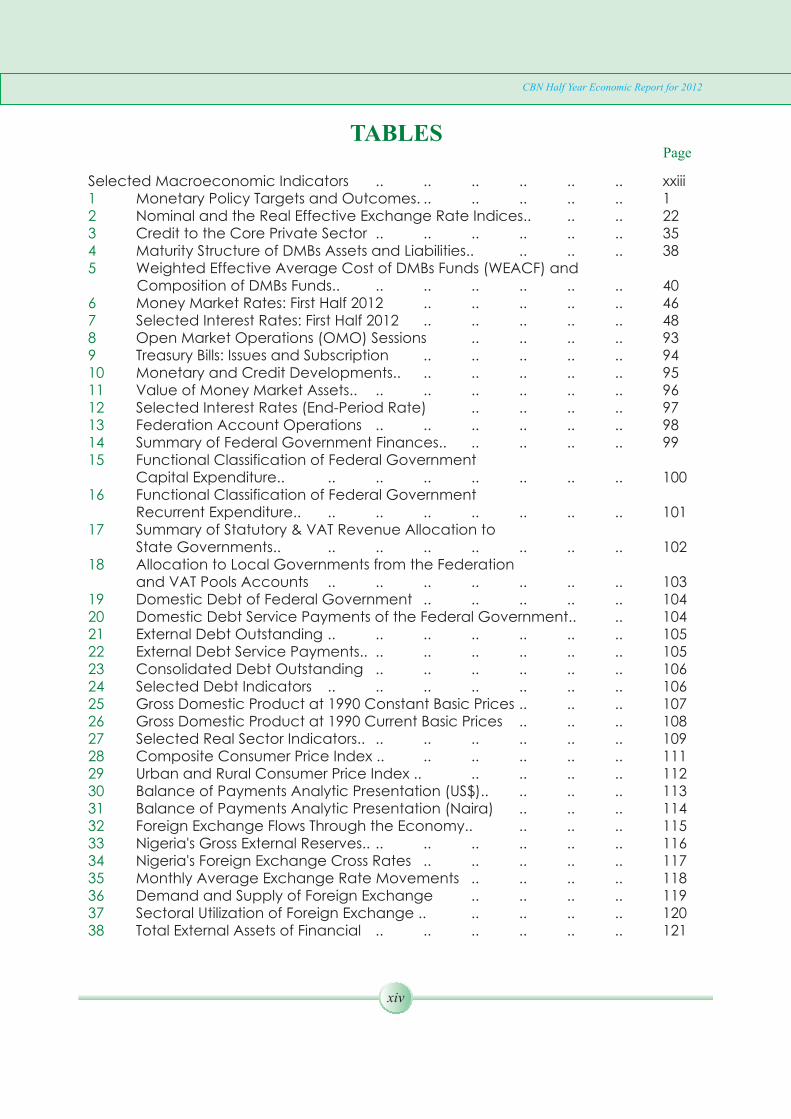
PageTABLES
CBN Half Year Economic Report for 2012
xiv
Selected Macroeconomic Indicators .. .. .. .. .. .. xxiiiMonetary Policy Targets and Outcomes. .. .. .. .. .. 1Nominal and the Real Effective Exchange Rate Indices.. .. .. 22Credit to the Core Private Sector .. .. .. .. .. .. 35Maturity Structure of DMBs Assets and Liabilities.. .. .. .. 38Weighted Effective Average Cost of DMBs Funds (WEACF) and
Composition of DMBs Funds.. .. .. .. .. .. .. 40Money Market Rates: First Half 2012 .. .. .. .. .. 46Selected Interest Rates: First Half 2012 .. .. .. .. .. 48Open Market Operations (OMO) Sessions .. .. .. .. 93Treasury Bills: Issues and Subscription .. .. .. .. .. 94Monetary and Credit Developments.. .. .. .. .. .. 95Value of Money Market Assets.. .. .. .. .. .. .. 96Selected Interest Rates (End-Period Rate) .. .. .. .. 97Federation Account Operations .. .. .. .. .. .. 98Summary of Federal Government Finances.. .. .. .. .. 99Functional Classification of Federal Government Capital Expenditure.. .. .. .. .. .. .. .. 100Functional Classification of Federal Government Recurrent Expenditure.. .. .. .. .. .. .. .. 101Summary of Statutory & VAT Revenue Allocation to State Governments.. .. .. .. .. .. .. .. 102Allocation to Local Governments from the Federation and VAT Pools Accounts .. .. .. .. .. .. .. 103Domestic Debt of Federal Government .. .. .. .. .. 104Domestic Debt Service Payments of the Federal Government.. .. 104External Debt Outstanding .. .. .. .. .. .. .. 105External Debt Service Payments.. .. .. .. .. .. .. 105Consolidated Debt Outstanding .. .. .. .. .. .. 106Selected Debt Indicators .. .. .. .. .. .. .. 106Gross Domestic Product at 1990 Constant Basic Prices .. .. .. 107Gross Domestic Product at 1990 Current Basic Prices .. .. .. 108Selected Real Sector Indicators.. .. .. .. .. .. .. 109Composite Consumer Price Index .. .. .. .. .. .. 111Urban and Rural Consumer Price Index .. .. .. .. .. 112Balance of Payments Analytic Presentation (US$).. .. .. .. 113Balance of Payments Analytic Presentation (Naira) .. .. .. 114Foreign Exchange Flows Through the Economy.. .. .. .. 115Nigeria's Gross External Reserves.. .. .. .. .. .. .. 116Nigeria's Foreign Exchange Cross Rates .. .. .. .. .. 117Monthly Average Exchange Rate Movements .. .. .. .. 118Demand and Supply of Foreign Exchange .. .. .. .. 119Sectoral Utilization of Foreign Exchange .. .. .. .. .. 120Total External Assets of Financial .. .. .. .. .. .. 121
12345 6789101112131415
16
17
18
1920212223242526272829303132333435363738

Page
CHARTS
CBN Half Year Economic Report for 2012
xv
123456789
101112131415161718 192021222324 (a)24 (b)25262728
2930313233343536373839
Volume of Cheques Cleared.. .. .. .. .. .. .. 5Value of Cheques Cleared (Naira Billion). .. .. .. .. 6Volume of Electronic Card Transactions .. .. .. .. .. 7Value of Electronic Card Transactions .. .. .. .. .. 7Volume and Value of ATM Transactions.. .. .. .. .. .. 8Volume and Value of Web Transactions.. .. .. .. .. 8Volume and Value of POS Transactions.. .. .. .. .. .. 9Value of Mobile Transactions.. .. .. .. .. .. .. 9Demand, Supply and Net Demand of Foreign Exchange: Spot Market.. .. .. .. .. .. .. .. .. 14Demand and Supply at the Foreign Exchange Forward Market .. 15Exchange Rate Movements (Naira per US$).. .. .. .. .. 16Interbank/WDAS and BDC/WDAS Premia.. .. .. .. .. 16Forward Exchange Rates.. .. .. .. .. .. .. .. 17Foreign Exchange Disbursements through the CBN.. .. .. .. 18Foreign Exchange Transactions through the CBN.. .. .. .. 19Sectoral Utilization of Foreign Exchange (Visibles).. .. .. .. 20Sectoral Utilization of Foreign Exchange (Invisibles).. .. .. .. 20Nominal Effective Exchange Rate (NEER) and Real EffectiveExchange Rate (REER) .. .. .. .. .. .. .. .. 21Sectoral Distribution of ACGSF Loans (By Purpose).. .. .. .. 22Analysis of CACS Financed Projects by Value Chain .. .. .. 23Sectoral Distribution of Facilities through RRF Participating Banks .. 24Performance of the naira against Major Currencies .. .. .. 29Performance of the naira against Regional Currencies.. .. .. 29Reserve Money and its Components.. .. .. .. .. .. 31Sources of Reserve Money .. .. .. .. .. .. .. 32Growth in Money Supply.. .. .. .. .. .. .. .. 33Distribution of Net Domestic Credit.. .. .. .. .. .. 35Sectoral Distribution of DMBs Credit .. .. .. .. .. 36Distribution of Deposit Money Banks Loans and Advances By Maturity. .. .. .. .. .. .. .. .. .. 36Distribution of DMBs Deposit Structure .. .. .. .. .. 37Component of Private Sector Credit.. .. .. .. .. .. 37Market Concentration Ratios of DMBs .. .. .. .. .. 38Consumer Credit of DMBs .. .. .. .. .. .. .. 39Trends in Weighted Effective Average Cost of DMBs Funds .. .. 40Money Market Assets Outstanding.. .. .. .. .. .. 42Treasury Bills Outstanding .. .. .. .. .. .. .. 43Distribution of FGN Bonds By Tenor.. .. .. .. .. .. 44Money Market Rates.. .. .. .. .. .. .. .. 46
.. .. .. .. 47
.. .. .. .. 48Nominal Interest Rates Movement.. ..Government Bonds Average Yield Curve
CBN Half Year Economic Report for 2012
xvi
40414243444546474849505152535455
56575859606162636465666768697071
Volume and Value of Transactions at the NSE.. .. .. .. .. 53Market Capitalization and NSE Value Index.. .. .. .. .. 54Structure of Gross Federation Revenue.. .. .. .. .. .. 55Breakdown of Federally-Collected Revenue.. .. .. .. .. 55Composition of Federal Government Retained Revenue.. .. .. 57Composition of Federal Government Expenditure.. .. .. .. 57Federal Government Fiscal Balance.. .. .. .. .. .. 59Composition of Total Allocation to State Governments .. .. .. 59Composition of Total Allocation to Local Governments.. .. .. 60Composition of Federal Government Consolidated Debt .. .. 61Trends in Federal Government Debt Service.. .. .. .. .. 62GDP Growth Rate.. .. .. .. .. .. .. .. .. 63Industrial Production Index.. .. .. .. .. .. .. 66Average Manufacturing Capacity Utilization .. .. .. .. 67Crude Oil Production and Exports.. .. .. .. .. .. 67Average Spot Prices of Selected Crudes Traded inthe International Oil Market.. .. .. .. .. .. .. 68Gas Production and Utilization.. .. .. .. .. .. .. 69Consumption of Petroleum Products.. .. .. .. .. .. 70Sectoral Disbursement of NEXIM Loans .. .. .. .. .. 71Total Connected Lines and Tele-density.... .. .. .. .. 72Consumer Price Indices.. .. .. .. .. .. .. .. 72Inflation Rate (Year-on-Year).. .. .. .. .. .. .. 74Urban and Rural Consumer Price Indices.. .. .. .. .. 75Exports, Imports and Trade Balance.. .. .. .. .. .. 77Non-Oil Exports by Products.. .. .. .. .. .. .. 78Non-Oil Imports by Sectors.. .. .. .. .. .. .. 78Share of Services Out-Payments.. .. .. .. .. .. .. 79Private Home Remittances.. .. .. .. .. .. .. 80Net FDI and Portfolio Investment Flows.. .. .. .. .. .. 81Capital Importation by Sector .. .. .. .. .. .. 81External Reserves Stock .. .. .. .. .. .. .. 82Total External Assets.. .. .. .. .. .. .. .. 83
CBN OPERATIONS
LiquidityManagement
POLICY FRAMEWORK
SUMMARY
CBN Half Year Economic Report for 2012
xvii
Monetary targeting, in principle, remained the framework for monetary management during the first half of 2012. In reality, however, actual implementation of monetary policy adopted an eclectic approach, as attention was focused on both quantity and price variables to achieve the objective of monetary and price stability. In this regard, the Bank sustained the use of Open Market Operations (OMO), repurchase transactions, standing facilities and discount windows as the major tools of its monetary operations. These were complemented with prudential requirements such as cash reserve ratio requirement (CRR) and liquidity ratio (LR) as well as primary market transactions in government securities and interventions in the foreign exchange market. Monetary policy implementation remained generally tight with the monetary policy rate (MPR) signalling the stance of policy and serving as the anchor for short-term money market and other rates. The Bank intensified its surveillance activities through regular appraisal and review of banks' returns, spot checks, special investigations and risk-based supervision, among others. The Bank also pursued the implementation of its initiatives on development financing, namely; the N235 billion Intervention Fund for Refinancing and Restructuring of Bank's Loans to the Manufacturing/SME Sector, the N200 billion SME Credit Guarantee Scheme Fund (SMECGS) and the N300 billion Power and Airline Intervention Fund (PAIF). Furthermore, the Bank continued the implementation of Agricultural Credit Guarantee Scheme (ACGS), the Commercial Agricultural Credit Scheme (CACS) and, in addition, approved the establishment of additional three Entrepreneurship Development Centres. The implementation of the Nigeria Incentive-Based Risk Sharing System for Agricultural Lending (NIRSAL) was boosted with the engagement of 26 state Governments.
The OMO continued to be the main tool for liquidity management and was complemented by the CRR, repurchase transactions, standing facilities and discount windows. Additional tools deployed were the issuance of treasury securities in the primary market and interventions in the foreign exchange market through spot and forward auctions as well as in the interbank markets.

Financial SectorSurveillance
Payments&
Clearing System
CBN Half Year Economic Report for 2012
xviii
The payments system continued to witness significant transformation with increased usage of other modes of payment such as the Real Time Gross Settlement (RTGS) System, Nigeria Inter-Bank Settlement System (NIBSS), Inter-Bank Funds Transfer (NEFT), Automated Teller Machine (ATM), mobile banking and internet payments etc., resulting in a decline in the use of cheques during the first half of 2012. In order to reduce cash dependency and further promote e-payments within the economy, the implementation of the pilot-run of the “Cash-less” policy commenced during the review period. The policy provided for a daily cumulative limit for individual and corporate customers on cash withdrawals and lodgements as well as third party encashment over the counter, among others. The Bank continued the deployment of shared POS terminals and maintained a help desk for receiving complaints on card transactions.
The Bank sustained its supervisory efforts to proactively address regulatory issues in the banking system. The CBN in conjunction with the NDIC carried out target examinations of the DMBs to evaluate their risk assets in order to determine compliance with the regulatory thresholds on non-performing loans, capital adequacy and corporate governance. In addition, the Bank conducted risk-based supervision of two foreign subsidiaries of Nigerian banks in conjunction with their host supervisors in the first half of the year. The routine examination of the discount houses, credit bureaux and the Asset Management Corporation of Nigeria (AMCON) was also performed during the period.
Furthermore, the health of the banking sector improved as the capital adequacy ratio (CAR) of all the banks, except one, was consistently above the stipulated minimum of 10.0 per cent. At 62.7 per cent, banks' industry-wide average liquidity ratio (LR) exceeded 30.0 per cent minimum requirement, while the industry's ratio of non-performing credits to total loans, at 4.3 per cent,was below the threshold of 5.0 per cent set by the CBN. As part of efforts to strengthen corporate governance in banks, the CBN in collaboration with the Bankers' Committee issued a draft Competency Framework for comments by the stakeholders. Also, the CBN issued an exposure draft on Financial Inclusion Strategy for Nigeria with the aim of reducing the percentage of adults excluded from access to financial services. To reduce regulatory arbitrage, the Bank directed all other financial institutions (OFIs) to adopt a uniform accounting year-end, effective 31st December 2012. To further tackle money laundering and the financing of terrorism, the Bank developed a
FOREIGN EXCHANGE MANAGEMENT
THE FINANCIAL SECTOR
CBN Half Year Economic Report for 2012
xix
Financial SectorSurveillance
three-level Know-Your-Customer (KYC) regime for banks and other financial institutions during the period.
The exchange rate was relatively stable in the first half of 2012. The demand pressure moderated at the foreign exchange market owing to the intervention by the Bank and the increased supplies from autonomous sources. The average spot rate of WDAS, BDC and inter-bank were N157.65/US$, N164.00/US$ and N162.85/US$, respectively, in the first half of 2012, while the exchange rate for 1-, 2- and 3-month WDAS-FWD averaged N156.19/US$, N156.32/US$ and N156.88/US$, respectively. Furthermore, foreign exchange inflow into the economy increased substantially in the first half of the year, reflecting rise in crude oil receipts and autonomous inflows. However, foreign exchange outflow dropped relative to the level in the corresponding period of 2011. Consequently, there was a net inflow of US$35.44 billion into the economy at the end of the first half of 2012, compared with US$28.85billion at end-June 2011.
Growth in monetary aggregates was sluggish in the first half of 2012. Available data indicated that broad money supply (M2) grew by 1.4 per cent, compared with 5.6 per cent at end-June 2011, while the narrow money supply (M1) fell by 2.5 per cent in the first half of 2012. The development reflected the tight monetary stance of the Bank which was designed to maintain price and monetary stability as well as contain inflationary pressures. Similarly, reserve money was below the indicative benchmark for the first half of 2012 as it fell by 7.8 per cent. Credit to the domestic economy declined by 2.7 per cent in the first half of the year due to the substantial fall in claims on the Federal Government (net). The Federal Government was a net creditor to the banking system as the credit to government (net) declined by 177.8 per cent at end-June 2012. Instruments of short-term maturity remained dominant in the structure of credit and deposit portfolios of deposit money banks. Banks' average prime and maximum lending rates rose by an average of 125 and 127 basis points, respectively, while the spread between banks' average term deposit and maximum lending rates narrowed to 16.46 percentage points from 17.60 percentage points in the first half of 2011. With the year-on-year inflation rate at 12.9 per cent at end-June 2012, all the term deposit rates were negative in real terms. Aggregate institutional savings, at N7,544.4 billion, at end-June 2012declined by 11.5 per cent from the level in the corresponding half year of 2011. The DMBs remained the dominant savings institution, accounting for 91.2
THE REALSECTOR
THE GOVERNMENTSECTOR
CBN Half Year Economic Report for 2012
xx
THE FINANCIAL SECTOR
per cent of the total. Transactions on the floor of the Nigerian Stock Exchange (NSE) were bullish as the All-share Index (ASI) and aggregate market capitalization (MC) rose by 4.2 and 20.4 per cent, to close at 21,599.57 and N12.4 trillion, respectively, at end-June 2012.
Provisional data indicated that total federally-collected revenue (gross), at N5,577.22 billion, was 15.1 and 17.2 per cent higher than both the proportionate budget estimate for fiscal 2012 and the actual revenue in the corresponding period of 2011, respectively. Oil-revenue contributed 78.1 per cent and non-oil revenue accounted for the balance. At N1,741.98 billion, the Federal Government retained revenue was 12.4 per cent lower than the proportionate budget estimate, but higher than the level in the first half of 2011 by 33.4 per cent. Aggregate expenditure of the Federal Government, at N2,023.80 billion, was 20.9 per cent lower than the proportionate budget estimate, but exceeded the amount expended in the first half of 2011 by 3.3 per cent. The lower expenditure performance reflected the delayed disbursements of capital budget and transfers. Notwithstanding, the fiscal operations of the Federal Government resulted in an overall notional deficit of N281.82 billion or 1.5 per cent of GDP, compared with the proportionate budget deficit of N568.31 billion and the actual deficit of N650.23 billion at end-June 2011. At N7,103.48 billion, the stock of Federal Government consolidated debt comprised domestic N6,152.87 billion and external US$6.04 billion (N950.61 billion) rose by 17.6 per cent above the level at end-June 2011.
Provisional data from the National Bureau of Statistics (NBS) revealed that the gross domestic product (GDP) at 1990 constant basic prices grew by 6.4 per cent, compared with 7.4 per cent in the corresponding period in 2011. The growth was driven by the non-oil sector which rose by 7.8 per cent and contributed 85.2 per cent of the GDP. At 250.9 (1990=100), aggregate index of agricultural production increased by 4.2 per cent, compared with 5.6 per cent in the first half of 2011. Activities in the industrial sector improved as the index of production at 136.3 (1990=100) rose by 5.8 per cent above the level in the corresponding period of 2011, largely reflecting the rise in output from manufacturing and mining as well as improved electricity supply. Domestic crude oil production, including condensates at an average daily production of 2.09 million barrels per day (mbd) in the first half of 2012 declined by 0.05 mbd from the level in the first half of 2011. The average spot price of Nigeria's reference crude, the Bonny Light (370 API), was

EXTERNALSECTOR
CBN Half Year Economic Report for 2012
xxi
THE REALSECTOR
ECONOMICOUTLOOK FOR THE
REST OF 2012
US$115.05 per barrel in the first half of 2012, up by 1.0 per cent over the level in the first half of 2011. Inflationary pressures which persisted through the first and second halves of 2011 continued into the first half of 2012 as the composite Consumer Price Index (CPI) stood at 135.3 (November 2009 = 100), compared with 119.9 and 126.0 at end-June and end-December 2011, respectively. The year-on-year headline inflation edged-up to 12.9 per cent at end-June 2012, from 10.2 per cent in the corresponding period of 2011. However, the 12-month moving average trended downward to 11.3 per cent at end-June 2012, compared with 12.3 per cent at end-June 2011.
The performance of the external sector improved in the first half of 2012, following the sustained high price of crude oil at the international market. Consequently, the current account recorded an estimated surplus of N1468.22 billion or 7.7 per cent of GDP and engendered a balance of payment surplus of N438.93 billion or 2.3 per cent of GDP. Provisional data indicated that Nigeria's external assets at end-June 2012 rose significantly by 15.2 per cent to N7,526.88 billion(US$47.79 billion), from its level in the corresponding period of 2011. Similarly, the stock of external reserves grew to US$35.41 billion at end-June 2012 and could finance 7.6 months of current imports. The IMF economic growth projections indicated that global recovery remained weak, thus, growth was projected to moderate at 3.5 per cent in 2012 and the advanced economies were estimated to grow at an average of 1.4 per cent. Growth in the United States was estimated to strengthen modestly at 2.0 per cent and that of Japan at 2.4 per cent, following recovery from earthquake-related losses. The economies of euro area were estimated to contract by 0.3 per cent as a result of the sovereign debt crisis, general loss of confidence and the impact of fiscal consolidation in response to market pressures. In emerging market economies, growth was projected at 5.6 per cent and expected to be sustained by good macroeconomic management and external demand. Global inflation was projected to ease as commodity prices stabilize and demand softens. Inflation rate in the advanced economies was estimated to decelerate to 1.9 per cent and those of emerging and developing economies were expected to decline to 6.2 per cent as food price inflation drops.
The inflationary pressure that was witnessed in the first half of 2012 is expected to moderate slowly in the second half of 2012 as a result of the expected bumper harvest following the clement weather condition for agricultural production during
CBN Half Year Economic Report for 2012
xxii
the period. The continued improvement in electricity supply which aided industrial growth would continue and complement the impact of the expected increase in agricultural output on real GDP growth. Furthermore, the sustained increase in the prices of crude oil in the international market is expected to bolster foreign exchange inflows to further stabilize the foreign exchange market, strengthen the balance of payments position and engender further build-up of external reserves. In addition, the federation revenue is expected to be significantly increased in the face of improved crude oil production and exports occasioned by the sustained peace in the Niger Delta region. Expectedly, improved federation revenue would smoothen budget implementation at all levels of government and provide the required finance for infrastructural projects across the country. The likely huge fiscal injections may engender considerable liquidity inflows into the financial system and exacerbate pressures on the general price level. Nevertheless, the monetary authority is expected to maintain tight policy regime/stance in order to ensure internal and external stability.
ECONOMICOUTLOOK FOR THE
REST OF 2012

CBN Half Year Economic Report for 2012
xxiii
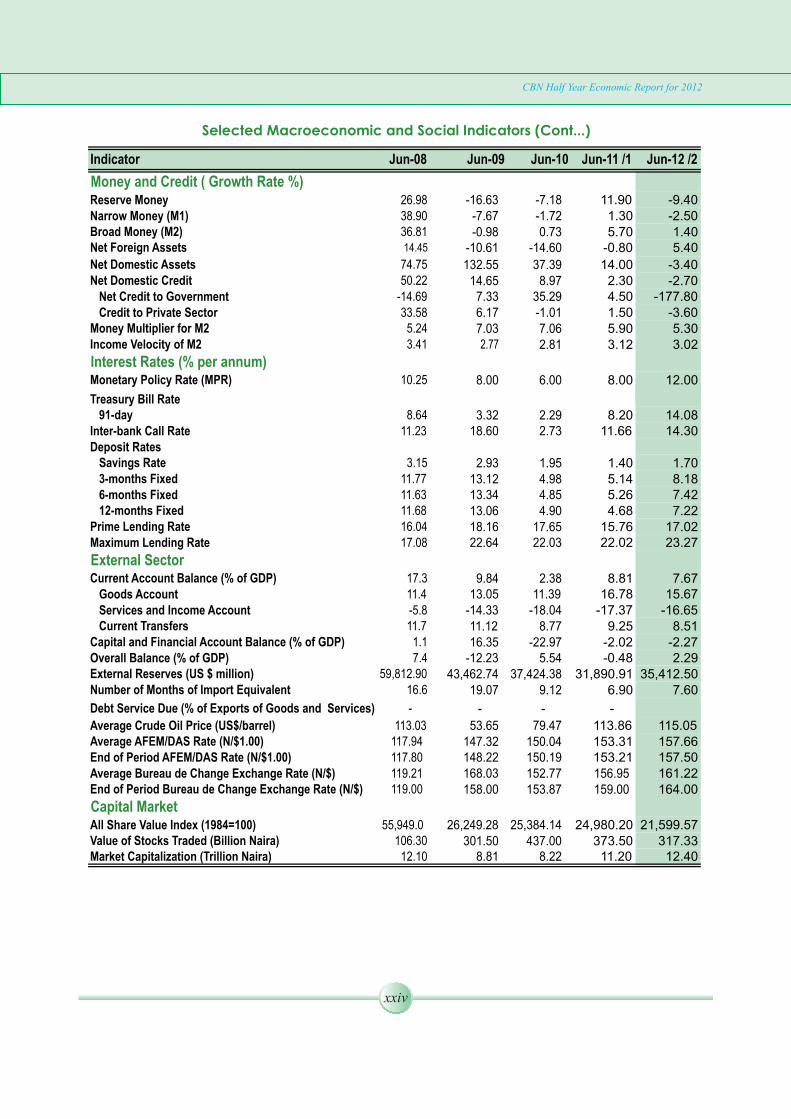
Selected Macroeconomic and Social Indicators
Indicator Jun-08 Jun-09 Jun-10 Jun-11 1/ Jun-12 2/Domestic Output and PricesGDP at Current Mkt Prices (N' billion) 3/ 11,434.30 11,548.71 15,743.23 17,786.39 19,504.81 GDP at Current Mkt Prices (US$' billion) 3/ 96.95 78.39 104.93 116.09 123.72 GDP per Capita (N) 3/ 76,637.42 75,004.10 99,075.34 108,462.59 115,253.53 GDP per Capita (US$) 3/ 649.81 509.12 660.33 707.93 731.07 Real GDP Growth (Growth Rate %) 3/ 5.16 6.27 7.57 7.38 6.38 Oil Sector -3.30 -3.47 3.16 0.45 -1.31
Non-oil Sector 8.65 8.10 8.36 8.71
7.84
Sectoral Classification of GDP (Growth Rate %) Agriculture 6.30 5.82 5.84 5.64 4.06
Industry 4/ -1.93 -1.94 3.88 1.50 0.11
Services 5/ 10.28 10.38 11.40 12.56 13.79
Oil Production (mbd) 1.94 1.76 2.07 2.14 2.09
Manufacturing Capacity Utilisation (%) 1/ 52.60 53.81 54.90 55.73 57.03
Inflation Rate (%) (Year-over-Year) 12.00 11.20 14.10 10.20 12.90
Inflation Rate (%) (12-month moving average) 7.00 13.70 13.10 12.30 11.30
Core Inflation Rate (%) (Year-over-Year) 7/ 3.60 8.50 12.70 11.50 15.20
Core Inflation Rate (%) (12-month moving average) 7/ 5.80 8.30 10.90 12.10 12.70Federal Government Finance (% of GDP)Retained Revenue 11.35 11.22 10.71 8.19 9.10
Total Expenditure 11.42 14.10 14.68 12.52 10.60
Recurrent Expenditure 7.81 9.01 10.89 9.69 8.40
Of which: Interest Payments Foreign 0.31 0.17 0.15 0.09 0.14
Domestic 0.94 0.89 1.14 1.28 0.51
Capital Expenditure and Net Lending 3.03 4.21 3.37 1.90 1.40
Transfers 0.58 0.88 0.43 0.58 0.80
Current Balance (Deficit(-)/Surplus(+)) 3.54 2.21 -0.18 -1.50 0.70
Primary Balance (Deficit(-)/Surplus(+)) 1.17 -1.81 -2.68 -3.00 0.20
Overall Fiscal Balance (Deficit(-)/Surplus(+)) -0.07 -2.87 -3.97 -4.33 -1.50
Financing Foreign 0.00 0.00 0.57 0.46 0.00
Domestic 0.00 0.00 3.41 3.87 1.50
Banking System 0.00 0.00 0.00 0.00 0.00
Non-bank Public 0.00 0.00 2.78 2.98 0.00
Others 0.07 2.87 -0.11 0.88 1.50
Consolidated Government Debt Stock External 1.50 2.23 2.23 2.35 2.40 Domestic 7.80 11.38 13.11 14.78 15.5
CBN Half Year Economic Report for 2012
xxiv
Indicator Jun-08 Jun-09 Jun-10 Jun-11 /1 Jun-12 /2
Money and Credit ( Growth Rate %)Reserve Money 26.98 -16.63 -7.18 11.90 -9.40Narrow Money (M1) 38.90 -7.67 -1.72 1.30 -2.50Broad Money (M2) 36.81 -0.98 0.73 5.70 1.40Net Foreign Assets 14.45 -10.61 -14.60 -0.80 5.40
Net Domestic Assets 74.75 132.55 37.39 14.00 -3.40Net Domestic Credit 50.22 14.65 8.97 2.30 -2.70 Net Credit to Government -14.69 7.33 35.29 4.50 -177.80 Credit to Private Sector 33.58 6.17 -1.01 1.50 -3.60Money Multiplier for M2 5.24 7.03 7.06 5.90 5.30Income Velocity of M2 3.41 2.77 2.81 3.12 3.02
Interest Rates (% per annum)Monetary Policy Rate (MPR) 10.25 8.00 6.00 8.00 12.00
Treasury Bill Rate 91-day 8.64 3.32 2.29 8.20 14.08Inter-bank Call Rate 11.23 18.60 2.73 11.66 14.30Deposit Rates Savings Rate 3.15 2.93 1.95 1.40 1.70 3-months Fixed 11.77 13.12 4.98 5.14 8.18 6-months Fixed 11.63 13.34 4.85 5.26 7.42 12-months Fixed 11.68 13.06 4.90 4.68 7.22Prime Lending Rate 16.04 18.16 17.65 15.76 17.02Maximum Lending Rate 17.08 22.64 22.03 22.02 23.27
External SectorCurrent Account Balance (% of GDP) 17.3 9.84 2.38 8.81 7.67 Goods Account 11.4 13.05 11.39 16.78 15.67 Services and Income Account -5.8 -14.33 -18.04 -17.37 -16.65 Current Transfers 11.7 11.12 8.77 9.25 8.51Capital and Financial Account Balance (% of GDP) 1.1 16.35 -22.97 -2.02 -2.27Overall Balance (% of GDP) 7.4 -12.23 5.54 -0.48 2.29External Reserves (US $ million) 59,812.90 43,462.74 37,424.38 31,890.91 35,412.50Number of Months of Import Equivalent 16.6 19.07 9.12 6.90 7.60
Debt Service Due (% of Exports of Goods and Services) -
-
-
-
Average Crude Oil Price (US$/barrel) 113.03 53.65 79.47 113.86 115.05Average AFEM/DAS Rate (N/$1.00) 117.94
147.32 150.04 153.31 157.66End of Period AFEM/DAS Rate (N/$1.00) 117.80
148.22 150.19 153.21 157.50Average Bureau de Change Exchange Rate (N/$) 119.21
168.03 152.77 161.22End of Period Bureau de Change Exchange Rate (N/$) 119.00
158.00 153.87 164.00
Capital MarketAll Share Value Index (1984=100) 55,949.0
26,249.28 25,384.14 24,980.20 21,599.57Value of Stocks Traded (Billion Naira) 106.30 301.50 437.00 373.50 317.33Market Capitalization (Trillion Naira) 12.10 8.81 8.22 11.20 12.40
Selected Macroeconomic and Social Indicators (Cont...)
156.95159.00
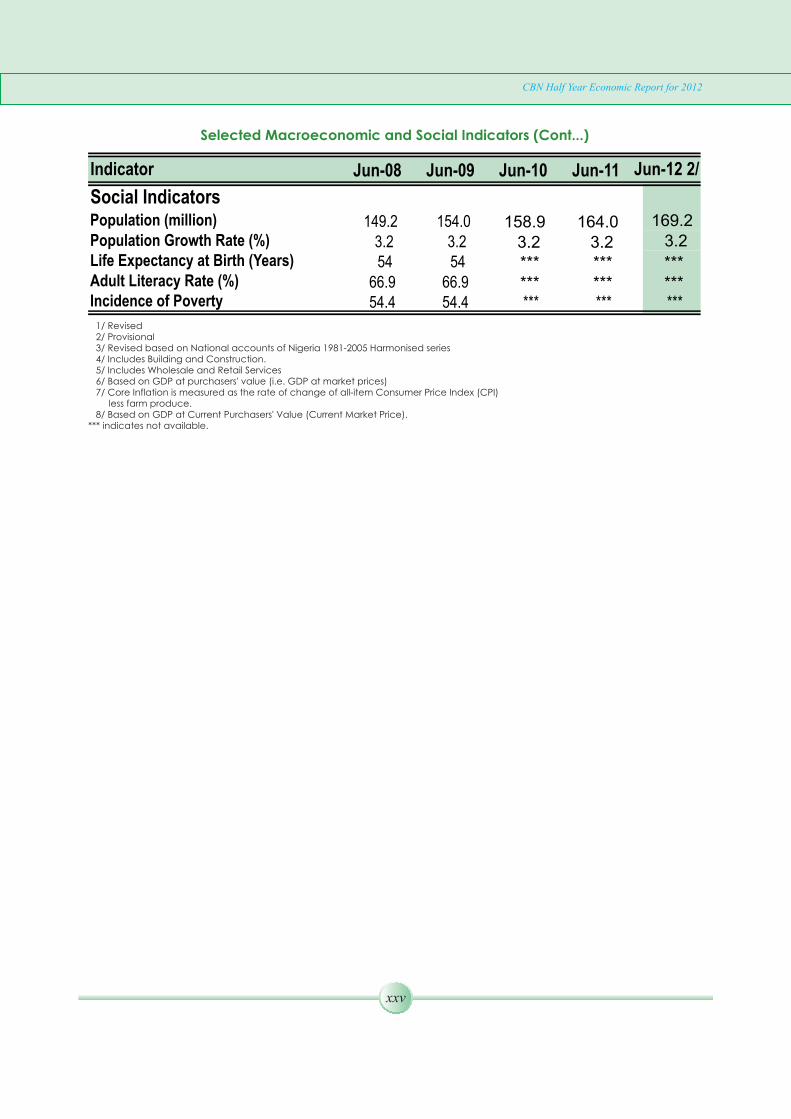
Indicator Jun-08 Jun-09 Jun-10 Jun-11 Jun-12 2/
Social IndicatorsPopulation (million) 149.2 154.0 158.9 164.0 169.2Population Growth Rate (%) 3.2 3.2 3.2 3.2 3.2Life Expectancy at Birth (Years) 54 54 *** ***Adult Literacy Rate (%) 66.9 66.9 *** ***Incidence of Poverty 54.4 54.4 *** ***
1/ Revised 2/ Provisional 3/ Revised based on National accounts of Nigeria 1981-2005 Harmonised series 4/ Includes Building and Construction. 5/ Includes Wholesale and Retail Services 6/ Based on GDP at purchasers' value (i.e. GDP at market prices) 7/ Core Inflation is measured as the rate of change of all-item Consumer Price Index (CPI) less farm produce. 8/ Based on GDP at Current Purchasers' Value (Current Market Price).*** indicates not available.
Selected Macroeconomic and Social Indicators (Cont...)
CBN Half Year Economic Report for 2012
xxv
*********


CBN Half Year Economic Report for 2012
1
CENTRAL BANK OF NIGERIA
ECONOMIC REPORT FOR THE FIRST HALF OF 2012
1.0 INTRODUCTION
The focus of monetary policy in the first half of 2012 remained the maintenance of price
and monetary stability through liquidity management. The Bank took necessary steps to
sustain financial sector stability and banking soundness as well as enhance the efficiency
of the payments system. Monetary targeting was, in principle, the main framework for
monetary management, although actual implementation of monetary policy was
generally eclectic with focus on both quantity and price variables to guide monetary
policy decision. The adjustment of the Monetary Policy Rate (MPR) continued to signal
the stance of monetary policy and serves as the anchor for short-term money market and
other rates. The Bank retained the various restrictive monetary policy measures adopted
during the second half of 2011 to achieve the objectives of monetary policy consistent
with the real Gross Domestic Product (GDP) growth target of 7.33 per cent for 2012 and
single digit inflation rate. The major approach to monetary management also remained
the sale and purchase of treasury bills through Open Market Operations (OMO),
repurchase transactions and standing facilities, complemented with discount window
operations, cash reserve requirement (CRR) and liquidity ratio (LR). Primary market
transactions in government securities and foreign exchange market interventions
continued to be used to support monetary management.
The major monetary policy targets set for 2012 and the provisional outcome as at the end
of the first half are provided in the table 1 below:
Table 11Monetary Policy Targets and Outcomes (Growth in % except otherwise stated) /
Key Policy Variables
2008 2009 2010 2011 2012 OutcomeHalf Year
2012
Broad Money Growth (M2) 56.83 20.80 29.30 13.75 24.64 2.70
Narrow Money Growth (M1) 56.00 32.23 22.40 15.75 34.71 -5.07
Base Money (Reserve) Naira Billion
1,124.80 1,346.30 1,872.80 1,771.40 2,726.14 2,519.26
Aggregate credit to the domestic economy(Net)
72.84
86.97
51.40
27.69
52.17
-5.46
Credit to Government (Net)
-5.31
21.90
25.70
29.29
61.47
-355.70
Credit to the private sector
33.95
44.99
31.50
23.34
47.50
7.20
Inflation rate
10.20
10.00
11.20
10.00
11.20
12.9
Real GDP Growth
5.00
5.00
6.10
7.40
7.33
6.38
2/
1/ Annualised2/ Provisional

2.0 OPERATIONS OF THE CENTRAL BANK OF NIGERIA
2.1 Liquidity Management
2.2 Monetary Policy Committee (MPC) Decisions
Following the restrictive monetary policy stance of the Bank aimed at achieving its price
and monetary stability mandate, growth in reserve money and major monetary
aggregates was sluggish in the first half of 2012. The reserve (base) money, which stood at
N2,519.26 billion at end-June 2012, was N206.88 billion or 7.59 per cent below the
indicative benchmark of N2,726.14 billion for end-June 2012. With the threat of inflation
arising from a number of factors including the partial removal of subsidy on Premium
Motor Spirit (PMS) on January 1, 2012, the announcement of the increase in tariffs on
some imported consumer goods and in electricity tariffs, both effective July 1, 2012, as
well as the fiscal injections associated with the monthly disbursement to the three tiers of
government, the Bank deployed a number of liquidity management tools to contain the
inflationary pressures. These included the retention of: MPR at 12.00 per cent with a
symmetric corridor of +/- 200 basis points around the MPR; CRR at 8.00 per cent; LR at
30.00 per cent; and the mid-point of exchange rate at N155/US1 with a band of +/-3.0 per
cent.
Open Market Operations (OMO) remained the main tool for liquidity management
during the review period. This was complemented by the CRR and LR. Other tools
included: standing facilities, repurchase transactions, discount window operations and
the issuance of treasury securities in the primary market. The domestic money market
instruments were complemented by foreign exchange market interventions at the
Wholesale Dutch Auction System (wDAS) window through spot and forwards auctions
and at the inter-bank market.
The Monetary Policy Committee (MPC) held three (3) regular meetings in the first half of
2012. A summary of the key decisions of the MPC during the period is presented as follows:
2
CBN Half Year Economic Report for 2012
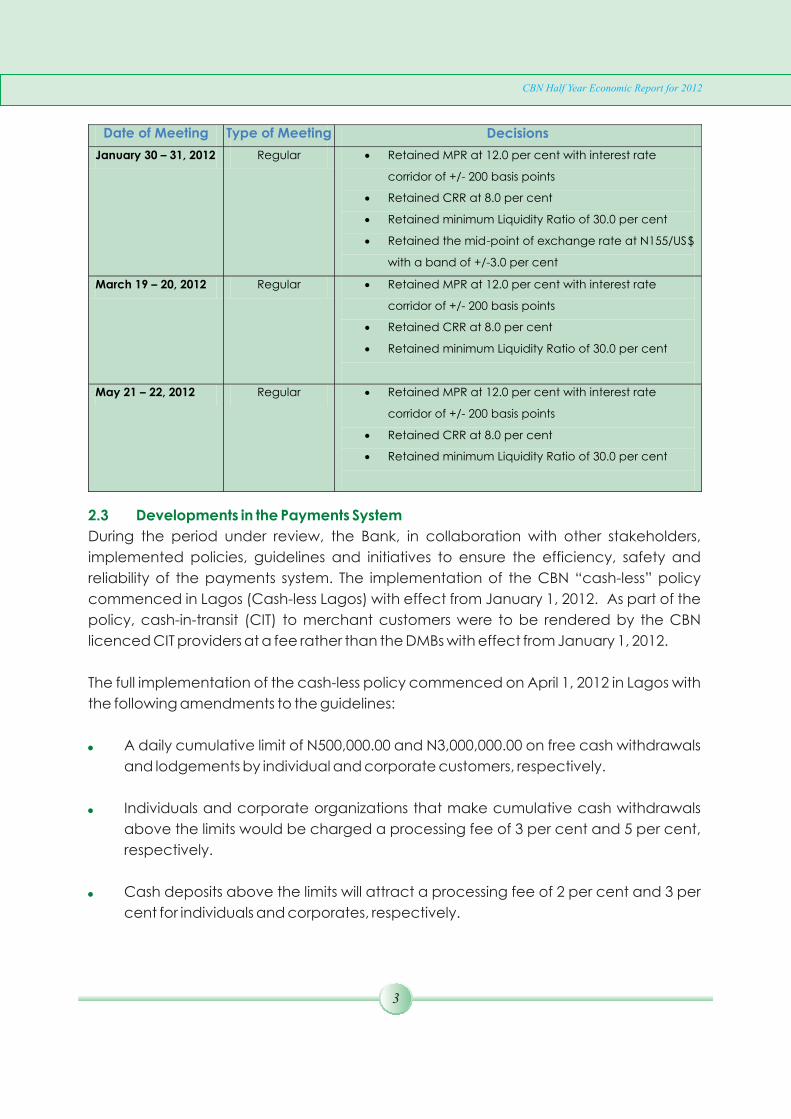
Date of Meeting Type of Meeting Decisions
January 30 – 31, 2012 Regular · Retained MPR at 12.0 per cent with interest rate
corridor of +/- 200 basis points
· Retained CRR at 8.0 per cent
· Retained minimum Liquidity Ratio of 30.0 per cent
· Retained the mid-point of exchange rate at N155/US$
with a band of +/-3.0 per cent
March 19 – 20, 2012 Regular · Retained MPR at 12.0 per cent with interest rate
corridor of +/- 200 basis points
· Retained CRR at 8.0 per cent
·
Retained minimum Liquidity Ratio of 30.0 per cent
May 21 –
22, 2012
Regular
·
Retained MPR at 12.0 per cent with interest rate
corridor of +/-
200 basis points
·
Retained CRR at 8.0 per cent
·
Retained minimum Liquidity Ratio of 30.0 per cent
2.3 Developments in the Payments System
During the period under review, the Bank, in collaboration with other stakeholders,
implemented policies, guidelines and initiatives to ensure the efficiency, safety and
reliability of the payments system. The implementation of the CBN “cash-less” policy
commenced in Lagos (Cash-less Lagos) with effect from January 1, 2012. As part of the
policy, cash-in-transit (CIT) to merchant customers were to be rendered by the CBN
licenced CIT providers at a fee rather than the DMBs with effect from January 1, 2012.
The full implementation of the cash-less policy commenced on April 1, 2012 in Lagos with
the following amendments to the guidelines:
A daily cumulative limit of N500,000.00 and N3,000,000.00 on free cash withdrawals
and lodgements by individual and corporate customers, respectively.
Individuals and corporate organizations that make cumulative cash withdrawals
above the limits would be charged a processing fee of 3 per cent and 5 per cent,
respectively.
Cash deposits above the limits will attract a processing fee of 2 per cent and 3 per
cent for individuals and corporates, respectively.
3
CBN Half Year Economic Report for 2012
Exemptions are granted to Ministries, Departments and Agencies (MDAs) of the
Federal and State governments for the purpose of revenue collection as well as
direct lodgements and withdrawals of Primary Mortgage Banks (PMBs) and
Microfinance Banks (MFBs) in recognition of the nature of their operations.
Third party cheques above N150,000.00 shall not be eligible for encashment over
the counter. Value for such cheques shall be received through the clearing house.
Furthermore, the Bank continued with the implementation of the following initiatives, to
ensure the success of cash-less Lagos:
Engagement of relevant stakeholders by the Nigeria Electronic Fraud Forum (NeFF)
to ensure that a collaborative industry board is put in place to proactively manage
e-fraud attempts and limit losses.
Transformation of Nigeria Interbank Settlement System (NIBSS) plc to effectively play
the role of Payments Terminal Service Aggregator (PTSA).
Monitoring of cash-less Lagos to track and assess its impact on a monthly basis –
both in terms of usage of electronic channels, cash circulation and cash holding
rates. This would allow the CBN to provide information on the progress of the
scheme to relevant stakeholders, and also manage public perception.
Massive deployment of shared Point-of-Sale(POS) terminals under the shared
service project with a view to reducing cost.
In addition, the Bank maintained its help desk for receiving public complaints on
electronic card transactions, with a view to fast-tracking the resolution and monitoring of
DMBs' compliance within the stipulated 72-hour timeline. The CBN also conducted audit
of the licensed mobile payment operators to ensure compliance with the Mobile
Payments Regulatory Framework.
These initiatives have increased public awareness and confidence, improved customer
convenience, and reduced the time spent on banking transactions.
In continuation of the implementation of the Payment System Vision (PSV) 2020, the CBN:
Granted commercial licences to 15 mobile payment scheme operators, while 14
others were at various stages of pilot run.
CBN Half Year Economic Report for 2012
4

Conducted sensitization workshops for Lagos State Government and its Local
Government Councils on the adoption of end-to-end electronic payment of
government suppliers, salaries, pension and taxes.
Approved Guidelines on Cheque Truncation in Nigeria.
Continued the review of the guidelines on:
- Transaction Switching Services;
- Stored Value and Prepaid Card Issuance.
Continued the process of replacing the current Real-Time Gross Settlement (RTGS)
System with a version that is expected to meet the requirements of FSS 2020.
Followed up on the Payments System Management Bill earlier presented to the
National Assembly.
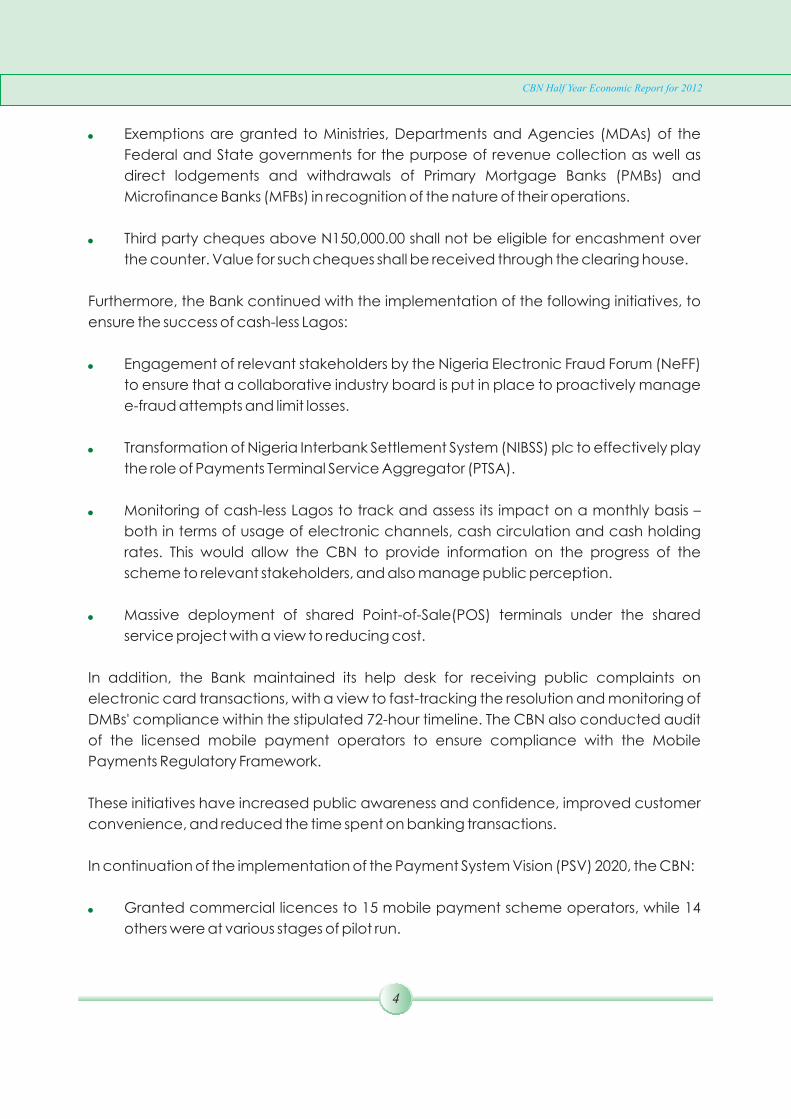
At the end of June 2012, the volume and value of cleared cheques decreased by 12.1
and 13.5 per cent to 18,154,880 and N10,081.39 billion, from 20,663,260 and N11,657.93
billion, respectively, at end-December 2011. This development resulted from increased
use of electronic channels.
2.3.1 Retail Payments System
2.3.1.1 Cheque
Figure 1Volume of Cheques Cleared
-
5,000,000
10,000,000
15,000,000
20,000,000
25,000,000
First Half 2011 Second Half 2011 First Half 2012
CBN Half Year Economic Report for 2012
5
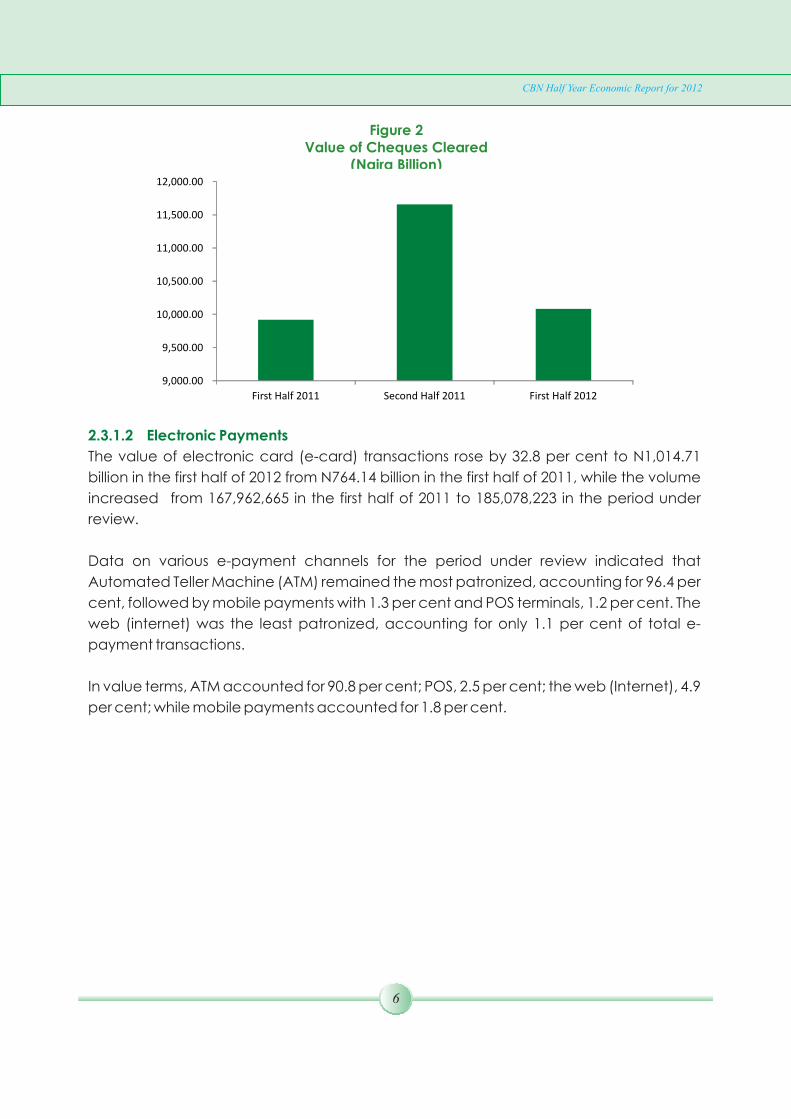
Figure 2Value of Cheques Cleared
(Naira Billion)
9,000.00
9,500.00
10,000.00
10,500.00
11,000.00
11,500.00
12,000.00
First Half 2011 Second Half 2011 First Half 2012
2.3.1.2 Electronic Payments
The value of electronic card (e-card) transactions rose by 32.8 per cent to N1,014.71
billion in the first half of 2012 from N764.14 billion in the first half of 2011, while the volume
increased from 167,962,665 in the first half of 2011 to 185,078,223 in the period under
review.
Data on various e-payment channels for the period under review indicated that
Automated Teller Machine (ATM) remained the most patronized, accounting for 96.4 per
cent, followed by mobile payments with 1.3 per cent and POS terminals, 1.2 per cent. The
web (internet) was the least patronized, accounting for only 1.1 per cent of total e-
payment transactions.
In value terms, ATM accounted for 90.8 per cent; POS, 2.5 per cent; the web (Internet), 4.9
per cent; while mobile payments accounted for 1.8 per cent.
CBN Half Year Economic Report for 2012
6
Figure 3Volume of Electronic Card Transaction First Half 2012
ATM
96.4%
POS1.2%
WEB1.1%
MOBILE1.3%
Figure 4Value of Electronic Card Transactions First Half 2012
ATM90.8%
POS
2.5%
WEB
4.9%
MOBILE 1.8%
2.3.1.2.1 ATM Transactions
The number of ATMs stood at 10,221 as at end-June 2012. The volume of ATM transactions
amounted to 178,421,736 compared with 164,755,055 in the first half of 2011, and
represented an increase of 8.3 per cent. The value of ATM transactions, also, increased
during the period to N937.39 billion from N698.19 billion representing an increase of 34.3
per cent. The development reflected the increasing popularity of the mode of payment
by the public.
CBN Half Year Economic Report for 2012
7

Figure 5Volume and Value of ATM Transactions
164.76
178.42
698.19
937.39
-
200.00
400.00
600.00
800.00
1,000.00
First Half 2011 First Half 2012
Volume (Millions) Value (Naira Billion)
2.3.1.2.2 Web Transactions
Internet payments increased by 74.8 and 9.3 per cent to 2,103.4 and N50.4 billion in
volume and value, respectively, in the review period. The rise was due to increased
acceptance of the use of online payments.
Figure 6Volume and Value of Web Transactions
1.20
2.10
46.10
50.44
-
10.00
20.00
30.00
40.00
50.00
60.00
First Half 2011 First Half 2012
Volume (Millions) Value (Naira Billion)
2.3.1.2.3 Point of Sale (POS) Transactions
The first half of 2012 witnessed an increase in the volume and value terms of on-line POS
transactions. At 2,121.9 and N26.04 billion, POS transactions rose by 162.3 and 104.4 per
cent over the levels in the corresponding half of 2011. The growth in the POS transactions
was due to the increase in the number of people and merchants using debit cards.
CBN Half Year Economic Report for 2012
8
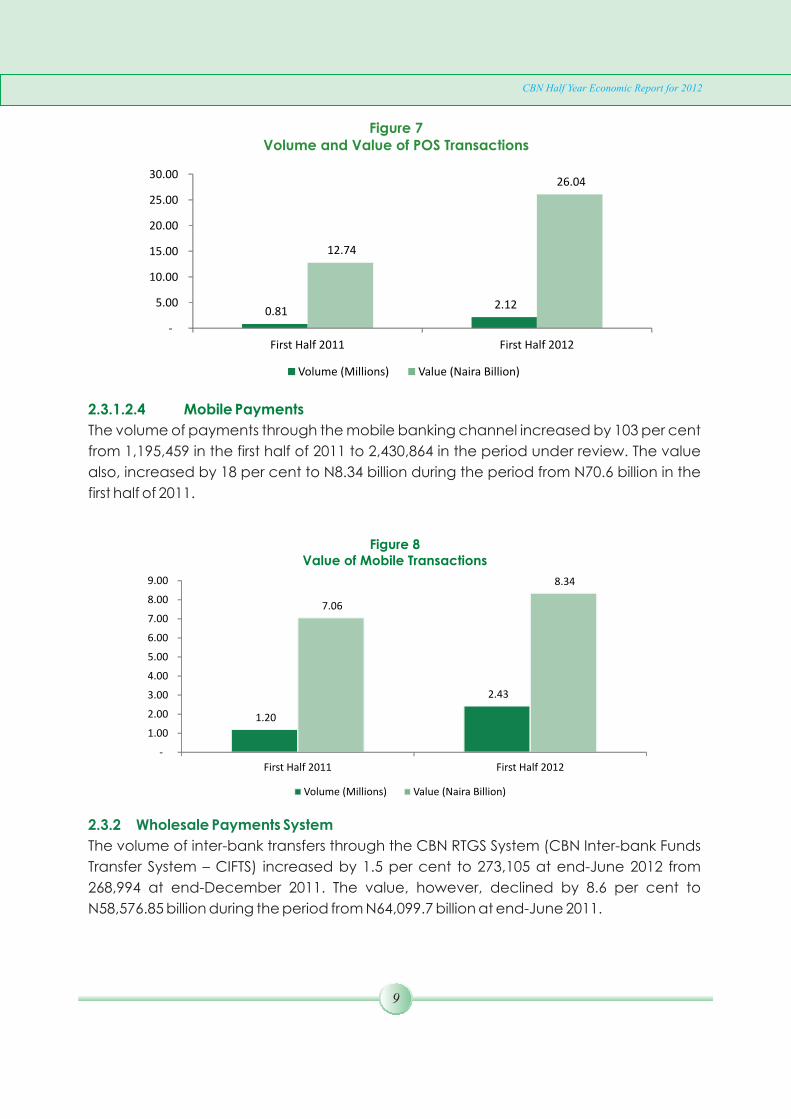
Figure 7Volume and Value of POS Transactions
0.81
2.12
12.74
26.04
-
5.00
10.00
15.00
20.00
25.00
30.00
First Half 2011 First Half 2012
Volume (Millions) Value (Naira Billion)
2.3.1.2.4 Mobile Payments
The volume of payments through the mobile banking channel increased by 103 per cent
from 1,195,459 in the first half of 2011 to 2,430,864 in the period under review. The value
also, increased by 18 per cent to N8.34 billion during the period from N70.6 billion in the
first half of 2011.
Figure 8Value of Mobile Transactions
2.3.2 Wholesale Payments System
The volume of inter-bank transfers through the CBN RTGS System (CBN Inter-bank Funds
Transfer System – CIFTS) increased by 1.5 per cent to 273,105 at end-June 2012 from
268,994 at end-December 2011. The value, however, declined by 8.6 per cent to
N58,576.85 billion during the period from N64,099.7 billion at end-June 2011.
CBN Half Year Economic Report for 2012
9
1.20
2.43
7.06
8.34
-
1.00
2.00
3.00
4.00
5.00
6.00
7.00
8.00
9.00
First Half 2011 First Half 2012
Volume (Millions) Value (Naira Billion)
2.4 Financial Sector Surveillance
2.4.1 Banking Supervision
The CBN intensified its supervisory and surveillance activities in the banking sector in the
first half of 2012. In this regard, the Bank continued close monitoring of banks through
regular appraisal and review of banks' periodic returns, spot checks, special
investigations and risk-based supervision, among others, to ensure that regulatory
concerns were proactively addressed.
In the first half of 2012, two (2) banks had fully complied with the provisions of the
regulation on the scope of banking activities and ancillary matters under the new
banking regulation policy. The new banking policy requires banks to: divest their interest
in non-permitted subsidiaries; dispose off non-permitted equity investments and real
estate investments. The two (2) affected banks were subsequently granted banking
licenses with national authorisation. Six (6) other banks had applied and obtained
extension of deadline, while two (2) applications for extension of deadline were being
processed. Nine (9) banks were yet to conclude divestment in subsidiaries and four (4)
had holding company (Holdco) arrangements.
As part of the effort towards combating money laundering and financing terrorism, the
CBN developed a three-level tier Know-Your Customer (KYC) regime for banks and other
financial institutions during the review period. Also, to promote financial inclusion, the
CBN issued an exposure draft on Financial Inclusion Strategy for Nigeria. The strategy is
aimed at reducing the percentage of adult Nigerians excluded from access to financial
services from 46.3 percent in 2010 to 20.0 percent by 2020.
The CBN Credit Risk Management System (CRMS) recorded improved basic credit
information on customers in the first half of the year. The number of borrowers registered
in the CRMS database rose by 9.2 per cent to 84, 090, reflecting increased awareness by
banks and customers on the critical role of CRMS database. The value of outstanding
credits, however, declined from N5,227 billion at end-June 2011 to N4,635 billion, owing
largely to the take-over of most bank's toxic assets by AMCON. Similarly, the number of
borrowers with outstanding credit facilities equal to or above N1.0 million declined from
26,854 at end-June 2011 to 26,119.
In order to avoid regulatory arbitrage and provide a level playing field for all operators in
the industry, the Bank directed all other financial institutions (OFIs) sub-sector, comprised
primary mortgage banks, microfinance banks and finance companies, to adopt a
uniform accounting year-end with effect from 31st December 2012. The directive
conforms with the earlier one given to all DMBs and discount houses in Nigeria to adopt
CBN Half Year Economic Report for 2012
10
31st December as a uniform accounting year-end from 2009 enshrined in the Companies
and Allied Matters Act (CAMA) 1990, as amended.
The CBN/NDIC carried out a joint target examination of all the DMBs in the first half of
2012. The examination was conducted to evaluate the risk assets of the DMBs to
determine compliance with regulatory thresholds on non-performing loans, capital
adequacy ratio and code of corporate governance. Similarly, the adequacy of the risk
management processes of the DMBs was appraised. Material lapses, observations and
remedial advice were communicated to the Board and Management of the banks as
appropriate.
In addition, the routine examination of discount houses and credit bureaux were
conducted, while that of the Asset Management Corporation of Nigeria (AMCON) was
deferred to the second quarter of 2012. Similarly, the Bank conducted risk-based
supervision of two foreign subsidiaries of Nigerian banks in conjunction with their
respective host supervisors. The joint report, superintended by the host regulator would
be in conformity with recent resolution of the West African Monetary Zone (WAMZ).
An on-site assessment of the foreign exchange operations of 18 DMBs was carried out in
the first half of 2012. The exercise was to determine the level of compliance by banks with
the provisions of the CBN guidelines on Wholesale Dutch Auction System (wDAS). Also, an
examination of the transactions in the recently introduced foreign exchange products
including derivatives was carried out. The exercise highlighted several lapses by some
banks, including breaches of the CBN approved net open position limit, the retention of
unsold wDAS official funds beyond 5 working days, and the use of official funds for the
repatriation of capital. Appropriate sanctions were administered on the DMBs found to
have been in breach.
The health of banks improved in the first half of 2012 with the successful recapitalisation of
CBN-intervened banks and the acquisition of bridge banks by AMCON. The average
Capital Adequacy Ratio (CAR) of the banks in the industry was consistently above the
stipulated minimum of 10.0 per cent in the first half of 2012. The industry average CAR
stood at 17.7 per cent, compared with 17.9 and 5.0 per cent at end-December 2011 and
the corresponding period of 2011, respectively. With the exception of one bank, all the
banks met the regulatory minimum CAR of 10.0 per cent with the highest and lowest at
34.1 and a negative 7.8 per cent, respectively. All the banks in the industry met the
2.4.2 Target Examination
2.4.3 Routine/Special Foreign Exchange Examinations
2.4.4 Banking Sector Soundness
CBN Half Year Economic Report for 2012
11
prescribed minimum liquidity ratio (LR) of 30.0 per cent at end-June 2012. Banks' industry-
wide average liquidity ratio stood at 62.7 per cent at end-June 2012, compared with 50.3
per cent at end-June 2011. The industry's ratio of non-performing loans to total loans
declined to 4.3 per cent, from 5.0 per cent at end-December 2011. This was below the
maximum threshold of 5.0 per cent set by the CBN. The development was attributed to
the acquisition of non-performing loans in the industry by AMCON and improved risk
management practices by the DMBs.
As part of the on-going effort to strengthen corporate governance in the industry, the
Bank, in collaboration with the Bankers' Committee, issued a draft competency
framework for comments/input by the industry stakeholders. The framework provides
details of proposed guidelines by the Bank to promote, standardise and sustain skills and
competency development in the Nigerian banking industry. Specific objectives of the
framework include to:
i. define the minimum knowledge, skills and competencies needed for operators
and regulators to perform optimally;
ii. standardise capacity and competency development with a view to nurturing
and producing a knowledgeable, skilled and competent workforce for the
Nigerian banking industry;
iii. serve as tool for banks to assess their overall human capital capabilities; and
iv. provide basis for sustaining career development in the Nigerian banking industry.
The number and value of reported cases of attempted and/or successful fraud/forgery in
the banking industry increased in the first half of the year. There were 2,300 reported
cases of attempted or successful fraud and forgery, involving the sum of N7.11 billion,
compared with 1,393 cases, valued at N6.52 billion recorded at the end of the
corresponding period of 2011. Of this amount, the actual loss to the banks during the
period was N2.5 billion, representing 35.2 per cent of the total fraud amount, up from
N1.95 billion in the corresponding period of 2011.
The various cases were carried out through diverse means, including fraudulent
withdrawals from customers' accounts, suppression and conversion of customers'
deposits, theft, illegal funds transfer, cheque defalcations, and fraudulent ATM
2.4.5 Compliance with the Code of Corporate Governance for Banks in Nigeria
2.4.6 Fraud and Forgeries
CBN Half Year Economic Report for 2012
12
withdrawals, among others. In most cases, the frauds were perpetrated by outsiders,
although there were instances where bank employees were involved.
On-site examination was conducted on three hundred and eighty-five (385)
microfinance banks (MFBs) during the first half of 2012. The exercise included special
examination on thirty-five institutions with respect to their compliance with prescribed
supervisory actions. In addition, sixteen (16) selected MFBs in Abuja, Lagos and Enugu
were examined under the risk-based supervision (RBS) approach as part of the
arrangement for the full-scale adoption of the framework. The reports of the examination
showed that most of the institutions needed improvement on their risk management
control functions. Consequently, arrangement was being made to hold risk
management sensitization programmes for operators to address the issue, while
continuing with the capacity building programme for bank examiners. Also, in an effort to
ensure compliance with foreign exchange regulations by BDCs, spot-checks were
carried out on 60 BDCs in the first half of 2012.
The Bank sustained the use of wDAS as the mechanism for foreign exchange
management in the first half of 2012. Cumulative demand at the foreign exchange
market dropped by 28.5 per cent to US$14.99 billion from US$27.23 billion in the
corresponding period of 2011. Total sales also fell, by 5.3 per cent, to US$16.69 billion
relative to the level at end-June 2011. The naira/dollar rates at all the segments of the
market were relatively stable, largely as a result of increased supply of foreign exchange
through autonomous sources to the interbank segment. In addition, the Bank intervened
in the market to dampen demand pressure and increased the net open position of DMBs
in part to curtail speculative foreign exchange demand. Furthermore, the mid-point
exchange rate band was adjusted from N150 +/- 3.0 per cent to N155 +/- 3.0 per cent.
A total of forty-nine (49) trading sessions were held under the wDAS spot segment of the
foreign exchange market compared with forty-eight (48) in the corresponding period of
2011. Aggregate wDAS and BDC demand dropped by 40.1 and 27.0 per cent to US$14.42
billion from US$24.11 billion at end-December, 2011 and the corresponding period of
2011. This was due largely to the increased supply of foreign exchange by oil companies
at the interbank segment of the foreign exchange market and the inflow of portfolio
investments for the purchase of federal government bonds. Of the total demand at the
spot segments, wDAS amounted to US$10.96 billion (76.0 per cent) and BDC US$3.46
billion (24.0 per cent).
2.4.7 Examination of Other Financial Institutions
2.5 Foreign Exchange Management
2.5.1. Spot Segment of the Foreign Exchange Market
CBN Half Year Economic Report for 2012
13
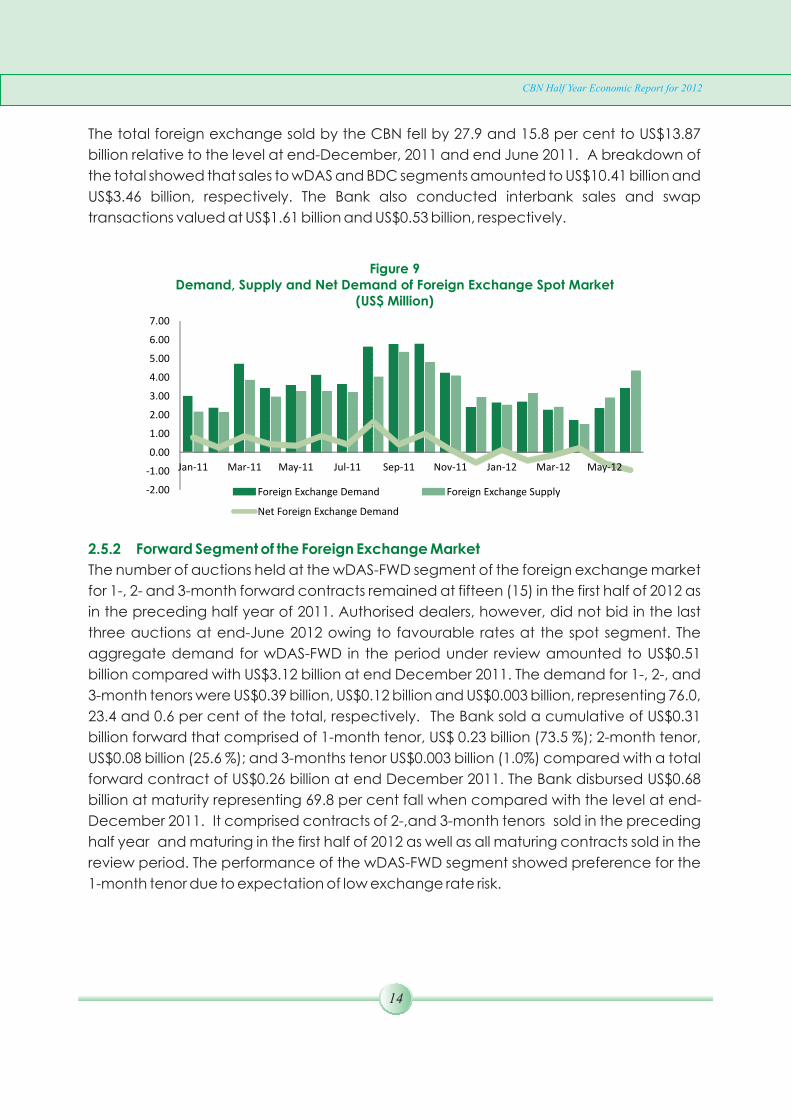
The total foreign exchange sold by the CBN fell by 27.9 and 15.8 per cent to US$13.87
billion relative to the level at end-December, 2011 and end June 2011. A breakdown of
the total showed that sales to wDAS and BDC segments amounted to US$10.41 billion and
US$3.46 billion, respectively. The Bank also conducted interbank sales and swap
transactions valued at US$1.61 billion and US$0.53 billion, respectively.
Figure 9Demand, Supply and Net Demand of Foreign Exchange Spot Market
(US$ Million)
-2.00
-1.00
0.00
1.00
2.00
3.00
4.00
5.00
6.00
7.00
Jan-11 Mar-11 May-11 Jul-11 Sep-11 Nov-11 Jan-12 Mar-12 May-12
Foreign Exchange Demand Foreign Exchange Supply
Net Foreign Exchange Demand
2.5.2 Forward Segment of the Foreign Exchange Market
The number of auctions held at the wDAS-FWD segment of the foreign exchange market
for 1-, 2- and 3-month forward contracts remained at fifteen (15) in the first half of 2012 as
in the preceding half year of 2011. Authorised dealers, however, did not bid in the last
three auctions at end-June 2012 owing to favourable rates at the spot segment. The
aggregate demand for wDAS-FWD in the period under review amounted to US$0.51
billion compared with US$3.12 billion at end December 2011. The demand for 1-, 2-, and
3-month tenors were US$0.39 billion, US$0.12 billion and US$0.003 billion, representing 76.0,
23.4 and 0.6 per cent of the total, respectively. The Bank sold a cumulative of US$0.31
billion forward that comprised of 1-month tenor, US$ 0.23 billion (73.5 %); 2-month tenor,
US$0.08 billion (25.6 %); and 3-months tenor US$0.003 billion (1.0%) compared with a total
forward contract of US$0.26 billion at end December 2011. The Bank disbursed US$0.68
billion at maturity representing 69.8 per cent fall when compared with the level at end-
December 2011. It comprised contracts of 2-,and 3-month tenors sold in the preceding
half year and maturing in the first half of 2012 as well as all maturing contracts sold in the
review period. The performance of the wDAS-FWD segment showed preference for the
1-month tenor due to expectation of low exchange rate risk.
CBN Half Year Economic Report for 2012
14
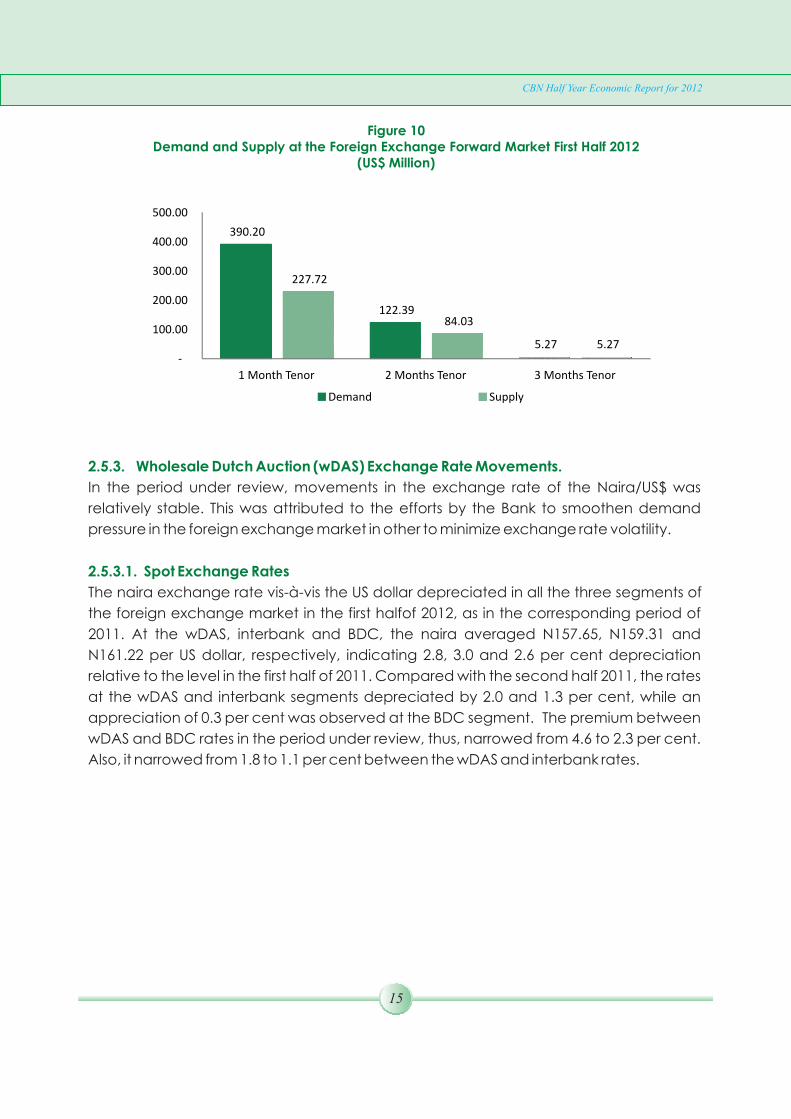
Figure 10Demand and Supply at the Foreign Exchange Forward Market First Half 2012
(US$ Million)
2.5.3. Wholesale Dutch Auction (wDAS) Exchange Rate Movements.
2.5.3.1. Spot Exchange Rates
In the period under review, movements in the exchange rate of the Naira/US$ was
relatively stable. This was attributed to the efforts by the Bank to smoothen demand
pressure in the foreign exchange market in other to minimize exchange rate volatility.
The naira exchange rate vis-à-vis the US dollar depreciated in all the three segments of
the foreign exchange market in the first halfof 2012, as in the corresponding period of
2011. At the wDAS, interbank and BDC, the naira averaged N157.65, N159.31 and
N161.22 per US dollar, respectively, indicating 2.8, 3.0 and 2.6 per cent depreciation
relative to the level in the first half of 2011. Compared with the second half 2011, the rates
at the wDAS and interbank segments depreciated by 2.0 and 1.3 per cent, while an
appreciation of 0.3 per cent was observed at the BDC segment. The premium between
wDAS and BDC rates in the period under review, thus, narrowed from 4.6 to 2.3 per cent.
Also, it narrowed from 1.8 to 1.1 per cent between the wDAS and interbank rates.
CBN Half Year Economic Report for 2012
15
390.20
122.39
5.27
227.72
84.03
5.27 -
100.00
200.00
300.00
400.00
500.00
1 Month Tenor 2 Months Tenor 3 Months Tenor
Demand Supply
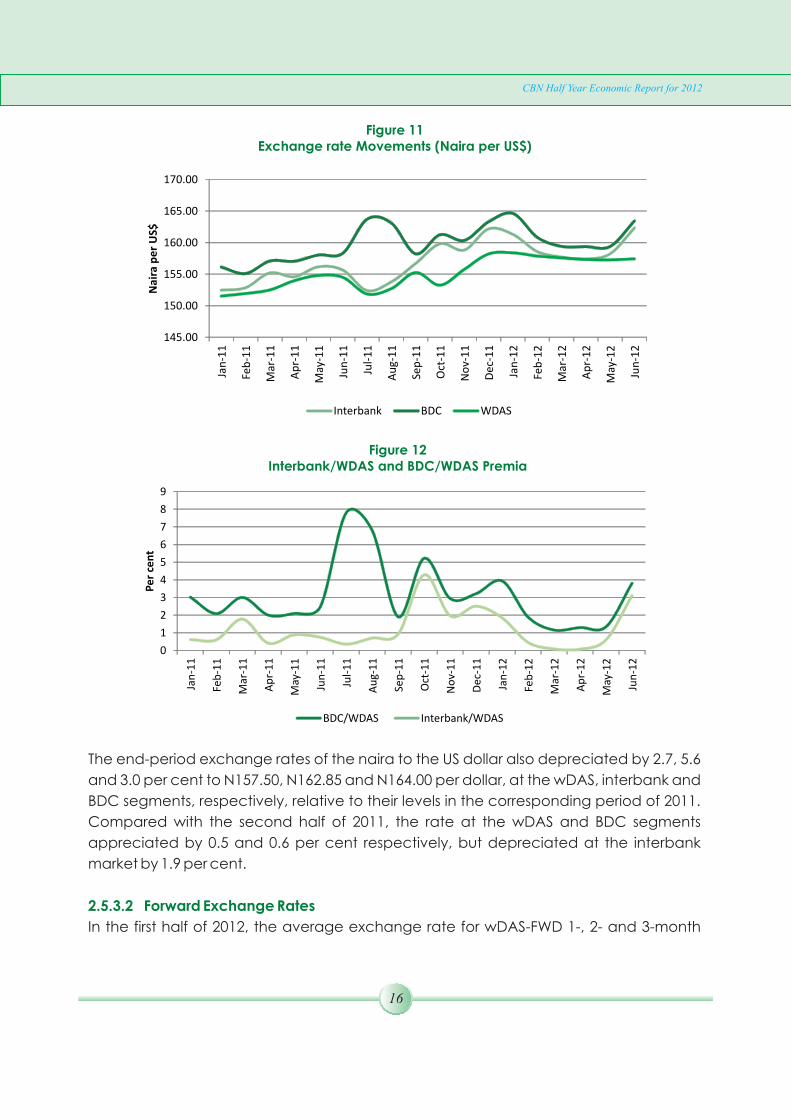
Figure 11Exchange rate Movements (Naira per US$)
145.00
150.00
155.00
160.00
165.00
170.00
Jan
-11
Feb
-11
Mar
-11
Ap
r-1
1
May
-11
Jun
-11
Jul-
11
Au
g-1
1
Sep
-11
Oct
-11
No
v-1
1
Dec
-11
Jan
-12
Feb
-12
Mar
-12
Ap
r-1
2
May
-12
Jun
-12
Nai
ra p
er
US$
Interbank BDC WDAS
Figure 12Interbank/WDAS and BDC/WDAS Premia
0
1
2
3
4
5
6
7
8
9
Jan
-11
Feb
-11
Mar
-11
Ap
r-1
1
May
-11
Jun
-11
Jul-
11
Au
g-1
1
Sep
-11
Oct
-11
No
v-1
1
Dec
-11
Jan
-12
Feb
-12
Mar
-12
Ap
r-1
2
May
-12
Jun
-12
Pe
r ce
nt
BDC/WDAS Interbank/WDAS
The end-period exchange rates of the naira to the US dollar also depreciated by 2.7, 5.6
and 3.0 per cent to N157.50, N162.85 and N164.00 per dollar, at the wDAS, interbank and
BDC segments, respectively, relative to their levels in the corresponding period of 2011.
Compared with the second half of 2011, the rate at the wDAS and BDC segments
appreciated by 0.5 and 0.6 per cent respectively, but depreciated at the interbank
market by 1.9 per cent.
In the first half of 2012, the average exchange rate for wDAS-FWD 1-, 2- and 3-month
2.5.3.2 Forward Exchange Rates
CBN Half Year Economic Report for 2012
16

tenors were N156.19/US$, N156.32/US$ and N156.88/US$, respectively. When compared
with the average spot exchange rate of N157.65/US$, the forward rate reflected
discounts of 1.31, 1.18 and 0.62 annualized percentage for the 1-, 2-, and 3-month wDAS-
FWD tenors, respectively.
Figure 13Forward Exchange Rates, First Half 2012
155.00
155.50
156.00
156.50
157.00
157.50
25
/01
/20
12
01
/02
/20
12
15
/02
/20
12
29
/02
/20
12
21
/03
/20
12
28
/03
/20
12
4/4
/20
12
11
/4/2
01
2
18
/04
/20
12
25
/04
/20
12
2/5
/20
12
9/5
/20
12
16
/05
/20
12
23
/05
/20
12
6/6
/20
12
1 MONTH TENOR 2 MONTH TENOR 3 MONTH TENOR
Average forward rates
were the same
for the 1-, 2-
and 3-month tenors in the first half of 2012
No bid
2.5.4. Foreign Exchange Flows
The foreign exchange flows through the economy in the first half of 2012 mirrored
movement in the international crude oil prices and inflows through autonomous sources
that comprised invisibles, mainly home remittances and capital importation. Provisional
data indicated that foreign exchange inflow through the economy increased by10.8 per
cent to US$55.66 billion over the level in the first half of 2011. A trend analysis revealed that
inflows rose steadily from US$8.52 billion in January, and peaked at US$9.97 billion in April
due to increased receipts from crude oil exports and invisibles. Thereafter, it declined to
US$7.95 billion in June 2012 as the external sector weakened. Of the total, inflow through
the CBN and autonomous sources were US$22.14 billion and US$33.52 billion,
representing 39.8 and 60.2 per cent, respectively. The inflow was largely driven by the
autonomous sources that comprised invisibles, non-oil exports and capital inflows. These
rose to US$31.40 billion, US$2.01 billion, US$0.11 billion and represented 56.4, 3.6, and 0.2
per cent of total, respectively.
Total foreign exchange outflow through the economy fell below the level in the first half of
2011 by 5.5 per cent to US$20.22 billion. The development was attributed to a reduction in
the wDAS utilization by 1.8 per cent to US$16.69 billion as an outcome of increased sales of
CBN Half Year Economic Report for 2012
17
foreign exchange by oil companies at the interbank segment. A trend analysis showed
that outflow declined from US$3.03 billion in January to US$1.9 billion in April and peaked
in June at US$4.85 billion. Overall, foreign exchange transactions resulted in a net inflow of
US$35.44 billioninto the economy compared with US$28.85 billion at end-June 2011.
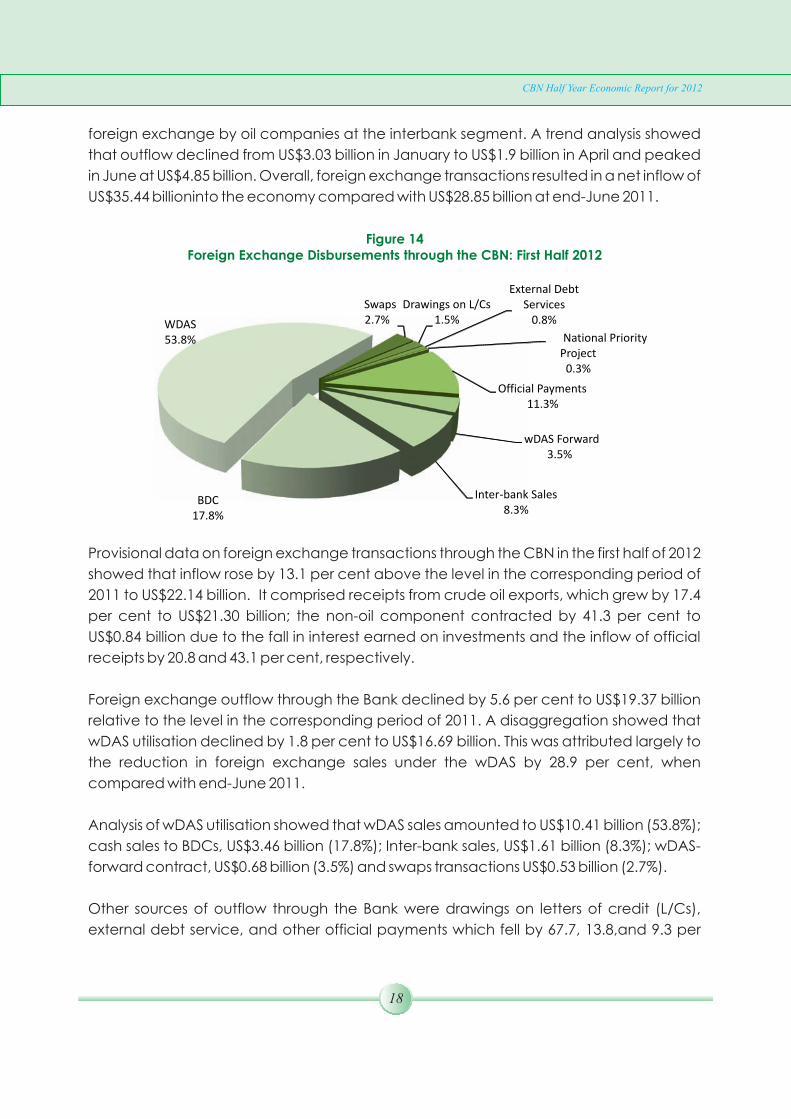
Figure 14Foreign Exchange Disbursements through the CBN: First Half 2012
Swaps 2.7%
Drawings on L/Cs 1.5%
External Debt Services
0.8% National Priority
Project 0.3%
Official Payments
11.3%
wDAS Forward 3.5%
Inter-bank Sales 8.3%
BDC 17.8%
WDAS 53.8%
Provisional data on foreign exchange transactions through the CBN in the first half of 2012
showed that inflow rose by 13.1 per cent above the level in the corresponding period of
2011 to US$22.14 billion. It comprised receipts from crude oil exports, which grew by 17.4
per cent to US$21.30 billion; the non-oil component contracted by 41.3 per cent to
US$0.84 billion due to the fall in interest earned on investments and the inflow of official
receipts by 20.8 and 43.1 per cent, respectively.
Foreign exchange outflow through the Bank declined by 5.6 per cent to US$19.37 billion
relative to the level in the corresponding period of 2011. A disaggregation showed that
wDAS utilisation declined by 1.8 per cent to US$16.69 billion. This was attributed largely to
the reduction in foreign exchange sales under the wDAS by 28.9 per cent, when
compared with end-June 2011.
Analysis of wDAS utilisation showed that wDAS sales amounted to US$10.41 billion (53.8%);
cash sales to BDCs, US$3.46 billion (17.8%); Inter-bank sales, US$1.61 billion (8.3%); wDAS-
forward contract, US$0.68 billion (3.5%) and swaps transactions US$0.53 billion (2.7%).
Other sources of outflow through the Bank were drawings on letters of credit (L/Cs),
external debt service, and other official payments which fell by 67.7, 13.8,and 9.3 per
CBN Half Year Economic Report for 2012
18

cent to US$0.29 billion, US$0.15 billion and US$2.19 billion, respectively relative to the levels
at end-June 2011. National priority projects, however, rose by 41.2 per cent to US$0.05
billion. The total foreign exchange transactions through the Bank resulted in a net inflow
of US$2.77 billion in the period under review, compared with a net outflow of US$0.96
billion recorded in the first half of 2011.
Figure 15
Foreign Exchange Transactions through the CBN
12.98
19.57
22.14
17.03
20.53
19.37
(4.05)
(0.96)
2.77
-10
-5
0
5
10
15
20
25
1st Half 2010 1st Half 2011 1st Half 2012
US$
bill
ion
Inflow Outflow Netflow
2.5.5. Sectoral Utilization of Foreign Exchange
Aggregate sectoral utilization of foreign exchange in the first-half of 2012 amounted to
US$22.14 billion, an increase of 22.6 per cent above the level recorded at end-June 2011.
A disaggregation showed that visible and invisible trade accounted for US$15.88 billion
and US$6.26 billion compared with US$13.79 billion and US$4.27 billion, respectively, at
end-June 2011. A disaggregation of visible imports showed that oil and industrial imports
grew by 10.3 and 18.5 per cent over the levels in the corresponding period of 2011 to
US$5.00 billion and US$4.02 billion, respectively. Similarly, food products, manufactured
products, transport and minerals sub-sectors grew by 22.6, 12.9, 28.3 and 13.2 per cent to
US$2.99 billion, US$2.47 billion, US$1.00 billion and US$0.25 billion, respectively, when
compared with the levels at end-June 2011. The amount utilized for agricultural sector
imports, however, fell by 39.2 per cent. Under the invisible category, financial services
increased by 55.7 per cent over the level at end-June 2011 to US$4.83 billion. Similarly,
foreign exchange utilisation under the transport, communication, education and other
services sub-category rose by 25.7, 113.4, 60.1 and 62.5 per cent to US$0.43 billion, US$0.18
billion, US$0.09 billion and US$0.08 billion, respectively. Business and construction and
engineering services, however, fell by 0.4 and 4.91 per cent below the levels in the first half
of 2011.
CBN Half Year Economic Report for 2012
19
Figure 16Sectoral Utilization of Foreign Exchange (Visibles) First Half 2012
Industrial
25.4%
Food Products18.9%
Manufactures
15.6%
Transport
6.3%
Agriculture
0.9%
Minerals
1.6%
Oil
31.3%
Figure 17Sectoral Utilization of Foreign Exchange (Invisibles) First Half 2012
Business9.0%
Communication2.9%
Financial
77.1%
Education 1.4%
Transport 6.8%
Others
2.8%
2.5.6. Foreign Exchange receipts by Top Hundred Exporters
Analysis of export receipts of the top 100 exporters in the country during the first half of
2012 showed that Olam Nigeria Limited maintained its lead with US$241.63 million earned
from the export of sesame seeds and cocoa beans to Europe, Asia and the United States.
Armajaro Nigeria Limited ranked second with US$62.02 million from cotton and cocoa
beans exports to Germany and the Netherlands, while the third largest exporter was
Mamuda Industries Nigeria Limited with the sum of US$60.44 million through the sale of
leather to Italy and Hong Kong. Unique Leather Finishing Limited and Imoniyame Holdings
Limited were placed fourth and fifth, with export proceeds valued at US$48.05 million and
CBN Half Year Economic Report for 2012
20
US$36.70 million realised from exports of finished leather to Italy and crumbed rubber to
the Netherlands, respectively.
The average 13-currency Nominal Effective Exchange Rate (NEER) index decreased by
1.8 per cent below the level in the first half of 2011 to 100.05. Similarly, the average Real
Effective Exchange Rate (REER) index (based on a 13-currency basket) decreased by
12.8 per cent below the level in the first half 2011 to 81.05 in first half of 2012.
2.5.7 Nominal Effective Exchange Rate (NEER) and Real Effective Exchange Rate (REER)
Indices
Figure 18Nominal Effective Exchange Rate (NEER) and Real Effective
Exchange Rate (REER) January – June 2012(November 2009=100)
60.00
70.00
80.00
90.00
100.00
110.00
Jan
-11
Feb
-11
Mar
-11
Ap
r-1
1
May
-11
Jun
-11
Jul-
11
Au
g-1
1
Sep
-11
Oct
-11
No
v-1
1
Dec
-11
Jan
-12
Feb
-12
Mar
-12
Ap
r-1
2
May
-12
Jun
-12
Nominal Effective Exchange Rate Real Effective Exchange Rate
2.6 Development Finance Operations
2.6.1 Agricultural Credit Guarantee Scheme Fund (ACGSF)
A total of 15,910 loans valued at N2.43 billion were guaranteed in the first half of 2012
compared with 11,410 valued at N2.19 billion in the corresponding period of 2011. At end-
June 2012, the cumulative number of loans guaranteed from inception of the Scheme in
1978 was 770,438 valued at N54.77 billion.
CBN Half Year Economic Report for 2012
21

Table 2Nominal and the Real Effective Exchange Rate indices
(November 2009=100)
2011Nominal Effective
Exchange Rate
Real Effective
Exchange Rate
Jan 99.72 93.31
Feb 99.90 93.73
Mar 101.55 91.20
Apr 104.28 94.65
May 102.99 93.07
Jun 102.54 91.60
Jul 101.49 90.22
Aug 101.62 88.82
Sep 100.41 86.46
Oct 99.24 85.08
Nov 100.73 86.26
Dec 99.73 84.56
2012Nominal Effective
Exchange Rate
Real Effective
Exchange Rate
Jan 101.69 83.27
Feb 101.41 83.00
Mar 100.29 81.03
Apr 99.66 80.49
May 97.94 78.49
Jun 99.29 80.00
Figure 19
Sectoral Distribution of ACGSF Loans (By Purpose) First Half 2012
Food Crop67.0%
Mixed Crops
0.8%
Livestock 22.6%
Fisheries 6.1%
Cash Crops 2.3%
Others 1.2%
CBN Half Year Economic Report for 2012
22

2.6.2 Interest Drawback Programme (IDP)
2.6.3 The Trust Fund Model (TFM)
2.6.4 Entrepreneurship Development Centres (EDCs)
2.6.5 Commercial Agricultural Credit Scheme (CACS)
In the first half of 2012, 27,303 claims valued at N248.56 million were settled. This brought
the number and value of claims settled since inception of the programme to 160,833 and
N1.79 billion, respectively.
No new Memorandum of Understanding (MoU) was signed by the Bank under the TFM
during the period under review. Thus, the number of Stakeholders that had signed MoUs
remained at 56 consisting of state governments, multinational agencies, LGAs, NGOs
and individuals with the sum of N5, 516.10 billion placed under the TFM from inception in
2002.
Three additional EDCs were approved to be established in the North-Central, North-East
and South-South geopolitical zones of the country. Thus far, a total of 29,323 participants
made up of 4,113 graduates and 25,210 entrepreneurs had been trained.
The sum of N44.99 billion was released to 19 participating banks for on-lending to 74
projects in the first half of 2012. Cumulatively, N197.05 billion had been disbursed under
CACs for on-lending to 252 projects comprising 222 private promoters and 30 state
governments (including the FCT) since the inception of the scheme. A breakdown of
disbursements by value chain indicated that processing received 52.0 per cent, followed
by production with 34.0 per cent. Marketing, storage and input supply got 9.0, 4.0 and 1.0
per cent, respectively.
Figure 20
Analysis of CACS Financed Projects by Value Chain, First Half 2012
Production 34%
Processing 52%
Marketing 9%
Storage 4%
Input Supply 1%
CBN Half Year Economic Report for 2012
23

2.6.6 N235 Billion Intervention Fund for Refinancing and Restructuring of Banks' Loans to
the Manufacturing/SME Sector
The entire fund of N235.00 billion had been disbursed to 522 projects as at end-June, 2012.
In the period under review, N14.57 billion was recovered out of the N235 billion disbursed
under the scheme. A disaggregation of disbursement under the RRF indicated that the
chemical/plastics, engineering/construction and food/beverages sub-sectors
accounted for 30.0, 18.1 and 17.6 per cent, respectively. Paper/allied products and
agro-allied sub-sectors received 8.7 and 8.5 per cent, respectively and others
accounted for the balance.
Agro Allied
8.5%
Solid Minerals
3.8%
Eng./Const.18.1%
Chem./Plastics
30.0%
Food/Bev.
17.6%
Pharmaceuticals
3.2%
Hotel/Tourism
1.3%
Transport
0.5%
Textile/Leather
2.1%
Oil & Gas
3.3%
Paper/Allied Prod. 8.7%
ICT
3.0%
Figure 21
Sectoral Distribution of Facilities through RRF Participating Banks, First Half 2012
2.6.7 N200 Billion SME Credit Guarantee Scheme (SMECGS)
2.6.8 N300 Billion Power and Airline Intervention Fund (PAIF) Initiative
2.6.9 Nigeria Incentive-Based Risk Sharing System for Agricultural Lending (NIRSAL)
One (1) application valued at N100.0 million was approved for guarantee under the
SMECGS during the period under review. This brought the number of projects
guaranteed under the Scheme from inceptionin April 2010 to twenty (20) valued at N1.30
billion.
The sum of N20.72 billion was released to the Bank of Industry (BOI) for disbursement to ten
(10) power and airline projects during the period under review. Thus, since inception of
the Initiative, the sum of N178.63 billion had been released. However, N171.12 billion has
been disbursed for 30 projects under the PAIF consisting of 16 power plants and 14 airline
projects valued at N80.67 billion and N90.45 billion, respectively.
The implementation of the NIRSAL programme received a boost during the period with
CBN Half Year Economic Report for 2012
24

the engagement of 26 state governments to participate under the initiative. Also, the
monopoly of the Nigerian Agricultural Insurance Corporation (NAIC) ended with the
liberalization of agricultural insurance to allow for the participation of other insurance
companies. Furthermore, a guideline for the purchase of credit guarantee by counter
parties was released during the period.
Provisional data indicates that the total assets of the CBN at end-June 2012 grew by 4.7
per cent relative to end-December 2011 and 78.0 per cent relative to the level at the end
of the corresponding period of 2011. The growth in assets over end-December 2011 was
due to the substantial increase (112.5 per cent) in Federal government securities as well
as the respective growth of 13. 4, 8.6 and 3.2 per cent in fixed assets, rediscount and
advance, and external reserves. The growth over end-June 2011 was due to the growth
of 162.6, 44.4, 32.8 and 22.9 per cent in holdings of Federal government securities,
rediscounts and advances, fixed assets and external reserves, respectively. The
corresponding increase in liabilities relative to end-December 2011 was due wholly to the
44.6 per cent growth in Federal government deposits with the Bank.
2.7 CBN Assets and Liabilities
CBN Half Year Economic Report for 2012
25
ECONOMIC REPORT
3.0 GLOBAL ECONOMIC DEVELOPMENTS
Global economic growth projection by the IMF indicated that the global economic
recovery remained weakin 2012. Economic recovery was envisaged to be relatively
strong for most emerging/developing economies, but sluggish for advanced
economies. Consequently, growth was projected to moderate to 3.5 per cent in 2012
from 4.0 per cent in 2011.
The advanced economies were estimated to grow at an average of 1.4 per cent in 2012.
This represented a modest decline from the 1.6 per cent recorded in 2011. By 2013,
economic activity was projected to rebound to 2.0 per cent. Growth in the United States
was estimated to strengthen modestly to 2.0 per cent in 2012. Recovering from the
earthquake-related losses in 2011, Japan's economy was projected at 2.4 per cent in
2012. The euro area economies were estimated to contract by 0.3 per cent in 2012, in
contrast to a growth of 1.5 per cent in 2011. This was as a result of the sovereign debt crisis,
general loss of confidence, the effects of bank deleveraging and the impact of fiscal
consolidation in response to market pressures. The euro area crisis was expected to
spillover to the rest of Europe, with the possibility of leading to financial market volatility.
Labour market conditions, on the other hand, were likely to remain challenging in most
advanced economies.
In emerging market economies, growth was projected at 5.6 per cent in 2012 down from
6.2 per cent achieved in 2011. The projected growth is expected to be sustained by good
macroeconomic management and external demand. In developing Asia, the
projected growth of 7.1 per cent would be propelled by demand from Japan. However,
growth in China and India was projected to decelerate from 9.2 and 7.1 per cent in 2011
to 8.0 and 6.1 per cent, respectively, in 2012. In Latin America and the Carribean,
economic activities would be driven by favourable commodity prices and financial
market conditions, especially in the second half of the year. Nonetheless, growth was
projected to decelerate to 3.7 per cent in 2012 from 4.5 per cent in 2011.
In the Middle East and North Africa (MENA) region, growth was projected to be 5.5 per
cent in 2012, showing an improvement over the 3.5 per cent in 2011. The growth
projection for the MENA region reflected the resumption of economic activities in Libya
and Egypt that were engulfed by political crisis in 2011. The economies of the oil exporting
countries were not expected to improve considerably due to domestic uncertainties
and external demand conditions. The sub-Saharan African (SSA) economies were
CBN Half Year Economic Report for 2012
26
projected to grow by 5.4 per cent in 2012 up from 5.2 per cent recorded in 2011 largely as
a result of growing export of crude oil and other commodities.
Crude oil prices (World Bank average) declined by 8.4 per cent in May due mainly to
poor US non-farm payrolls data, a strong dollar, weak Chinese manufacturing figures and
Eurozone debt concerns. Oil prices were projected to average $98 per barrel in 2012
down from the peak of about $115 per barrel in 2010 and early 2011. This projection was
based on optimism that optimal production of oil in Libya would be restored and
sustained global economic recovery.
The estimated world crude oil demand rose slightly by 0.63 per cent from 87.10 mbd
recorded in the first half of 2011 to 87.65 mbd in the first half of 2012. Of this volume,
demand from the Organization for Economic Co-operation and Development (OECD)
countries was estimated at 45.08 mbd, while that of the non-OECD was 42.57 mbd. The
severe winter in Europe and some parts of North America during the first quarter of the
year accounted for the increase in demand during the review period.
The price of gold fell by 3.8 per cent from $1,668.15/ounce in March to $1,604.20/ounce in
June following the bold actions taken by the European leaders to curb the persisting debt
crisis in the region. Analysis of the price of gold for the first half of 2012 indicated that the
price rose by 2.5 per cent from $1,564.91/ounce in December 2011 to $1,604.20/ounce in
June 2012. This reflected investors' aversion to risky assets due largely to the slow
economic growth and sovereign debt crisis in the euro area.
Global inflation was projected to ease as commodity prices stabilize and demand
softens in 2012. In the advanced economies, inflation was estimated to decelerate from
2.7 per cent in 2011 to 1.9 per cent in 2012, owing to economic slackness and subdued
inflation expectations as the effects of higher commodity prices of the preceding year
waned. Commodity price dynamics held up headline inflation in some of the major
advanced economies. In the United States and the euro area, stagnating labour cost led
to a downward revision of headline inflation to 2.0 and 1.5 per cent, respectively. In the
emerging and developing economies, inflationary pressures were also expected to be
on the decline as food price inflation dropped. Consequently, inflation for this region was
projected to decrease to 6.2 per cent in 2012 from 7.1 per cent in 2011. Inflationary
pressures were, however, expected to remain persistent in some of the countries in the
region.
3.1 Global Commodity Prices
3.2 Global Inflation
CBN Half Year Economic Report for 2012
27

3.3 International Financial Markets
Capital market indices declined across the global financial markets in the first half of
2012. This was attributed to the economic downturn in the euro area, the U.S. and
emerging markets. The euro area was at the centre of the international financial market
distress, caused by heightened political and financial uncertainty in Greece, banking
sector issues in Spain and misgivings about governments' ability to deliver on fiscal
adjustments and reforms as well as the extent of preparedness of some EU countries to
provide bail-out funds. In the U.S., fiscal challenges and weak economic data, especially
high rate of unemployment, declining consumer confidence and reduction in the U.S.
growth projections by the Federal Reserve Bank, weakened investors' appetite for global
equities. Poor growth in emerging market economies in Asia and South America notably
India, China and Brazil arising from increases in investor risk aversion and perceived
growth uncertainty, led to equity price decreases and capital outflows.
Yields on safe haven bonds for Germany, Japan, Switzerland and the U.S. declined to an
all-time low in the review period. While capital flowed into some sovereign bonds within
the euro area, the region's debt market remained fragile. Rising investor risk aversion
based on perceived growth uncertainty across the globe contributed to the decline in
foreign exchange flows to many emerging and developing economies.
On a year-to-date and year-on-year basis, currencies of selected emerging markets,
euro area and Africa depreciated against the U.S. Dollar. For example, the Brazilian Real,
Canadian Dollar, Indian Rupee, Euro and Ghanaian Cedi depreciated, on a year-on-
year basis, by 20.40, 3.38, 19.12, 11.38 and 21.65 per cent, respectively.
Analysis of the nominal exchange rate of the domestic currency relative to other major
international currencies showed that the naira depreciated against the pound sterling
and Japanese yen by 0.4 and 5.6 per cent, but appreciated relative to the euro by 5.2
per cent. At the regional level, the naira strengthened against the CFA Francs by 3.2 per
cent, but weakened against the West African Unit of Account (WAUA) by 0.1 per cent
when compared with the level in the corresponding period of 2011. In comparison with
the second half of 2012, the naira appreciated against the euro and the yen by 5.4 and
0.7 per cent, but depreciated against the pound by 0.1 per cent. The domestic currency
appreciated against the CFA Franc and the WAUA by 4.6 and 0.7 per cent, respectively.
CBN Half Year Economic Report for 2012
28
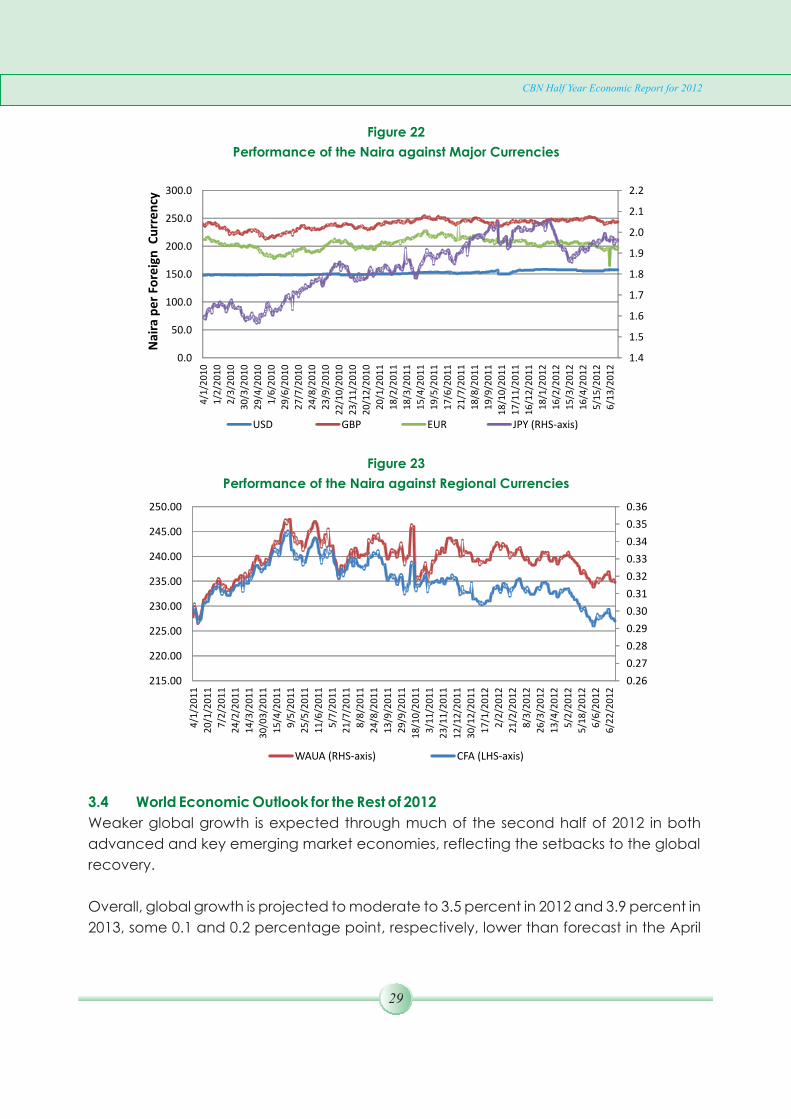
Figure 22
Performance of the Naira against Major Currencies
1.4
1.5
1.6
1.7
1.8
1.9
2.0
2.1
2.2
0.0
50.0
100.0
150.0
200.0
250.0
300.04
/1/2
01
0
1/2
/20
10
2/3
/20
10
30
/3/2
01
0
29
/4/2
01
0
1/6
/20
10
29
/6/2
01
0
27
/7/2
01
0
24
/8/2
01
0
23
/9/2
01
0
22
/10
/20
10
23
/11
/20
10
20
/12
/20
10
20
/1/2
01
1
1
8/2
/20
11
18
/3/2
01
1
15
/4/2
01
1
19
/5/2
01
1
17
/6/2
01
1
21
/7/2
01
1
18
/8/2
01
1
19
/9/2
01
1
18
/10
/20
11
17
/11
/20
11
16
/12
/20
11
18
/1/2
01
2
16
/2/2
01
2
15
/3/2
01
2
16
/4/2
01
2
5/1
5/2
01
2
6/1
3/2
01
2
Nai
ra p
er
Fore
ign
Cu
rre
ncy
USD GBP EUR JPY (RHS-axis)
Figure 23
Performance of the Naira against Regional Currencies
0.26
0.27
0.28
0.29
0.30
0.31
0.32
0.33
0.34
0.35
0.36
215.00
220.00
225.00
230.00
235.00
240.00
245.00
250.00
4/1
/20
11
20
/1/2
01
1
7/2
/20
11
2
4/2
/20
11
14
/3/2
01
1
30
/03
/20
11
15
/4/2
01
1
9/5
/20
11
25
/5/2
01
1
11
/6/2
01
1
5/7
/20
11
21
/7/2
01
1
8/8
/20
11
24
/8/2
01
1
13
/9/2
01
1
29
/9/2
01
1
18
/10
/20
11
3/1
1/2
01
1
23
/11
/20
11
12
/12
/20
11
30
/12
/20
11
17
/1/2
01
2
2/2
/20
12
21
/2/2
01
2
8/3
/20
12
26
/3/2
01
2
13
/4/2
01
2
5/2
/20
12
5/1
8/2
01
2
6/6
/20
12
6/2
2/2
01
2
WAUA (RHS-axis) CFA (LHS-axis)
3.4 World Economic Outlook for the Rest of 2012
Weaker global growth is expected through much of the second half of 2012 in both
advanced and key emerging market economies, reflecting the setbacks to the global
recovery.
Overall, global growth is projected to moderate to 3.5 percent in 2012 and 3.9 percent in
2013, some 0.1 and 0.2 percentage point, respectively, lower than forecast in the April
CBN Half Year Economic Report for 2012
29

2012 WEO. Growth in advanced economies is projected to expand by 1.4 percent in
2012.
The downward revision mostly reflects weaker activity in the euro area, especially in the
periphery economies, where the dampening effects from uncertainty and tighter
financial conditions will be strongest. Owing mainly to negative spillovers from
uncertainty, growth in most other advanced economies will also be slightly weaker,
although lower oil prices will likely dampen these adverse effects. Growth in emerging
and developing economies will moderate to 5.6 percent in 2012 before picking up to 5.9
percent in 2013. Growth is projected to remain relatively weaker than in 2011 in regions
connected more closely with the euro area (Central and Eastern Europe in particular). In
contrast with the broad trends, growth in the Middle East and North Africa will be stronger
in 2012–13 relative to last year, as key oil exporters continue to boost oil production and
domestic demand while activity in Libya is rebounding rapidly after the unrest in 2011.
Similarly, growth in sub-Saharan Africa is expected to remain robust in 2012–13, helped by
the region's relative insulation from external financial shocks. Global consumer price
inflation is projected to ease as demand softens and commodity prices recede. Overall,
headline inflation is expected to slip from 4½ percent in the last quarter of 2011 to 3–3½
percent in 2012–13.
At the domestic scene, inflation would remain a major macroeconomic problem for
Nigeria. Monetary aggregate likely to increase, but might continue to lag behind their
indicative benchmarks, while money market rates could remain high. Furthermore, the
continuous pressure on the foreign exchange market would pose major policy
challenges for the CBN.
CBN Half Year Economic Report for 2012
30
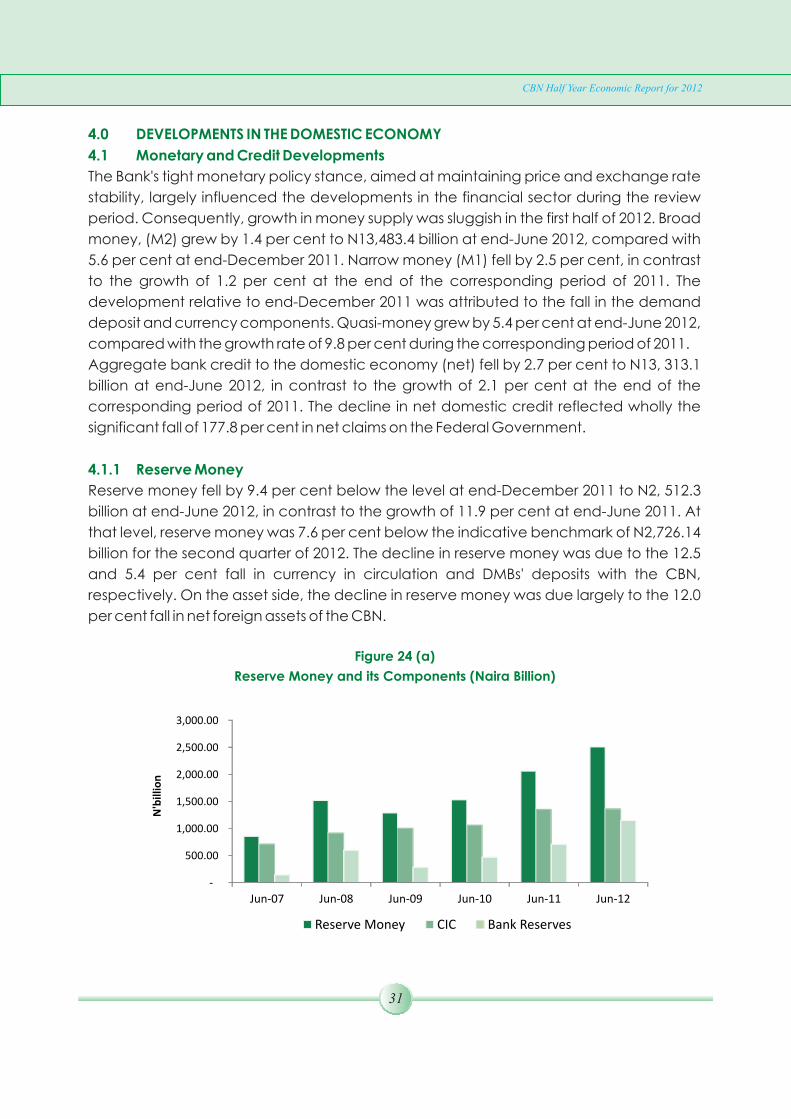
4.0 DEVELOPMENTS IN THE DOMESTIC ECONOMY
4.1 Monetary and Credit Developments
4.1.1 Reserve Money
The Bank's tight monetary policy stance, aimed at maintaining price and exchange rate
stability, largely influenced the developments in the financial sector during the review
period. Consequently, growth in money supply was sluggish in the first half of 2012. Broad
money, (M2) grew by 1.4 per cent to N13,483.4 billion at end-June 2012, compared with
5.6 per cent at end-December 2011. Narrow money (M1) fell by 2.5 per cent, in contrast
to the growth of 1.2 per cent at the end of the corresponding period of 2011. The
development relative to end-December 2011 was attributed to the fall in the demand
deposit and currency components. Quasi-money grew by 5.4 per cent at end-June 2012,
compared with the growth rate of 9.8 per cent during the corresponding period of 2011.
Aggregate bank credit to the domestic economy (net) fell by 2.7 per cent to N13, 313.1
billion at end-June 2012, in contrast to the growth of 2.1 per cent at the end of the
corresponding period of 2011. The decline in net domestic credit reflected wholly the
significant fall of 177.8 per cent in net claims on the Federal Government.
Reserve money fell by 9.4 per cent below the level at end-December 2011 to N2, 512.3
billion at end-June 2012, in contrast to the growth of 11.9 per cent at end-June 2011. At
that level, reserve money was 7.6 per cent below the indicative benchmark of N2,726.14
billion for the second quarter of 2012. The decline in reserve money was due to the 12.5
and 5.4 per cent fall in currency in circulation and DMBs' deposits with the CBN,
respectively. On the asset side, the decline in reserve money was due largely to the 12.0
per cent fall in net foreign assets of the CBN.
Figure 24 (a)
Reserve Money and its Components (Naira Billion)
-
500.00
1,000.00
1,500.00
2,000.00
2,500.00
3,000.00
Jun-07 Jun-08 Jun-09 Jun-10 Jun-11 Jun-12
N'b
illio
n
Reserve Money CIC Bank Reserves
CBN Half Year Economic Report for 2012
31
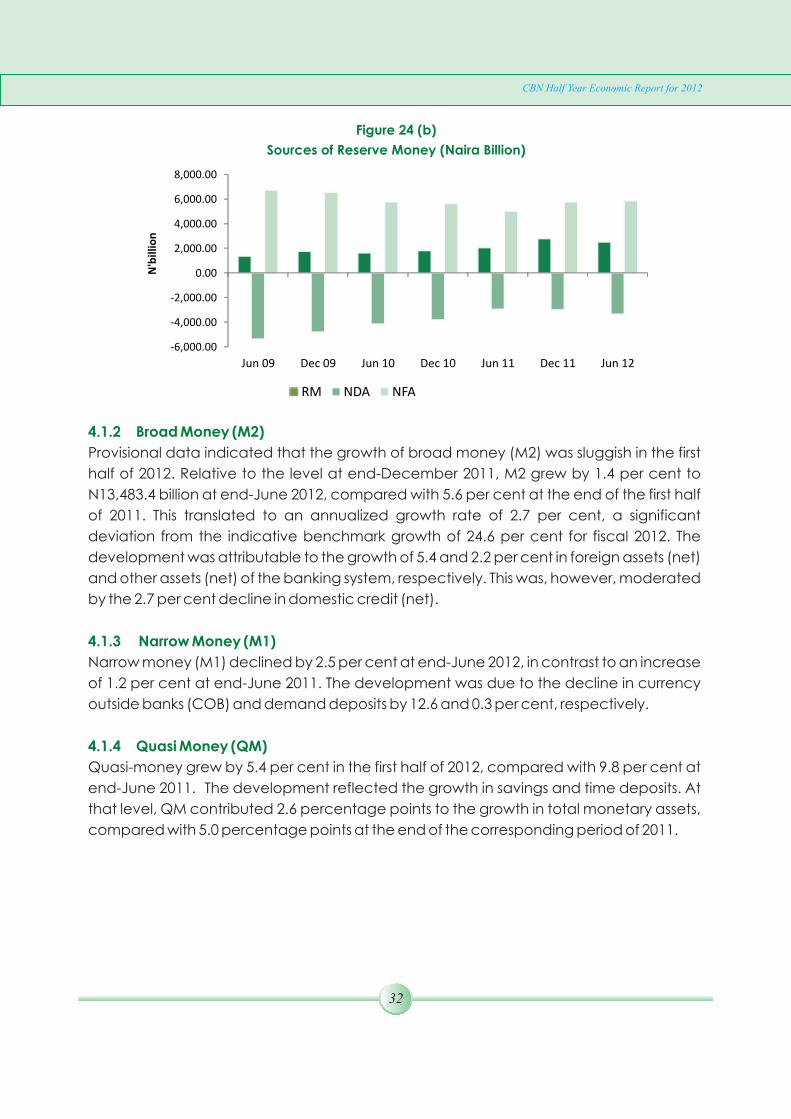
Figure 24 (b)
Sources of Reserve Money (Naira Billion)
-6,000.00
-4,000.00
-2,000.00
0.00
2,000.00
4,000.00
6,000.00
8,000.00
Jun 09 Dec 09 Jun 10 Dec 10 Jun 11 Dec 11 Jun 12
N'b
illio
n
RM NDA NFA
4.1.2 Broad Money (M2)
4.1.3 Narrow Money (M1)
4.1.4 Quasi Money (QM)
Provisional data indicated that the growth of broad money (M2) was sluggish in the first
half of 2012. Relative to the level at end-December 2011, M2 grew by 1.4 per cent to
N13,483.4 billion at end-June 2012, compared with 5.6 per cent at the end of the first half
of 2011. This translated to an annualized growth rate of 2.7 per cent, a significant
deviation from the indicative benchmark growth of 24.6 per cent for fiscal 2012. The
development was attributable to the growth of 5.4 and 2.2 per cent in foreign assets (net)
and other assets (net) of the banking system, respectively. This was, however, moderated
by the 2.7 per cent decline in domestic credit (net).
Narrow money (M1) declined by 2.5 per cent at end-June 2012, in contrast to an increase
of 1.2 per cent at end-June 2011. The development was due to the decline in currency
outside banks (COB) and demand deposits by 12.6 and 0.3 per cent, respectively.
Quasi-money grew by 5.4 per cent in the first half of 2012, compared with 9.8 per cent at
end-June 2011. The development reflected the growth in savings and time deposits. At
that level, QM contributed 2.6 percentage points to the growth in total monetary assets,
compared with 5.0 percentage points at the end of the corresponding period of 2011.
CBN Half Year Economic Report for 2012
32

Figure 25
Growth in Money Supply (Per cent)
(7.4)
2.4
(2.0)
11.1
1.2
(2.5)
(0.9)
17.1
0.6
6.9
5.6
1.4
(10.0)
(5.0)
-
5.0
10.0
15.0
20.0
Jun. 09 Dec. 09 Jun. 10 Dec. 10 Jun. 11 Jun. 12
N' b
illio
n
M1 (Money Supply) M2 (Broad Money)
CBN Half Year Economic Report for 2012
33
4.1.5 Currency-in-Circulation and Deposits at the CBN
4.1.6 Drivers of the Major Monetary Aggregate
4.1.6.1 Net Foreign Assets (NFA)
4.1.6.2 Net Domestic Assets (NDA)
Relative to its level at end-December 2011, currency in circulation (CIC) fell by 12.9 per
cent to N1,363.73 billion at the end of the first half of 2012, compared with 1.8 per cent at
end-June 2011. Similarly, COB fell, by 12.6 per cent, at the end of the review period,
compared with the decline of 6.1 per cent at the end of the corresponding period of
2011. As a ratio of M2, COB fell slightly to 8.1 per cent at the end of the review period from
8.2 per cent at the end of the first half of 2011. At N6,469.6 billion, deposits at the CBN
increased by 7.5 and 36.5 per cent over the levels at end-December 2011 and the
corresponding period of 2011, respectively. The development relative to end-December
2011 was attributed mainly to the 12.4 per cent increase in Federal Government deposits.
At N7, 525.2 billion, foreign assets (net) of the banking system grew by 5.4 per cent at end-
June 2012, in contrast to the 0.8 per cent decline at the end of the corresponding half of
2011. At that level, the NFA constituted 55.8 per cent of M2, compared with 53.0 per cent
at end-June 2011. The NFA's contribution to the growth in M2 was 2.9 percentage points
at end-June 2012, in contrast to a negative contribution of 0.5 percentage point at the
end of the corresponding period of 2011.
Net domestic assets fell by 3.4 per cent to N5,958.2 billion at end-June 2012, as against the
13.9 per cent growth at the end of the corresponding period of 2011. The development
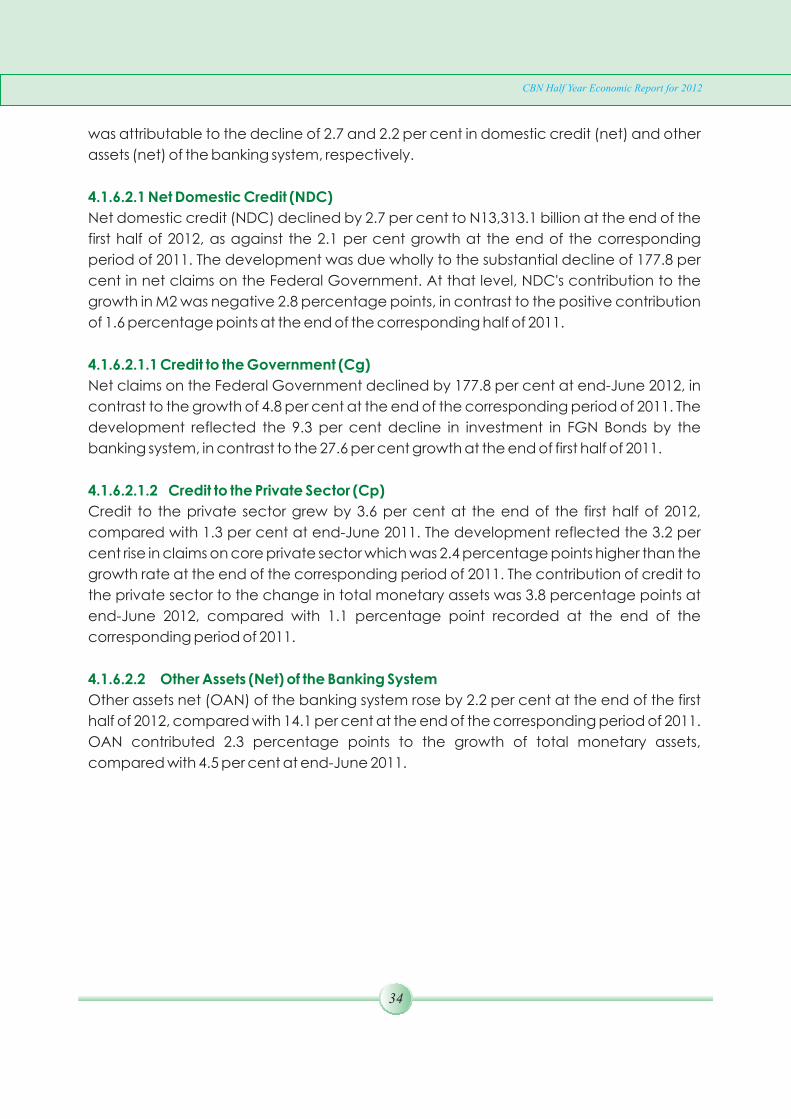
was attributable to the decline of 2.7 and 2.2 per cent in domestic credit (net) and other
assets (net) of the banking system, respectively.
Net domestic credit (NDC) declined by 2.7 per cent to N13,313.1 billion at the end of the
first half of 2012, as against the 2.1 per cent growth at the end of the corresponding
period of 2011. The development was due wholly to the substantial decline of 177.8 per
cent in net claims on the Federal Government. At that level, NDC's contribution to the
growth in M2 was negative 2.8 percentage points, in contrast to the positive contribution
of 1.6 percentage points at the end of the corresponding half of 2011.
Net claims on the Federal Government declined by 177.8 per cent at end-June 2012, in
contrast to the growth of 4.8 per cent at the end of the corresponding period of 2011. The
development reflected the 9.3 per cent decline in investment in FGN Bonds by the
banking system, in contrast to the 27.6 per cent growth at the end of first half of 2011.
Credit to the private sector grew by 3.6 per cent at the end of the first half of 2012,
compared with 1.3 per cent at end-June 2011. The development reflected the 3.2 per
cent rise in claims on core private sector which was 2.4 percentage points higher than the
growth rate at the end of the corresponding period of 2011. The contribution of credit to
the private sector to the change in total monetary assets was 3.8 percentage points at
end-June 2012, compared with 1.1 percentage point recorded at the end of the
corresponding period of 2011.
Other assets net (OAN) of the banking system rose by 2.2 per cent at the end of the first
half of 2012, compared with 14.1 per cent at the end of the corresponding period of 2011.
OAN contributed 2.3 percentage points to the growth of total monetary assets,
compared with 4.5 per cent at end-June 2011.
4.1.6.2.1 Net Domestic Credit (NDC)
4.1.6.2.1.1 Credit to the Government (Cg)
4.1.6.2.1.2 Credit to the Private Sector (Cp)
4.1.6.2.2 Other Assets (Net) of the Banking System
CBN Half Year Economic Report for 2012
34

Figure 26
Distribution of Net Domestic Credit
(Naira Billion)
N
Bil
lio
n
-4000
-2000
0
2000
4000
6000
8000
10000
12000
14000
16000
Jun-09 Jun-10 Jun 11 June 12
Claims on Federal Government (Net) Claims on Private Sector
4.1.7 Sectoral Distribution of Credit
Relative to the level at end-December 2011, DMBs' credit to the core private sector grew
by 3.2 per cent at end-June 2012. Of the amount outstanding, credit to the priority sectors
accounted for 37.1 per cent of which agriculture, solid minerals, export and
manufactures accounted for 3.7, 18.9, 0.7 and 13.8 per cent, respectively. At that level,
credit to the core private sector was 2.4 percentage points higher than the level at end-
June 2011. The less-preferred sectors accounted for 39.8 per cent, while the unclassified
category accounted for the balance of 23.1 per cent.
CBN Half Year Economic Report for 2012
35
Table 3
Credit to the Core Private Sector: (Percentage Share)
Share in Outstanding (per cent)
Jun 11
Dec 11
Jun 12
1. Priority Sectors
34.3
36.1
37.1
Agriculture
2.1
3.5
3.7
Solid Minerals
18.1
17.7
18.9
Exports
1.5
0.5
0.7
Manufacturing
12.6
14.4
13.8
Small Scale Enterprises
--
--
--
2. Less Preferred Sectors
47.8
45.8
39.8
Real Estate
7.9
6.2
6.8
Public Utilities
0.8
0.9
0.3
Transport and Communications
12.5
17.3
11.5
Finance & Insurance
7.4
4.2
3.9
Government
5.9
6.8
7.4
Import & Dom. Trade (General Comm.)
13.3
10.3
9.8
3. Unclassified 17.9 18.1 23.1
Total (1+2+3) 100 100 100
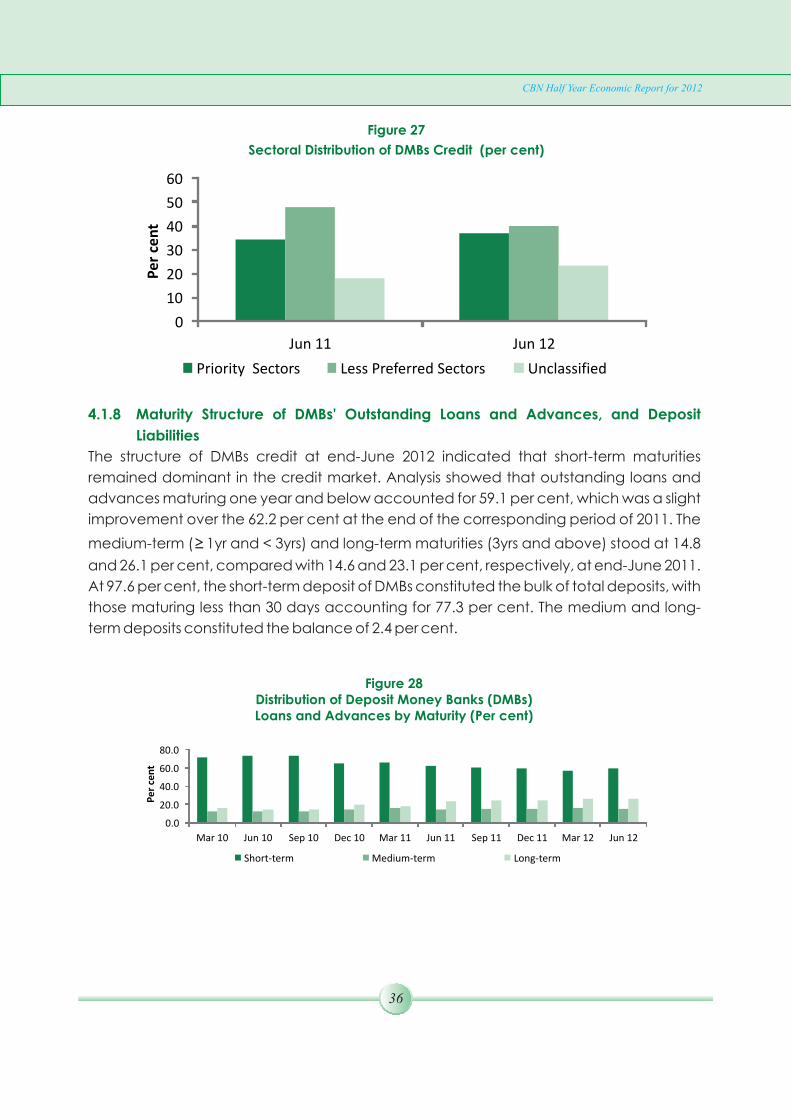
Figure 27
Sectoral Distribution of DMBs Credit (per cent)
0
10
20
30
40
50
60
Jun 11 Jun 12
Pe
r ce
nt
Priority Sectors Less Preferred Sectors Unclassified
4.1.8 Maturity Structure of DMBs' Outstanding Loans and Advances, and Deposit
Liabilities
The structure of DMBs credit at end-June 2012 indicated that short-term maturities
remained dominant in the credit market. Analysis showed that outstanding loans and
advances maturing one year and below accounted for 59.1 per cent, which was a slight
improvement over the 62.2 per cent at the end of the corresponding period of 2011. The
medium-term (≥1yr and < 3yrs) and long-term maturities (3yrs and above) stood at 14.8
and 26.1 per cent, compared with 14.6 and 23.1 per cent, respectively, at end-June 2011.
At 97.6 per cent, the short-term deposit of DMBs constituted the bulk of total deposits, with
those maturing less than 30 days accounting for 77.3 per cent. The medium and long-
term deposits constituted the balance of 2.4 per cent.
CBN Half Year Economic Report for 2012
36
Figure 28Distribution of Deposit Money Banks (DMBs) Loans and Advances by Maturity (Per cent)
0.0
20.0
40.0
60.0
80.0
Mar 10 Jun 10 Sep 10 Dec 10 Mar 11 Jun 11 Sep 11 Dec 11 Mar 12 Jun 12
Pe
r ce
nt
Short-term Medium-term Long-term

Figure 29Distribution of DMBs Deposit Structure
0.00.51.01.52.02.53.03.54.0
95.0
96.0
97.0
98.0
99.0
Mar
10
Pe
r ce
nt
Short-term(lhs) Medium-term(rhs) Long-term(rhs)
Pe
r ce
nt
Jun
10
Sep
10
Dec
10
Mar
11
Jun
11
Sep
11
Dec
11
Mar
12
Jun
12
Figure 30Components of Private Sector Credit, End-June 2012
(per cent)
Credit to State & Local
Government 4%
Credit to Core Private Sector
96%
CBN Half Year Economic Report for 2012
37
4.1.9 Market Structure of the Banking Industry
The oligopolistic nature of the banking industry persisted in the first half of 2012. On the
basis of market share of total assets and deposits, the average concentration ratio (CR)
of a quarter of the DMBs stood at 52.2 and 52.8 per cent, respectively, compared with
54.6 and 53.1 per cent at the end of the first half of 2011. The market share of the largest
bank with respect to assets and deposits stood at 14.0 and 14.9 per cent, respectively, at
end-June 2012, compared with 13.1 and 12.8 per cent at the end of the corresponding
period of 2011. The average Herfindahl-Hirschman Indices (HHI) of 770.4 and 741.5 (on a
scale of 1000) for total deposits and assets also confirmed the low competition in the
industry.

Table 4 Maturity Structure of DMBs Assets and Liabilities
Assets (Loans and Advances) Jun 10 Dec10 Jun 11 Dec 11 Jun 12
Tenor
0-30 days
55.4
46.1
40.5
33.4 31.3
31-90 days
5.4
10.0
8.2
12.2 12.3
91-180 days
5.3
3.9
8.0
6.1 7.9
181-365 days
7.3
5.3
5.5
8.3 7.4
Short-term
73.3
65.3
62.2
59.9 59.1
Medium-Term (Above 1yr and below
3yrs)
12.6
14.6
14.6
15.2 14.8
Long-Term (3 Years and Above)
14.1
20.1
23.2
24.8 26.1
Liabilities
0-30 days
77.9
76.3
73.3
76.5 77.3
31-90 days
13.4
14.4
14.5
12.6 11.5
91-180 days
4.4
3.4
5.2
4.5 4.8
181-365 days
2.9
2.8
3.6
4.2 3.9
Short-term
98.6
96.9
96.6
97.8 97.6
Medium-Term (Above 1yr and below
3yrs)
1.4 2.03 2.4 2.1 2.4
Long-Term (3 Years and Above) 0.005 1.07 1.02 0.09 0.012
CBN Half Year Economic Report for 2012
38
Figure31Market Concentration Ratios of DMBs (Assets/Liabilities)
48
50
52
54
56
58
60
62
550
600
650
700
750
800
Jun 11 Sept 11 DEC 11 Mar 12 June 12
CR
HH
I
HHI (Deposits)(lhs) HHI (Assets)(lhs) CR6(Deposits)(rhs) CR6( Assets)(rhs)
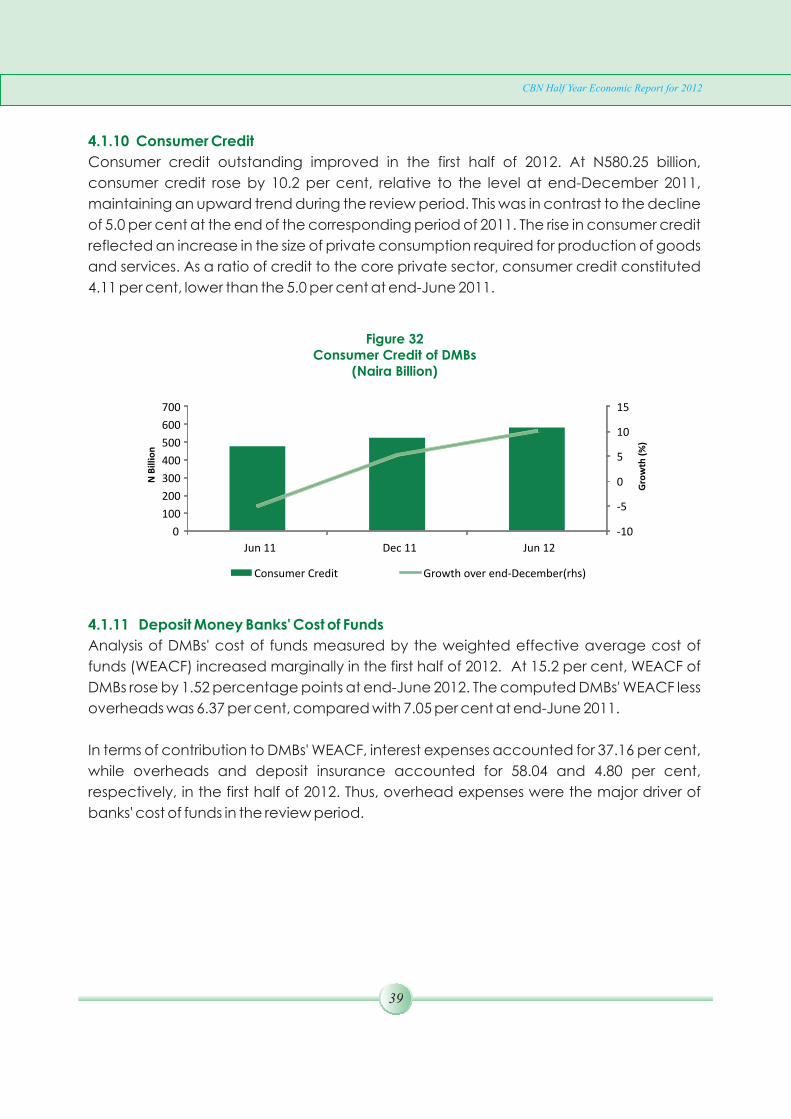
4.1.10 Consumer Credit
Consumer credit outstanding improved in the first half of 2012. At N580.25 billion,
consumer credit rose by 10.2 per cent, relative to the level at end-December 2011,
maintaining an upward trend during the review period. This was in contrast to the decline
of 5.0 per cent at the end of the corresponding period of 2011. The rise in consumer credit
reflected an increase in the size of private consumption required for production of goods
and services. As a ratio of credit to the core private sector, consumer credit constituted
4.11 per cent, lower than the 5.0 per cent at end-June 2011.
Figure 32Consumer Credit of DMBs
(Naira Billion)
-10
-5
0
5
10
15
0
100
200
300
400
500
600
700
Jun 11 Dec 11 Jun 12
Gro
wth
(%
)
N B
illio
n
Consumer Credit Growth over end-December(rhs)
4.1.11 Deposit Money Banks' Cost of Funds
Analysis of DMBs' cost of funds measured by the weighted effective average cost of
funds (WEACF) increased marginally in the first half of 2012. At 15.2 per cent, WEACF of
DMBs rose by 1.52 percentage points at end-June 2012. The computed DMBs' WEACF less
overheads was 6.37 per cent, compared with 7.05 per cent at end-June 2011.
In terms of contribution to DMBs' WEACF, interest expenses accounted for 37.16 per cent,
while overheads and deposit insurance accounted for 58.04 and 4.80 per cent,
respectively, in the first half of 2012. Thus, overhead expenses were the major driver of
banks' cost of funds in the review period.
CBN Half Year Economic Report for 2012
39
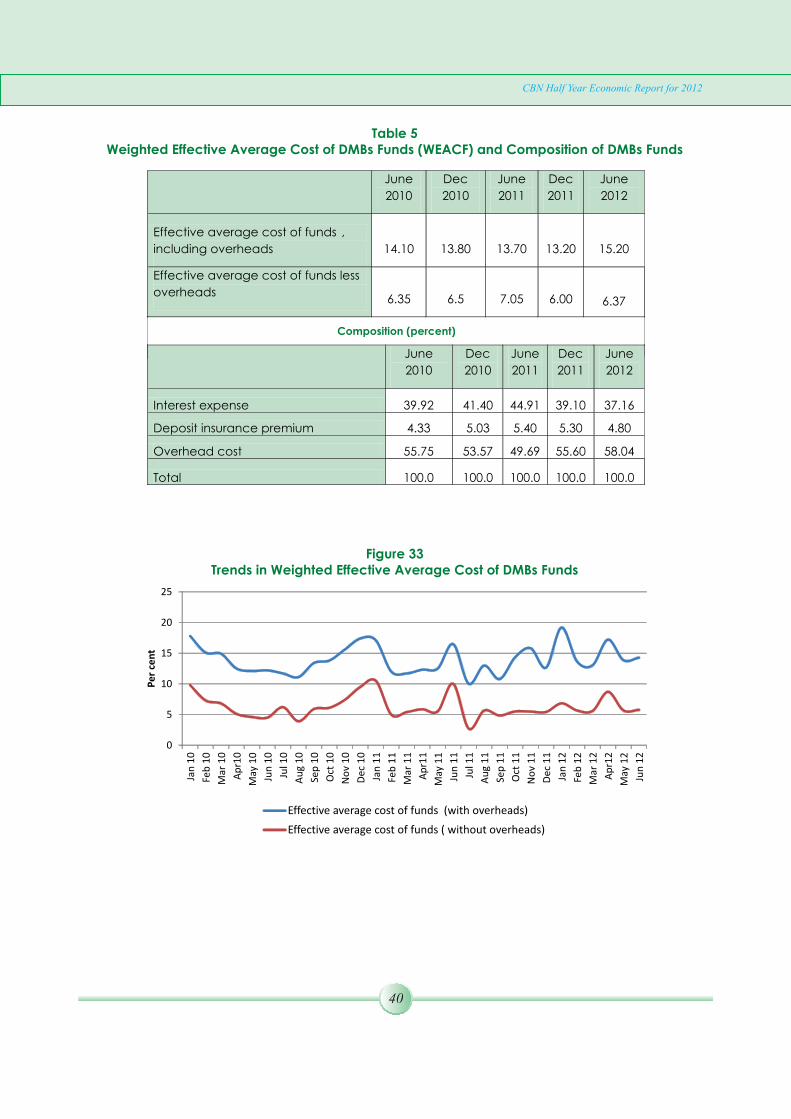
Table 5Weighted Effective Average Cost of DMBs Funds (WEACF) and Composition of DMBs Funds
June
2010
Dec
2010
June
2011
Dec
2011
June
2012
Effective average cost of funds ,
including overheads
14.10
13.80
13.70
13.20 15.20
Effective average cost of funds less
overheads
6.35
6.5
7.05
6.00 6.37
Composition (percent)
June
2010
Dec
2010
June
2011
Dec
2011
June
2012
Interest expense 39.92 41.40 44.91 39.10 37.16
Deposit insurance premium 4.33 5.03 5.40 5.30 4.80
Overhead cost 55.75 53.57 49.69 55.60 58.04
Total 100.0 100.0 100.0 100.0 100.0
Figure 33Trends in Weighted Effective Average Cost of DMBs Funds
0
5
10
15
20
25
Jan
10
Feb
10
Mar
10
Ap
r10
May
10
Jun
10
Jul 1
0
Au
g 1
0
Sep
10
Oct
10
No
v 1
0
Dec
10
Jan
11
Feb
11
Mar
11
Ap
r11
May
11
Jun
11
Jul 1
1
Au
g 1
1
Sep
11
Oct
11
No
v 1
1
Dec
11
Jan
12
Feb
12
Mar
12
Ap
r12
May
12
Jun
12
Pe
r ce
nt
Effective average cost of funds (with overheads)
Effective average cost of funds ( without overheads)
CBN Half Year Economic Report for 2012
40
4.1.12 Developments in the Money Market
4.1.12.1 Cash-less Policy
4.1.12.2 Adoption of Single-Bid System at OMO Auctions
4.1.12.3 Nigeria Master Repurchase Agreement (NMRA)
4.1.12.4 Update on Primary Dealer Market Makers (PDMMs)
4.1.12.5 Release of Exposure Drafts on Competency Framework, Bank Charges, and
Financial Literacy
Major developments in the money market from January to June 2012 included:
commencement of the Cash-Less policy; adoption of a single-bid auction system at
OMO auctions; review of the membership of Money Market Dealers (MMDs); review of
the Guidelines for Repurchase Transactions; update of the list of Primary Dealer Market
Makers (PDMMs) and the release of exposure drafts on Competency Framework, bank
charges and financial literacy.
The pilot-run of the cash-less policy commenced in Lagos on January 1, 2012. However,
the implementation of the service charge component of the policy was deferred till April
1, 2012 for public sensitization and buy-in.
The single-bid auction system was introduced to replace the multi-bid auction system at
the OMO. The development required each Money Market Dealer (MMD) to submit only
one bid per tenor at the OMO. A single bid system was expected to make for more
effective OMO as speculative biddings would be reduced to the barest minimum.
Consequently, the guideline on Money Market Dealership was reviewed for the
appointment of all DMBs and DHs as MMDs effective, May 20, 2012.
The Nigeria Master Repurchase Agreement (NMRA) was introduced on April 2, 2012 to
cover the operations of the SLF and term repurchase transactions (Repo). Eligibility to the
CBN window for SLF and term Repo was limited to DMBs and DHs that had executed the
NMRA. The introduction of the NMRA to the market was in line with international best
practice that features pricing, duration, custodianship and default resolution.
The Debt Management Office (DMO) updated the list of Primary Dealer Market Makers
(PDMMs) to reflect the recent developments in the banking sector. Two banks were
dropped from the list, leaving 13 DMBs and five (5) DHs as PDMMs. PDMMs are given
exclusive rights to purchase/underwrite Federal Government bonds issued for their own
holding and/or for resale.
Exposure drafts on the Competency Framework for the Nigerian Banking Industry,
Financial Literacy Framework in Nigeria and Guide for Bank Charges were released to the
CBN Half Year Economic Report for 2012
41
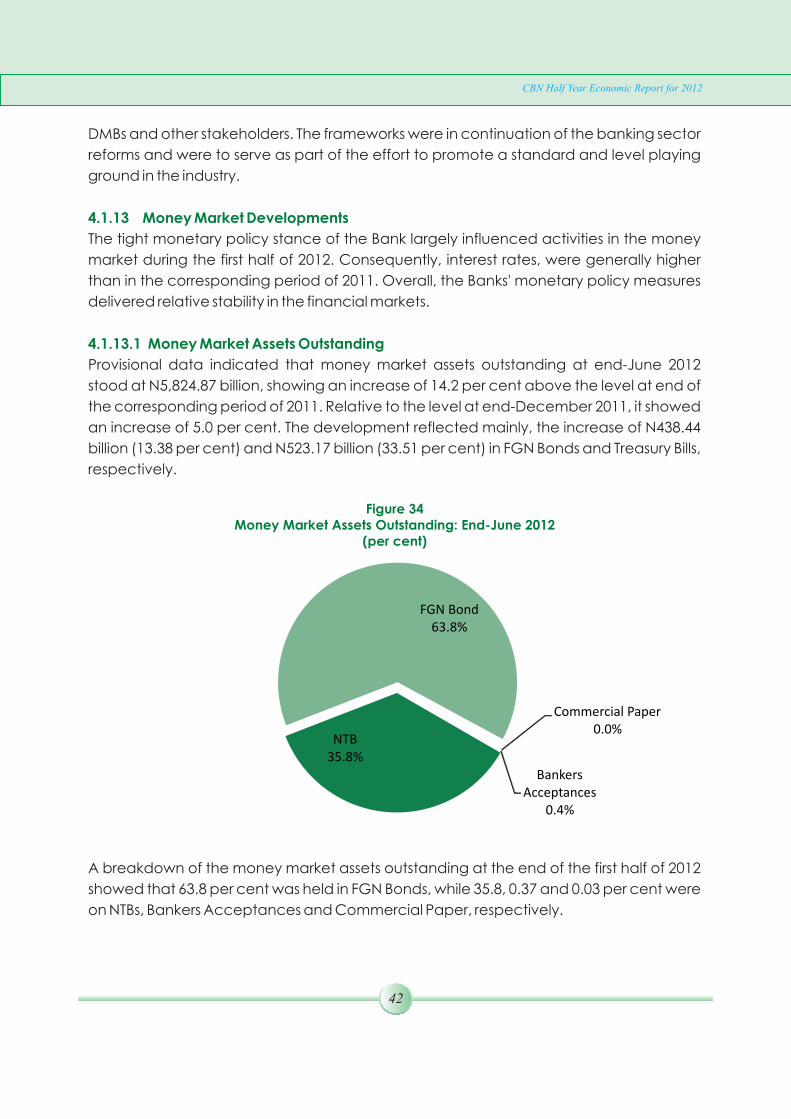
DMBs and other stakeholders. The frameworks were in continuation of the banking sector
reforms and were to serve as part of the effort to promote a standard and level playing
ground in the industry.
The tight monetary policy stance of the Bank largely influenced activities in the money
market during the first half of 2012. Consequently, interest rates, were generally higher
than in the corresponding period of 2011. Overall, the Banks' monetary policy measures
delivered relative stability in the financial markets.
Provisional data indicated that money market assets outstanding at end-June 2012
stood at N5,824.87 billion, showing an increase of 14.2 per cent above the level at end of
the corresponding period of 2011. Relative to the level at end-December 2011, it showed
an increase of 5.0 per cent. The development reflected mainly, the increase of N438.44
billion (13.38 per cent) and N523.17 billion (33.51 per cent) in FGN Bonds and Treasury Bills,
respectively.
4.1.13 Money Market Developments
4.1.13.1 Money Market Assets Outstanding
Figure 34Money Market Assets Outstanding: End-June 2012
(per cent)
NTB 35.8%
FGN Bond 63.8%
Commercial Paper 0.0%
Bankers Acceptances
0.4%
A breakdown of the money market assets outstanding at the end of the first half of 2012
showed that 63.8 per cent was held in FGN Bonds, while 35.8, 0.37 and 0.03 per cent were
on NTBs, Bankers Acceptances and Commercial Paper, respectively.
CBN Half Year Economic Report for 2012
42

4.1.13.2 Primary Market
Nigerian Treasury Bills of 91-, 82- and 364-day tenors amounting to N1,918.27 billion were
offered in the first half of 2012. The total amount subscribed and allotted for all the tenors
were N4,466.58 billion and N1,777.97 billion, respectively. At end-June 2011, total offer,
subscription and allotment for the same three tenors were N1,489.55 billion, N3,823.32
billion and N1,489.55 billion, respectively. The huge subscription was attributed to the
growing demand for government securities in view of the positive real attractive yields as
well as flight to safety strategy. Total NTB outstanding at end-June 2012 stood at N2,084.6
billion, showing an increase of 33.51 per cent over the N1,561.42 billion at the end of the
first half of 2011.
Figure 35Treasury Bills Outstanding
(Naira Billion)
901.0
1,277.1
1,561.4 1,727.9
2,084.6
-
250.0
500.0
750.0
1,000.0
1,250.0
1,500.0
1,750.0
2,000.0
1st Half 2010 2nd Half 2010 1st Half 2011 2nd Half 2011 1st Half 2012
N’ B
illio
n
The CBN remained the registrar and issuing house for the Federal Government securities.
During the review period, FGN Bonds of 3-, 5-, 7- and 10-year tenors were auctioned. Two
tranches each of 5- and 7-year tenors and a tranche of 10-year tenor were offered, while
others were re-opened. The term-to-maturity of the bonds ranged from 1 year 11 months
to 10 years. Total FGN Bonds offered was N453.67 billion, while public subscription and
sale stood at N849.62 billion and N437.57 billion, respectively. The high demand for the
securities was attributed to the high level of liquidity in the banking system, the
preference of investors for risk-free long-term instruments, and the attractive yield on the
bonds. Analysis of the total value of bonds outstanding showed that N1,996.62 billion was
held by DMBs and DHs, while brokers and non-bank public held N1, 717.93 billion.
CBN Half Year Economic Report for 2012
43

Figure 36Distribution of FGN Bonds by Tenor: End-June 2012
(per cent)
3-year4.6%
5-year22.9%
7-year6.9%
10-year65.6%
FGN Bonds
Thus, the total value of bonds outstanding at end-June 2012 stood at N3, 714.55 billion,
compared with N3, 276.1 billion at end-June 2011, representing an increase of N438.4
billion or 13.38 per cent.
In line with the Bank's monetary policy stance, Open Market Operations, complemented
by discount window operations and reserve requirements were the instruments adopted
to manage liquidity in the banking system.
OMO auctions were conducted throughout the first half of 2012 to deepen the
secondary market and to mop-up the excess liquidity in the banking system. Total CBN
bills worthN2,760.00 billion were offered, while total subscription and sales amounted to
N5,051.93 billion and N1,717.35 billion, respectively. The bid and stop rates ranged from
12.00 to 20.00 per cent and 13.24 to 17.59 per cent, respectively. In the corresponding
period of 2011, the amount offered and sold were N480.00 billion and N332.84 billion,
respectively, while total subscription was N768.73 billion. CBN bills valued at N1,130.00
billion matured and were repaid, with N2,120.00 billion outstanding at end-June 2012.
There were no NTBs traded on the two-way quote trading platform in the review period.
However, NTBs of 15-day maturity were traded on the two-way quote trading platform in
the corresponding period of 2011.
During the first half of the year, the Bank entered into repurchase transactions on tenors
ranging from 4 – 30 days with eligible DMBs and DHs to provide required liquidity. Total
4.1.13.3 Open Market Operations (OMO)
4.1.13.4 The Two-Way Quote Trading in NTBs
4.1.13.5 Repurchase Transactions
CBN Half Year Economic Report for 2012
44
request for repo in the review period amounted to N1,601.56 billion with applicable rate
of 15.0 per cent.
Some DMBs and DHs accessed the Standing Lending Facility (SLF) and Standing Deposit
Facility (SDF) in the first half of 2012. The request for standing facilities mirrored the money
market liquidity flows during the review period. Access to SDF was preponderant when
major inflows, mostly through fiscal operations of government, permeated the banking
system. However, the SLF requests increased whenever liquidity was tight. The applicable
rates for SDF and SLF remained at 10.0 and 14.0 per cent, respectively, throughout the
review period as the anchor rate (Monetary Policy Rate) remained at 12.0 per cent.
The average daily request for SLF was N541.26 billion in the first half of 2012, compared
with N974.79 billion, in the corresponding period of 2011. The tight liquidity in the system
occasioned by thethe delay in the release of funds from the Federation Accounts,
resulted in the increase in SLF requests between March and April 2012. However, there
was a decline in requests for SLF in May 2012 following liquidity surfeit in the system. This
development was attributed to the huge inflow from matured FGN Bonds and NTBs. The
position, however, reverted in June 2012 as the market witnessed liquidity shortage,
which gave rise to increased SLF requests.
The average daily request for the SDF was N174.77 billion in the first half of 2012,
compared with N158.42 billion, in the corresponding period of 2011. In the preceding
year, there was no request for the SDF from March-June 2011 when the reserve averaging
system was in operation.
The volume of Inter-bank transactions rose to N8.63 trillion in the first half of 2012 from
N8.09 trillion in the first half of 2011. The development was attributed to the monetary
policy tightening measures, which heightened pressure on the demand for SLF and inter-
bank funds rate. At the Open-Buy-Back (OBB) segment, the trend reversed as OBB
transactions declined to N3.42 trillion in the first half of 2012 from N4.87 trillion in the half
year of 2011. The decline in the volume of transactions at the OBB segment was
attributed to the dearth of government securities in the portfolio of operators. In addition,
some banks had limits for collaterals that are acceptable from other counter-parties in
the money market.
4.1.13.6 Central Bank of Nigeria (CBN) Standing Facilities
4.1.13.6.1 Standing Lending Facility (SLF)
4.1.13.6.2 Standing Deposit Facility (SDF)
4.1.13.7 Inter-Bank Funds Market
CBN Half Year Economic Report for 2012
45
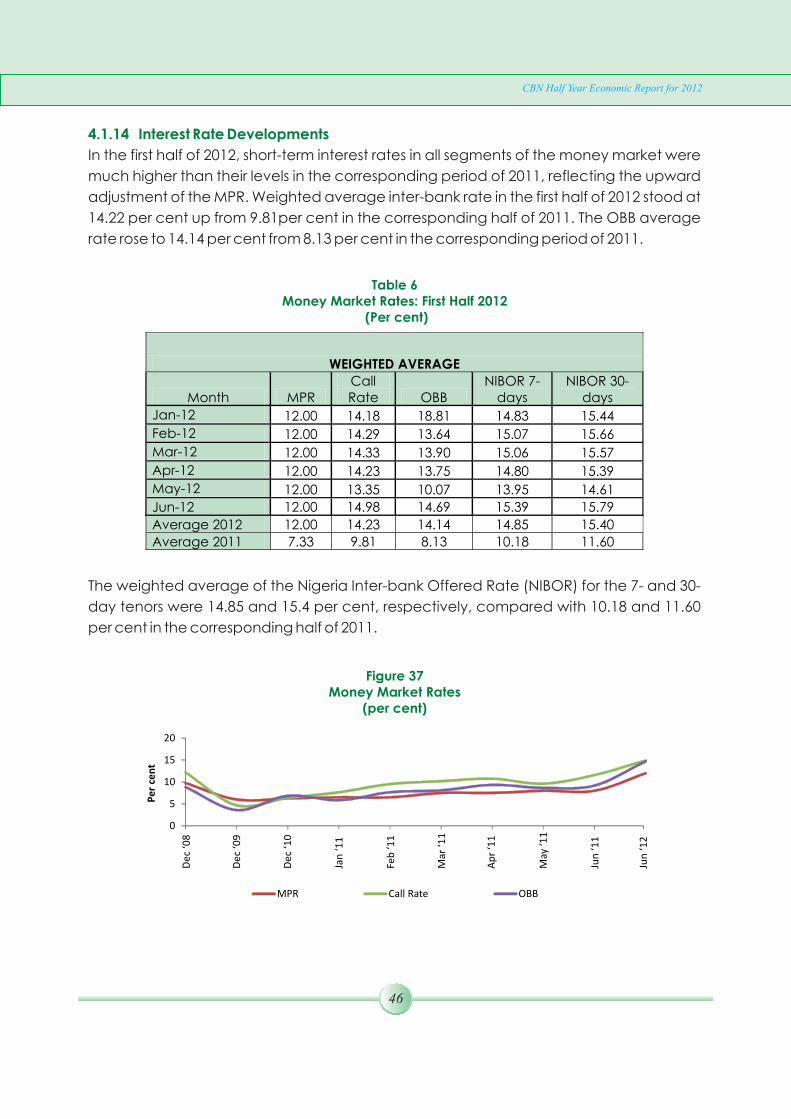
4.1.14 Interest Rate Developments
In the first half of 2012, short-term interest rates in all segments of the money market were
much higher than their levels in the corresponding period of 2011, reflecting the upward
adjustment of the MPR. Weighted average inter-bank rate in the first half of 2012 stood at
14.22 per cent up from 9.81per cent in the corresponding half of 2011. The OBB average
rate rose to 14.14 per cent from 8.13 per cent in the corresponding period of 2011.
Table 6Money Market Rates: First Half 2012
(Per cent)
WEIGHTED AVERAGE
Month
MPR
Call Rate
OBB
NIBOR 7-days
NIBOR 30-days
Jan-12
12.00
14.18
18.81
14.83
15.44
Feb-12
12.00
14.29
13.64
15.07
15.66
Mar-12
12.00
14.33
13.90
15.06
15.57
Apr-12
12.00
14.23
13.75
14.80
15.39
May-12
12.00
13.35
10.07
13.95
14.61
Jun-12
12.00
14.98
14.69
15.39
15.79
Average 2012 12.00 14.23 14.14 14.85 15.40
Average 2011 7.33 9.81 8.13 10.18 11.60
The weighted average of the Nigeria Inter-bank Offered Rate (NIBOR) for the 7- and 30-
day tenors were 14.85 and 15.4 per cent, respectively, compared with 10.18 and 11.60
per cent in the corresponding half of 2011.
Figure 37Money Market Rates
(per cent)
0
5
10
15
20
Dec
‘08
Pe
r ce
nt
MPR Call Rate OBB
Dec
‘09
Dec
‘10
Jan
‘11
Feb
‘11
Mar
‘11
Ap
r ‘1
1
May
‘11
Jun
‘11
Jun
‘12
CBN Half Year Economic Report for 2012
46
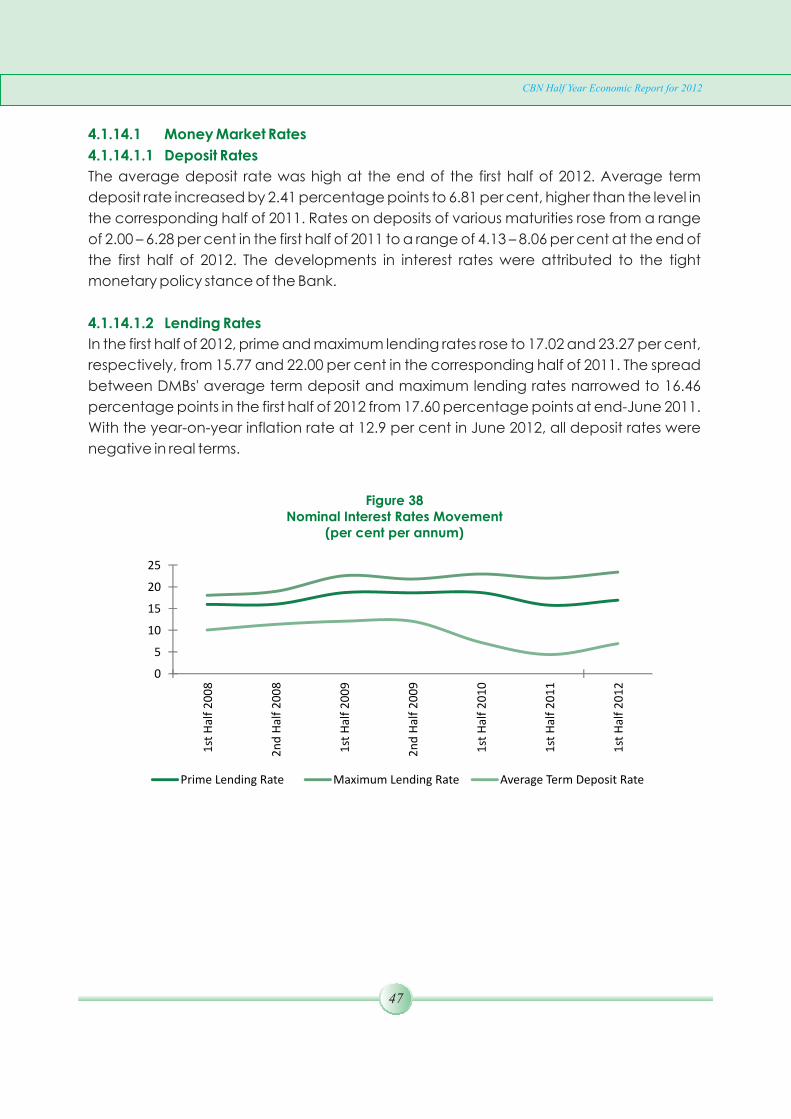
4.1.14.1 Money Market Rates
4.1.14.1.1 Deposit Rates
4.1.14.1.2 Lending Rates
The average deposit rate was high at the end of the first half of 2012. Average term
deposit rate increased by 2.41 percentage points to 6.81 per cent, higher than the level in
the corresponding half of 2011. Rates on deposits of various maturities rose from a range
of 2.00 – 6.28 per cent in the first half of 2011 to a range of 4.13 – 8.06 per cent at the end of
the first half of 2012. The developments in interest rates were attributed to the tight
monetary policy stance of the Bank.
In the first half of 2012, prime and maximum lending rates rose to 17.02 and 23.27 per cent,
respectively, from 15.77 and 22.00 per cent in the corresponding half of 2011. The spread
between DMBs' average term deposit and maximum lending rates narrowed to 16.46
percentage points in the first half of 2012 from 17.60 percentage points at end-June 2011.
With the year-on-year inflation rate at 12.9 per cent in June 2012, all deposit rates were
negative in real terms.
Figure 38Nominal Interest Rates Movement
(per cent per annum)
0
5
10
15
20
25
1st
Hal
f 2
00
8
2n
d H
alf
20
08
1st
Hal
f 2
00
9
2n
d H
alf
20
09
1st
Hal
f 2
01
0
1st
Hal
f 2
01
1
1st
Hal
f 2
01
2
Prime Lending Rate Maximum Lending Rate Average Term Deposit Rate
CBN Half Year Economic Report for 2012
47
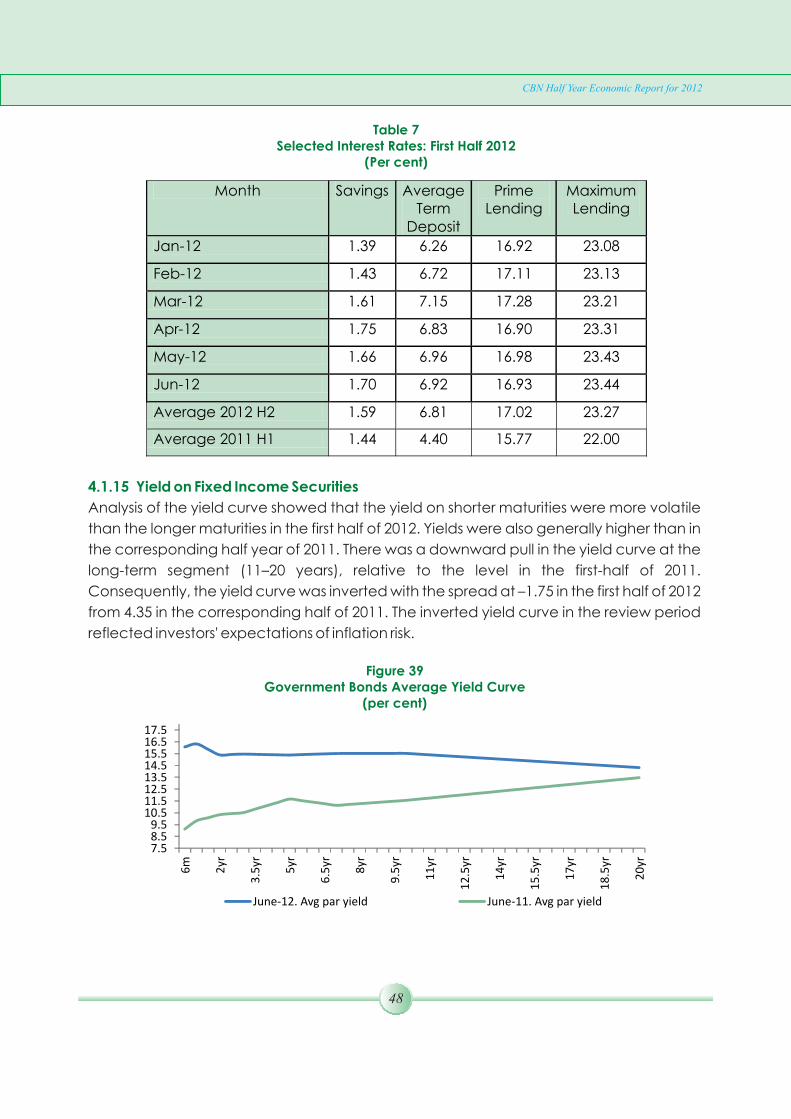
Table 7Selected Interest Rates: First Half 2012
(Per cent)
Month Savings Average Term
Deposit
Prime Lending
Maximum Lending
Jan-12
1.39 6.26
16.92
23.08
Feb-12
1.43
6.72
17.11
23.13
Mar-12
1.61
7.15
17.28
23.21
Apr-12
1.75
6.83
16.90
23.31
May-12
1.66
6.96
16.98
23.43
Jun-12
1.70
6.92
16.93
23.44
Average 2012 H2
1.59
6.81
17.02
23.27
Average 2011 H1 1.44 4.40 15.77 22.00
4.1.15 Yield on Fixed Income Securities
Analysis of the yield curve showed that the yield on shorter maturities were more volatile
than the longer maturities in the first half of 2012. Yields were also generally higher than in
the corresponding half year of 2011. There was a downward pull in the yield curve at the
long-term segment (11–20 years), relative to the level in the first-half of 2011.
Consequently, the yield curve was inverted with the spread at –1.75 in the first half of 2012
from 4.35 in the corresponding half of 2011. The inverted yield curve in the review period
reflected investors' expectations of inflation risk.
Figure 39Government Bonds Average Yield Curve
(per cent)
7.58.59.5
10.511.512.513.514.515.516.517.5
6m
2yr
3.5
yr
5yr
6.5
yr
8yr
9.5
yr
11
yr
12
.5yr
14
yr
15
.5yr
17
yr
18
.5yr
20
yr
June-12. Avg par yield June-11. Avg par yield
CBN Half Year Economic Report for 2012
48
4.1.16 Institutional Savings
4.1.17 Other Financial Institutions
4.1.17.1 Development Finance Institutions
4.1.17.2 Microfinance Banks (MFBs)
Aggregate institutional savings at end-June 2012 stood at N7,544.4 billion, indicating an
increase of 10.0 per cent over the level at end-December 2011, but a decline of 11.5 per
cent from the level at end-June 2011. The DMBs remained the dominant savings
institution, accounting for 91.2 per cent of the total at end-June 2012, compared with
95.2 per cent at end-December 2011. Other institutions, including primary mortgage
banks (PMBs), life insurance funds, the Nigerian Social Insurance Trust Fund (NSITF), and
microfinance banks (MFBs) held the balance of 8.8 per cent. The ratio of institutional
savings to first half 2012 GDP (at current basic prices) was 39.4 per cent, compared with
53.4 per cent in the corresponding period of 2011.
Provisional data indicated that the total assets of the five (5) development finance
institutions (DFIs), namely: Bank of Industry (BOI), Federal Mortgage Bank of Nigeria
(FMBN), Nigerian Export Import Bank (NEXIM), Bank of Agriculture (BOA), and
Infrastructure Bank (IB) increased by 5.8 per cent to N380.3 billion at end-June 2012. The
paid-up share capital, deposits and loans/advances increased by 3.1, 28.7 and 25.0 per
cent to N70.5 billion, N94.2 billion and N162.2 billion, respectively, at end-June 2012. Total
shareholders' funds, however, declined by 8.1 per cent to N23.7 billion at end-June 2012.
A disaggregation of the asset base of the institutions indicated that BOI, FMBN, NEXIM,
BOA and IB accounted for 56.6, 18.2, 12.4, 10.0, and 2.8 per cent of the total, respectively.
With the exception of the BOI, all the other DFIs were faced with dire operational
challenges as evidenced in the increase in their aggregate losses from N42.6 billion at
end-December 2011 to N47.1 billion at end-June 2012.
Total assets/liabilities of the Microfinance Banks (MFBs) stood at N196.5 billion,
representing an increase of 3.0 per cent above the level at end-December 2011.
Similarly, the paid-up share capital, deposit liabilities and loans/advances increased by
8.1, 21.2 and 28.1 per cent, above the levels at end-December 2011, to N49.1 billion,
N104.2 billion and N86.6 billion, respectively. However, aggregate reserves decreased
from N2.0 billion at end-December 2011 to negative N1.6 billion at end-June 2012.
Investible funds during the review period amounted to N53.3 billion. The funds were
sourced mainly from increase in deposit liabilities (N18.1billion), reduction in placements
with banks (N15.1 billion) and other liabilities (N12.7billion). The funds were utilized mainly
to redeem placements from banks (N19.4 billion), increase loans/advances (N18.9
billion) and short-term investments (N5.4billion).
CBN Half Year Economic Report for 2012
49
4.1.17.3 Discount Houses
4.1.17.4 Finance Companies (FCs)
4.1.17.5 Primary Mortgage Banks (PMBs)
Total assets/liabilities of the five (5) discount houses at end-June 2012 increased by 30.7
and 12.5 per cent to N361.0 billion, compared with N276.2 billion and N320.8 billion
recorded in the corresponding period of 2011 and end-December 2011, respectively.
The total funds sourced amounted to N46.2 billion, compared with N12.9 billion at end-
June 2011. The funds were sourced mainly from claims on Federal Government (N38.3
billion), increase in borrowings (N3.5 billion) and other liabilities (N4.4 billion). The funds
were utilized mainly in the settlement of “money at call” (N22.6 billion) and claims on
banks (N9.5 billion). Discount houses' investments in Federal Government securities of less
than 91 days maturity amounted to N70.8 billion at end-June 2012, representing 25.5 per
cent of their total deposit liabilities. This was 34.5 percentage points below the prescribed
minimum of 60.0 per cent for fiscal 2012.
Total assets/liabilities of the finance companies (FCs) declined by 2.4 and 3.5 per cent to
N113.5 billion at end-June 2012 from N116.3 billion and N117.6 billion at end-June 2011
and end-December 2011, respectively. Similarly, aggregate borrowing declined, by 14.0
and 14.7 per cent, to N67.8 billion, compared with N78.8 billion and N79.5 billion at end-
December 2011 and end-June 2011, respectively. The paid-up capital and aggregate
loans and advances of the sub-sector, however, increased by 1.0 and 0.3 per cent to
N20.3 billion and N32.0 billion, respectively, in the review period. Investible funds accruing
to the sub-sector amounted to N17.7 billion. The funds were sourced mainly from increase
in other liabilities (N7.0 billion) and a decrease in bank placements (N10.3 billion) and
were used mainly to settle debts (N10.9 billion) and increase investments (N4.3 billion)
and other assets (N1.7 billion).
Total assets/liabilities of the PMBs increased by 1.2 and 0.4 per cent to N361.4 billion at
end-June 2012, compared with N357.1 billion and N360.0 billion recorded at end-
December 2011 and the corresponding half of 2011, respectively. The paid-up capital
and loans/advances increased by 5.7 and 9.6 per cent over the levels at end-December
2011 to N67.2 billion and N138.7billion, respectively, at end-June 2012. Deposit liabilities,
fixed assets and other assets, however, declined by 2.8,23.4 and 17.9 per cent,
respectively, to N177.8 billion, N18.0 billion and N50.3 billion at end-June 2012. Investible
funds available to the PMBs, in the review period, amounted to N41.5 billion, compared
with N23.1 billion at end-June 2011. The funds were sourced mainly from decrease in bank
balances (N12.1 billion), other assets (N11.0 billion), and fixed assets (N5.5 billion). The
funds were utilised mainly to increase investments (N20.3 billion) and loans/advances
(N12.1 billion).
CBN Half Year Economic Report for 2012
50
4.1.17.6 Asset Management Corporation of Nigeria (AMCON)
4.1.18 Capital Market Developments
4.1.18.1 Institutional Developments
The Asset Management Corporation of Nigeria (AMCON) continued to play a significant
role in resolving the banking sector crisis through the acquisition of the non-performing
loans (NPLs) of the DMBs. At end-June 2012, the Corporation had issued bonds worth
N5,397.0 billion since inception to purchase DMBs' toxic assets, provide financial
accommodation to the recapitalized banks and acquire the bridge banks. Of the
N3,275.0 billion acquired toxic assets as at June 2012, the sum of N253.6 billion involving
383 accounts had been restructured and were performing, and the sum of N52.8 billion
had been recovered.
In line with the Memorandum of Understanding (MoU) signed between all the DMBs and
the Bank, the Banking Sector Resolution Cost Sinking Fund was established. Based on the
MoU, DMBs were required to make annual contribution of 30 basis points of their total
asset based on their audited financial statement to the Fund over the next 10 years. In the
event that the recoveries from the acquired toxic assets and the proceeds from the sale
of the bridge banks are not enough to meet the repayment of the bonds, the Fund would
be used to meet the shortfall without recourse to the Federal Government that
guaranteed the bonds. AMCON's intervention coupled with improved risk management
practices resulted in a sharp fall in the proportion of NPLs in the banking system from a
mean of 10.4 per cent at end-June 2011 to 4.3 per cent at end-June 2012.
The Nigerian Stock Exchange (NSE) entered into an agreement with the NASDAQ OMX
Group, Inc. to upgrade its cash equities trading platform to the NASDAQ OMX X-stream in
order to enhance multi-asset trading. It was envisaged that the upgrade which would be
rolled-out during the first half of 2013 would improve stakeholders' experiences on the
Exchange through enhanced market flexibility, investors' awareness and adaptability. In
addition, the Exchange launched its broker virtual private network (VPN) to facilitate high
capacity and cost-efficient order management and execution of trades from broker-
dealer offices.
The NSE reviewed its listing rules and requirements to enhance flexibility and attract
smaller companies to the Exchange. A key element of the review was the reduction in
the number of years for companies seeking listing on the main boards and Alternate
Securities Market (ASEM) must be in operation from five (5) and three (3) years to three (3)
and two (years), respectively. The new listing rules and requirements became effective
on April 1, 2012.
The NSE signed a Memorandum of Understanding with Lotus Capital for the
CBN Half Year Economic Report for 2012
51

development and management of a certified Shari'ah compliant index. The index
known as “NSE Lotus Islamic Index” was developed to track the performance of Shari'ah
compliant equities on the floor of the Nigerian Stock Exchange, thus further increasing the
variety of investment classes in Nigeria.
As part of measures to enhance liquidity and improve the depth of the securities market,
the Council of the Nigeria Stock Exchange appointed ten (10) primary market makers.
The primary responsibility of market makers is to make a two-way price quote in each of
the stocks in which they make markets.
In a public notice released on April 13, 2012, the Securities and Exchange Commission
(SEC) directed that share certificates would be dematerialized by January 1, 2013. This
involved the replacement of physical certificates and documents representing
ownership of securities with an electronic process with the objective of facilitating a cost-
efficient and effective processing of stock market transactions. All new stock market
transactions, entered into, after the date of the public notice have, however, been
dematerialized.
The performance of the Nigeria Stock Exchange was mixed in the first half of 2012. In the
primary market segment, 24.1 billion supplementary shares were listed, compared with
5.1 billion shares at end-June 2011. In the secondary segment of the market, the
cumulative volume and value of securities traded declined by 8.6 and 15.0 per cent to
close at 46.1 billion shares valued at N317.33 billion, in 444,951 deals, compared with 50.4
billion shares and N373.5 billion, in 733, 609 deals recorded in the corresponding period of
2011, respectively. The All-Share Index (ASI) and aggregate market capitalization rose by
4.2 and 20.4 per cent to close at 21,599.57 and N12.4 trillion, respectively, compared with
20,730.6 and N10.3 trillion at end-December 2011.
In the first half of 2012, there were twelve (12) and nine (9) new and supplementary
listings, respectively, on the Exchange. The new issues comprised four (4) equities, five (5)
corporate bonds, four (4) FGN Bonds and two (2) state government bonds. In addition,
nine (9) companies were granted approval to conduct supplementary listings
amounting to 24.1 billion shares.
The cumulative volume and value of securities traded in the secondary segment of the
market declined by 8.6 and 15.0 per cent to close at 46.1 billion shares valued at N317.33
4.1.18.2 The Nigerian Stock Exchange (NSE)
4.1.18.3 New Issues Market
4.1.18.4 The Secondary Market
CBN Half Year Economic Report for 2012
52

billion, in 444,951 deals respectively, compared with 50.4 billion shares and N373.5 billion,
in 733,609 deals recorded in the corresponding period of 2011. The equities sub-sector
sustained its dominance in the secondary segment of the market as it accounted for 99.9
per cent of cumulative trade activities with the debt instrument accounting for the
balance of 0.1 per cent. Listed equities accounted for 55.6 per cent of aggregate market
capitalization, while the debt market accounted for the balance. Sectoral analysis of the
developments in the market indicated that the banking sub-sector of the financial
services sector remained the most active on the Exchange with a traded volume of 30.14
billion shares, valued at N182.48 billion in 217,364 deals at end-June 2012.
Cumulative transactions on the Over-the-Counter (OTC) bond segment of the market,
indicated a turnover of 3.53 billion units worth N3.1 trillion in 23,279 deals in the first half of
2012, compared with a turnover of 6.1 billion units valued at N11.6 trillion in 30,753 deals in
the corresponding period of 2011.
Figure 40Volume and Value of Transactions at the NSE
00
2nd Half 2008 1st Half 2009 2nd Half 2009 1st Half 2010 1st Half 2011 1st Half 2012
Volume of Transactions Value of Transactions
500
1000
1500
2000
2500
3000
50
100
150
200
250
Vo
lum
e in
Nu
mb
er
Val
ue
in N
aira
Bill
ion
4.1.18.5 Value of All-Share Index
The All-Share Index (ASI) recorded improved performance relative to the level at end-
December 2011. The NSE ASI increased by 4.2 per cent to 21,599.57 at end-June 2012,
compared with 20,730.6 at end-December 2011. When compared with the level at end-
June 2011, it, however, fell by 13.5 per cent. Aggregate market capitalization of all listed
securities closed at N12.4 trillion, indicating an increase of 10.7 per cent over the level in
the corresponding period of 2011. Listed equities accounted for 55.6 per cent (N6.9
trillion), while the debt component accounted for the balance of 44.4 per cent (N5.5
trillion) of the aggregate market capitalization. As a percentage of estimated nominal
GDP, aggregate market capitalization stood at 64.8 per cent, compared with 73.2 per
cent recorded at end-June 2011.
CBN Half Year Economic Report for 2012
53
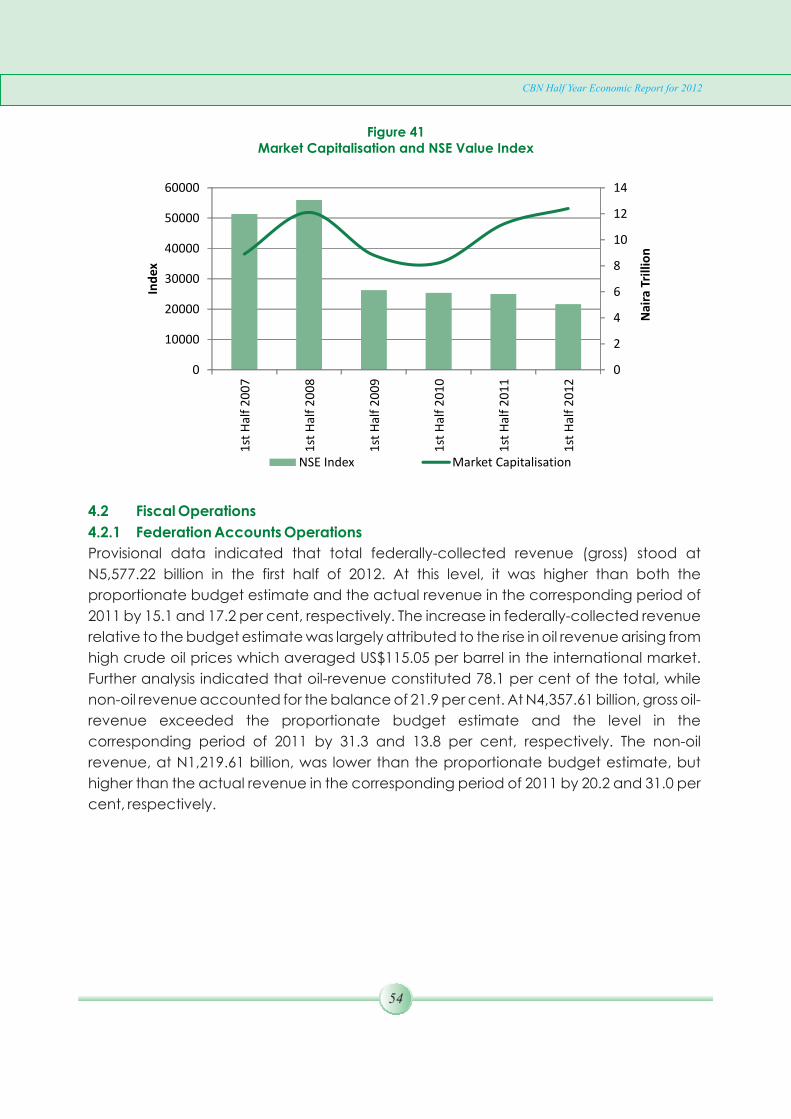
Figure 41Market Capitalisation and NSE Value Index
0
2
4
6
8
10
12
14
0
10000
20000
30000
40000
50000
60000
1st
Hal
f 2
00
7
1st
Hal
f 2
00
8
1st
Hal
f 2
00
9
1st
Hal
f 2
01
0
1st
Hal
f 2
01
1
1st
Hal
f 2
01
2
Nai
ra T
rilli
on
Ind
ex
NSE Index Market Capitalisation
4.2 Fiscal Operations
4.2.1 Federation Accounts Operations
Provisional data indicated that total federally-collected revenue (gross) stood at
N5,577.22 billion in the first half of 2012. At this level, it was higher than both the
proportionate budget estimate and the actual revenue in the corresponding period of
2011 by 15.1 and 17.2 per cent, respectively. The increase in federally-collected revenue
relative to the budget estimate was largely attributed to the rise in oil revenue arising from
high crude oil prices which averaged US$115.05 per barrel in the international market.
Further analysis indicated that oil-revenue constituted 78.1 per cent of the total, while
non-oil revenue accounted for the balance of 21.9 per cent. At N4,357.61 billion, gross oil-
revenue exceeded the proportionate budget estimate and the level in the
corresponding period of 2011 by 31.3 and 13.8 per cent, respectively. The non-oil
revenue, at N1,219.61 billion, was lower than the proportionate budget estimate, but
higher than the actual revenue in the corresponding period of 2011 by 20.2 and 31.0 per
cent, respectively.
CBN Half Year Economic Report for 2012
54

Figure 42Structure of Gross Federation Revenue, Half Year 2008-2012
(Naira Billion)
3,133.58
1,538.86
2,445.42
3,828.05
4,357.61
619.14
687.33
830.45
930.91
1,219.61
-
1,000.00
2,000.00
3,000.00
4,000.00
5,000.00
6,000.00
2008 2009 2010 2011 2012
Oil Revenue Non-Oil Revenue
Of the total federally-collected revenue (gross), the sum of N2,624.68 billion or 47.1 per
cent was transferred to the Federation Account; N226.70 billion or 4.1 per cent to the FG
Independent revenue, N338.64 billion or 4.1 per cent to VAT Pool Account and N131.37
billion or 2.3 per cent to other transfers (including Education Tax Fund, Customs Special
Levies and National Information Technology Development Fund). Deductions from oil
revenue in respect of the Joint Venture Cash Call, Excess Crude Oil, Excess PPT/Royalty,
Domestic Subsidy and others accounted for N2,214.56 billion or 39.7 per cent, while the
balance of N41.27 billion or 0.6 per cent was transferred as cost of revenue collection to
the Federal Inland Revenue Service (FIRS) and the Nigerian Customs Service (NCS).
Figure 43Breakdown of Federally-Collected Revenue: First Half, 2012
(per cent)
Federation Account47.1%
FG Indep. Rev. 4.1%
VAT 6.1%
"Other Transfers"
2.4%
Deductions 40.3%
CBN Half Year Economic Report for 2012
55
4.2.1.1 Federation Account Distribution
4.2.1.2 VAT Pool Account
4.2.2 Federal Government Finances
4.2.2.1 Federal Government Retained Revenue
The sum of N2,624.68 billion was distributed to the three tiers of government from the
Federation Account in the first half of 2012, indicating a shortfall of 13.6 per cent relative
to the proportionate budget estimate, but exceeded the amount distributed in the
corresponding period of 2011 by 23.7 per cent. The Federal Government received the
sum of N1,235.92 billion, while the states and local governments collected N626.87 billion
and N483.29 billion, respectively. The balance of N278.60 billion was allocated to the 13%
Derivation Fund for distribution among the oil producing States.
Furthermore, the sums of N75.00 billion, N165.62 billion and N462.02 billion were distributed
as share of Excess Crude Account, Subsidy Re-Investment and Empowerment
Programme (SURE-P)/Exchange Rate Gain/NNPC Refund and revenue augmentation,
respectively. This brought the total federation revenue distributed among the three tiers
of government including the 13% Derivation Fund to N3,327.33 billion. A breakdown
indicated that the Federal Government received N1,537.01 billion (including Special
Funds), state governments N802.04 billion, local governments N618.34 billion, while the
sum of N369.94 billion was allocated as 13% Derivation Fund.
The sum of N338.64 billion accrued to the VAT Pool Account in the first half of 2012,
representing a decline of 12.1 per cent from the proportionate budget estimate, but 14.9
per cent higher than the level in the corresponding period of 2011. The distribution
among the three tiers of government indicated that the Federal Government received
N50.80 billion, while the states and local governments shared N169.32 billion and N118.52
billion, respectively.
At N1,741.98 billion, the Federal Government's retained revenue was lower than the
proportionate budget estimate by 12.4 per cent, but higher than the level in the
corresponding period of 2011 by 33.2 per cent. The shortfall in the retained revenue
relative to the proportionate budget estimate was largely attributed to the drop in the
actual amount shared from both the Federation Account and SURE-P. Analysis of the
retained revenue revealed that the share from the Federation Account was N1,235.92
billion or 70.9 per cent, VAT Pool Account N50.80 billion or 2.9 per cent, Federal
Government Independent Revenue N154.17 billion or 8.9 per cent, share of excess crude
account (including budget augmentation as well as SURE-P) amounted toN278.71 billion
or 16.0 per cent, while “others” accounted for N22.38 billion or 1.3 per cent.
CBN Half Year Economic Report for 2012
56
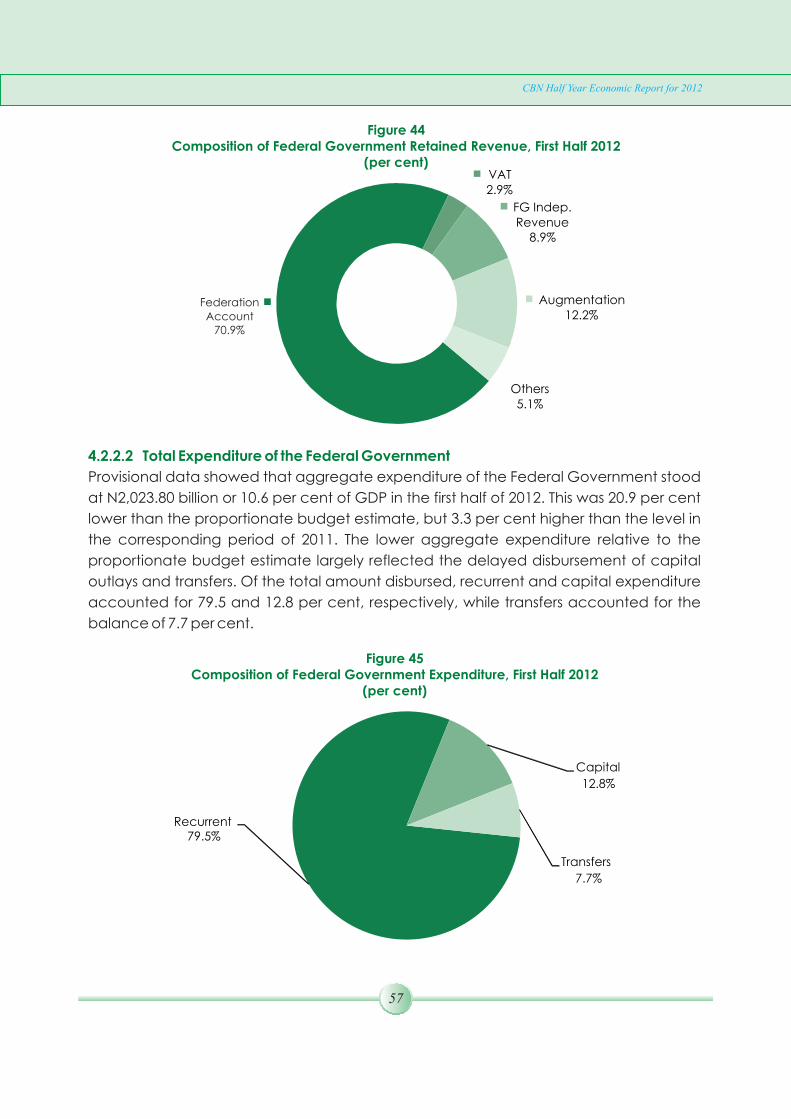
Figure 44Composition of Federal Government Retained Revenue, First Half 2012
(per cent)
Federation Account
70.9%
VAT 2.9%
FG Indep. Revenue
8.9%
Augmentation 12.2%
Others
5.1%
4.2.2.2 Total Expenditure of the Federal Government
Provisional data showed that aggregate expenditure of the Federal Government stood
at N2,023.80 billion or 10.6 per cent of GDP in the first half of 2012. This was 20.9 per cent
lower than the proportionate budget estimate, but 3.3 per cent higher than the level in
the corresponding period of 2011. The lower aggregate expenditure relative to the
proportionate budget estimate largely reflected the delayed disbursement of capital
outlays and transfers. Of the total amount disbursed, recurrent and capital expenditure
accounted for 79.5 and 12.8 per cent, respectively, while transfers accounted for the
balance of 7.7 per cent.
Figure 45Composition of Federal Government Expenditure, First Half 2012
(per cent)
Recurrent 79.5%
Capital
12.8%
Transfers
7.7%
CBN Half Year Economic Report for 2012
57

The economic classification of the recurrent expenditure showed that N1,194.31 billion or
6.2 per cent of GDP was expended on goods and services, N314.46 billion or 1.6 per cent
of GDP on interest payments, while transfers appropriated N99.67 billion or 0.5 per cent of
GDP. The expenditure on social and community services fell by 9.6 per cent to N259.56
billion or 1.4 per cent of GDP as against the N287.08 billion or 1.6 per cent of GDP
recorded in the corresponding period of 2011. Similarly, the expenditure on economic
services declined by 33.2 per cent to N130.46 billion or 0.7 per cent of GDP, from N195.35
billion or 1.1 per cent of GDP in the first-half of 2011.
Provisional data on the functional classification of the Federal Government's capital
expenditure in the first-half of 2012 revealed that aggregate capital releases for
economic services fell by 17.7 per cent below its level in the first half of 2011 to N97.82
billion or 0.5 per cent of GDP and accounted for 37.7 per cent of the total releases. Social
and community services accounted for 15.3 per cent of the total, but declined by 27.8
per cent from the level in the corresponding period of 2011 to N39.62 billion or 0.2 per cent
of GDP in the first half of 2012. The outlay on administration accounted for 43.8 per cent of
the total and decreased by 4.7 per cent to N113.61 billion or 0.6 per cent of GDP. Overall,
total capital releases at N259.25 billion was 38.7 per cent of the proportionate budget
estimate of N669.99 billion in the first-half of 2012.
The fiscal operations of the Federal Government in the first half of 2012 resulted in an
overall notional deficit of N281.82 billion or 1.5 per cent of GDP as against the
proportionate budget deficits of N568.10 billion or 3.0 per cent of GDP and the deficit of
N650.23 billion or 3.7 per cent of GDP recorded in the corresponding period of 2011. The
deficit was financed from domestic sources, mainly, the FGN Bonds.
Gross statutory allocation to state governments from the Federation Account in the first
half of 2012 amounted to N1,341.30 billion which represented an increase of 35.9 per cent
above the level in the corresponding period of 2011. However, the sum of N86.33 billion
was deducted from the gross share, as state governments' commitment in respect of
various contractual obligations, namely, contribution to external debt service fund,
National Water Rehabilitation Projects, National Agricultural Technology Support
Programme, Commercial Agricultural Credit Scheme (CACS), Payment for Fertilizer,
National Programme for Food Security, State Bond Issuance Programmes and the
National Fadama Project. This resulted in a net statutory allocation of N1,254.97 billion
which represented an increase of 33.2 per cent from the level in the first half of 2011.
4.2.3 State Governments’ Finances
CBN Half Year Economic Report for 2012
58
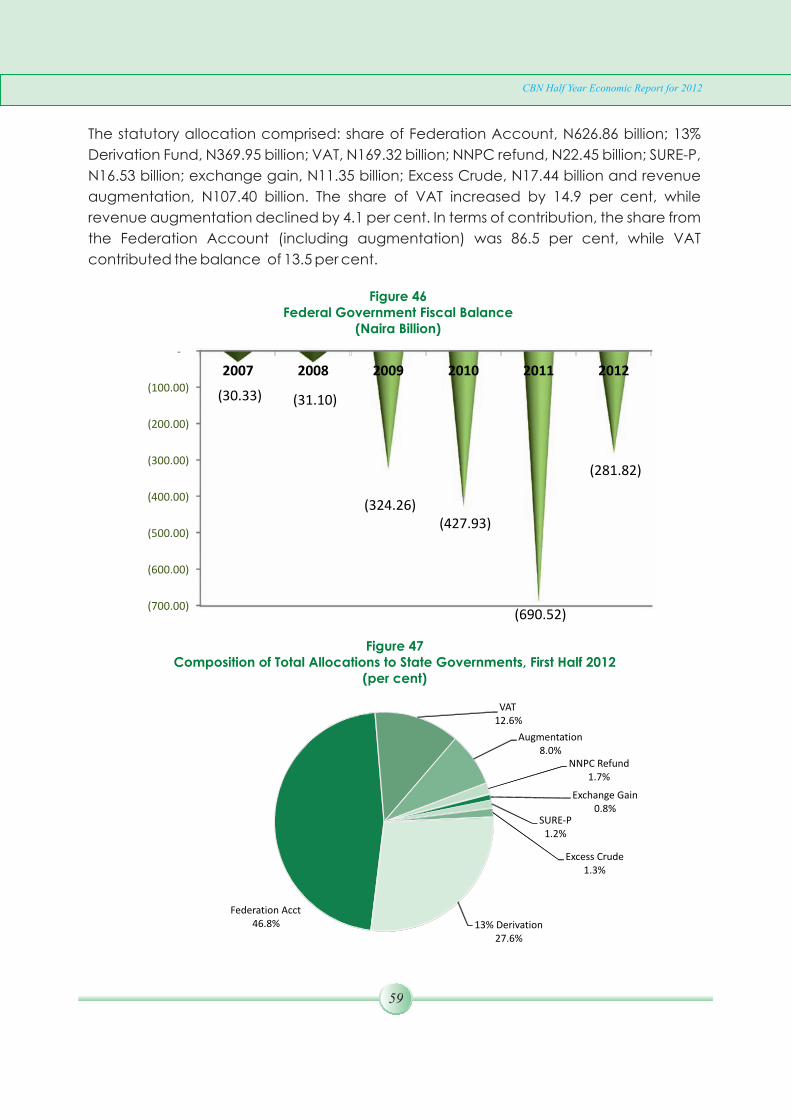
Figure 46Federal Government Fiscal Balance
(Naira Billion)
(700.00)
(600.00)
(500.00)
(400.00)
(300.00)
(200.00)
(100.00)
-
2007 2008 2009 2010 2011 2012
(30.33) (31.10)
(324.26)
(427.93)
(690.52)
(281.82)
The statutory allocation comprised: share of Federation Account, N626.86 billion; 13%
Derivation Fund, N369.95 billion; VAT, N169.32 billion; NNPC refund, N22.45 billion; SURE-P,
N16.53 billion; exchange gain, N11.35 billion; Excess Crude, N17.44 billion and revenue
augmentation, N107.40 billion. The share of VAT increased by 14.9 per cent, while
revenue augmentation declined by 4.1 per cent. In terms of contribution, the share from
the Federation Account (including augmentation) was 86.5 per cent, while VAT
contributed the balance of 13.5 per cent.
Figure 47Composition of Total Allocations to State Governments, First Half 2012
(per cent)
Federation Acct
46.8%
VAT
12.6% Augmentation
8.0%
NNPC Refund
1.7%
Exchange Gain0.8%
SURE-P
1.2%
Excess Crude1.3%
13% Derivation27.6%
CBN Half Year Economic Report for 2012
59
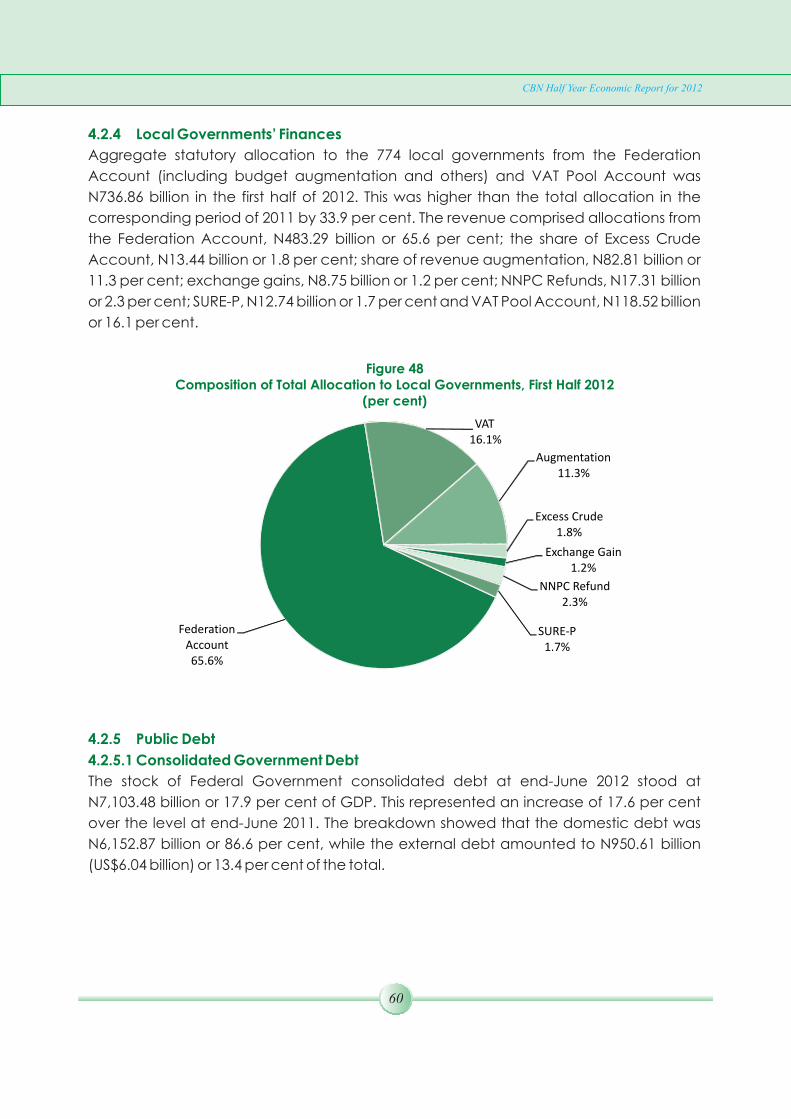
4.2.4 Local Governments’ Finances
Aggregate statutory allocation to the 774 local governments from the Federation
Account (including budget augmentation and others) and VAT Pool Account was
N736.86 billion in the first half of 2012. This was higher than the total allocation in the
corresponding period of 2011 by 33.9 per cent. The revenue comprised allocations from
the Federation Account, N483.29 billion or 65.6 per cent; the share of Excess Crude
Account, N13.44 billion or 1.8 per cent; share of revenue augmentation, N82.81 billion or
11.3 per cent; exchange gains, N8.75 billion or 1.2 per cent; NNPC Refunds, N17.31 billion
or 2.3 per cent; SURE-P, N12.74 billion or 1.7 per cent and VAT Pool Account, N118.52 billion
or 16.1 per cent.
Figure 48Composition of Total Allocation to Local Governments, First Half 2012
(per cent)
Federation Account
65.6%
VAT 16.1%
Augmentation
11.3%
Excess Crude1.8%
Exchange Gain
1.2%
NNPC Refund2.3%
SURE-P
1.7%
4.2.5 Public Debt
4.2.5.1 Consolidated Government Debt
The stock of Federal Government consolidated debt at end-June 2012 stood at
N7,103.48 billion or 17.9 per cent of GDP. This represented an increase of 17.6 per cent
over the level at end-June 2011. The breakdown showed that the domestic debt was
N6,152.87 billion or 86.6 per cent, while the external debt amounted to N950.61 billion
(US$6.04 billion) or 13.4 per cent of the total.
CBN Half Year Economic Report for 2012
60

Figure 49Composition of Federal Government Consolidated Debt, First Half 2012
(per cent)
Domestic 86.6%
External 13.4%
4.2.5.2 Domestic Debt
4.2.5.3 External Debt
4.2.5.4 Total Debt Service Payments
The Federal Government's outstanding securitized domestic debt at end-June 2012
amounted to N6,152.87 billion or 15.5 per cent of GDP, representing an increase of 18.1
per cent over the level in the corresponding period of 2011. The rise was due to the
additional issuance of treasury bills and FGN Bonds to bridge the FGN's revenue shortfall
during the review period. At N3,824.81 billion or 62.2 per cent of the total, the banking
system remained the dominant holder of the total outstanding domestic debt
instruments.The total holdings of the non-bank public during the period stood at
N2,166.11 billion or 35.2 per cent, while the Sinking Fund accounted for the balance of
N161.95 billion or 2.6 per cent.
The Federal Government's stock of external debt at end-June 2012 was US$6.04 billion
(N950.61 billion) or 2.4 per cent of GDP. This represented an increase of 11.8 per cent from
the level at end-June 2011. Further analysis indicated that 82.0 per cent was owed to the
multilateral creditors, while the balance of 18.0 per cent went to non-Paris Club bilateral
and commercial debts.
The total debt service payment of the Federal Government in the first-half of 2012 stood
at N372.89 billion or 1.9 per cent of GDP. This represented an increase of 45.9 per cent
from the level recorded in the first-half of 2011. The breakdown showed that the domestic
CBN Half Year Economic Report for 2012
61

debt service was N348.90 billion or 93.6 per cent, while the external debt service
amounted toN23.99 billion (US$0.15 billion) or 6.4 per cent of total.
Figure 50Trends in Federal Government Debt Service, First Half 2007 - 2012
-
100.00
200.00
300.00
400.00
500.00
600.00
700.00
800.00
900.00
-
50.00
100.00
150.00
200.00
250.00
300.00
350.00
400.00
2007 2008 2009 2010 2011 2012
US$
Mill
ion
Nai
ra B
illio
n
Domestic External
At N348.90 billion, domestic debt service payment was 52.6 per cent above the level at
end-June2011. External debt service payments amounted to US$0.15 billion indicating a
decline of 13.8 per cent from the level in the corresponding period of 2011. A breakdown
of the external debt service payments showed that 41.9 per cent was paid to the
multilateral institutions, while 'other creditors' including Euro Bond accounted for the
balance of 58.1 per cent.
Provisional data from the National Bureau of Statistics (NBS) indicated that the Gross
Domestic Product (GDP) at 1990 constant basic prices grew by 6.4 per cent in the first half
of 2012, compared with 7.4 per cent recorded in the first half of 2011. The growth was
driven by the non-oil sector, which rose by 7.8 per cent. The oil sector fell by 1.3 per cent.
The growth in the non-oil GDP was largely driven by improved activities in agriculture and
services with respective growth rates of 4.1and 13.8 per cent. Wholesale and retail trade,
and building and construction and industry grew by 8.4, 12.9 and 0.1 per cent,
respectively. Services was the dominant sector in terms of contribution, with a relative
contribution of 2.8 per cent to the GDP growth. It was followed by, wholesale and retail
trade, agriculture, building and construction, with relative contributions of 1.7, 1.6, and
0.3 per cent, respectively. The low performance of the oil sector was largely as a result of
the fall in crude oil production.
4.3 Real Sector Developments
CBN Half Year Economic Report for 2012
62
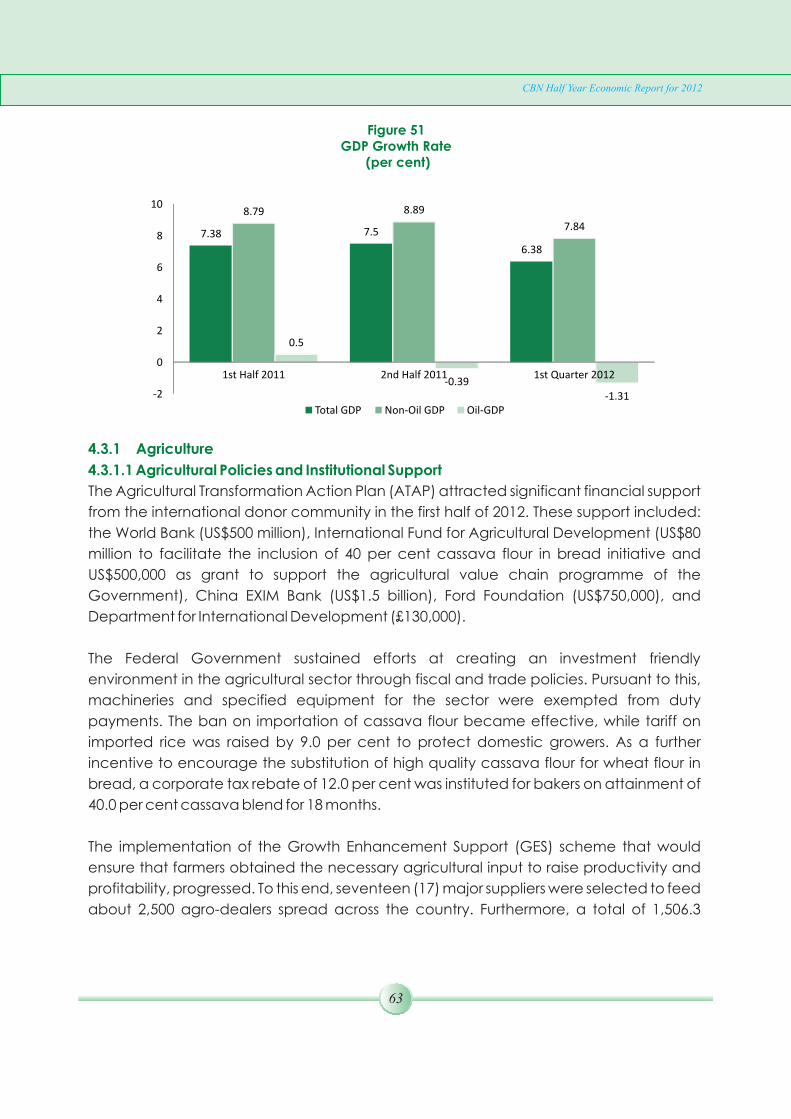
Figure 51GDP Growth Rate
(per cent)
7.38
7.5
6.38
8.79 8.89
7.84
0.5
-0.39
-1.31
-2
0
2
4
6
8
10
1st Half 2011 2nd Half 2011 1st Quarter 2012
Total GDP Non-Oil GDP Oil-GDP
4.3.1 Agriculture
4.3.1.1 Agricultural Policies and Institutional Support
The Agricultural Transformation Action Plan (ATAP) attracted significant financial support
from the international donor community in the first half of 2012. These support included:
the World Bank (US$500 million), International Fund for Agricultural Development (US$80
million to facilitate the inclusion of 40 per cent cassava flour in bread initiative and
US$500,000 as grant to support the agricultural value chain programme of the
Government), China EXIM Bank (US$1.5 billion), Ford Foundation (US$750,000), and
Department for International Development (£130,000).
The Federal Government sustained efforts at creating an investment friendly
environment in the agricultural sector through fiscal and trade policies. Pursuant to this,
machineries and specified equipment for the sector were exempted from duty
payments. The ban on importation of cassava flour became effective, while tariff on
imported rice was raised by 9.0 per cent to protect domestic growers. As a further
incentive to encourage the substitution of high quality cassava flour for wheat flour in
bread, a corporate tax rebate of 12.0 per cent was instituted for bakers on attainment of
40.0 per cent cassava blend for 18 months.
The implementation of the Growth Enhancement Support (GES) scheme that would
ensure that farmers obtained the necessary agricultural input to raise productivity and
profitability, progressed. To this end, seventeen (17) major suppliers were selected to feed
about 2,500 agro-dealers spread across the country. Furthermore, a total of 1,506.3
CBN Half Year Economic Report for 2012
63

tonnes of improved cotton seed were distributed through nine (9) ginneries in the cotton-
growing states of Katsina, Kano, Jigawa, Kebbi, Zamfara, Sokoto and Kaduna states.
The use of integrated mills as channels for seed distribution to rice farmer clusters around
the mills commenced. Thus far, about 385.5 tonnes of improved variety of rice seeds were
deposited with twelve large mills in Ebonyi, Taraba, Benue, Kano, Enugu, Cross River,
Nasarawa, Jigawa, Bauchi and Zamfara states for free distribution to outgrowers. Also,
eight (8) new high yielding fast maturing cocoa hybrids and four (4) high yielding
sorghum varieties were distributed to revolutionize the production of these commodities.
Furthermore, a national farmers' census aimed at producing a comprehensive database
of farmers in the country was carried out, and a total of 4,500,000 farmers have been
registered, thus far.
To promote the processing segment of the agricultural value chain, the government
facilitated the procurement and installation of eighteen (18) large scale industrial
processing plants with capacity of 1.3 million tonnes of high quality cassava flour.
Government also supported the establishment of three (3) new rice processing mills in
Ebonyi, Niger and Kebbi States with a combined capacity of 90,000 tonnes of milled rice.
Under the marketing component, government facilitated a two-year contract for the
supply of 1.1 million tonnes of cassava chips with export revenues of US$136.0 million
annually for Nigeria. In addition, government committed about N170 million to produce
about 800,000 50kg capacity cotton cloth bags for distribution to farmers through nine (9)
ginneries.
The growth in agricultural output observed in 2011 slowed marginally in the first half of
2012. At 250.7 (1990=100), the provisional aggregate index of agricultural production
increased by 4.1 per cent, compared with 5.6 per cent in the first half of 2011. All the sub-
sectors contributed to the observed growth. The output of staples and other crops
increased by 4.1 and 4.0 per cent, compared with 5.6 and 5.5 per cent, respectively, in
the corresponding period of 2011. The output of livestock, fisheries, and forestry rose by
6.1, 6.0, and 5.9 per cent, respectively, compared with their levels a year ago.
The development in agricultural production was attributed largely to good weather,
particularly the adequate and well-distributed rainfall across the country. The several
intervention measures of the government under the ATAP also boosted agricultural
production.
The prices of most of Nigeria's major agricultural export commodities at the London
4.3.1.2 Agricultural Production and Prices
CBN Half Year Economic Report for 2012
64
commodities market declined in the first half of 2012. Four of the six commodities
monitored, namely soya bean, cocoa, coffee and copra declined by 1.6, 28.0, 29.4 and
52.6 per cent, respectively. Consequently, at 331.2 (1990=100), the all-commodities price
index, in dollar terms, declined by 26.2 per cent below the level in the first half of 2011. The
price decline was as a result of reduced demand associated with the macroeconomic
uncertainties arising from the eurozone sovereign debt crises and the slower-than
expected growth in China and India. However, the indices of palm oil and cotton
increased by 1.9 and 25.4 per cent, respectively, due to supply shortages occasioned by
adverse weather condition in some producing countries.
The government in its bid to increase the contribution of manufacturing to gross domestic
product (GDP) and also create competitive advantage for Nigeria through industrial
productivity, launched the Industrial Revolution Plan in the first half of 2012. The plan
aimed at reviving and transforming the manufacturing sector to a virile and dynamic
sector, particularly in the areas that the country has comparative and competitive
advantages e.g. agro and agro-allied sub-sector and mining and non-metallic mineral
products sector. The strategy for the plan include development of industrial infrastructure
through dedicated power supply to industrial clusters among others; increase innovation
and development of appropriate technology, particularly developing green
technology for sustainable development; improvement in business environment through
rationalization and simplification of business registration; and development of skills
required to increase industrial productivity through the National Industrial Skills
Development Project.
Pursuant to the reforms in the power sector, the Federal Government signed Memoranda
of Understandings (MoUs) with several companies and countries to boost electricity
generation capacity. The MoUs included: generation of 10,000 megawatts of electricity
with a South Korean Company, Daewoo Engineering and Construction Company
Limited; Siemens of Germany for the provision of 10,000MW of power generation
infrastructure and the US Exim Bank to provide US$1.5 billion credit to the Nigerian power
sector. There was also an MOU with two French companies (Electricite de France, EDF
and Enterprise de Transporte et Distribution D'electricity, ETDE)) to expand the
transmission network for about US$200 million. The companies would undertake a
feasibility study for transmission upgrade, and thereafter, select and construct a high
voltage transmission line and sub-stations. In addition, the Federal Government awarded
the management of the Transmission Company of Nigeria to Manitoba Hydro
International, Canada for three years in the first instance.
4.3.2 Industry
4.3.2.1 Industrial Policy and Institutional Support
CBN Half Year Economic Report for 2012
65

The Multi-Year Tariff Order II (MYTO II) regime took off in June with electricity tariff
increasing by an average of 11.0 per cent. The new tariff structure was aimed at attaining
cost-effective pricing that would attract private sector investment in the generation,
distribution and transmission of power in the country.
Provisional data indicated improved performance in aggregate industrial output in the
first half of 2012. The index of industrial production, at 136.3 (1990=100), rose by 5.8 per
cent, compared with the level in the corresponding period of 2011. The increase in output
was attributed to all the sub-sectors with manufacturing, mining and electricity
consumption increasing by 7.3, 4.1, and 1.7 per cent, respectively.
4.3.2.2 Industrial Production
Figure 52Industrial Production Index, Half Year 2010 – 2012
(1990=100)
93
.5 96
.3 10
6.1 1
29
.8 14
3.4
14
6.3
20
5.8
20
0.4
20
6.3
12
1.0
12
7.6
13
6.3
0
50
100
150
200
250
First Half 2010 First 2011 First Half 2012
Manufacturing Mining Electricity Industry
4.3.2.3 Manufacturing
At 106.1 (1990=100), the estimated index of manufacturing production rose by 7.3 per
cent relative to the level in the corresponding period of 2011. The performance of the
manufacturing sub-sector during the review period was attributed largely to increased
aggregate demand. The average manufacturing capacity utilisation estimated at 57.0
per cent rose by 1.3 percentage points over the level attained in the corresponding
period of 2011. The performance of the manufacturing sub-sector continued to be
constrained by infrastructural deficiencies and cheap imports.
CBN Half Year Economic Report for 2012
66

Figure 53Average Manufacturing Capacity Utilisation, Half Year 2010 – 2012
(Per cent)
53.5
54.0
54.5
55.0
55.5
56.0
56.5
57.0
57.5
First Half 2010 First Half 2011 First Half 2012
4.3.3 Crude Oil
4.3.3.1 Crude Oil Production
Nigeria's estimated total crude oil production, including condensates and natural gas
averaged 2.09 mbd or 382.47 million barrels in the first half of 2012, representing a decline
of 2.34 per cent below the average of 2.14 mbd or 389.48 million barrels recorded in the
first half of 2011. The development was attributed to the increased vandalism of oil
pipelines and crude oil theft in the Niger Delta region. Aggregate crude oil export for the
period under review was estimated at 1.64 mbd or 300.12 million barrels, compared with
1.69 mbd or 307.58 million barrels recorded in the corresponding half of 2011.
Figure 54Crude Oil Production and Exports
0
0.5
1
1.5
2
2.5
First Half 2011 Second Half 2011 First Half 2012
Mill
ion
bar
rels
pe
r d
ay
Output Exports Domestic Consumption
CBN Half Year Economic Report for 2012
67
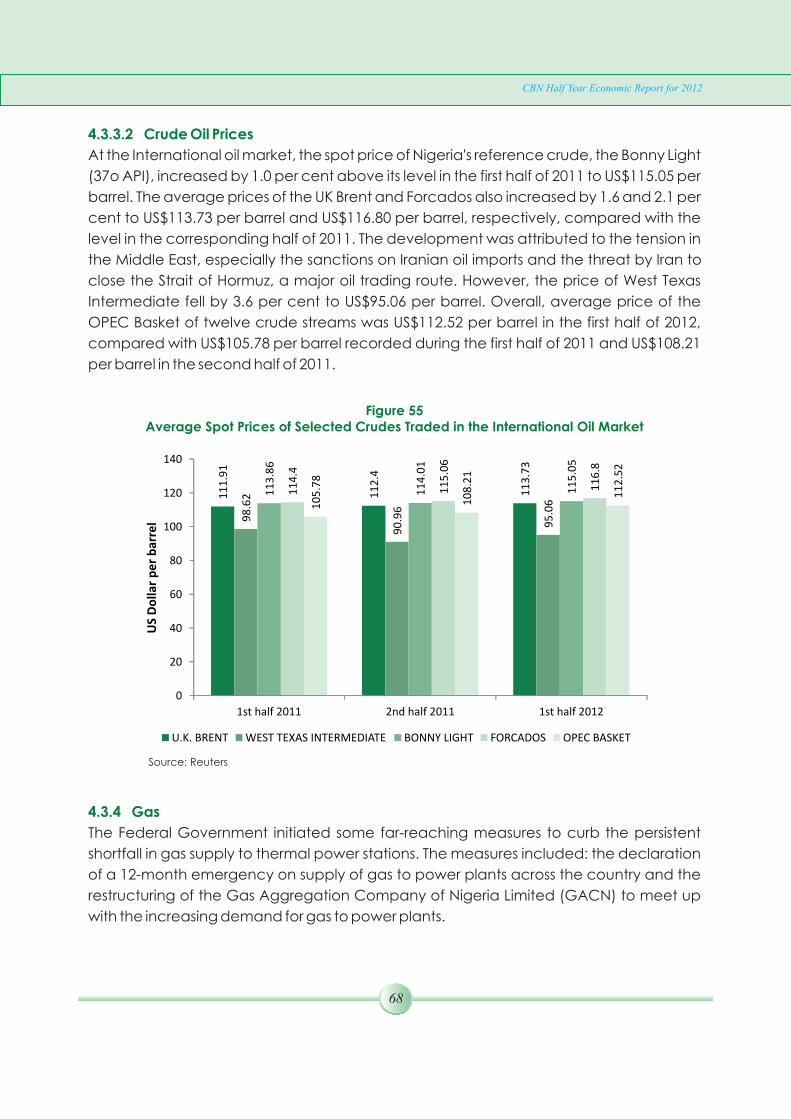
4.3.3.2 Crude Oil Prices
At the International oil market, the spot price of Nigeria's reference crude, the Bonny Light
(37o API), increased by 1.0 per cent above its level in the first half of 2011 to US$115.05 per
barrel. The average prices of the UK Brent and Forcados also increased by 1.6 and 2.1 per
cent to US$113.73 per barrel and US$116.80 per barrel, respectively, compared with the
level in the corresponding half of 2011. The development was attributed to the tension in
the Middle East, especially the sanctions on Iranian oil imports and the threat by Iran to
close the Strait of Hormuz, a major oil trading route. However, the price of West Texas
Intermediate fell by 3.6 per cent to US$95.06 per barrel. Overall, average price of the
OPEC Basket of twelve crude streams was US$112.52 per barrel in the first half of 2012,
compared with US$105.78 per barrel recorded during the first half of 2011 and US$108.21
per barrel in the second half of 2011.
Figure 55Average Spot Prices of Selected Crudes Traded in the International Oil Market
11
1.9
1
11
2.4
11
3.7
3
98
.62
90
.96
95
.06
11
3.8
6
11
4.0
1
11
5.0
5
11
4.4
11
5.0
6
11
6.8
10
5.7
8
10
8.2
1
11
2.5
2
0
20
40
60
80
100
120
140
1st half 2011 2nd half 2011 1st half 2012
US
Do
llar
pe
r b
arre
l
U.K. BRENT WEST TEXAS INTERMEDIATE BONNY LIGHT FORCADOS OPEC BASKET
Source: Reuters
4.3.4 Gas
The Federal Government initiated some far-reaching measures to curb the persistent
shortfall in gas supply to thermal power stations. The measures included: the declaration
of a 12-month emergency on supply of gas to power plants across the country and the
restructuring of the Gas Aggregation Company of Nigeria Limited (GACN) to meet up
with the increasing demand for gas to power plants.
CBN Half Year Economic Report for 2012
68

Total associated gas produced during the review period was estimated at 34.10 million
cubic metres (MMm3), indicating an increase of 24.82 per cent over the level in the
corresponding period of 2011. Total volume of gas utilized was 28.08 MMm3, while total
gas flared was estimated at 6.02 MMm3, indicating a decrease of 7.38 per cent from the
level in the first half of 2011.
Figure 56Gas Production and Utilisation
27.32
36.0 34.1
20.82
29.24 28.08
6.50
6.74
6.02
0
5
10
15
20
25
30
35
40
1st HALF 2011 2nd HALF 2011 1st HALF 2012
Mill
ion
Cu
bic
Met
ers
Gas Produced Gas Utilised Gas Flared
4.3.5 Petroleum Products
4.3.6 Solid Minerals
The estimated quantity of petroleum products distributed during the review period by the
major and independent marketing companies was put at 3,288.10 million litres made up
of 2,467.15 million litres of premium motor spirit (PMS), 366.69 million litres of household
kerosene (HHK) or dual purpose kerosene (DPK) and 454,26 million litres of automotive gas
oil (AGO).
Provisional data from the Federal Ministry of Mines and Steel Development showed that
solid minerals production increased by 27.8 per cent to 12.9 million tonnes in the first half
of 2012 relative to the level in the corresponding period of 2011. Increased output of some
principal minerals such as marble aggregates, limestone, clay, shale, columbite and iron
ore accounted for the growth.
CBN Half Year Economic Report for 2012
69
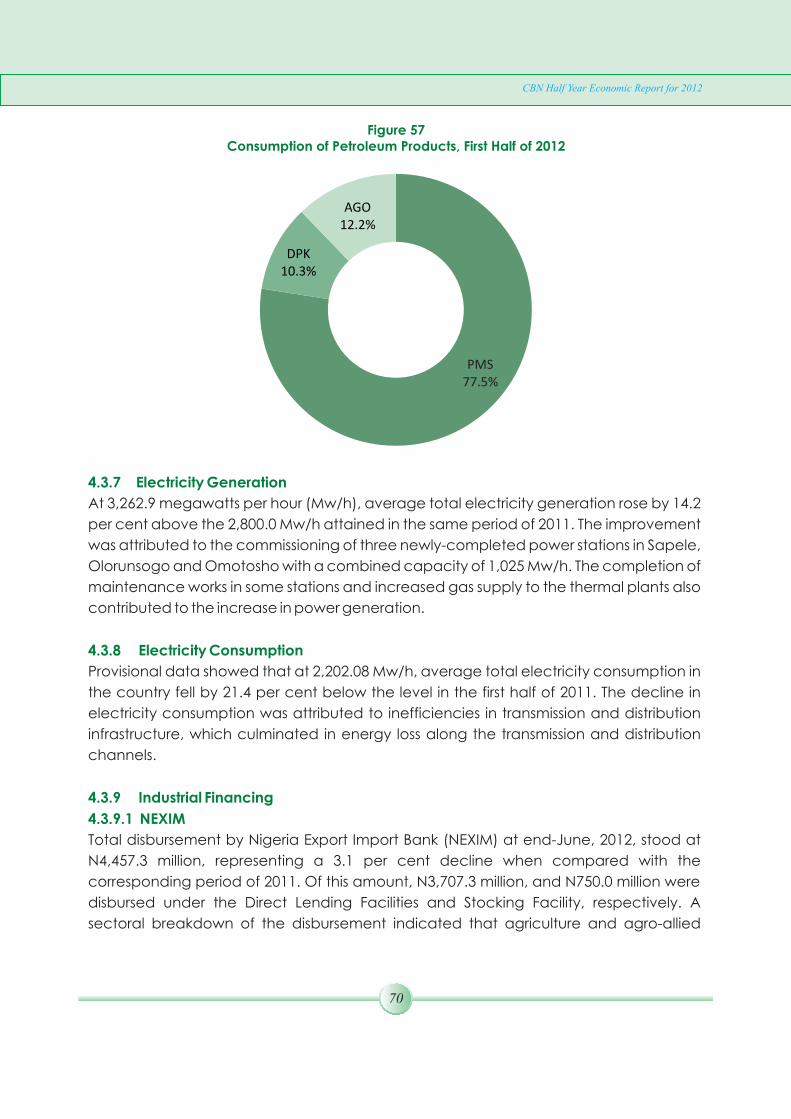
Figure 57Consumption of Petroleum Products, First Half of 2012
PMS 77.5%
DPK 10.3%
AGO 12.2%
4.3.7 Electricity Generation
4.3.8 Electricity Consumption
4.3.9 Industrial Financing
4.3.9.1 NEXIM
At 3,262.9 megawatts per hour (Mw/h), average total electricity generation rose by 14.2
per cent above the 2,800.0 Mw/h attained in the same period of 2011. The improvement
was attributed to the commissioning of three newly-completed power stations in Sapele,
Olorunsogo and Omotosho with a combined capacity of 1,025 Mw/h. The completion of
maintenance works in some stations and increased gas supply to the thermal plants also
contributed to the increase in power generation.
Provisional data showed that at 2,202.08 Mw/h, average total electricity consumption in
the country fell by 21.4 per cent below the level in the first half of 2011. The decline in
electricity consumption was attributed to inefficiencies in transmission and distribution
infrastructure, which culminated in energy loss along the transmission and distribution
channels.
Total disbursement by Nigeria Export Import Bank (NEXIM) at end-June, 2012, stood at
N4,457.3 million, representing a 3.1 per cent decline when compared with the
corresponding period of 2011. Of this amount, N3,707.3 million, and N750.0 million were
disbursed under the Direct Lending Facilities and Stocking Facility, respectively. A
sectoral breakdown of the disbursement indicated that agriculture and agro-allied
CBN Half Year Economic Report for 2012
70
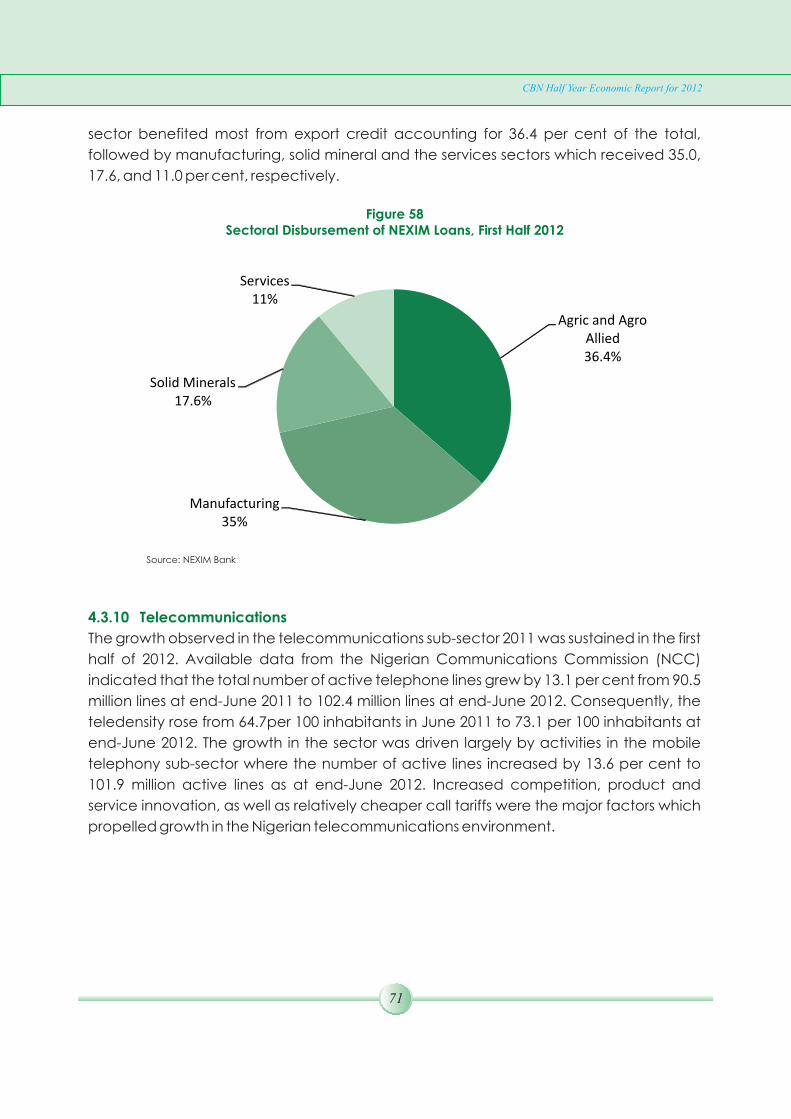
sector benefited most from export credit accounting for 36.4 per cent of the total,
followed by manufacturing, solid mineral and the services sectors which received 35.0,
17.6, and 11.0 per cent, respectively.
Figure 58Sectoral Disbursement of NEXIM Loans, First Half 2012
Agric and Agro Allied
36.4%
Manufacturing
35%
Solid Minerals 17.6%
Services 11%
Source: NEXIM Bank
4.3.10 Telecommunications
The growth observed in the telecommunications sub-sector 2011 was sustained in the first
half of 2012. Available data from the Nigerian Communications Commission (NCC)
indicated that the total number of active telephone lines grew by 13.1 per cent from 90.5
million lines at end-June 2011 to 102.4 million lines at end-June 2012. Consequently, the
teledensity rose from 64.7per 100 inhabitants in June 2011 to 73.1 per 100 inhabitants at
end-June 2012. The growth in the sector was driven largely by activities in the mobile
telephony sub-sector where the number of active lines increased by 13.6 per cent to
101.9 million active lines as at end-June 2012. Increased competition, product and
service innovation, as well as relatively cheaper call tariffs were the major factors which
propelled growth in the Nigerian telecommunications environment.
CBN Half Year Economic Report for 2012
71

Figure 59Total Connected Lines and Teledensity
1.44
1.48
1.21
1.05
0.88
0.72
0.51
66.42
73.10
78.65
87.30
89.65
95.17
101.8648.47
53.23
57.04
63.11
64.67
68.49 73.10
0
10
20
30
40
50
60
70
80
0.00
20.00
40.00
60.00
80.00
100.00
120.00
Jun. '09 Dec. '09 June. '10 Dec. '10 June '11 Dec. '11 Jun '12
Tele
de
nsi
ty (
pe
r 1
00
In
hab
itan
ts)
No
. of
Act
ive
Lin
es
(Mill
ion
s)
Fixed Mobile Teledensity
4.3.11 Consumer Prices
The increase in the general price level which persisted through the first and second halves
of 2011, continued in the first half of 2012. The all-items composite Consumer Price Index
(CPI) stood at 135.3 (November 2009 = 100) at end-June 2012, compared with 119.9 and
126.0 at end-June and end-December 2011, respectively. The all-items less Farm Produce
CPI stood at 138.0 at end-June 2012, compared with 119.8 and 124.8 at end-June and
end-December 2011, respectively, while Food Index stood at 134.5 at end-June 2012 in
comparison with 120.1 at end-June 2011 and 128.1 at end-December 2011.
Figure 60Consumer Price Indices(November 2009 = 100)
0
20
40
60
80
100
120
140
160
1st Half 2010 2nd Half 2010 1st Half 2011 2nd Half 2011 1st Half 2012
CP
I
Composite Core Food
CBN Half Year Economic Report for 2012
72
4.3.11.1 Headline Inflation
4.3.11.2 Core Inflation
4.3.11.3 Food Inflation
4.3.11.4 Urban and Rural Consumer Price Indices and Inflation Rates
The year-on-year headline inflation (Composite CPI, All-Items) fluctuated in the first half of
2012 and stood at 12.9 per cent by end-June 2012, compared with 10.2 and 10.3 per cent
at end-June and end-December 2011, respectively. However, the 12-month moving
average inflation rate in the first half of 2012, trended downwards to 11.3 per cent from
12.3 per cent at end-June 2011. The increase in headline inflation was attributed to the
acceleration in food inflation and the impact of the partial removal of fuel subsidy on the
prices of goods and services.
The core inflation, that is, all items less farm produce, on a year-on-year basis, also
fluctuated in the first half of 2012 and stood at 15.2 per cent by end-June 2012, compared
with 11.5 and 10.8 per cent at end-June and end-December 2011, respectively. On a 12-
month moving average basis, core inflation was 12.7 per cent at end-June 2012,
compared with 12.1 per cent at end-June 2011 and 11.7 per cent at end-December
2011. The rise in core inflation in the review period was accounted largely by the effect of
the partial removal of subsidy on the pump price of Premium Motor Spirit (PMS) on the
prices of non-food components of the consumer price index.
Food inflation(Farm Produce + Processed Food) on year-on-year basis exhibited the
same trend as the headline inflation in the review period. It stood at 12.0 per cent by end-
June 2012, compared with 9.2 and 11.0 per cent at end-June and end-December 2011,
respectively. Food inflation on a 12-month moving average basis stood at 10.6 per cent
at end-June 2012 in comparison with 12.7 and 10.3 per cent, respectively, at end-June
and end-December 2011. The rise in food inflation was attributed largely to the slower
growth in output of staples and the impact of the partial removal of fuel subsidy on the
prices of goods and services.
The all-item Urban CPI at end-June 2012 stood at 134.1, compared with 116.6 and 122.3 at
end-June and end-December 2011, respectively, thus posting a double digit inflation
rate (year-on-year) of 15.0 per cent, at the end of the first half of 2012, compared with
single digit inflation rates of 8.3 and 9.0 per cent in the corresponding period of 2011 and
second half of 2011, respectively. Similarly, the all-item Rural CPI trended upwards, from
122.6 and 129.0 at end-June and end-December 2011, respectively, to 136.5 at the end
of June 2012, culminating in an inflation rate of 11.4 per cent, compared with respective
11.8 and 11.3 percent at end-June and end-December 2011. Unlike in the past when rural
headline inflation was consistently higher than its urban counterpart, the reverse has
CBN Half Year Economic Report for 2012
73
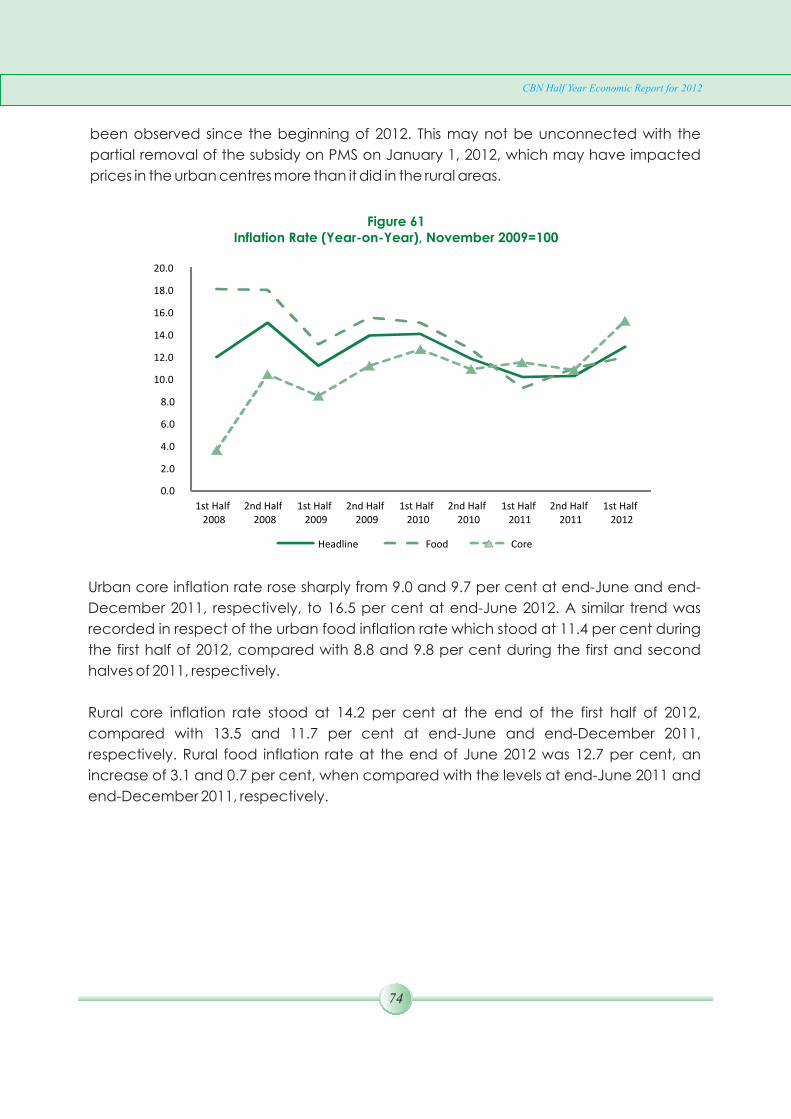
Figure 61Inflation Rate (Year-on-Year), November 2009=100
0.0
2.0
4.0
6.0
8.0
10.0
12.0
14.0
16.0
18.0
20.0
1st Half2008
2nd Half2008
1st Half2009
2nd Half2009
1st Half2010
2nd Half2010
1st Half2011
2nd Half2011
1st Half2012
Headline Food Core
Urban core inflation rate rose sharply from 9.0 and 9.7 per cent at end-June and end-
December 2011, respectively, to 16.5 per cent at end-June 2012. A similar trend was
recorded in respect of the urban food inflation rate which stood at 11.4 per cent during
the first half of 2012, compared with 8.8 and 9.8 per cent during the first and second
halves of 2011, respectively.
Rural core inflation rate stood at 14.2 per cent at the end of the first half of 2012,
compared with 13.5 and 11.7 per cent at end-June and end-December 2011,
respectively. Rural food inflation rate at the end of June 2012 was 12.7 per cent, an
increase of 3.1 and 0.7 per cent, when compared with the levels at end-June 2011 and
end-December 2011, respectively.
been observed since the beginning of 2012. This may not be unconnected with the
partial removal of the subsidy on PMS on January 1, 2012, which may have impacted
prices in the urban centres more than it did in the rural areas.
CBN Half Year Economic Report for 2012
74
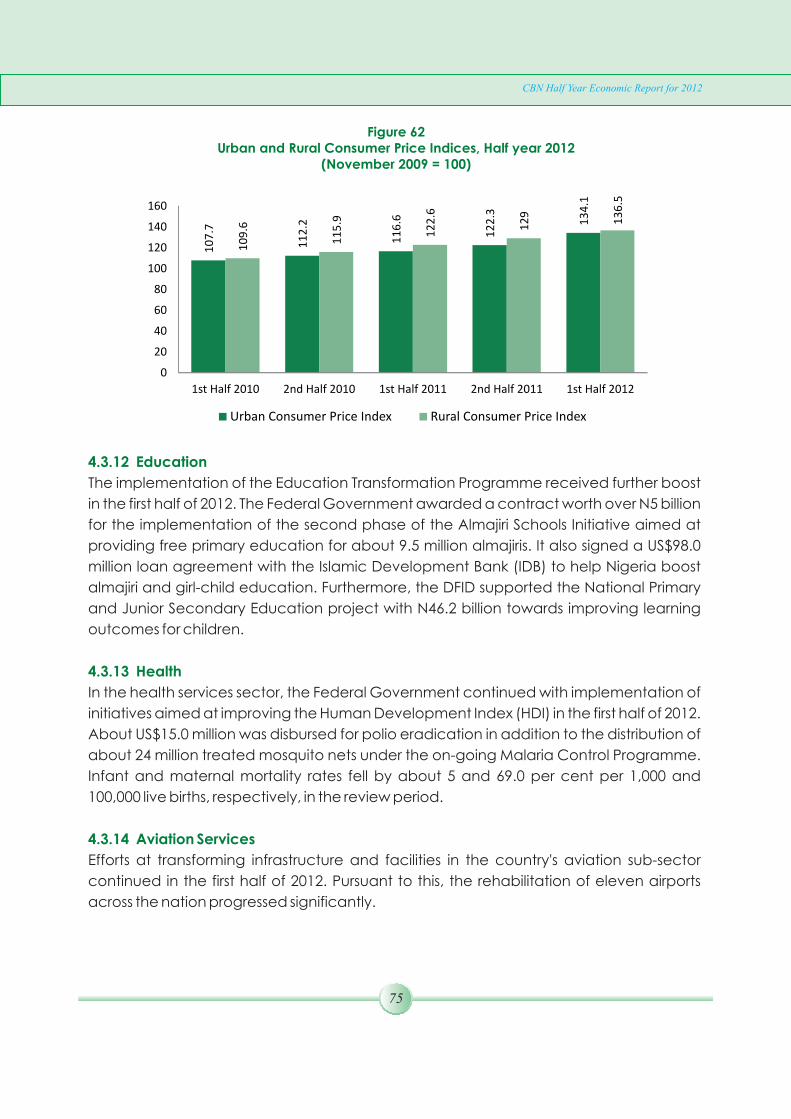
Figure 62Urban and Rural Consumer Price Indices, Half year 2012
(November 2009 = 100)
10
7.7
11
2.2
11
6.6
12
2.3 13
4.1
10
9.6
11
5.9
12
2.6 1
29
13
6.5
0
20
40
60
80
100
120
140
160
1st Half 2010 2nd Half 2010 1st Half 2011 2nd Half 2011 1st Half 2012
Urban Consumer Price Index Rural Consumer Price Index
4.3.12 Education
4.3.13 Health
4.3.14 Aviation Services
The implementation of the Education Transformation Programme received further boost
in the first half of 2012. The Federal Government awarded a contract worth over N5 billion
for the implementation of the second phase of the Almajiri Schools Initiative aimed at
providing free primary education for about 9.5 million almajiris. It also signed a US$98.0
million loan agreement with the Islamic Development Bank (IDB) to help Nigeria boost
almajiri and girl-child education. Furthermore, the DFID supported the National Primary
and Junior Secondary Education project with N46.2 billion towards improving learning
outcomes for children.
In the health services sector, the Federal Government continued with implementation of
initiatives aimed at improving the Human Development Index (HDI) in the first half of 2012.
About US$15.0 million was disbursed for polio eradication in addition to the distribution of
about 24 million treated mosquito nets under the on-going Malaria Control Programme.
Infant and maternal mortality rates fell by about 5 and 69.0 per cent per 1,000 and
100,000 live births, respectively, in the review period.
Efforts at transforming infrastructure and facilities in the country's aviation sub-sector
continued in the first half of 2012. Pursuant to this, the rehabilitation of eleven airports
across the nation progressed significantly.
CBN Half Year Economic Report for 2012
75
The first half of 2012 also witnessed a significant development with the transition from
terrestrial air navigation to satellite based air navigation system – Performance Based
Navigation (PBN). The operation of the new system, which was endorsed by the
International Civil Aviation Organization (ICAO), will save cost for the airlines as they
would burn less fuel during take-off and landing, reduce carbon dioxide emission and air
traffic controllers' workload. The new system will also allow pilots to experience more
situational awareness, closer flight separation procedures, and continuous descent
landings, all of which will enhance operational safety.
The operations of airlines on both domestic and international routes witnessed
improvements in the first half of 2012. The number of passengers airlifted both locally and
internationally stood at 4.41 million as at April 2012, with 78,982 aircraft movements.
Provisional data indicated that vehicular and container traffic at the ports increased
marginally in the first half of 2012. Container throughput stood at 83,044 Twenty-foot
Equivalent Units (TEUs) at end-May 2012, representing a 9.4 per cent increase over the
75,875 TEUs recorded in the corresponding period of 2011. Empty container throughput
stood at 56,923 TEUs, indicating a rise of 13.5 per cent over the corresponding period of
2011. Also, vehicular traffic in May 2012 stood at 23,445 units, a growth of 0.6 per cent over
23,305 units in May 2011.
A total of 452,355 metric tons of various commodities valuedatN83.1 billion, were
exported through the Apapa Port in the first half of 2012. In addition, diversification of
maritime services by the Federal Government continued with the construction of a
number of inland water ports, including the Onitsha River Port, Baro Port, the Oguta Port
and Yamata Port in Anambra, Niger, Imo and Kogi States, respectively.
The performance of the external sector improved in the first half of 2012 with an estimated
overall balance of payments surplus of N438.93 billion or 2.3 per cent of gross domestic
product (GDP) compared with a deficit of N86.10 billion in the first half of 2011. The current
account recorded an estimated surplus of N1,468.22 billion or 7.7 per cent of GDP owing
largely to the sustained high crude oil price, which rose from an average price of
US$113.86 per barrel in the first half of 2011 to US$115.05. The estimated capital and
financial account deficit widened from N364.21 billion or 2.0 per cent of GDP in the first
half of 2011 to N432.58 billion or 2.3 per cent of GDP. The level of external debt stock
stood at US$6.04 billion compared with US$5.40 billion in the first half of 2011 and
4.3.14.1 Domestic and International Operations
4.3.15 Maritime Services
4.4. External Sector Developments
CBN Half Year Economic Report for 2012
76

remained sustainable. The stock of external reserves increased by US$2.8 billion to
US$35.4 billion at end-June 2012 relative to end-June 2011 and could finance 7.6 months
of current imports commitments. The foreign exchange market remained stable as the
market premium between the official and bureau de change (BDC) rates was within the
threshold of 5.0 per cent. The external sector viability during the first half of 2012 continued
to be challenged by the rising external debt and the slow pace of economic
diversification.
Total trade (value of exports and imports) for the first half of 2012 grew by 3.4 per cent and
represented 60.5 per cent of GDP, compared with the corresponding period of 2011.
Aggregate exports, at N7,429.8 billion, grew by 3.2 per cent (representing 38.1 per cent of
GDP), reflecting the substantial earnings from crude oil exports driven largely by the
sustained upsurge in global crude oil prices. The dominance of oil sector exports
continued as it accounted for 96.7 per cent of total exports, while non-oil exports
accounted for the balance.
4.4.1 Current Account
4.4.1.1 Trade
Figure 63Exports, Imports and Trade Balance
(Naira Billion)
7
,20
0.7
5
7,0
33
.42
7,4
29
.84
4,2
16
.37
5,2
68
.06
4,3
73
.02
-
1,000.00
2,000.00
3,000.00
4,000.00
5,000.00
6,000.00
7,000.00
8,000.00
1st Half 2011 2nd Half 2011 1st Half 2012
Exports Imports Trade Balance
A breakdown of the non-oil exports by product showed that agricultural produce,
semi-manufactured goods, manufactured goods, “others” and solid minerals
accounted for 54.1, 29.8, 12.2, 3.3 and 0.6 per cent, respectively.
CBN Half Year Economic Report for 2012
77

Figure 64Non-Oil Exports by Products, First Half 2012
(per cent)
Agricultural Produce
54.1%
Semi-Manufactured
29.8%
Manufactured 12.2%
Minerals
0.6%
Others
3.3%
At N4,373.02 billion, estimated aggregate imports fell by 17.0 per cent, compared with
the second half of 2011 and represented 22.4 per cent of GDP. The share of non-oil
imports constituted 68.1 per cent of the total, while oil sector imports accounted for 31.9
per cent. The sectoral breakdown of non-oil imports during the period revealed that,
finished goods (food and manufactured products) accounted for 50.1per cent, industrial
sector 37.1 per cent, transport sector 9.2 per cent, while “Others” accounted for 3.7 per
cent of the total.
Figure 65Non-Oil Imports by Sectors, First Half 2012
(per cent)
Finished goods
50.0%
Industrial 37.1%
Transport 9.2%
Others
3.7%
CBN Half Year Economic Report for 2012
78

4.4.1.2 Services
The deficit in the services account (net) narrowed by 24.4 per cent from N1,926.21 billion
in the second half of 2011 to N1,455.84 billion. The deficit position equivalent to 7.4 per
cent of GDP, was driven largely by out-payments in respect of transportation (N630.96
billion), travels (N567.74 billion), other business services (N246.71 billion) as well as
government services (N93.87 billion).
Figure 66Share of Services Out-Payments, First Half 2012
(per cent)
Transport 37.2%
Travel
33.5%
Other Bussiness 14.5%
Government
5.5%
Others 9.3%
4.4.1.3 Income
4.4.1.4 Current Transfers
The deficit in the income account (net) widened by 2.3 per cent and represented 9.2 per
cent of GDP as against 9.9 per cent in the corresponding period in 2011. This
development was due to the increased out-payments on dividends and distributed
branch profits.
The current transfers (net) declined by 5.0 and 1.9 per cent when compared with the
second half of 2011 and the corresponding period of 2011, respectively. Inward transfers,
which mirrored movements in personal home remittances by non-resident Nigerians
declined by 2.3 per cent from US$10.1billion in the corresponding period in 2011 to US$9.8
billion, reflecting the continued fragility of the global economy. General government
transfers, which included expenses on foreign embassies, payments to international
organizations as well as the remittances of foreigners resident in the country, declined
marginally by 0.9 per cent when compared with the first half of 2011.
CBN Half Year Economic Report for 2012
79
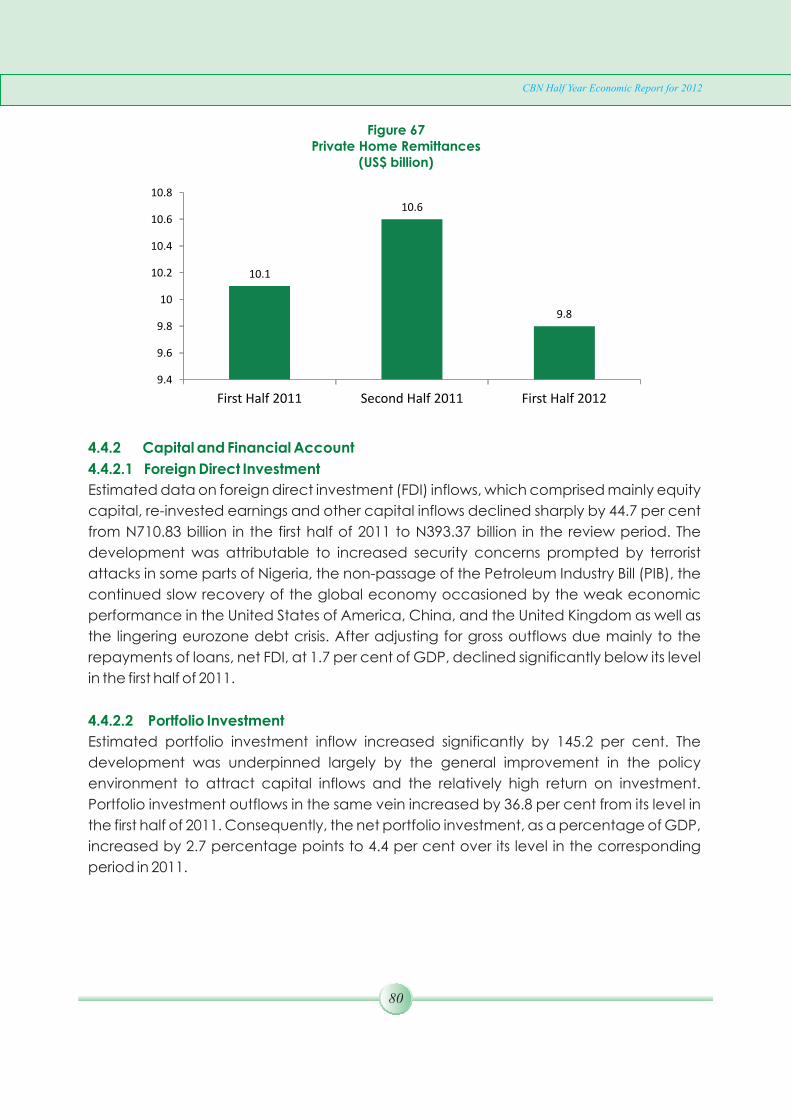
Figure 67Private Home Remittances
(US$ billion)
10.1
10.6
9.8
9.4
9.6
9.8
10
10.2
10.4
10.6
10.8
First Half 2011 Second Half 2011 First Half 2012
4.4.2 Capital and Financial Account
4.4.2.1 Foreign Direct Investment
4.4.2.2 Portfolio Investment
Estimated data on foreign direct investment (FDI) inflows, which comprised mainly equity
capital, re-invested earnings and other capital inflows declined sharply by 44.7 per cent
from N710.83 billion in the first half of 2011 to N393.37 billion in the review period. The
development was attributable to increased security concerns prompted by terrorist
attacks in some parts of Nigeria, the non-passage of the Petroleum Industry Bill (PIB), the
continued slow recovery of the global economy occasioned by the weak economic
performance in the United States of America, China, and the United Kingdom as well as
the lingering eurozone debt crisis. After adjusting for gross outflows due mainly to the
repayments of loans, net FDI, at 1.7 per cent of GDP, declined significantly below its level
in the first half of 2011.
Estimated portfolio investment inflow increased significantly by 145.2 per cent. The
development was underpinned largely by the general improvement in the policy
environment to attract capital inflows and the relatively high return on investment.
Portfolio investment outflows in the same vein increased by 36.8 per cent from its level in
the first half of 2011. Consequently, the net portfolio investment, as a percentage of GDP,
increased by 2.7 percentage points to 4.4 per cent over its level in the corresponding
period in 2011.
CBN Half Year Economic Report for 2012
80

Figure 68Net FDI and Portfolio Investment Flows
(per cent of GDP)
3.6 2.9
1.7
1.7 1.2
4.4
0.0
1.0
2.0
3.0
4.0
5.0
6.0
1st Half 2011 2nd Half 2011 1st Half 2012
FDI % of GDP PI % of GDP
4.4.3 Capital Importation by Sector
New capital imported into the economy as captured by the DMBs database amounted
to US$6.4 billion in the first half of 2012. Analysis of the new capital imports by sectors
showed that the capital market (shares) accounted for the bulk with a share of 72.4 per
cent, while the banking sector and “Other” sectors accounted for 14.8 and 12.8 per cent,
respectively.
Figure 69Capital Importation by Sector, First Half 2012
(per cent of GDP)
Shares
72.4%
Banking
14.8%
Others 12.8%
4.4.4 Reserve Assets
The stock of external reserves at end-June 2012 stood at US$35.41 billion, compared with
US$31.89 billion and US$32.64 billion in the corresponding period of 2011 and end-
December 2011, respectively. The observed accretion to reserves during the first half of
2012 was due mainly to increased receipts from crude oil and gas exports as well as
CBN Half Year Economic Report for 2012
81

royalties paid by oil companies. The price of Bonny Light rose from US$113.69 per barrel in
January 2012 to US$120.38 per barrel in February and peaked at US$128.79 per barrel in
March 2012.
Following a downturn in the oil market, prices fell consistently from its peak in March to
US$122.45, US$111.56 and US$93.94 per barrel in April, May and June 2012, respectively.
This resulted in the depletion of the external reserves to US$35.41 billion at end-June 2012.
Besides, the fall in oil prices, the funding of the wDas-spot and BDC segments to maintain
exchange rate stability contributed to the depletion of the external reserves.
A total of US$0.09 billion was earned on the external reserves portfolio from January to
June 2012, showing a decline of 20.8 per cent when compared with the corresponding
period of 2011.
Analysis of currencies composition of the external reserves at end-June 2012 showed that
the US dollar remained the major currency and accounted for 82.2 per cent of the total.
Standard Drawing Rights (SDR) and the euro constituted 7.2 and 6.9 per cent,
respectively. The British pounds and the Chinese yuan constituted 2.2 and 1.4 per cent of
the total, respectively, while other reserves currencies comprised Japanese yen and
Swiss franc and constituted 0.2 per cent of the total.
A breakdown by composition of the external reserves at end-June showed that
federation reserves was US$6.56 billion (18.5%), Federal Government reserves, US$2.99
billion (8.5%); and the CBN reserves US$25.86 billion (73.0%) of total. The reserves could
finance 7.6 months of import cover.
Figure 70External Reserves Stock
(US$ Billion)
31.89
32.64
35.41
6.9
5.7
7.6
0
1
2
3
4
5
6
7
8
30.00
31.00
32.00
33.00
34.00
35.00
36.00
1st Half 2011 2nd Half 2011 1st Half 2012
External Reserves Months of Import Cover
CBN Half Year Economic Report for 2012
82
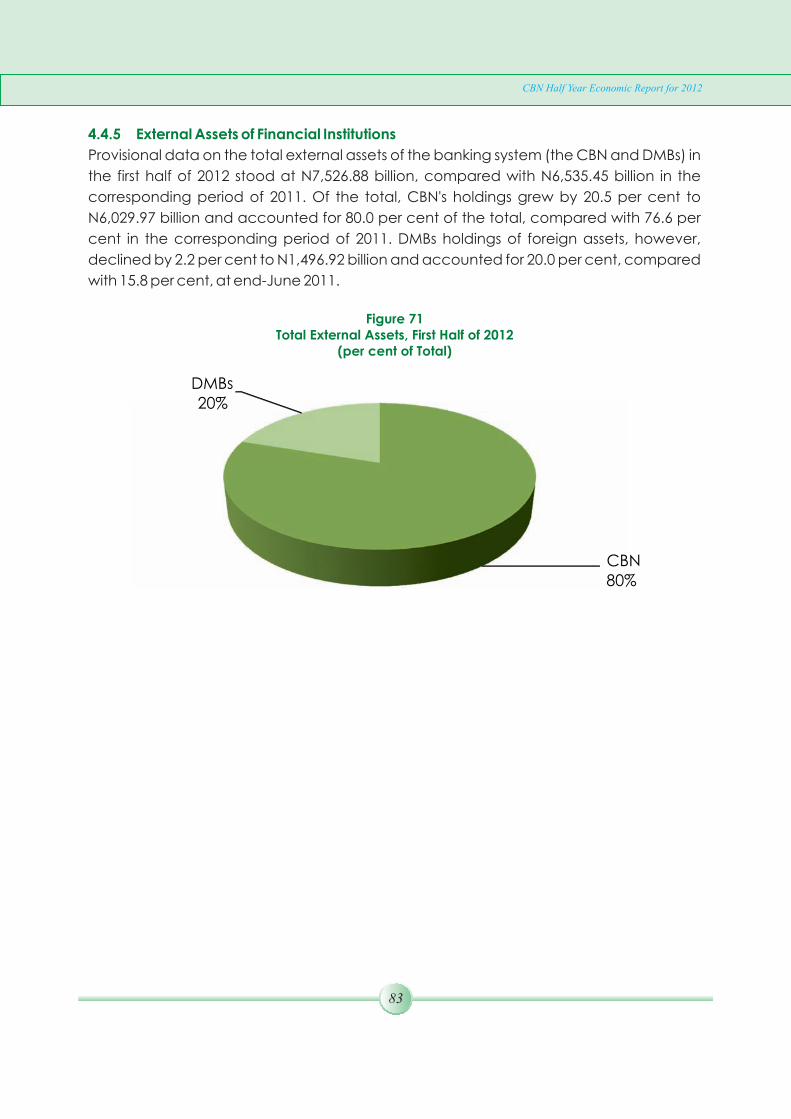
4.4.5 External Assets of Financial Institutions
Provisional data on the total external assets of the banking system (the CBN and DMBs) in
the first half of 2012 stood at N7,526.88 billion, compared with N6,535.45 billion in the
corresponding period of 2011. Of the total, CBN's holdings grew by 20.5 per cent to
N6,029.97 billion and accounted for 80.0 per cent of the total, compared with 76.6 per
cent in the corresponding period of 2011. DMBs holdings of foreign assets, however,
declined by 2.2 per cent to N1,496.92 billion and accounted for 20.0 per cent, compared
with 15.8 per cent, at end-June 2011.
Figure 71Total External Assets, First Half of 2012
(per cent of Total)
CBN 80%
DMBs 20%
CBN Half Year Economic Report for 2012
83
5.0 INTERNATIONAL ECONOMIC RELATIONS
5.1 Regional Institutions
5.1.1 African Development Bank (AfDB) Annual Meetings
5.1.2 African Union (AU) Meetings
5.1.3 Association of African Central Banks (AACB)
The Annual Meetings of the Board of Governors of the African Development Bank Group
(AfDB) was held in Arusha, Tanzania from May 26 to June 1, 2012. The Board identified,
among others, low access to finance as a major bottleneck to growth. In that regard, the
Board launched a market-friendly guarantee scheme, the African Guarantee Fund
(AGF) to provide financial guarantees to financial institutions to encourage the financing
of SMEs and ease youth unemployment. Funding of the AGF would be provided by the
AfDB in partnership with the governments of Denmark and Spain.
In order to enter into cross-currency swap transactions aimed at facilitating local
currency lending and bond issuance in Africa, the IFC signed an International Swaps and
Derivatives Association (ISDA) Master Agreement. The purpose of ISDA is to enable the
IFC and the AfDB to collaborate and enhance their local currency funding capacity for
development projects, provision of long-term local currency finance for projects, hedge
against foreign exchange risks and accelerate local capital market development.
The 18th African Union (AU) Heads of State and Government Summit was held from
January 29 to 30, 2012 in Addis Ababa, Ethiopia. The Summit discussed the theme,
“Boosting Intra-African Trade”. The AU Heads of State and Government agreed to:
· Set up an ad-hoc committee to examine the issues that will facilitate election into
vacant positions at the AU Commission at the next AU Summit scheduled for June
2012. This was against the backdrop that none of the candidates for the chair
received two-thirds of the votes as stipulated in the AU constitution;
· Extend the mandate of the present Commission until the next AU Summit; and
· Establish a continental free trade area by 2017, in order to promote the economic
development and integration of the continent.
The 36th Meeting of the Bureau of the Association of African Central Banks (AACB) was
held on February 29, 2012 at the Central Bank of Nigeria, Abuja, Nigeria. The Bureau
noted the signs of economic recovery in some AACB's member countries. It, however,
observed some deterioration in the economic performances under the African
Monetary Corporation Programme (AMCP) primary convergence criteria due to the
CBN Half Year Economic Report for 2012
84
impact of the global financial crisis on the economies in the region. Consequently, the
Bureau encouraged member states to intensify efforts aimed at improving their
macroeconomic indicators.
The AACB held its 2012 Continental Seminar in Douala, Cameroun, during May 7 – 9, 2012
on the theme, “Design and Implementation of Macro-Prudential Policy Instruments in
Africa”. Key recommendations were to:
· Encourage the establishment of a Financial Stability Board in each country on the
continent and strengthen the supervision of systemic institutions based on local
peculiarities;
· Establish efficient high-frequency data collection mechanisms to facilitate
supervision on a broad range of the financial sector, businesses and households;
and
· Develop macro-prudential policy instruments according to the temporal or cross-
cutting nature of systemic risk and strengthen interactions in the formulation of
monetary policy.
The ECOWAS-WAMI Joint Task Force on Mechanisms to Boost Regional Trade agreed on
a template for studies intended at improving the implementation of the ECOWAS Trade
Liberalization Scheme (ETLS). The studies encompass the capacity of Member States to
implement trade integration obligations; the benefits and costs of implementing the ETLS;
and a sanction regime against Member States, which default in their obligations under
trade instruments. The studies will enable ECOWAS and WAMI to prepare a position
paper on trade in services in the region for Ministers of Trade of the West African Monetary
Zone (WAMZ), ahead of the next Doha Round of negotiations.
The ECOWAS Commission and the West African Insurance Companies Association
(WAICA) held a workshop in Abuja during May 22 – 23, 2012 to validate a feasibility study
for the establishment of an ECOWAS Investment Guarantee/Reinsurance Agency. The
meeting observed that getting a buy-in of the scheme from the Governments of
ECOWAS member countries and the potential anchor and partner institutions require a
formal high-level discussion on the relevance, and operations of the proposed
institutions.
The meeting of the National Coordinating Committees (NCCs) on ECOWAS Multilateral
5.1.4 Economic Community of West African States (ECOWAS)
CBN Half Year Economic Report for 2012
85
Surveillance Mechanism was held in Dakar, Senegal from May 17 to 18, 2012. The
purpose of the meeting was to acquaint the NCC members with the amendments to the
Guide to Presenting Macroeconomic Convergence Report, changes to the ECOMAC
database and share in the experience of Senegal on medium- to long-term forecasting
of economic indicators. Member states were:
· Encouraged to ensure consistency in their macroeconomic accounts and
statistics;
· Urged to bring to the attention of the ECOWAS Commission any changes or
updates to the data entered on the ECOMAC database; and
· Urged to query and validate the ECOMAC database on time in order to ensure its
credibility;
Member states requested ECOWAS Commission to:
· Set up an electronic warning system that will instantly inform database
Administrators of changes to the ECOMAC database; and
· Organise a practical session on the analysis of the multi-year convergence
programme by the NCCs.
Member states implored WAMA to:
· Continue its efforts in finding an appropriate methodology for calculating the real
exchange rate.
thThe 17 Technical Commission/Plenary meeting of GIABA was held in Abidjan, Cote
D'Ivoire during May 2 – 4, 2012. The aim of the meeting was to examine the progress
made by member countries with respect to combating money laundering and terrorist
activities; follow-up on the core and key recommendations made during the previous
meeting; and appraise the implementation of the recommendations by countries that
were rated Partially Compliant (PC) and Non-Compliant (NC) at previous meetings.
Nigeria was commended for strengthening its AML/CFT framework through the
enactment of the Money Laundering (Prohibition) Act 2011 and Terrorism Act 2011. Also,
that Nigeria had issued and gazetted Terrorism Prevention Regulations (freezing of
international terrorist funds and other related measures) in September 2011 to implement
5.1.5 Inter-Governmental Action Group Against Money Laundering (GIABA)
CBN Half Year Economic Report for 2012
86
the United Nations Security Council Resolutions (UNSCRs) 1267 and 1373. The GIABA also
noted the effort of the CBN in developing the AML/CFT regulations (2009) as amended
and AML/CFT Risk-Based Supervision (RBS) Framework in 2011.
Expert meeting of the three Local Bilateral Committees of the Nigeria – Niger Joint
Commission was held in Katsina, Nigeria during March 19–24, 2012. The meeting
examined issues of common interest to both countries and agreed to:
th· Adopt the 2011/2014 secondary roads programme approved during the 36
Session of the Council of Ministers on October 10, 2011 in Birnin Kebbi, Nigeria;
· Recommend reconnaissance missions to these roads to be organized by the Joint
Commission, in collaboration with the Authorities in both countries;
· Urge the institutions supervising the national boundary commissions in both
countries to provide them with necessary resources required for the completion of
the exercise;
· Enlighten traders on the registration of food and drug related products to ensure
conformity with stipulated standards; and
· Invite the chambers of commerce in both countries and their supervisory ministries
to give new impetus to their activities by modernizing border markets in order to
promote trade, establish trade free zones and cluster industries and organizing
periodic trade fairs.
thThe 4 Session of the Nigeria - Iran Joint Commission was held in Tehran, Islamic Republic
of Iran, from April 16to 20, 2012. The purpose of the meeting was to further deepen trade
and bilateral relations and cooperation between both countries. The two countries
signed an MoU on a range of issues among others to:
· Introduce and encourage some of their banks to cooperate with each other in
order to establish correspondent banking relationships. The Central Bank of Iran
requested for the designation of 4 commercial banks in Nigeria to serve as
correspondent banks for Iranian banks;
5.1.6 Bilateral Commissions
5.1.6.1 Nigeria – Niger Joint Commission
5.1.6.2 Nigeria –Iran Joint Commission
CBN Half Year Economic Report for 2012
87

· Facilitate money transfer meant for the implementation of technical and
engineering projects launched by Iranian companies in Nigeria in accordance
with prevailing laws and regulations in Nigeria; and
· Settle commercial transactions between the two countries in conformity with
international banking best practices.
The World Economic Forum Annual Meeting was held from January 25 to 29, 2012 at
Davos-Klosters, Switzerland. The theme for 2012 was “The Great Transformation: Shaping
New Models”. The forum underscored debt sustainability and social equity issues as some
of the challenges facing the society and noted that no country was immune from the
Eurozone's problems; and that fiscal discipline, fiscal union and firewalls were needed to
resolve the crisis.
The 2012 Spring Meetings of the Board of Governors of the World Bank Group and the
International Monetary Fund (IMF) were held in Washington D.C., USA from April 16 to 22,
2012. The Ministers of the Inter-governmental Group of 24, the International Monetary
and Finance Committee and the Development Committee held discussions on issues
relating to the global financial and economic situation, infrastructure, sustainable
development and surveillance, amongst others.
The meetings noted recent improvements, but expressed concern about the fragility of
the global economic recovery. While recent policy actions have reduced immediate
threats arising from the Euro area crisis, downside risks remained high, including possible
renewed tensions in the Euro area and high and volatile oil prices. The meetings
observed that the pace of global growth remained subdued and uncertain, with
adverse impact on growth in many emerging markets and developing countries
(EMDCs). The meetings called for immediate and concerted actions to restore
confidence and boost global growth through mutually consistent policies, while taking
into account the spillovers.
The meetings reaffirmed the urgency of making the 2010 quota and governance
reforms effective by the 2012 Annual Meetings, to enhance the Fund's legitimacy and
credibility. It urged members to ratify the reforms expeditiously and called on the Fund to
monitor progress transparently and more frequently. The G24 Ministers called for a third
chair for Sub-Saharan Africa to replace a chair held by an advanced country.
5.2 Multilateral Economic and Financial Institutions
5.2.1 World Economic Forum Annual Meeting
5.2.2 The World Bank/IMF Spring Meetings
CBN Half Year Economic Report for 2012
88

The meetings called for a steep increase in investment in infrastructure over the next few
decades in order to realize the growth potential of developing economies. Therefore,
the IFC was urged to support greater private sector involvements to enhance their
contributions and strengthen public-private partnerships.
The Development Committee noted that higher and more volatile food prices
threatened poverty reduction and the attainment of other Millennium Development
Goals (MDGs), especially reducing hunger and child and maternal mortality. The
Committee urged the World Bank Group to continue to pursue multi-sectoral solutions to
food insecurity and malnutrition through instruments such as the Global Agriculture and
Food Security Programme.
The Board of the IMF released discussions on its staff report on Article IV Mission to Nigeria
on February 22, 2012. The IMF Executive Directors commended the Nigerian authorities
for countercyclical policies that had supported economic activities in challenging
circumstances. The IMF welcomed the strategy to rebuild fiscal buffers through a better
prioritization of public expenditure, continued subsidy reform, and improved tax
administration. Effort in these areas would provide the necessary resources for targeted
social programmes and needed infrastructure. In addition, the IMF endorsed the use of
conservative oil price assumptions in the preparation of the budget, but noted that only a
comprehensive tax reform would reduce the country's dependence on oil revenues over
the medium term.
Among the key decisions taken by the IMF Board in the Article IV report were:
· The need to improve public financial management, including a stronger
framework for managing Nigeria's oil wealth through the establishment of a
Sovereign Wealth Fund (SWF) and that a rule-based oil reference price would
strengthen the budgetary process and the operations of the SWF;
· Outlays from the SWF's infrastructure fund be integrated into the medium-term
expenditure plans of the government;
· Welcomed the authorities' initiatives to improve the business climate and reform
sectors with high employment potential, particularly agriculture;
· Encouraged the authorities to sustain planned reforms in the energy sector under
appropriate social reforms; and
5.2.3 International Monetary Fund (IMF) Article IV Report on Nigeria
CBN Half Year Economic Report for 2012
89
· Emphasized the need for continued policies to safeguard macroeconomic
stability, diversify the economy, and make growth more inclusive.
The G8 Summit was held in Camp David, Maryland, United States of America, from May
18 to 19, 2012. The main objective of the summit was to address the European sovereign
debt crisis.
The G8 agreed that all member governments need to take actions to boost confidence
and nurture recovery including reforms to raise productivity, growth and demand within
a sustainable, credible and non-inflationary macroeconomic framework. Leaders
emphasized commitment and support for sound and sustainable fiscal consolidation
policies that take into account countries' evolving economic conditions.
The G8 also held a consensus view that a strong and cohesive Eurozone was important for
global stability and recovery, and affirmed their support for Greece to remain in the
Eurozone, while respecting its commitments. Noting that significant headwinds still persist
in the path of global economic recovery, the G8 agreed to take necessary steps to
strengthen and reinvigorate their economies and combat financial stresses, recognizing
that the right measures are different for each country.
In addition, the G8 committed itself to a “New Alliance for Food Security and Nutrition”
with African leaders and the private sector aimed at lifting 50 million people from poverty
within 10 years. By this alliance, the G8 want to accelerate the flow of private capital to
African agriculture, new technologies and other innovations that could increase
sustainable agricultural productivity, and reduce the risk borne by vulnerable economies
and communities.
The G20 Summit was held in Los Cabos, Mexico during June 18 – 19, 2012. The meeting
was attended by G20 members and heads of international organizations. The following
were the major highlights of the meeting:
· The Los Cabos Action Plan for Growth and Employment was signed. The plan
established commitments to deal with the Eurozone crisis, strengthen demand,
economic growth and financial systems, ensure the fiscal consolidation of
advanced economies, reinforce solid, sustainable growth in emerging
economies and maintain trade liberalization.
5.2.4 Group of 8 (G-8)Summit
5.2.5 Group of 20 (G-20) Summit
CBN Half Year Economic Report for 2012
90
· The IMF's financial resources were increased to over $450 billion which will increase
its capacity to provide support and loans for coping with economic crises. This
constitutes the greatest capitalization in the history of the Fund.
· Agreements were reached with the Global Alliance for Financial Inclusion to
assess the progress in the extension of financial services to populations with least
resources. In addition, greater financial education would be promoted and
protective measures increased for the users of financial services for savings,
credits and insurance.
· With regard to food security, the G20 agreed to promote greater public and
private investment in order to promote agriculture, develop technology and
increase the productivity of the sector.
CBN Half Year Economic Report for 2012
91
6.0 ECONOMIC OUTLOOK FOR THE SECOND HALF OF 2012
The outlook for the economy in the second half of 2012 is positive. Growth in agricultural
output is expected to be sustained despite the damages from flooding in some parts of
the country. Government's commitment to fixing power and other economic and social
infrastructure has started manifesting positively with increased power generation.
However, the hike in electricity tariff and lingering challenges in the distribution of
petroleum products would impact negatively on cost of production particularly, in the
manufacturing sub-sector. Nonetheless, the improved power supply across the country,
favourable agricultural outlook, increased activity in the solid mineral sub-sector and
sustained crude oil production was expected to bolster real GDP growth rate. Inflation
would likely moderate, but still close the year above the single digit mark.
The slow global economic recovery occasioned by the weak demand in some
industrialized and emerging market economies, as well as the lingering Eurozone debt
crisis would no doubt pose a challenge to the external sector. However, this would likely
be off-set by the projected high price of crude oil in the international market. Thus,
Nigeria's balance of payments position is likely to remain favourable for the remaining
part of 2012. The expected high inflow of foreign exchange based on projected crude oil
price and export volume, would boost government revenue, impact positively on foreign
exchange reserves and engender stability in the foreign exchange market. The pressure
to fast-track the implementation of the 2012 Budget would constitute a pressure point on
domestic monetary conditions. However, with the sustained commitment of the
monetary authority to taking proactive measures in monetary management, growth in
monetary aggregates was not expected to deviate too largely from their projected
thresholds.
The key policy challenges in the second half of 2012 would be to manage inflation and
exchange rate expectations and sustain the build-up of external reserves to insure
against rising global uncertainties. It is also imperative to keep real interest rate positive to
attract foreign investment and retain domestic investment. In this regard, current efforts
at containing the security situation in parts of the country which has degenerated to the
extent of bombing economic infrastructure should be sustained
CBN Half Year Economic Report for 2012
92
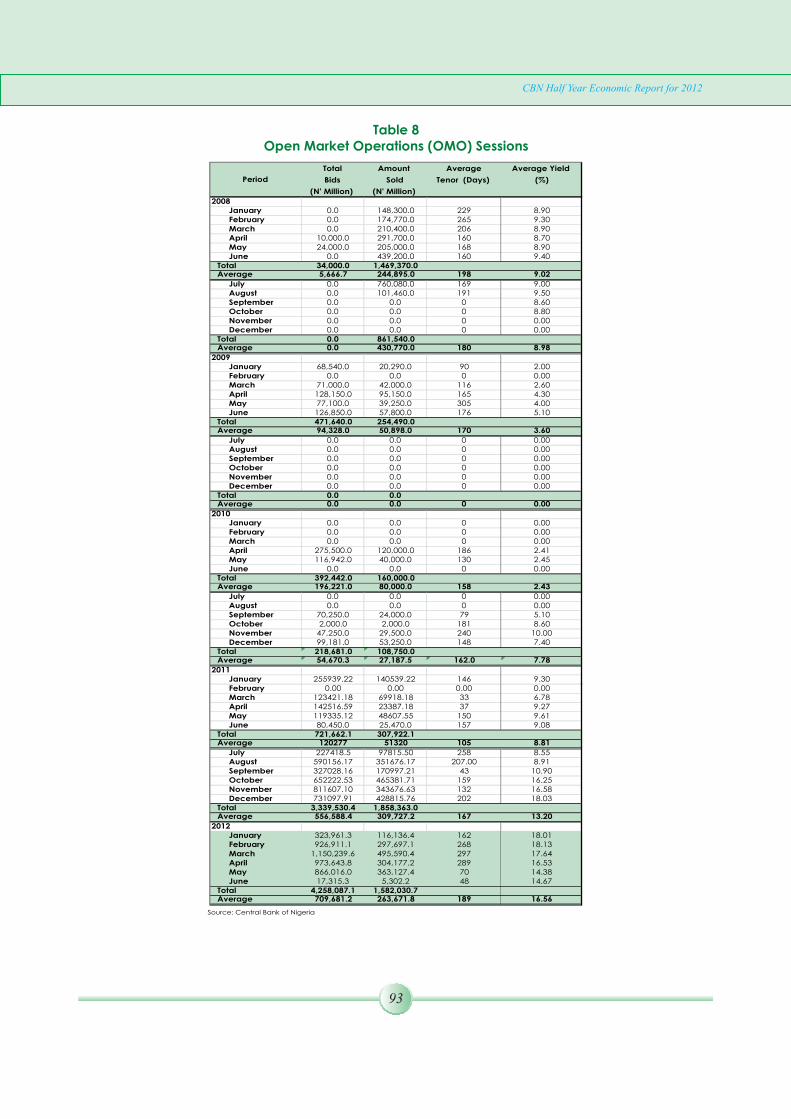
Table 8Open Market Operations (OMO) Sessions
Total Amount Average Average Yield
Bids Sold Tenor (Days) (%)
(N' Million) (N' Million)
2008January 0.0 148,300.0 229 8.90February 0.0 174,770.0 265 9.30March 0.0 210,400.0 206 8.90April 10,000.0 291,700.0 160 8.70May 24,000.0 205,000.0 168 8.90June 0.0 439,200.0 160 9.40
Total 34,000.0 1,469,370.0Average 5,666.7 244,895.0 198 9.02
July 0.0 760,080.0 169 9.00August 0.0 101,460.0 191 9.50September 0.0 0.0 0 8.60October 0.0 0.0 0 8.80November 0.0 0.0 0 0.00December 0.0 0.0 0 0.00
Total 0.0 861,540.0Average 0.0 430,770.0 180 8.98
2009January 68,540.0 20,290.0 90 2.00February 0.0 0.0 0 0.00March 71,000.0 42,000.0 116 2.60April 128,150.0 95,150.0 165 4.30May 77,100.0 39,250.0 305 4.00June 126,850.0 57,800.0 176 5.10
Total 471,640.0 254,490.0Average 94,328.0 50,898.0 170 3.60
July 0.0 0.0 0 0.00August 0.0 0.0 0 0.00September 0.0 0.0 0 0.00October 0.0 0.0 0 0.00November 0.0 0.0 0 0.00December 0.0 0.0 0 0.00
Total 0.0 0.0Average 0.0 0.0 0 0.00
2010January 0.0 0.0 0 0.00February 0.0 0.0 0 0.00March 0.0 0.0 0 0.00April 275,500.0 120,000.0 186 2.41May 116,942.0 40,000.0 130 2.45June 0.0 0.0 0 0.00
Total 392,442.0 160,000.0Average 196,221.0 80,000.0 158 2.43
July 0.0 0.0 0 0.00August 0.0 0.0 0 0.00September 70,250.0 24,000.0 79 5.10October 2,000.0 2,000.0 181 8.60November 47,250.0 29,500.0 240 10.00December 99,181.0 53,250.0 148 7.40
Total 218,681.0 108,750.0Average 54,670.3 27,187.5 162.0 7.78
2011January 255939.22 140539.22 146 9.30February 0.00 0.00 0.00 0.00March 123421.18 69918.18 33 6.78April 142516.59 23387.18 37 9.27May 119335.12 48607.55 150 9.61June 80,450.0 25,470.0 157 9.08
Total 721,662.1 307,922.1Average 120277 51320 105 8.81
July 227418.5 97815.50 258 8.55August 590156.17 351676.17 207.00 8.91September 327028.16 170997.21 43 10.90October 652222.53 465381.71 159 16.25November 811607.10 343676.63 132 16.58December 731097.91 428815.76 202 18.03
Total 3,339,530.4 1,858,363.0Average 556,588.4 309,727.2 167 13.20
2012January 323,961.3 116,136.4 162 18.01February 926,911.1 297,697.1 268 18.13March 1,150,239.6 495,590.4 297 17.64April 973,643.8 304,177.2 289 16.53May 866,016.0 363,127.4 70 14.38June 17,315.3 5,302.2 48 14.67
Total 4,258,087.1 1,582,030.7Average 709,681.2 263,671.8 189 16.56
Source: Central Bank of Nigeria
Period
CBN Half Year Economic Report for 2012
93

Table 9Treasury Bills: Issues and Subscriptions
(Naira Million)
Deposit Money
Banks
Non-Bank
Public
2008
June 75,356.17 2.27 19,756.86 55,597.04
December 70,000.00 0.00 45,871.99 24,128.01
Annual Total 916,281.59 7,584.33 383,668.91 525,028.36
Annual Average 76,356.80 31,972.41 43,752.36
2009
June 120,000.00 0.00 73,320.00 46,680.00
December 162,560.00 0.00 122,490.00 40,070.00
Annual Total 1,392,420.00 30.00 876,380.00 516,010.00
Annual Average 116,035.00 73,031.67 43,000.83
2010
June 158,700.00 0.00 114,343.96 44,356.04
December 297,909.82 0.00 222,498.29 75,411.53
Annual Total 2,003,952.93 24,485.00 1,378,658.34 600,809.59
Annual Average 166,996.08 114,888.19 50,067.47
2011
June 340,233.10 0.00 206,187.59 134,045.51
December 317,714.17 0.00 172,438.46 145,275.72
Annual Total 3,046,262.94 1,999,006.25 1,047,256.69
Annual Average 253,855.24 166,583.85 87,271.39
2012
January 316,296.66 163,857.24 91,231.01 61,208.41
February 298,924.18 0.00 176,640.77 122,283.42
March 332,230.48 0.00 217,646.74 114,583.74
April 324,269.40 0.00 223,661.25 100,608.14
May 273,388.72 0.00 180,817.32 92,571.40
June 373,163.33 0.00 249,117.86 124,045.48
Half Year Total 1,918,272.77 163,857.24 1,139,114.94 615,300.58
Half Year Average 319,712.13 27,309.54 189,852.49 102,550.10
Source: Central Bank of Nigeria
Period IssuesCentral
Bank
Allotment to Subscriber
CBN Half Year Economic Report for 2012
94
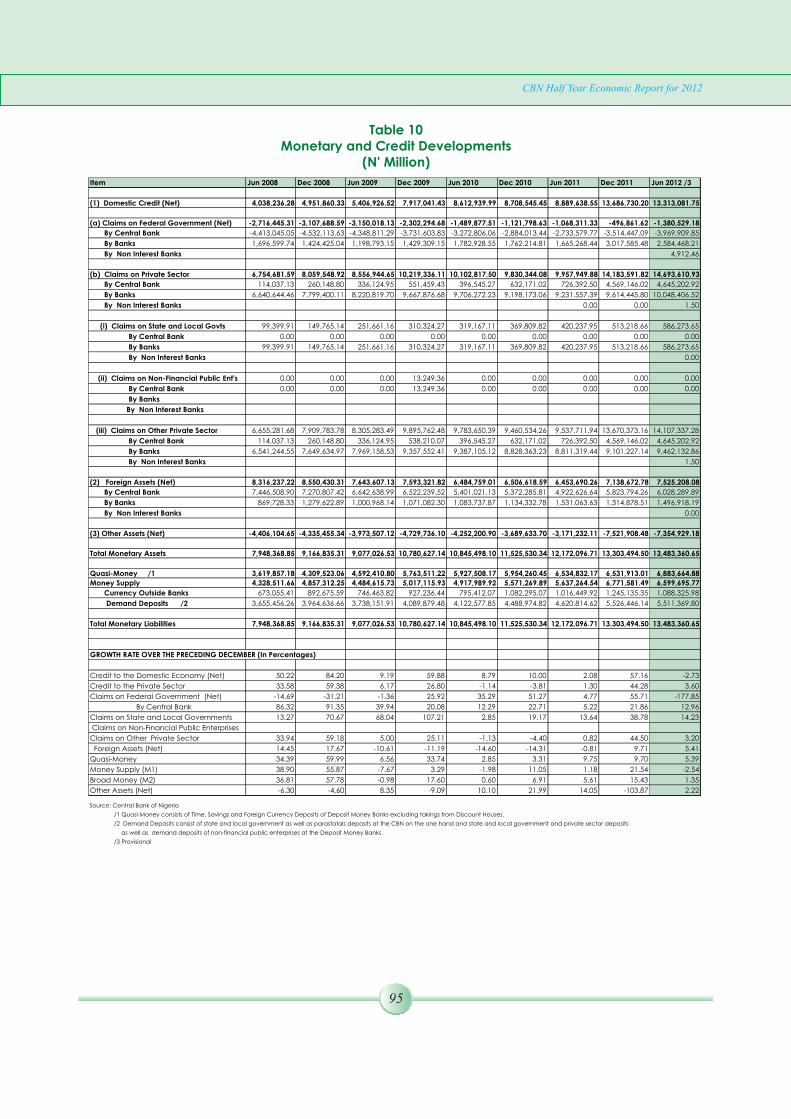
Table 10Monetary and Credit Developments
(N' Million)
Item Jun 2008 Dec 2008 Jun 2009 Dec 2009 Jun 2010 Dec 2010 Jun 2011 Dec 2011 Jun 2012 /3
(1) Domestic Credit (Net) 4,038,236.28 4,951,860.33 5,406,926.52 7,917,041.43 8,612,939.99 8,708,545.45 8,889,638.55 13,686,730.20 13,313,081.75
(a) Claims on Federal Government (Net) -2,716,445.31 -3,107,688.59 -3,150,018.13 -2,302,294.68 -1,489,877.51 -1,121,798.63 -1,068,311.33 -496,861.62 -1,380,529.18
By Central Bank -4,413,045.05 -4,532,113.63 -4,348,811.29 -3,731,603.83 -3,272,806.06 -2,884,013.44 -2,733,579.77 -3,514,447.09 -3,969,909.85
By Banks 1,696,599.74 1,424,425.04 1,198,793.15 1,429,309.15 1,782,928.55 1,762,214.81 1,665,268.44 3,017,585.48 2,584,468.21
By Non Interest Banks 4,912.46
(b) Claims on Private Sector 6,754,681.59 8,059,548.92 8,556,944.65 10,219,336.11 10,102,817.50 9,830,344.08 9,957,949.88 14,183,591.82 14,693,610.93
By Central Bank 114,037.13 260,148.80 336,124.95 551,459.43 396,545.27 632,171.02 726,392.50 4,569,146.02 4,645,202.92
By Banks 6,640,644.46 7,799,400.11 8,220,819.70 9,667,876.68 9,706,272.23 9,198,173.06 9,231,557.39 9,614,445.80 10,048,406.52
By Non Interest Banks 0.00 0.00 1.50
(i) Claims on State and Local Govts 99,399.91 149,765.14 251,661.16 310,324.27 319,167.11 369,809.82 420,237.95 513,218.66 586,273.65
By Central Bank 0.00 0.00 0.00 0.00 0.00 0.00 0.00 0.00 0.00
By Banks 99,399.91 149,765.14 251,661.16 310,324.27 319,167.11 369,809.82 420,237.95 513,218.66 586,273.65
By Non Interest Banks 0.00
(ii) Claims on Non-Financial Public Ent's 0.00 0.00 0.00 13,249.36 0.00 0.00 0.00 0.00 0.00
By Central Bank 0.00 0.00 0.00 13,249.36 0.00 0.00 0.00 0.00 0.00
By Banks
By Non Interest Banks
(iii) Claims on Other Private Sector 6,655,281.68 7,909,783.78 8,305,283.49 9,895,762.48 9,783,650.39 9,460,534.26 9,537,711.94 13,670,373.16 14,107,337.28
By Central Bank 114,037.13 260,148.80 336,124.95 538,210.07 396,545.27 632,171.02 726,392.50 4,569,146.02 4,645,202.92
By Banks 6,541,244.55 7,649,634.97 7,969,158.53 9,357,552.41 9,387,105.12 8,828,363.23 8,811,319.44 9,101,227.14 9,462,132.86
By Non Interest Banks 1.50
(2) Foreign Assets (Net) 8,316,237.22 8,550,430.31 7,643,607.13 7,593,321.82 6,484,759.01 6,506,618.59 6,453,690.26 7,138,672.78 7,525,208.08
By Central Bank 7,446,508.90 7,270,807.42 6,642,638.99 6,522,239.52 5,401,021.13 5,372,285.81 4,922,626.64 5,823,794.26 6,028,289.89
By Banks 869,728.33 1,279,622.89 1,000,968.14 1,071,082.30 1,083,737.87 1,134,332.78 1,531,063.63 1,314,878.51 1,496,918.19
By Non Interest Banks 0.00
(3) Other Assets (Net) -4,406,104.65 -4,335,455.34 -3,973,507.12 -4,729,736.10 -4,252,200.90 -3,689,633.70 -3,171,232.11 -7,521,908.48 -7,354,929.18
Total Monetary Assets 7,948,368.85 9,166,835.31 9,077,026.53 10,780,627.14 10,845,498.10 11,525,530.34 12,172,096.71 13,303,494.50 13,483,360.65
Quasi-Money /1 3,619,857.18 4,309,523.06 4,592,410.80 5,763,511.22 5,927,508.17 5,954,260.45 6,534,832.17 6,531,913.01 6,883,664.88
Money Supply 4,328,511.66 4,857,312.25 4,484,615.73 5,017,115.93 4,917,989.92 5,571,269.89 5,637,264.54 6,771,581.49 6,599,695.77
Currency Outside Banks 673,055.41 892,675.59 746,463.82 927,236.44 795,412.07 1,082,295.07 1,016,449.92 1,245,135.35 1,088,325.98
Demand Deposits /2 3,655,456.26 3,964,636.66 3,738,151.91 4,089,879.48 4,122,577.85 4,488,974.82 4,620,814.62 5,526,446.14 5,511,369.80
Total Monetary Liabilities 7,948,368.85 9,166,835.31 9,077,026.53 10,780,627.14 10,845,498.10 11,525,530.34 12,172,096.71 13,303,494.50 13,483,360.65
GROWTH RATE OVER THE PRECEDING DECEMBER (In Percentages)
Credit to the Domestic Economy (Net) 50.22 84.20 9.19 59.88 8.79 10.00 2.08 57.16 -2.73
Credit to the Private Sector 33.58 59.38 6.17 26.80 -1.14 -3.81 1.30 44.28 3.60
Claims on Federal Government (Net) -14.69 -31.21 -1.36 25.92 35.29 51.27 4.77 55.71 -177.85
By Central Bank 86.32 91.35 39.94 20.08 12.29 22.71 5.22 21.86 12.96
Claims on State and Local Governments 13.27 70.67 68.04 107.21 2.85 19.17 13.64 38.78 14.23
Claims on Non-Financial Public Enterprises
Claims on Other Private Sector 33.94 59.18 5.00 25.11 -1.13 -4.40 0.82 44.50 3.20
Foreign Assets (Net) 14.45 17.67 -10.61 -11.19 -14.60 -14.31 -0.81 9.71 5.41
Quasi-Money 34.39 59.99 6.56 33.74 2.85 3.31 9.75 9.70 5.39
Money Supply (M1) 38.90 55.87 -7.67 3.29 -1.98 11.05 1.18 21.54 -2.54
Broad Money (M2) 36.81 57.78 -0.98 17.60 0.60 6.91 5.61 15.43 1.35
Other Assets (Net) -6.30 -4.60 8.35 -9.09 10.10 21.99 14.05 -103.87 2.22
Source: Central Bank of Nigeria
/1 Quasi-Money consists of Time, Savings and Foreign Currency Deposits of Deposit Money Banks excluding takings from Discount Houses.
/2 Demand Deposits consist of state and local government as well as parastatals deposits at the CBN on the one hand and state and local government and private sector deposits
as well as demand deposits of non-financial public enterprises at the Deposit Money Banks.
/3 Provisional
CBN Half Year Economic Report for 2012
95

Tab
le 1
1V
alu
e o
f M
on
ey
Ma
rke
t A
sse
ts(N
air
a M
illio
n)
20
12
1/
Ju
ne
De
cJu
ne
De
cJu
ne
De
cJu
ne
De
cJu
ne
Tre
asu
ry B
ills
57
4,9
29
.40
47
1,9
29
.40
64
1,9
30
.00
79
7,4
82
.00
90
1,0
16
.62
1,2
77
,10
1.6
01
,56
1,4
24
.00
1,7
27
,91
0.0
02
,08
4,5
90
.38
Tre
asu
ry C
ert
ific
ate
s0
.00
0.0
00
.00
0.0
00
.00
0.0
00
.00
0.0
00
.00
De
ve
lop
me
nt
Sto
ck
s5
20
.00
52
0.0
05
20
.00
52
0.0
02
20
.00
22
0.0
00
.00
0.0
00
.00
Ce
rtific
ate
s o
f D
ep
osi
ts0
.00
0.0
00
.00
0.0
00
.00
0.0
00
.00
0.0
00
.00
Co
mm
erc
ial P
ap
ers
65
3,1
01
.00
82
2,7
00
.90
60
2,4
65
.90
50
9,0
79
.12
18
8,2
04
.28
18
9,2
16
.42
19
9,4
69
.24
20
3,0
08
.29
2,0
39
.06
Ba
nk
ers
' A
cc
ep
tan
ce
s1
69
,80
0.1
06
6,3
98
.70
74
,21
5.7
06
2,2
43
.63
41
,31
2.0
47
9,1
72
.31
62
,25
8.2
77
3,4
06
.10
23
,72
2.3
4
FG
N B
on
ds
1,3
61
,25
4.7
01
,44
5,5
99
.00
1,7
78
,30
0.0
01
,97
4,9
30
.00
2,4
08
,42
6.5
92
,90
1,6
00
.30
3,2
76
,11
1.0
03
,54
1,2
00
.00
3,7
14
,55
3.8
6
Tota
l2
,75
9,6
05
.20
2,8
07
,14
8.0
03
,09
7,4
31
.60
3,3
44
,25
4.7
53
,53
9,1
79
.53
4,4
47
,31
0.6
35
,09
9,2
62
.52
5,5
45
,52
4.3
95
,82
4,9
05
.64
Tre
asu
ry B
ills
0.0
1-1
7.9
13
6.0
26
8.9
81
2.9
86
0.1
42
2.2
63
5.3
02
0.6
4
Tre
asu
ry C
ert
ific
ate
s0
.00
0.0
00
.00
0.0
00
.00
0.0
00
.00
0.0
00
.00
Elig
ible
De
ve
lop
me
nt
Sto
ck
s-1
6.1
3-1
6.1
30
.00
0.0
0-5
7.6
9-5
7.6
9-1
00
.00
-10
0.0
00
.00
Ce
rtific
ate
s o
f D
ep
osi
ts0
.00
0.0
00
.00
0.0
00
.00
0.0
00
.00
0.0
00
.00
Co
mm
erc
ial P
ap
ers
79
.73
12
6.4
1-2
6.7
7-3
8.1
2-6
3.0
3-6
2.8
35
.42
7.2
9-9
9.0
0
Ba
nk
ers
' A
cc
ep
tan
ce
s1
07
.49
-18
.86
11
.77
-6.2
6-3
3.6
32
7.2
0-2
1.3
6-7
.28
-67
.68
FG
N B
on
ds
14
.76
21
.87
23
.01
36
.62
21
.95
46
.92
12
.91
22
.04
4.9
0
Pe
rce
nta
ge
Ch
an
ge
of
Tota
l2
5.0
42
7.2
01
0.3
41
9.1
35
.83
32
.98
14
.66
24
.69
14
.23
So
urc
e:
Ce
ntr
al B
an
k o
f N
ige
ria
1/
Pro
vis
ion
al
Pe
rce
nta
ge
Ch
an
ge
Ov
er
Pre
ce
din
g D
ec
em
be
r
Inst
rum
en
t2
00
82
00
92
01
02
01
1
CBN Half Year Economic Report for 2012
96
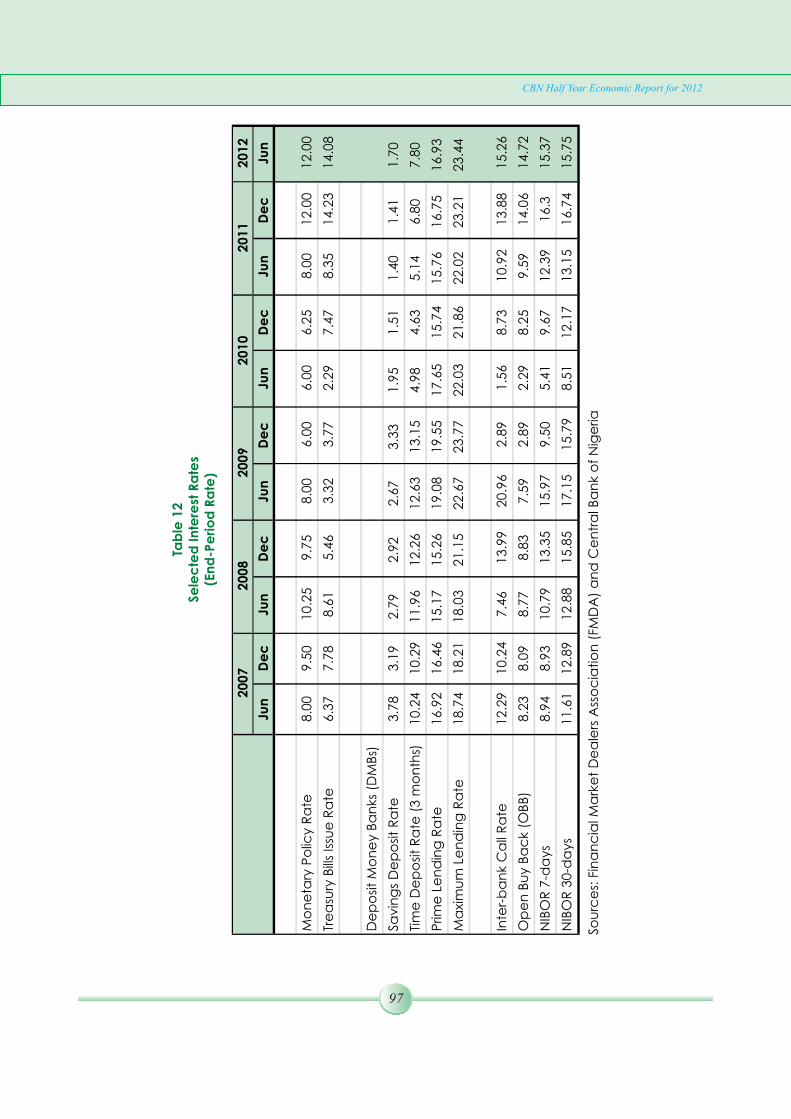
Tab
le 1
2Se
lec
ted
In
tere
st R
ate
s(E
nd
-Pe
rio
d R
ate
)
2012
Jun
De
cJu
nD
ec
Jun
De
cJu
nD
ec
Jun
De
cJu
n
Mo
ne
tary
Po
licy R
ate
8.0
09
.50
10
.25
9.7
58
.00
6.0
06
.00
6.2
58
.00
12
.00
12
.00
Tre
asu
ry B
ills
Issu
e R
ate
6.3
77
.78
8.6
15
.46
3.3
23
.77
2.2
97
.47
8.3
51
4.2
31
4.0
8
De
po
sit
Mo
ne
y B
an
ks
(DM
Bs)
Sav
ing
s D
ep
osi
t R
ate
3.7
83
.19
2.7
92
.92
2.6
73
.33
1.9
51
.51
1.4
01
.41
1.7
0
Tim
e D
ep
osi
t R
ate
(3
mo
nth
s)1
0.2
41
0.2
91
1.9
61
2.2
61
2.6
31
3.1
54
.98
4.6
35
.14
6.8
07
.80
Prim
e L
en
din
g R
ate
16
.92
16
.46
15
.17
15
.26
19
.08
19
.55
17
.65
15
.74
15
.76
16
.75
16
.93
Ma
xim
um
Le
nd
ing
Ra
te1
8.7
41
8.2
11
8.0
32
1.1
52
2.6
72
3.7
72
2.0
32
1.8
62
2.0
22
3.2
12
3.4
4
Inte
r-b
an
k C
all
Ra
te
12
.29
10
.24
7.4
61
3.9
92
0.9
62
.89
1.5
68
.73
10
.92
13
.88
15
.26
Op
en
Bu
y B
ac
k (
OB
B)
8.2
38
.09
8.7
78
.83
7.5
92
.89
2.2
98
.25
9.5
91
4.0
61
4.7
2
NIB
OR
7-d
ays
8.9
48
.93
10
.79
13
.35
15
.97
9.5
05
.41
9.6
71
2.3
91
6.3
15
.37
NIB
OR
30
-da
ys
11
.61
12
.89
12
.88
15
.85
17
.15
15
.79
8.5
11
2.1
71
3.1
51
6.7
41
5.7
5
Sou
rce
s: F
ina
nc
ial M
ark
et
De
ale
rs A
sso
cia
tio
n (
FMD
A)
an
d C
en
tra
l Ba
nk o
f N
ige
ria
2007
2008
2009
2010
2011
CBN Half Year Economic Report for 2012
97

Table 13Federation Account Operations
(N' Billion)
1st Half 1st Half 1st Half 1st Half 1st Half 1st Half
Budget
Total Revenue (Gross) 3,752.73 2,226.20 3,255.68 4,758.96 5,577.22 4,846.25
Oil Revenue (Gross) 3,133.58 1,538.86 2,445.42 3,828.05 4,357.61 3,318.26
Crude oil / Gas Exports 1,083.24 539.97 834.31 1,007.66 959.01 1,846.51
PPT and Royalties etc. 1,303.81 512.22 813.25 1,698.91 2,160.16 1,262.42
Domestic Crude Oil / Gas Sales 744.30 484.55 793.74 1,119.63 1,190.62 206.10
Other Oil Revenue 2.23 2.12 4.13 1.86 47.82 3.23
Less:
Deductions 1,545.77 425.75 1,141.34 2,136.53 2,214.56 1,014.81
Oil Revenue (Net) 1,587.81 1,113.11 1,304.08 1,691.53 2,143.05 2,303.45
Non-oil Revenue 619.14 687.33 810.26 930.91 1,219.61 1,527.99
Companies Income Tax & Other Taxes 161.85 203.62 261.50 243.26 281.82 414.09
Customs & Excise Duties 134.61 126.81 140.70 210.57 226.97 300.29
Value-Added Tax (VAT) 196.56 222.21 282.38 307.11 352.75 401.43
Independent Revenue of Fed. Govt. 75.53 54.28 42.44 92.93 226.70 223.39
Education Tax 12.64 37.57 33.46 14.57 48.71 48.42
Customs Levies 37.96 38.67 45.46 61.82 79.10 58.04
National Information Technology Development Fund (NITDF) 0.00 4.18 4.31 0.64 3.57 4.56
Other Non-oil Revenue 0.00 0.00 0.00 0.00 0.00 77.78
Less:
Cost of Collection 23.77 25.92 31.60 36.27 41.27 67.67
Non-Oil Revenue (Net) 595.38 661.41 778.65 894.64 1,178.34 1,460.32
Estmiated Balances in Special Accounts for the previous year 0.00 0.00 0.00 0.00 0.00 6.22
Federally-collected revenue (Net) 2,183.19 1,774.52 2,082.73 2,586.16 3,321.39 3,770.00
Federation Account Allocation: 2,183.19 1,774.53 2,082.73 2,586.16 3,321.39 3,770.00
Transfer to Federal Govt. Ind. Revenue 75.53 54.28 42.44 92.93 226.70 223.39
Transfer to VAT Pool Account 188.70 213.32 271.08 294.82 338.64 385.37
Other Tranfers 3/ 50.60 80.42 83.23 77.03 131.37 123.19
Distributable Amount
Amount Distributed 1,868.36 1,426.51 1,685.98 2,121.38 2,624.68 3,038.04
Federal Government 875.51 675.26 795.99 1,001.70 1,235.92 1,442.69
State Government 444.07 342.50 403.74 508.08 626.87 731.75
Local Government 342.36 264.05 311.26 391.70 483.29 564.15
13% Derivation 206.42 144.70 174.99 219.90 278.60 299.45
Vat Pool Account 188.70 213.29 271.08 294.82 338.64 385.37
Federal Government 28.30 32.00 40.66 44.22 50.79 57.81
State Government 94.35 106.66 135.54 147.41 169.32 192.69
Local Government 66.05 74.63 94.88 103.19 118.52 134.88
Special Funds (FGN) 91.98 52.01 61.60 77.80 99.67 68.25
Federal Capital Territory 22.01 12.44 14.74 18.61 23.04 27.39
Ecology 22.00 12.44 14.74 18.61 23.04 27.39
Statutory Stabilization 11.00 6.22 7.37 9.31 11.52 12.61
Natural Resources 36.97 20.91 24.76 31.27 38.70 0.87
FCT VAT 2.95 3.39 3.85
Overall Balance 0.00 0.00 0.00 0.00 0.00 0.00
Deductions 1,545.77 425.75 1,141.34 2,136.53 2,168.86 1,014.81
JVC Cash calls 285.25 363.50 488.82 499.35 510.83 415.88
Excess Crude Proceeds 831.30 49.90 391.64 548.29 454.35 0.00
Excess PPT & Royalty 429.22 12.35 27.24 819.83 886.33 0.00
Domestic Subsidy 260.00 444.05
Others 0.00 0.00 233.64 269.07 57.34 154.87
Distribution from Excess Crude 1,106.94 219.76 442.82 0.00 75.00 0.00
Federal Government 249.27 58.65 202.95 0.00 34.37 0.00
State Government 395.71 93.16 102.94 0.00 17.44 0.00
Local Government 391.25 39.39 79.36 0.00 13.44 0.00
13% Derivation 70.71 28.57 57.57 0.00 9.75 0.00
Share of Diff.Btw. Provisional Distribution and Actual Budget/
Exchange rate Gain/NNPC Refund/SURE-P 67.84 119.09 39.87 162.90 165.62 0.00
Federal Government 31.09 54.58 18.27 74.66 54.96 0.00
State Government 15.77 27.68 9.27 37.87 50.33 0.00
Local Government 12.16 21.34 7.15 29.20 38.80 0.00
13% Derivation 8.82 15.48 5.18 21.18 21.53 0.00
Federation Revenue Augmentation 87.87 300.65 414.22 145.95 462.02 0.00
Federal Government 40.27 137.79 189.84 66.89 211.75 0.00
State Government 20.43 69.89 96.29 33.93 107.40 0.00
Local Government 15.75 53.88 74.24 26.16 82.80 0.00
13% Derivation 11.42 39.08 53.85 18.97 60.06 0.00
Total Statutory Revenue and VAT Distribution 3/ 3,319.71 2,279.30 2,853.97 2,725.06 3,665.96 3,423.42
Federal Government 1,224.45 958.28 1,247.72 1,187.48 1,587.80 1,500.50
State Government 970.33 639.89 747.78 727.29 971.36 924.44
Local Government 827.57 453.30 566.89 550.25 736.86 699.03
13% Derivation 297.37 227.84 291.59 260.05 369.94 299.45
Total Excluding VAT 0.00 2,915.57 2,582.88 2,430.23 3,327.33 3,038.04
Federal Government 0.00 1,247.72 1,207.06 1,143.25 1,537.01 1,442.69
State Government 0.00 747.78 612.23 579.87 802.04 731.75
Local Government 0.00 566.89 472.01 447.06 618.34 564.15
13% Derivation 0.00 353.19 291.59 260.05 369.94 299.45
Source: Office of the Accountant-General of the Federation (OAGF)
1/ Revised
2/ Provisional
3/ Includes Education Tax, Customs Levies and NITDF
Memorandum Items
CBN Half Year Economic Report for 2012
98
2008 2009 2010 2011 2012 2012 2/
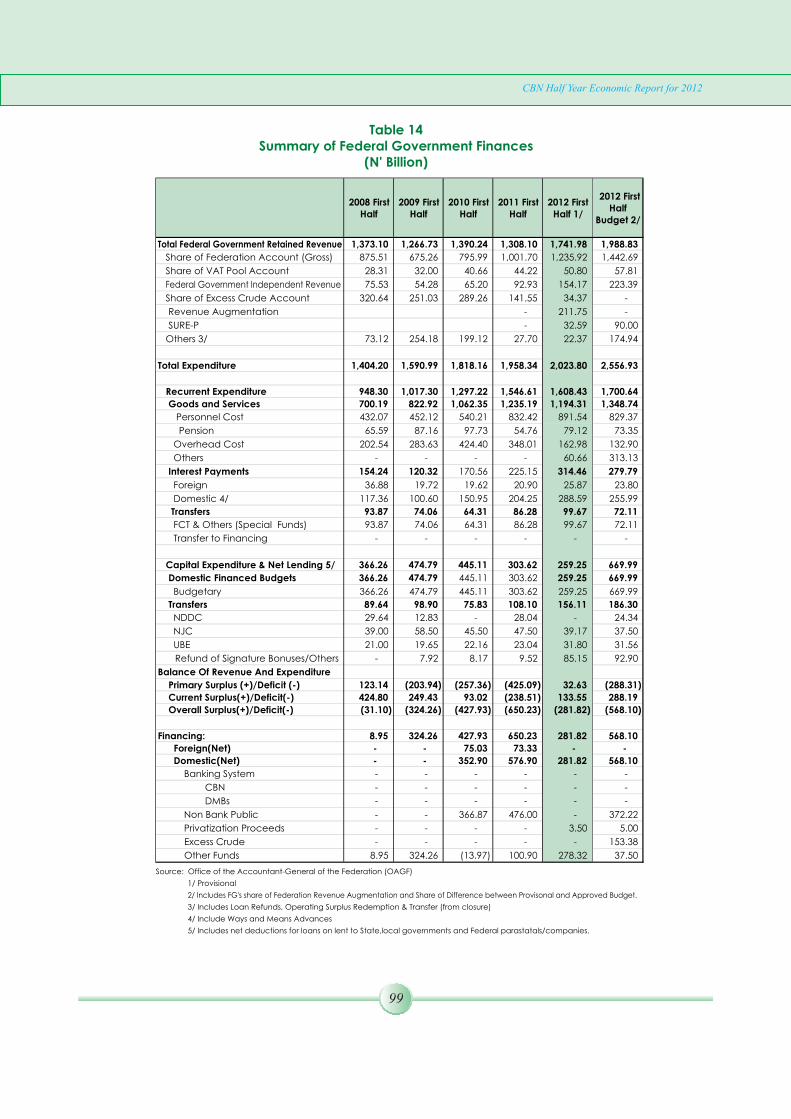
Table 14Summary of Federal Government Finances
(N' Billion)
2008 First
Half
2009 First
Half
2010 First
Half
2011 First
Half
2012 First
Half 1/
2012 First
Half
Budget 2/
Total Federal Government Retained Revenue 1,373.10
1,266.73 1,390.24 1,308.10 1,741.98 1,988.83
Share of Federation Account (Gross) 875.51
675.26 795.99 1,001.70 1,235.92 1,442.69
Share of VAT Pool Account 28.31
32.00 40.66 44.22 50.80 57.81
Federal Government Independent Revenue 75.53
54.28 65.20 92.93 154.17 223.39
Share of Excess Crude Account 320.64
251.03 289.26 141.55 34.37 -
Revenue Augmentation - 211.75 -
SURE-P - 32.59 90.00
Others 3/ 73.12
254.18 199.12 27.70 22.37 174.94
Total Expenditure 1,404.20
1,590.99 1,818.16 1,958.34 2,023.80 2,556.93
Recurrent Expenditure 948.30
1,017.30 1,297.22 1,546.61 1,608.43 1,700.64
Goods and Services 700.19
822.92 1,062.35 1,235.19 1,194.31 1,348.74
Personnel Cost 432.07
452.12 540.21 832.42 891.54 829.37
Pension 65.59
87.16 97.73 54.76 79.12 73.35
Overhead Cost 202.54
283.63 424.40 348.01 162.98 132.90
Others -
- - - 60.66 313.13
Interest Payments 154.24 120.32 170.56 225.15 314.46 279.79
Foreign 36.88
19.72 19.62 20.90 25.87 23.80
Domestic 4/ 117.36 100.60 150.95 204.25 288.59 255.99
Transfers 93.87 74.06 64.31 86.28 99.67 72.11
FCT & Others (Special Funds) 93.87 74.06 64.31 86.28 99.67 72.11
Transfer to Financing - - - - - -
Capital Expenditure & Net Lending 5/ 366.26 474.79 445.11 303.62 259.25 669.99
Domestic Financed Budgets 366.26 474.79 445.11 303.62 259.25 669.99
Budgetary 366.26 474.79 445.11 303.62 259.25 669.99
Transfers 89.64 98.90 75.83 108.10 156.11 186.30
NDDC 29.64 12.83 - 28.04 - 24.34
NJC 39.00 58.50 45.50 47.50 39.17 37.50
UBE 21.00 19.65 22.16 23.04 31.80 31.56
Refund of Signature Bonuses/Others - 7.92 8.17 9.52 85.15 92.90
Balance Of Revenue And Expenditure
Primary Surplus (+)/Deficit (-) 123.14 (203.94) (257.36) (425.09) 32.63 (288.31)
Current Surplus(+)/Deficit(-) 424.80 249.43 93.02 (238.51) 133.55 288.19
Overall Surplus(+)/Deficit(-) (31.10) (324.26) (427.93) (650.23) (281.82) (568.10)
Financing: 8.95 324.26 427.93 650.23 281.82 568.10
Foreign(Net) - - 75.03 73.33 - -
Domestic(Net) - - 352.90 576.90 281.82 568.10
Banking System - - - - - -
CBN - - - - - -
DMBs - - - - - -
Non Bank Public - - 366.87 476.00 - 372.22
Privatization Proceeds - - - - 3.50 5.00
Excess Crude - - - - - 153.38
Other Funds 8.95 324.26 (13.97) 100.90 278.32 37.50
Source: Office of the Accountant-General of the Federation (OAGF)
1/ Provisional
2/ Includes FG's share of Federation Revenue Augmentation and Share of Difference between Provisonal and Approved Budget.
3/ Includes Loan Refunds, Operating Surplus Redemption & Transfer (from closure)
4/ Include Ways and Means Advances
5/ Includes net deductions for loans on lent to State,local governments and Federal parastatals/companies.
CBN Half Year Economic Report for 2012
99

Table 15Functional Classification of Federal Government Capital Expenditure 1/
(Naira Billion)
First Half
2008
First Half
2009
First Half
2010
First Half
2011
First Half
2012
ADMINISTRATION 94.16
116.16
114.16 119.27 113.61
General Administration 64.61
70.55
69.12 75.05 68.16
National Assembly 7.83
4.15
3.10 3.15 3.23
Defence 18.61
18.59
18.09 15.99 16.45
Internal Security 3.12
22.86
23.85 25.09 25.77
- -
ECONOMIC SERVICES 203.89
286.32
249.50 118.89 97.82
Agriculture & Natural Resources 55.60
46.66
35.67 19.30 20.79
Manuf., Mining & Quarrying 4.01
11.39
10.35 7.81 5.72
Transport & Communications 75.91
32.05
41.99 28.21 29.21
Housing -
-
- - -
Roads & Construction -
130.83
72.01 36.08 36.38
National Priority Projects -
-
- - -
JVC Calls/NNPC Priority Projects -
-
- - -
PTF -
-
- - -
Counterpart Funding 2.00
-
- - -
NDDC -
-
22.58 - -
Others 66.38
65.39
66.91 27.50 5.72
- -
SOCIAL & COMMUNITY SERVICES 68.13 72.14 62.98 54.85 39.62
Education 26.06 29.09 20.76 17.90 19.57
Health 27.08 18.18 17.15 14.97 15.68
Others 14.98 24.87 25.06 21.98 4.37
- -
TRANSFERS 2/ 0.08 0.17 18.47 10.60 8.19
Financial Obligations - - - - -
Capital Repayments - - - - -
Domestic - - - - -
Foreign - - - - -
External Obligations - - - - -
Contingencies - - - - -
Capital Supplementation - 0.17 18.47 10.60 8.19
Net Lending to States/L.G.s/Parast. - - - - -
Grants to States - - - - -
Others 0.08 - - - -
TOTAL 366.26 474.79 445.11 303.62 259.25
Sources: Federal Ministry of Finance and Central Bank of Nigeria
1/ Provisional
2/ Excludes statutory transfers to NDDC, NJC and UBE
CBN Half Year Economic Report for 2012
100

Table 16Functional Classification of Federal Government Recurrent Expenditure 1/
(Naira Billion)
2008 First
Half
2009 First
Half
2010 First
Half
2011 First
Half
2012 First
Half
ADMINISTRATION 360.86
437.46
615.65 698.01 725.16
General Administration 201.85
203.36
305.45 281.14 285.15
National Assembly 27.32
61.40
69.54 97.02 102.38
Defence 35.26
66.23
98.80 109.47 114.20
Internal Security 96.42
106.47
141.86 210.38 223.42
- -
ECONOMIC SERVICES 124.96
88.58
155.62 195.35 130.46
Agriculture 22.37
19.16
13.37 15.99 16.55
Roads & Construction 39.25
10.06
17.89 20.57 18.86
Transport & Communications 6.83
32.70
35.96 43.33 40.73
Others 56.51
26.66
88.41 115.46 54.33
- -
SOCIAL & COMMUNITY SERVICES 155.92
189.43
240.99 287.08 259.56
Education 67.88
102.47
107.17 130.42 132.38
Health 50.46
62.01
48.76 57.63 62.82
Others 37.58
24.95
85.07 99.02 64.36
- -
TRANSFERS 2/ 306.56 281.55 320.97 366.19 493.25
Public Debt Charges (Int) 150.12 120.32 170.56 225.15 314.46
Domestic 113.24
100.60
150.95 204.25 288.59
Foreign 36.88 19.72 19.62 20.90 25.87
Pensions & Gratuities 62.57 87.16 69.58 54.76 79.12
FCT & Others 93.87 74.06 80.83 86.28 99.67
Contingencies (Others) - - - - -
External Obligations - - - - -
Extra-Budgetary Expenditure - - - - -
Deferred Custom Duties - - - - -
Unspecified Expenditure - - - - -
Others - - - - -
TOTAL 948.30 997.02 1,333.23 1,546.61 1,608.43
Sources: Federal Ministry of Finance, Office of Accountant General of the Federation and Central Bank of Nigeria
1/ Provisional
2/ Excludes statutory transfers to NDDC, NJC and UBE
CBN Half Year Economic Report for 2012
101
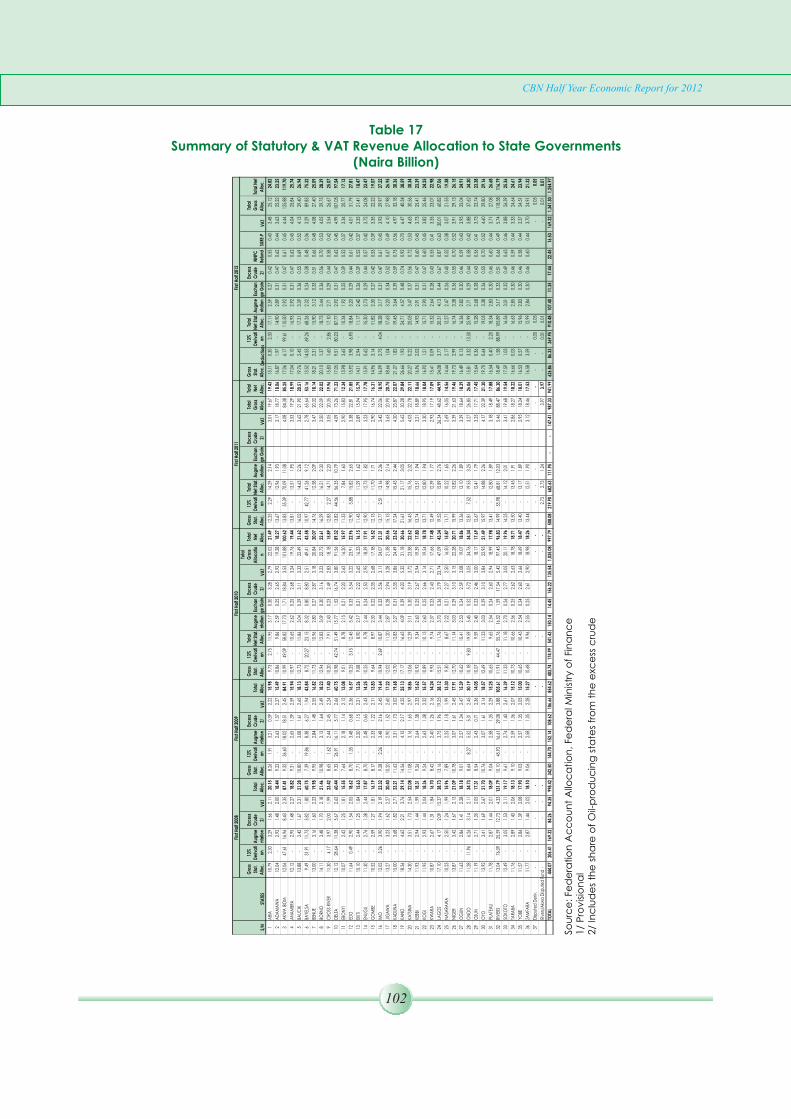
Table 17Summary of Statutory & VAT Revenue Allocation to State Governments
(Naira Billion)
CBN Half Year Economic Report for 2012
102
Gro
ss
Sta
t.
Allo
c.
13%
Der
iva
ti
on
Aug
me
nta
tion
Exce
ss
Cru
de
2/V
AT
Tota
l
Allo
c.
Gro
ss
Sta
t.
Allo
c.
13%
Der
iva
ti
on
Aug
me
nta
tion
Exce
ss
Cru
de
2/V
AT
Tota
l
Allo
c.
Gro
ss
Sta
t.
Allo
c.
13%
Der
iva
ti
on
Tota
l
Net
Sta
t.
Allo
c.
Aug
me
nta
tion
Exch
an
ge
Ga
in
Exce
ss
Cru
de
2/V
AT
Tota
l
Gro
ss
Allo
catio
n
Tota
l
Net
Allo
c.
Gro
ss
Sta
t.
Allo
c.
13%
Der
iva
ti
on
Tota
l
Net
Sta
t.
Allo
c.
Aug
me
nta
tion
Exch
an
ge
Ga
in
Exce
ss
Cru
de
2/V
AT
Tota
l
Gro
ss
Allo
c.
Tota
l
Net
Allo
c.
Gro
ss
Sta
t.
Allo
c.D
educ
tions
13%
Der
iva
ti
on
Tota
l
Net
Sta
t.
Allo
c.
Aug
me
nta
tion
Exch
an
ge
Ga
in
Exce
ss
Cru
de
2/
NN
PC
Refu
ndSU
RE-P
VA
T
Tota
l
Gro
ss
Allo
c.
Tota
l Net
Allo
c.
1A
BIA
10.7
92.
303.
291.
662.
1120
.15
8.26
1.91
3.21
0.39
2.22
15.9
89.
732.
7511
.95
3.17
0.30
3.28
2.79
22.0
221
.49
12.2
52.
2914
.29
2.14
3.01
19.6
719
.43
15.1
10.
302.
3017
.11
2.59
0.27
0.42
0.55
0.40
3.48
25.1
224
.82
2A
DA
MA
WA
12.0
4-
2.92
1.48
2.00
18.4
49.
22-
2.63
1.37
2.27
15.4
910
.86
-9.
862.
590.
252.
652.
9219
.28
18.2
713
.67
-12
.96
1.93
3.17
18.7
718
.06
16.8
71.
97-
14.9
02.
890.
310.
470.
620.
443.
6325
.22
23.2
5
3A
KWA
IBO
M12
.06
47.6
116
.96
8.43
2.35
87.4
19.
3236
.60
18.0
218
.51
2.45
84.9
110
.99
49.0
958
.82
17.7
31.
7118
.84
3.53
101.
8810
0.62
13.8
355
.39
70.0
911
.08
4.08
84.3
885
.25
17.0
66.
1799
.61
110.
502.
920.
310.
470.
610.
454.
4412
5.88
119.
70
4A
NA
MBR
A12
.12
-2.
951.
482.
2718
.82
9.31
-2.
651.
392.
5915
.94
10.9
7-
10.6
52.
620.
252.
683.
2419
.76
19.4
413
.81
-13
.51
1.95
3.53
19.2
918
.99
17.0
40.
10-
16.9
32.
920.
310.
470.
620.
454.
0425
.84
25.7
4
5BA
UCH
I13
.88
-3.
421.
672.
3121
.28
10.8
0-
3.08
1.61
2.65
18.1
312
.73
-11
.86
3.04
0.29
3.11
3.33
22.4
921
.62
16.0
2-
14.6
32.
263.
6221
.90
20.5
119
.76
2.45
-17
.31
3.39
0.36
0.55
0.69
0.52
4.13
29.4
026
.94
6BA
YELS
A9.
4931
.91
11.7
35.
821.
8060
.75
7.39
19.8
68.
386.
271.
9443
.84
8.72
20.2
723
.15
8.32
0.80
8.80
2.51
49.4
143
.58
10.9
742
.77
41.2
69.
122.
7865
.64
53.1
613
.52
14.5
369
.26
68.2
62.
320.
240.
380.
480.
363.
2989
.85
75.3
2
7BE
NUE
13.0
0-
3.16
1.60
2.23
19.9
89.
95-
2.84
1.48
2.55
16.8
211
.73
-10
.96
2.80
0.27
2.87
3.18
20.8
420
.07
14.7
6-
12.5
82.
093.
4720
.32
18.1
418
.21
2.31
-15
.90
3.12
0.33
0.51
0.66
0.48
4.08
27.4
025
.09
8BO
RNO
14.1
1-
3.48
1.70
2.18
21.4
610
.98
-3.
131.
642.
4918
.23
12.9
4-
12.8
33.
090.
303.
163.
2322
.72
22.6
116
.29
-16
.21
2.30
3.50
22.0
922
.02
20.1
01.
37-
18.7
33.
440.
360.
560.
700.
534.
0529
.75
28.3
9
9C
ROSS
RIV
ER11
.30
4.17
3.97
2.00
1.99
23.4
28.
651.
622.
442.
452.
2417
.40
10.2
0-
7.91
2.43
0.23
2.49
2.83
18.1
815
.89
12.8
32.
2714
.71
2.20
3.05
20.3
519
.96
15.8
31.
602.
8617
.10
2.71
0.29
0.44
0.58
0.42
3.54
26.6
725
.07
10D
ELTA
12.1
228
.64
11.3
85.
672.
6260
.44
9.32
26.9
116
.11
5.77
2.66
60.7
510
.98
42.7
451
.49
15.7
71.
5216
.74
3.80
91.5
689
.32
13.8
244
.56
56.3
510
.79
4.09
73.2
671
.23
17.0
59.
5180
.23
87.7
72.
920.
310.
470.
620.
454.
9910
7.05
97.5
4
11EB
ON
YI10
.07
-2.
421.
251.
8115
.55
7.64
-2.
181.
142.
1213
.08
9.01
-8.
782.
150.
212.
202.
6316
.20
15.9
711
.33
-7.
841.
602.
9015
.83
12.3
413
.98
3.65
-10
.34
1.92
0.25
0.39
0.52
0.37
3.34
20.7
717
.13
12ED
O11
.64
0.49
2.90
1.54
2.05
18.6
28.
701.
353.
480.
682.
3616
.57
10.2
53.
1512
.45
3.42
0.33
3.54
3.22
23.9
122
.96
12.9
03.
8815
.82
2.65
3.38
22.8
121
.85
15.9
23.
986.
9018
.84
3.20
0.29
0.44
0.61
0.42
4.01
31.7
927
.81
13EK
ITI10
.10
-2.
441.
251.
8415
.63
7.71
-2.
201.
152.
2113
.26
9.08
-8.
902.
170.
212.
222.
6516
.33
16.1
511
.43
-11
.29
1.62
2.89
15.9
415
.79
14.1
12.
94-
11.1
72.
420.
260.
390.
520.
373.
3521
.41
18.4
7
14EN
UGU
11.3
0-
2.76
1.38
2.44
17.8
78.
70-
2.48
0.65
2.43
14.2
510
.25
-9.
782.
440.
242.
502.
9518
.39
17.9
112
.90
-12
.73
1.82
3.23
17.9
517
.78
15.9
10.
62-
15.3
02.
730.
290.
440.
570.
423.
7224
.08
23.4
7
15G
OM
BE10
.52
-2.
591.
271.
8116
.19
8.17
-2.
331.
222.
1113
.83
9.64
-8.
972.
300.
222.
352.
6817
.18
16.5
212
.13
-11
.70
1.71
2.90
16.7
416
.31
14.9
63.
14-
11.8
22.
300.
270.
420.
530.
393.
3522
.22
19.0
7
16IM
O12
.02
3.26
3.90
1.94
2.19
23.3
29.
282.
263.
482.
162.
4519
.64
10.9
42.
6910
.87
3.44
0.33
3.56
3.11
24.0
721
.31
13.7
72.
5113
.16
2.36
3.42
22.0
618
.95
16.9
92.
754.
0418
.28
3.17
0.31
0.47
0.61
0.45
3.93
29.9
727
.22
17JI
GA
WA
13.2
7-
3.23
1.62
2.27
20.4
010
.20
-2.
901.
522.
6017
.22
12.0
2-
11.2
02.
870.
282.
943.
2821
.38
20.5
615
.13
-14
.98
2.14
3.63
20.9
020
.75
18.6
61.
04-
17.6
33.
200.
340.
520.
670.
494.
1027
.98
26.9
5
18KA
DUN
A15
.00
-3.
681.
822.
7123
.21
11.6
2-
3.31
1.73
3.02
19.6
813
.70
-12
.83
3.27
0.31
3.35
3.86
24.4
923
.62
17.2
4-
15.4
32.
444.
2023
.87
22.0
721
.27
1.82
-19
.45
3.64
0.39
0.59
0.75
0.56
4.97
32.1
830
.36
19KA
NO
18.5
6-
4.62
2.21
3.76
29.1
414
.56
-4.
152.
174.
2525
.13
17.1
7-
16.6
54.
090.
394.
205.
3231
.18
30.6
621
.61
-21
.17
3.05
5.62
30.2
829
.84
26.6
61.
95-
24.7
14.
570.
480.
740.
920.
706.
4740
.54
38.5
9
20KA
TSIN
A14
.30
-3.
511.
732.
5422
.08
11.0
8-
3.16
1.65
2.97
18.8
613
.06
-12
.29
3.11
0.30
3.19
3.72
23.3
822
.62
16.4
3-
15.7
62.
324.
0322
.78
22.1
120
.27
0.22
-20
.05
3.47
0.37
0.56
0.72
0.53
4.63
30.5
630
.34
21KE
BBI
11.9
3-
2.94
1.44
1.99
18.3
19.
26-
2.64
1.38
2.33
15.6
210
.92
-9.
342.
600.
252.
672.
9419
.39
17.8
013
.74
-13
.51
1.94
3.21
18.8
918
.66
16.9
62.
02-
14.9
32.
910.
310.
470.
600.
453.
7325
.41
23.3
9
22KO
GI
11.9
5-
2.93
1.44
2.04
18.3
69.
24-
2.63
1.38
2.32
15.5
710
.89
-10
.13
2.60
0.25
2.66
3.14
19.5
418
.78
13.7
1-
12.8
01.
943.
3018
.95
18.0
416
.92
1.21
-15
.71
2.90
0.31
0.47
0.60
0.45
3.82
25.4
624
.25
23KW
ARA
10.8
7-
2.67
1.31
1.84
16.7
08.
42-
2.40
1.26
2.16
14.2
49.
93-
9.74
2.37
0.23
2.43
2.71
17.6
617
.48
12.4
9-
12.3
91.
772.
9317
.19
17.0
915
.41
0.09
-15
.32
2.64
0.28
0.43
0.55
0.41
3.35
23.0
722
.98
24LA
GO
S17
.10
-4.
172.
0915
.37
38.7
313
.16
-3.
751.
9619
.25
38.1
215
.51
-11
.76
3.70
0.36
3.79
23.7
447
.09
43.3
419
.52
-15
.89
2.76
26.3
448
.62
44.9
924
.08
3.77
-20
.31
4.13
0.44
0.67
0.87
0.63
30.0
160
.82
57.0
6
25N
ASA
RAW
A10
.23
-2.
501.
241.
9915
.96
7.89
-2.
251.
181.
9913
.30
9.30
-8.
672.
220.
212.
272.
5016
.50
15.8
711
.71
-10
.22
1.65
2.69
16.0
514
.56
14.4
42.
17-
12.2
72.
470.
260.
400.
520.
383.
0721
.55
19.3
8
26N
IGER
13.8
7-
3.42
1.67
2.13
21.0
910
.78
-3.
071.
612.
4517
.91
12.7
0-
11.1
43.
030.
293.
103.
1522
.28
20.7
115
.99
-13
.82
2.26
3.39
21.6
319
.46
19.7
32.
99-
16.7
43.
380.
360.
550.
700.
523.
9129
.13
26.1
5
27O
GUN
11.6
3-
2.86
1.41
2.28
18.1
89.
01-
2.57
1.34
2.47
15.3
910
.62
-10
.41
2.53
0.24
2.59
3.08
19.0
718
.86
13.3
6-
13.1
01.
893.
3918
.64
18.3
916
.49
0.13
-16
.36
2.82
0.30
0.46
0.59
0.43
3.95
25.0
424
.91
28O
ND
O11
.28
11.9
66.
263.
142.
1134
.73
8.64
8.27
5.52
5.31
2.45
30.1
910
.18
9.83
19.5
95.
450.
525.
723.
0534
.76
34.3
412
.81
7.52
19.5
53.
253.
2726
.85
26.0
615
.81
3.32
13.5
025
.99
2.71
0.29
0.44
0.58
0.42
3.88
37.6
234
.30
29O
SUN
11.1
9-
2.71
1.35
2.05
17.3
18.
54-
2.43
0.71
2.36
14.0
510
.07
-9.
592.
400.
232.
463.
0018
.17
17.6
912
.67
-12
.41
1.79
3.25
17.7
117
.45
15.6
40.
36-
15.2
82.
680.
280.
430.
560.
413.
7323
.74
23.3
8
30O
YO13
.92
-3.
411.
692.
6721
.70
10.7
6-
3.07
1.61
3.14
18.5
712
.69
-11
.23
3.03
0.29
3.10
3.84
22.9
521
.49
15.9
7-
14.8
82.
264.
1722
.39
21.3
019
.70
0.64
-19
.05
3.38
0.36
0.55
0.70
0.52
4.60
29.8
029
.16
31PL
ATE
AU
11.7
8-
2.87
1.44
2.01
18.0
99.
04-
2.58
1.35
2.29
15.2
510
.65
-9.
652.
540.
242.
602.
9418
.99
17.9
813
.41
-12
.80
1.89
3.18
18.4
917
.88
16.5
40.
402.
2018
.34
2.83
0.30
0.46
0.60
0.44
3.71
27.0
826
.68
32RI
VER
S13
.04
76.0
925
.59
12.7
34.
3313
1.79
10.1
045
.93
16.6
129
.08
3.88
105.
6111
.91
44.4
755
.76
16.5
21.
5917
.54
5.42
97.4
596
.83
14.9
955
.98
68.8
112
.03
5.46
88.4
786
.30
18.4
91.
5888
.99
105.
893.
170.
330.
510.
660.
495.
7411
8.38
116.
79
33SO
KOTO
12.4
9-
3.05
1.53
2.11
19.1
79.
61-
2.74
1.43
2.61
16.3
911
.33
-11
.18
2.70
0.26
2.77
3.05
20.1
119
.96
14.2
5-
14.1
22.
013.
4119
.68
19.5
417
.59
1.03
-16
.56
3.01
0.32
0.49
0.63
0.46
3.88
26.3
925
.36
34TA
RABA
11.7
6-
2.89
1.43
2.06
18.1
39.
10-
2.59
1.36
2.07
15.1
210
.73
-10
.66
2.56
0.25
2.62
2.63
18.7
818
.71
13.5
0-
13.4
51.
912.
8618
.27
18.2
216
.66
0.03
-16
.63
2.85
0.30
0.46
0.59
0.44
3.33
24.6
424
.61
35YO
BE11
.57
-2.
861.
392.
0817
.90
9.03
-2.
571.
352.
0515
.00
10.6
5-
10.4
32.
540.
242.
602.
6618
.69
18.4
713
.40
-13
.17
1.89
2.95
18.2
418
.01
16.5
30.
57-
15.9
62.
830.
300.
460.
580.
443.
3724
.51
23.9
4
36ZA
MFA
RA11
.77
-2.
871.
442.
0218
.10
9.06
-2.
581.
352.
2815
.27
10.6
8-
9.96
2.55
0.25
2.61
2.90
18.9
818
.26
13.4
4-
12.5
11.
903.
1218
.46
17.5
316
.58
3.59
-12
.99
2.84
0.30
0.46
0.60
0.44
3.70
24.9
121
.32
37D
isput
ed D
eriv
.-
--
--
--
--
--
--
--
-0.
050.
05-
0.05
0.05
Rive
rs/A
kwa
Disp
uted
Fun
d-
--
--
--
-2.
732.
731.
243.
973.
97-
-0.
010.
01-
0.01
0.01
TOTA
L44
4.07
206.
4116
9.32
84.2
694
.35
998.
4234
2.50
144.
7015
2.14
108.
6210
6.66
854.
6240
3.74
174.
9954
1.43
150.
1414
.45
156.
2213
5.54
1,03
5.08
997.
7950
8.08
219.
9068
2.63
111.
95-
-14
7.41
987.
3394
1.99
626.
8686
.33
369.
9591
0.48
107.
4011
.35
17.4
422
.45
16.5
316
9.32
1,34
1.30
1,25
4.97
S/N
STA
TES
Firs
t Ha
lf 20
08Fi
rst H
alf
2009
Firs
t Ha
lf 20
10Fi
rst H
alf
2011
Firs
t Ha
lf 20
12
Sou
rce
: Fe
de
ratio
n A
cc
ou
nt
Allo
ca
tio
n,
Fed
era
l Min
istr
y o
f Fi
na
nc
e1
/ P
rov
isio
na
l2
/ In
clu
de
s th
e s
ha
re o
f O
il-p
rod
uc
ing
sta
tes
fro
m t
he
exc
ess
cru
de

Tab
le 1
8A
lloc
atio
n t
o L
oc
al G
ov
ern
me
nts
fro
m t
he
Fe
de
ratio
n a
nd
VA
T Po
ols
Ac
co
un
ts(N
air
a B
illio
n)
Sta
te
Fed
.
Ac
ct
Exc
ess
Cru
de
Bud
ge
t
Au
gm
e
nta
tion
Exc
ha
n
ge
Ga
inV
AT
Tota
l
Fed
.
Ac
ct
Exc
ess
Cru
de
Bud
ge
t
Au
gm
e
nta
tion
Exc
ha
n
ge
Ga
inV
AT
Tota
l
Fed
.
Ac
ct
Exc
ess
Cru
de
Bud
ge
t
Au
gm
e
nta
tion
Exc
ha
n
ge
Ga
inV
AT
Tota
l
Fed
.
Ac
ct
Exc
ess
Cru
de
Bud
ge
t
Au
gm
e
nta
tion
Exc
ha
n
ge
Ga
inV
AT
Tota
l
Fed
.
Ac
ct.
Exc
ess
Cru
de
Bud
ge
t
Au
gm
e
nta
tion
Exc
ha
n
ge
Ga
in
NN
PC
Refu
nd
sSU
RE-P
VA
TTo
tal
Ab
ia7.
26
0.90
1.75
-
1.3
11.2
5.85
0.82
1.57
-1.
39.
66.
83.
81.
50.
11.
713
.98.
17-
1.15
-1.
7911
.11
10.0
80.
281.
730.
180.
360.
272.
0714
.96
Ad
am
aw
a9.
18
1.12
2.25
-
1.4
13.9
6.74
1.06
2.02
-1.
611
.48.
14.
82.
00.
22.
017
.110
.51
-1.
49-
2.16
14.1
612
.97
0.36
2.22
0.23
0.48
0.34
2.47
19.0
8
Akw
a-I
bo
m11
.96
1.42
2.96
-
2.0
18.4
9.34
1.39
2.66
-2.
215
.611
.06.
42.
60.
33.
023
.313
.86
-1.
96-
3.39
19.2
117
.10
0.48
2.93
0.31
0.58
0.45
3.74
25.6
0
An
am
bra
9.18
1.12
2.23
-
1.6
14.1
7.02
1.05
2.00
-1.
811
.88.
34.
82.
00.
22.
217
.510
.42
-1.
47-
2.41
14.3
012
.86
0.36
2.20
0.23
0.50
0.34
2.76
19.2
5
Ba
uc
hi
10.4
1
1.25
2.58
-
1.5
15.8
8.12
1.21
2.31
-1.
813
.49.
65.
62.
30.
22.
219
.912
.05
-1.
70-
2.41
16.1
714
.87
0.41
2.55
0.27
0.49
0.39
2.75
21.7
4
Ba
yels
a3.
93
0.49
0.95
-
0.7
6.0
2.99
0.45
0.85
-0.
75.
03.
52.
00.
80.
10.
97.
44.
43-
0.63
-1.
026.
085.
470.
150.
940.
100.
190.
141.
228.
22
Be
nu
e10
.65
1.29
2.62
-
1.6
16.2
8.26
1.23
2.35
-1.
813
.79.
75.
62.
30.
22.
320
.212
.25
-1.
73-
2.51
16.5
015
.12
0.42
2.59
0.27
0.55
0.40
2.94
22.3
0
Bo
rno
12.0
11.
433.
01-
1.7
18.2
9.49
1.42
2.
70-
2.0
15.6
11.2
6.5
2.7
0.3
2.6
23.2
14.0
8-
1.99
-2.
7918
.86
17.3
80.
482.
980.
310.
610.
463.
2325
.44
Cro
ss-R
ive
r7.
740.
961.
87-
1.2
11.8
5.90
0.88
1.68
-1.
49.
87.
04.
01.
70.
21.
714
.68.
75-
1.24
-1.
8811
.87
10.8
00.
301.
850.
200.
400.
282.
1916
.02
De
lta10
.19
1.25
2.47
-1.
915
.87.
801.
162.
22-
2.0
13.2
9.2
5.3
2.2
0.2
2.8
19.7
11.5
7-
1.63
-2.
9816
.18
14.2
70.
402.
450.
260.
530.
383.
6121
.90
Eb
on
yi5.
460.
661.
33-
0.9
8.4
4.20
0.63
1.20
-1.
17.
15.
02.
91.
20.
11.
310
.46.
24-
0.88
-1.
448.
557.
690.
211.
320.
140.
280.
201.
6511
.50
Ed
o7.
850.
991.
87-
1.3
12.0
5.90
0.88
1.68
-1.
59.
97.
04.
01.
70.
22.
014
.88.
76-
1.24
-2.
0812
.08
10.8
10.
301.
850.
200.
430.
282.
4716
.34
Eki
ti6.
340.
781.
52-
1.0
9.7
4.80
0.72
1.37
-1.
38.
25.
73.
31.
40.
11.
511
.97.
13-
1.01
-1.
649.
778.
790.
241.
510.
160.
320.
231.
9013
.15
En
ug
u7.
410.
901.
80-
1.5
11.6
5.69
0.85
1.62
-1.
59.
66.
73.
91.
60.
21.
814
.18.
44-
1.19
-1.
9311
.57
10.4
20.
291.
780.
190.
370.
272.
2315
.55
Go
mb
e5.
300.
631.
32-
0.8
8.1
4.15
0.62
1.18
-1.
06.
94.
92.
81.
20.
11.
210
.26.
16-
0.87
-1.
318.
347.
600.
211.
300.
140.
260.
201.
5111
.23
Imo
10.6
81.
292.
61-
1.8
16.3
8.24
1.23
2.35
-2.
013
.89.
75.
62.
30.
22.
520
.412
.22
-1.
73-
2.74
16.6
915
.08
0.42
2.58
0.27
0.52
0.40
3.15
22.4
2
Jig
aw
a11
.35
1.40
2.74
-1.
817
.38.
651.
292.
46-
2.1
14.5
10.2
5.9
2.4
0.2
2.6
21.4
12.8
2-
1.81
-2.
8717
.51
15.8
20.
442.
710.
290.
560.
423.
2623
.49
Ka
du
na
12.0
21.
472.
94-
1.9
18.4
9.27
1.38
2.64
-2.
215
.510
.96.
32.
60.
32.
822
.913
.76
-1.
94-
3.00
18.6
916
.97
0.47
2.91
0.31
0.61
0.45
3.53
25.2
5
Ka
no
19.8
22.
424.
82-
3.5
30.6
15.2
22.
274.
34-
4.0
25.8
17.9
10.4
4.3
0.4
5.0
38.0
22.5
7-
3.19
-5.
3431
.10
27.8
50.
774.
770.
500.
970.
736.
1441
.75
Ka
tsin
a14
.45
1.76
3.53
-2.
322
.011
.13
1.66
3.17
-2.
718
.613
.17.
63.
10.
33.
327
.516
.50
-2.
33-
3.62
22.4
620
.36
0.57
3.49
0.37
0.73
0.54
4.16
30.2
1
Ke
bb
i8.
991.
102.
19-
1.4
13.7
6.91
1.03
1.97
-1.
611
.58.
14.
71.
90.
22.
017
.010
.25
-1.
45-
2.19
13.8
912
.65
0.35
2.17
0.23
0.45
0.33
2.54
18.7
2
Ko
gi
9.25
1.12
2.27
-1.
414
.07.
161.
072.
04-
1.6
11.9
8.4
4.9
2.0
0.2
2.1
17.7
10.6
3-
1.50
-2.
2414
.37
13.1
10.
362.
250.
240.
450.
352.
5919
.34
Kw
ara
7.10
0.86
1.74
-1.
010
.85.
500.
821.
57-
1.2
9.1
6.5
3.8
1.5
0.1
1.5
13.5
8.16
-1.
15-
1.66
10.9
810
.07
0.28
1.73
0.18
0.37
0.27
1.90
14.7
9
La
go
s12
.06
1.47
2.93
-9.
225
.79.
241.
382.
63-
12.0
25.3
10.9
6.3
2.6
0.3
14.2
34.3
13.7
1-
1.94
-15
.40
31.0
516
.92
0.47
2.90
0.31
0.65
0.45
17.8
239
.51
Na
ssa
raw
a5.
680.
691.
40-
1.0
8.8
4.40
0.66
1.25
-1.
07.
35.
23.
01.
20.
11.
210
.86.
53-
0.92
-1.
308.
768.
060.
221.
380.
150.
290.
211.
4911
.80
Nig
er
11.4
71.
392.
83-
1.6
17.3
8.92
1.33
2.54
-1.
914
.710
.56.
12.
50.
22.
421
.813
.23
-1.
87-
2.59
17.6
916
.33
0.45
2.80
0.30
0.58
0.43
2.98
23.8
7
Og
un
8.53
1.03
2.09
-1.
513
.26.
600.
981.
88-
1.6
11.1
7.8
4.5
1.9
0.2
2.0
16.4
9.79
-1.
38-
2.25
13.4
212
.08
0.34
2.07
0.22
0.44
0.32
2.61
18.0
8
On
do
7.95
0.97
1.93
-1.
312
.26.
090.
911.
74-
1.5
10.3
7.2
4.2
1.7
0.2
1.9
15.1
9.04
-1.
28-
2.03
12.3
411
.15
0.31
1.91
0.20
0.40
0.29
2.41
16.6
8
Osu
n10
.88
1.33
2.63
-1.
816
.68.
301.
242.
37-
2.0
14.0
9.8
5.7
2.3
0.2
2.6
20.6
12.3
2-
1.74
-2.
8216
.88
15.2
00.
422.
600.
280.
580.
403.
2422
.72
Oyo
13.7
61.
673.
37-
2.3
21.1
10.6
21.
583.
03-
2.7
17.9
12.5
7.3
3.0
0.3
3.3
26.4
15.7
5-
2.23
-3.
6321
.60
19.4
30.
543.
330.
350.
700.
514.
0628
.93
Pla
tea
u7.
870.
961.
93-
1.2
12.0
6.08
0.91
1.73
-1.
410
.17.
24.
21.
70.
21.
815
.09.
02-
1.27
-1.
9112
.20
11.1
20.
311.
910.
200.
390.
292.
2216
.45
Riv
ers
10.3
61.
262.
52-
2.8
17.0
7.96
1.19
2.27
-2.
714
.19.
45.
42.
20.
23.
620
.911
.81
-1.
67-
3.68
17.1
514
.57
0.41
2.50
0.26
0.51
0.38
3.94
22.5
7
So
koto
9.92
1.21
2.42
-1.
515
.17.
631.
142.
17-
1.9
12.8
9.0
5.2
2.1
0.2
2.2
18.8
11.3
2-
1.60
-2.
4515
.37
13.9
60.
392.
390.
250.
500.
372.
8020
.67
Ta
rab
a7.
840.
961.
93-
1.2
11.9
6.07
0.91
1.73
-1.
29.
97.
24.
21.
70.
21.
514
.79.
01-
1.27
-1.
6211
.91
11.1
20.
311.
900.
200.
390.
291.
8916
.11
Yo
be
7.56
0.92
1.87
-1.
211
.65.
890.
881.
68-
1.2
9.7
6.9
4.0
1.7
0.2
1.6
14.4
8.74
-1.
23-
1.74
11.7
110
.78
0.30
1.85
0.20
0.39
0.28
1.99
15.7
8
Za
mfa
ra7.
170.
881.
75-
1.1
10.9
5.53
0.82
1.57
-1.
29.
26.
53.
81.
60.
11.
613
.68.
20-
1.16
-1.
6711
.03
10.1
20.
281.
730.
180.
340.
271.
9814
.91
FC
T A
bu
ja2.
770.
290.
75-
2.7
6.5
2.35
0.35
0.67
-2.
45.
72.
81.
60.
70.
13.
99.
03.
49-
0.49
-4.
708.
684.
310.
120.
740.
080.
140.
115.
0710
.56
TOTA
L34
2.4
41.7
83.7
-66
.053
3.8
264.
139
.475
.2-
74.7
453.
331
1.3
180.
574
.27.
194
.966
8.0
391.
700.
0055
.35
0.00
103.
1955
0.25
483.
2913
.44
82.8
18.
7517
.31
12.7
411
8.52
736.
86
Firs
t Ha
lf 20
08Fi
rst H
alf
2009
Firs
t Ha
lf 20
10Fi
rst H
alf
2011
Firs
t Ha
lf 20
12 1
/
Sou
rce
: Fe
de
ratio
n A
cc
ou
nt
Allo
ca
tion
, Fe
de
ral M
inist
ry o
f Fin
an
ce
1/ P
rovi
sion
al
VA
T: V
alu
e A
dd
ed
Ta
x
LGA
: Lo
ca
l Go
vern
me
nts
Are
as
CBN Half Year Economic Report for 2012
103

Table 19Domestic Debt of the Federal Government
(Naira Billion)
First Half
2008
First Half
2009
First Half
2010
First Half
2011
First Half
2012 1/
1. Composition of Debt
i Treasury Bills 574.93
641.93
901.02 1,561.42 2,084.59
ii Treasury Bonds 402.26
392.07
392.07 372.90 353.73
iii Development Stocks 0.52
0.52
0.22 - 0.00
iv FGN Bonds 1,361.25
1,778.27
2,408.43 3,276.11 3,714.55
v Promissory Note -
-
63.03 - 0.00
Total 2,338.96
2,812.79
3,764.76 5,210.44 6,152.87
2. Holders
i Banking System 1,922.70 1,984.14 2,662.82 3,914.99 3,824.81
a. Central Bank 288.39 286.95 440.37 310.93 439.62
b. Deposit Money Banks 1,634.31 1,697.19 2,222.45 3,604.06 3,385.19
ii Non-Bank Public 296.03 699.69 931.38 1,141.75 2,166.11
iii Sinking Fund 120.23 128.96 170.57 153.70 161.95
Total Debt Outstanding 2,338.96 2,812.79 3,764.76 5,210.44 6,152.87
1/ Provisional
Source: Debt Management Office
Table 20Domestic Debt Service Payments of the Federal Government
By Instruments (Naira Billion)
1st Half
2008
1st Half
2009
1st Half
2010
1st Half
2011
1st Half
2012 1/
i Treasury Bills 23.50
16.29
14.23 73.38 173.60
ii Treasury Bonds 24.99
29.22
18.75 18.75 18.75
iv Development Stocks 0.14 0.03 0.33 0.23 -
v FGN Bonds 72.25
85.60
111.87 136.24 156.55
Total 120.88
131.14
145.18 228.61 348.90
Source: Debt Management Office
1/ Provisional
NB: Debt Service excludes sinking fund charges
CBN Half Year Economic Report for 2012
104

Table 21External Debt Outstanding
(US$ Million)
Holders
First Half
2008
First Half
2009
First Half
2010
First Half
2011
First Half
2012 1/
1. Multilateral 3,191.50
3,219.65
3,860.68
4,563.39
4,950.66
2. Paris Club -
-
-
-
-
3. London Club -
-
-
-
-
4. Promissory Notes -
-
-
-
-
5. Others 2/ 563.60
499.59
409.03
834.65
1,085.00
Total Debt Outstanding 3,755.10 3,719.24 4,269.71 5,398.04 6,035.66
Source: Debt Management Office (DMO)
1/ Provisional Debt Position as at end-June 2012
2/ Includes Non-Paris Bilateral and Commercial debts and euro bond
Table 22External Debt Service Payments
(US$ Billion)
First Half
2008
First Half
2009
First Half
2010
First Half
2011
First Half
2012 1/
London Club -
-
-
-
-
Paris Club -
-
-
-
-
Multilateral 211.26
157.73
133.88
116.37
63.81
(i) I. B. R.D. 56.64
55.26
46.92
27.82
6.89
(ii) E. I. B. -
-
1.59
-
-
(iii) A.D.B. & Others 154.62
102.47
85.37
88.55
56.92
Promissory Notes -
-
-
-
-
Others 2/ 8.66
26.47
43.72
60.10
88.35
Total 219.92 184.20 177.60 176.47 152.16
Source: Debt Management Office
1/ Provisional
2/ Includes Non-Paris Bilateral and Non-Paris Commercial Debts
CBN Half Year Economic Report for 2012
105
Table 23Consolidated Debt Outstanding
(Naira Billion)
Holders
First Half
2008
First Half
2009
First Half
2010
First Half
2011
First Half
2012 1/
External Debt 442.34 551.26 640.41 827.56 950.61
Domestic Debt 2,338.96
2,812.79
3,764.76 5,210.44 6,152.87
Total Consolidated Debt 2,781.30 3,364.05 4,405.18 6,038.00 7,103.48
Source: Debt Management Office (DMO)
1/ Provisional
Table 24Selected Debt Indicators
(Per cent)
First Half 2008
First Half 2009
First Half 2010
First Half 2011 1/
First Half 2012 1/
External Debt/GDP 1.5 4.4 4.9 6.0 2.4
Domestic Debt/GDP 7.8 22.7 28.8 38.6 15.5
Total Debt/GDP 9.3 27.1 33.7 44.5 17.7
External Debt/Export 10.8 10.2 11.9 12.8 12.3
Total Debt/FG. Retained Revenue 202.6 242.0 221.5 357.2 407.8
Domestic Debt Service/Revenue 8.5 9.4 7.3 11.5 20.0
Total Debt Service/GDP 0.5 1.3 1.3 1.6 0.9
Total Debt Service/FG-Retained Rev. 10.4 11.4 8.6 12.7 21.4
Domestic Debt Service/GDP 1.1 1.1 1.4 93.6
External Debt Service/GDP 0.2 0.2 0.1 2.0
Domestic Debt Stock/FG Retained Rev. 202.3 189.3 309.4 353.2
Nominal GDP 12,397.12 13,061.11 15,955.63 40,246.79
1/ Provisional
CBN Half Year Economic Report for 2012
106
Tab
le 2
5G
ross
Do
me
stic
Pro
du
ct
at
19
90
Co
nst
an
t B
asi
c P
ric
es
(Na
ira
Bill
ion
un
less
oth
erw
ise
sta
ted
)
Firs
t H
alf 2
010 1
/Fi
rst
Ha
lf 2
011 2
/Fi
rst
Ha
lf 2
012 2
/
1. A
gric
ultu
re130.9
3138.4
8144.1
139.1
038.5
137.6
7
(a
) C
rop
Pro
du
ctio
n1
13
.87
12
0.3
3
12
4.8
63
4.0
13
3.4
73
2.6
4
(b
) Li
ve
sto
ck
9.9
8
10
.65
11
.30
2.9
82
.96
2.9
5
(c
) Fo
rest
ry2
.00
2.1
2
2.2
40
.60
0.5
90
.59
(d
) Fi
shin
g5
.08
5.3
9
5.7
11
.52
1.5
01
.49
2. In
du
stry
66.8
267.8
667.9
319.9
618.8
717.7
6
(a
) C
rud
e P
etr
ole
um
57
.08
57
.37
56
.61
17
.05
15
.95
14
.80
(b
) M
inin
g &
Qu
arr
yin
g1
.07
1.2
0
1.3
40
.32
0.3
30
.35
(c
) M
an
ufa
ctu
rin
g8
.68
9.2
9
9.9
72
.59
2.5
82
.61
3. B
uild
ing
& C
on
stru
ctio
n7.7
8
8.7
7
9.9
12.3
22.4
42.5
9
4. W
ho
lesa
le &
Re
tail
Tra
de
63.9
6
70.8
2
76.7
819.1
019.6
920.0
7
5. Se
rvic
es
65.3
673.6
483.7
919.5
220.4
821.9
1
(a
) Tr
an
spo
rt9
.84
10
.44
11
.09
2.9
42
.90
2.9
0
(b
) C
om
mu
nic
atio
n1
5.8
8
21
.21
28
.18
4.7
45
.90
7.3
7
(c
) U
tilit
ies
9.9
51
0.2
51
0.5
72
.97
2.8
52
.76
(d
) H
ote
l & R
est
au
ran
t1
.89
2.1
22
.38
0.5
60
.59
0.6
2
(e
) Fi
na
nc
e &
In
sura
nc
e1
4.1
41
4.7
61
5.3
84
.22
4.1
04
.02
(f
) R
ea
l Est
ate
& B
usi
ne
ss S
erv
ice
s6
.85
7.5
18
.29
2.0
52
.09
2.1
7
(h
) P
rod
uc
ers
of
Go
vt.
Se
rvic
es
3.4
73
.67
3.8
71
.04
1.0
21
.01
(I
) C
om
m.,
So
cia
l & P
ers
. Se
rvic
es
3.3
33
.68
4.0
51
.00
1.0
21
.06
TOTA
L (G
DP)
334.8
5359.5
7382.5
2100.0
0100.0
0100.0
0
NO
N-O
IL (
GD
P)
277.7
7302.2
0325.9
182.9
584.0
585.2
0
TOTA
L G
DP G
RO
WTH
RA
TE (
%)
7.5
77.3
86.3
8
O
IL G
DP G
RO
WTH
RA
TE (
%)
4.5
00.5
0(1
.31)
N
ON
-OIL
GD
P G
RO
WTH
RA
TE (
%)
8.2
28.7
97.8
4
O
f w
hic
h: A
gric
ultu
re (
%)
5.5
85
.77
4.0
6
In
du
stry
(%
)4
.93
1.5
50
.11
B
uild
ing
& C
on
stru
ctio
n (
%)
12
.50
12
.78
12
.94
W
ho
lesa
le &
Re
tail
Tra
de
(%
)1
0.3
61
0.7
28
.43
Se
rvic
es
(%)
11
.27
12
.67
13
.79
Sou
rce
: N
atio
na
l Bu
rea
u o
f St
atist
ics
1/
Re
vis
ed
2/
Pro
vis
ion
al
Ac
tivity
Se
cto
rFi
rst
Ha
lf 2
010 1
/Fi
rst
Ha
lf 2
011 2
/Fi
rst
Ha
lf 2
012 2
/Sh
are
of To
tal G
DP (
Pe
r C
en
t)
CBN Half Year Economic Report for 2012
107

Table 26Gross Domestic Product at Current Basic Prices
(Naira Billion unless otherwise stated)
First Half 2010 1/ First Half 2011 2/ First Half 2012 2/
1. Agriculture 4,328.35 4,939.62 5,448.75 27.98 28.26 28.48
(a) Crop Production 3,796.52
4,321.05
4,754.10 24.54 24.72 24.85
(b) Livestock 306.48
357.42
401.76 1.98 2.04 2.10
(c) Forestry 59.36
66.57
74.24 0.38 0.38 0.39
(d) Fishing 165.98
194.58
218.65 1.07 1.11 1.14
2. Industry 6,971.50 7,631.31 8,019.35 45.07 43.65 41.92
(a) Crude Petroleum 6,769.83
7,400.35
7,760.58 43.76 42.33 40.56
(b) Mining & Quarrying 20.67
24.29
26.30 0.13 0.14 0.14
(c) Manufacturing 181.00
206.68
232.47 1.17 1.18 1.22
3. Building & Construction 199.20
236.12
274.27 1.29 1.35 1.43
4. Wholesale & Retail Trade 2,339.45
2,804.66
3,231.47 15.12 16.04 16.89
5. Services 1,631.21 1,869.61 2,157.54 10.54 10.69 11.28
(a) Transport 244.30
267.82
310.30 1.58 1.53 1.62
(b) Communication 126.48 154.73 183.65 0.82 0.89 0.96
(c) Utilities 33.27 39.24 43.70 0.22 0.22 0.23
(d) Hotel & Restaurant 53.73 62.11 70.71 0.35 0.36 0.37
(e) Finance & Insurance 258.75 294.18 327.73 1.67 1.68 1.71
(f) Real Estate & Business Services 610.45 702.72 820.09 3.95 4.02 4.29
(h) Producers of Govt. Services 144.28 164.25 183.21 0.93 0.94 0.96
(I) Comm., Social & Pers. Services 159.96 184.56 218.14 1.03 1.06 1.14
TOTAL (GDP) 15,469.72 17,481.32 19,131.38 100.00 100.00 100.00
NON-OIL (GDP) 8,699.89 10,080.98 11,370.80 56.24 57.67 59.44
TOTAL GDP GROWTH RATE (%) 36.50 13.00 9.44
OIL GDP GROWTH RATE (%) 86.90 9.31 4.87
NON-OIL GDP GROWTH RATE (%) 12.82 15.87 12.79
Of which: Agriculture (%) 12.50 14.12 10.31
Industry (%) 82.92 9.46 5.08
Building & Construction (%) 13.74 18.53 16.16
Wholesale & Retail Trade (%) 14.40 19.89 15.22
Services (%) 12.15 14.61 15.40
Source: National Bureau of Statistics
1/ Revised
2/ Provisional
Activity Sector First Half 2010 1/ First Half 2011 2/ First Half 2012 2/Share of Total GDP (Per Cent)
CBN Half Year Economic Report for 2012
108
Table 27Selected Real Sector Indicators
(Per cent, except otherwise indicated)
2008 2009 2010 2011 2012/1
First Half First Half First Half First Half First Half
Agricultural Production Index (1990=100)
Aggregate 204.2 215.3 228.0 240.8 250.7
Crops 239.7 252.8 267.5 282.2 292.9
Staples 260.5 274.7 290.9 307.2 319.8
Other Crops 178.4 188.1 198.9 209.8 218.2
Livestock 143.3 151.1 160.7 171.1 181.5
Fishery 95.5 100.7 109.3 115.9 122.9
Forestry 156.1 164.6 171.6 181.0 191.7
Indices of Average World Prices of Nigeria's Major Agricultural Export
Commodities (1990=100) (Dollar Based)
All Commodities 372.0 346.6 435.9 448.8 331.2
Cocoa 379.8 373.8 470.8 464.3 334.5
Coffee 202.3 190.6 235.3 396.6 280.0
Cotton 92.6 69.3 103.5 235.5 295.2
Palm Oil 343.4 195.6 240.6 362.3 369.3
Copra 418.5 208.5 258.7 591.2 280.0
Soya Bean 201.7 153.9 142.3 203.9 200.5
GROWTH RATE OVER THE PRECEEDING PERIOD (%)
Agricultural Production Index (1990=100)
Aggregate 4.8 5.4 5.9 5.6 4.1
Crops 4.7 5.5 5.8 5.5 3.8
Staples 4.9 5.5 5.9 5.6 4.1
Other Crops 5.3 5.4 5.7 5.5 4.0
Livestock 5.8 5.5 6.4 6.4 6.1
Fishery 4.1 5.5 8.5 6.1 6.0
Forestry 1.2 5.4 4.2 5.5 5.9
Indices of Average World Prices of Nigeria's Major Agricultural Export
Commodities (1990=100) (Dollar Based)
All Commodities 2.4 -6.8 25.7 3.0 -26.2
Cocoa 2.0 -1.6 26.0 -1.4 -28.0
Coffee 1.6 -5.8 23.5 68.5 -29.4
Cotton 1.3 -25.2 49.3 127.6 25.4
Palm Oil 0.9 -43.0 23.0 50.6 1.9
Copra 0.5 -50.2 24.1 128.5 -52.6
Soya Bean 0.1 -23.7 -7.5 43.3 -1.6
Industrial Production Index (1990 = 100)
Industrial Production Index 118.7 117.4 121.0 128.8 136.5
Manufacturing Production Index 90.9 91.9 93.5 98.9 106.1
Mining Production Index 130.2 126.8 129.8 140.6 146.7
Electricity Production Index 196.6 194.3 205.8 202.7 206.1
Capacity Utilization Rate (%) 54.2 53.8 54.9 57.0 57.0
Inflation Rate (12-Month Moving Average) 7.0 13.7 13.1 12.3 11.3
Inflation Rate (Year-on-Year) 12.0 11.2 14.1 10.2 12.9
Food Inflation Rate (Year-on-Year) 18.1 13.1 15.1 9.2 12.0
Non-Food Inflation Rate (Year-on-Year) 3.6 8.5 12.7 11.5 12.7
1/Provisional
Item
CBN Half Year Economic Report for 2012
109
Table 27 cont'dSelected Real Sector Indicators
(Per cent, except otherwise indicated)
2012 2/
First Half Second Half First Half
(1) (2) (3) (1) & (3) (2) & (3) (1) & (3) (2) & (3)
World Crude Oil Production
million barrels per day (mbd)
OPEC 33.87 34.09 34.40 35.55 37.04 2.64 1.49 7.67 4.19
Crudes 29.18 29.20 29.20 30.13 31.49 2.29 1.36 7.84 4.51
NGLs and condensates 4.69 4.90 5.20 5.42 5.55 0.35 0.13 6.73 2.40
Total non-OPEC 51.88 52.36 52.76 52.46 52.97 0.21 0.51 0.40 0.97
Total World Supply 85.75 86.45 87.16 88.01 90.01 2.85 2.00 3.27 2.27
Demand
OECD 45.14 45.92 45.75 45.85 45.08 -0.67 -0.77 -1.46 -1.68
Non-OECD 39.65 40.66 41.35 42.75 42.57 1.22 -0.18 2.95 -0.42
Total World Demand 84.79 86.58 87.10 88.60 87.65 0.55 -0.95 0.63 -1.07
Nigeria
Output 2.06 2.18 2.14 2.21 2.09 -0.05 -0.12 -2.34 -5.43
Exports 1.61 1.73 1.69 1.76 1.64 -0.05 -0.12 -2.96 -6.82
Domestic Consumption 0.45 0.45 0.45 0.45 0.45 0.00 0.00 0.00 0.00Average Spot Price of Selected
Crude Oil
at the International Oil Market (US$)
UK Brent 78.35 82.30 111.91 112.40 113.73 1.82 1.33 1.63 1.18
Arab Light
West Texas Intermediate (WTI) 78.70 81.25 98.62 90.96 95.06 -3.56 4.10 -3.61 4.51
Bonny Light 79.47 83.02 113.86 114.01 115.05 1.19 1.04 1.05 0.91
Forcados 79.09 83.63 114.40 115.06 116.80 2.40 1.74 2.10 1.51
OPEC Basket 75.99 78.78 105.78 108.21 112.52 6.74 4.31 6.37 3.98
Gas Activities
(MMm3)
Gas Produced 50.22 32.83 27.32 35.98 34.10 6.78 -1.88 24.82 -5.23
Gas sold to Industries
Gas sold for LNG
Gas used as Fuel
Gas Reinjected
Gas Lift
Gas Converted to NGLs
Total Gas Utilised 41.64 24.20 20.82 29.24 28.08 7.26 -1.16 34.87 -3.97
Gas Utilised as % of Gas Produced 82.92 73.71 76.21 81.27 82.35 6.14 1.08 8.05 1.33
Gas Flared 6.12 8.58 6.50 6.74 6.02 -0.48 -0.72 -7.38 -10.68
Gas Flared as % Gas Produced 12.28 26.14 23.79 18.73 17.65 -6.14 -1.08 -25.80 -5.76
Sources: OPEC, NNPC, Reuters & CBN Estimates
1/ Revised
2/ Provisional
Item
2010 2011 1/ Absolute Change
Between
Percentage
Change BetweenFirst Half Second Half
CBN Half Year Economic Report for 2012
110

Table 28Composite Consumer Price Index
(November 2009=1000
Monthly
Index
Inflation,
y-o-y(%)
12-month
Average
Index
Inflation
12-month
Average(%)
Monthly
Index
Inflation
y-o-y(%)
Inflation
12-month
Average (%)
Monthly
Index
Inflation
y-o-y(%)
Inflation
12-month
Average (%)
2008
January 79.1 8.6 76.8 5.5 84.4 2.5 7.9 75.5 12.6 2.9
February 79.3 8.0 77.3 5.5 85.5 6.4 7.5 75.2 8.7 3.3
March 79.9 7.8 77.8 5.8 82.2 0.5 6.8 78.2 12.4 4.2
April 81.1 8.2 78.3 6.1 83.5 1.2 6.4 79.4 13.1 5.1
May 82.7 9.7 78.9 6.5 85.7 3.3 6.3 80.8 14.7 6.1
June 85.7 12.0 79.6 7.0 87.9 3.6 5.8 84.5 18.1 7.4
July 87.6 14.0 80.5 7.8 89.4 4.8 5.4 86.7 20.9 9.0
August 88.6 12.4 81.3 8.5 90.0 3.9 4.8 87.7 18.8 10.7
September 89.6 13.0 82.2 9.2 91.3 6.9 4.5 88.5 17.1 12.3
October 89.0 14.7 83.2 10.1 90.8 7.9 4.3 88.0 19.2 14.0
November 89.0 14.8 84.1 10.9 90.3 9.3 4.5 88.1 18.1 15.3
December 89.7 15.1 85.1 11.6 91.2 10.4 5.1 88.6 18.0 16.1
2009
January 90.2 14.0 86.0 12.0 91.1 8.0 5.5 89.5 18.4 16.5
February 90.8 14.6 87.0 12.6 91.7 7.2 5.6 90.2 20.0 17.5
March 91.4 14.4 87.9 13.1 92.0 11.8 6.5 90.9 16.2 17.7
April 91.9 13.3 88.8 13.5 92.5 10.9 7.3 91.6 15.3 17.9
May 93.6 13.2 89.8 13.8 94.2 9.9 7.8 93.5 15.7 17.9
June 95.3 11.2 90.6 13.7 95.3 8.5 8.3 95.6 13.1 17.5
July 97.3 11.1 91.4 13.4 96.8 8.3 8.6 97.9 12.9 16.8
August 98.4 11.0 92.2 13.3 97.3 8.0 8.9 98.9 12.7 16.3
September 98.9 10.4 93.0 13.1 98.1 7.4 8.9 99.5 12.5 15.9
October 99.4 11.6 93.8 12.8 98.9 8.9 9.0 99.9 13.5 15.4
November 100.0 12.4 94.7 12.6 100.0 10.7 9.1 100.0 13.5 15.0
December 102.2 13.9 95.8 12.5 101.5 11.2 9.2 102.4 15.5 14.8
2010
January 103.1 14.4 96.9 12.6 102.1 12.1 9.6 103.7 15.9 14.7
February 105.0 15.6 98.0 12.7 104.5 14.0 10.1 104.8 16.2 14.4
March 104.9 14.8 99.2 12.8 104.1 13.2 10.3 105.3 15.8 14.4
April 105.7 15.0 100.3 12.9 104.4 12.8 10.4 106.6 16.3 14.5
May 105.7 12.9 101.3 12.9 105.2 11.7 10.6 105.7 13.0 14.3
June 108.8 14.1 102.4 13.1 107.4 12.7 10.9 110.0 15.1 14.4
July 109.9 13.0 103.5 13.3 107.7 11.3 11.2 111.6 14.0 14.5
August 111.9 13.7 104.6 13.5 109.3 12.4 11.5 113.8 15.1 14.7
September 112.4 13.6 105.7 13.8 110.7 12.8 12.0 114.0 14.6 14.9
October 112.7 13.4 106.9 13.9 111.9 13.2 12.3 114.0 14.1 14.9
November 112.8 12.8 107.9 13.9 111.7 11.7 12.4 114.4 14.4 15.0
December 114.2 11.8 108.9 13.7 112.6 10.9 12.4 115.4 12.7 14.7
2011
January 115.6 12.1 110.0 13.5 114.5 12.1 12.4 114.3 10.3 14.2
February 116.7 11.1 110.9 13.2 115.5 10.6 12.1 117.7 12.2 13.9
March 118.3 12.8 112.1 13.0 117.5 12.8 12.1 118.1 12.2 13.6
April 117.7 11.3 113.0 12.7 117.9 12.9 12.1 119.0 11.6 13.2
May 118.7 12.4 114.1 12.6 118.9 13.0 12.2 118.5 12.2 13.2
June 119.9 10.2 115.1 12.3 119.8 11.5 12.1 120.1 9.2 12.7
July 120.3 9.4 115.9 12.0 120.1 11.5 12.1 120.4 7.9 12.1
August 122.3 9.3 116.8 11.6 121.2 10.9 12.0 123.7 8.7 11.6
September 124.0 10.3 117.8 11.4 123.5 11.6 11.9 124.8 9.5 11.2
October 124.6 10.5 118.8 11.1 124.8 11.5 11.7 125.0 9.7 10.8
November 124.7 10.5 119.7 11.0 124.6 11.5 11.7 125.4 9.6 10.4
December 126.0 10.3 120.7 10.8 124.8 10.8 11.7 128.1 11.0 10.3
2012
January 130.2 12.6 121.9 10.9 129.1 12.7 11.8 129.3 13.1 10.5
February 130.5 11.9 123.1 11.0 129.3 11.9 11.9 129.1 9.7 10.3
March 132.6 12.1 124.3 10.9 135.1 15.0 12.1 132.1 11.8 10.3
April 132.8 12.9 125.5 11.1 135.2 14.7 12.2 132.3 11.2 10.3
May 133.8 12.7 126.8 11.1 136.7 14.9 12.4 133.9 12.9 10.4
June 135.3 12.9 128.1 11.3 138.0 15.2 12.7 134.5 12.0 10.6
Source: National Bureau of Statistics (NBS)
FoodAll Items less Farm Produce (Core)All Item (Headline)
CBN Half Year Economic Report for 2012
111

Table 29Urban and Rural Consumer Price Index
(November 2009=1000
All-Items
(Headline)
Headline
Inflation
y-o-y(%)
All Items
less Farm
Produce
(Core)
Core
Inflation
y-o-y(%) Food
Food
Inflation
y-o-y(%)
All-Items
(Headline)
Headline
Inflation,
y-o-y(%)
All Items
less Farm
Produce
(Core)
Core
Inflation
y-o-y(%) Food
Food
Inflation
y-o-y(%)
2008
January 84.0 12.7 89.9 12.0 80.8 12.9 76.7 6.5 81.7 -1.8 73.7 12.5
February 85.2 13.1 90.9 13.2 82.1 12.5 76.4 5.5 83.0 3.1 72.7 7.2
March 85.4 10.1 91.2 10.6 82.3 9.7 77.2 6.6 78.0 -4.3 76.8 13.4
April 86.9 11.1 92.5 12.1 83.9 10.6 78.4 6.7 79.2 -3.9 77.9 14.1
May 87.3 10.3 92.8 8.0 84.6 12.3 80.4 9.4 82.3 1.0 79.5 15.7
June 89.1 11.5 94.7 10.5 86.2 12.8 84.1 12.3 84.6 0.1 83.9 20.0
July 90.4 12.9 96.6 10.1 87.3 15.6 86.2 14.5 85.9 2.0 86.5 22.9
August 91.9 12.1 98.2 10.6 88.5 13.9 87.0 12.5 86.1 0.5 87.4 20.6
September 92.3 13.5 97.9 10.6 89.2 16.0 88.3 12.8 88.2 5.0 88.2 17.6
October 92.1 13.8 97.8 10.5 88.9 16.4 87.6 15.2 87.4 6.6 87.7 20.1
November 91.9 12.0 96.8 8.3 89.3 14.9 87.6 16.3 87.3 10.1 87.7 19.3
December 92.8 11.4 97.8 7.8 89.6 13.6 88.2 17.0 88.1 11.8 88.3 19.6
2009
January 92.8 10.4 96.6 7.5 90.5 12.0 88.9 15.9 88.5 8.3 89.1 20.9
February 93.6 9.8 96.3 5.9 92.0 12.1 89.5 17.2 89.5 7.8 89.6 23.2
March 93.9 9.9 96.5 5.8 92.4 12.3 90.2 16.7 89.8 15.1 90.5 17.8
April 94.3 8.6 97.4 5.3 92.5 10.3 90.7 15.7 90.2 13.9 91.3 17.2
May 95.7 9.5 98.2 5.8 94.1 11.2 92.6 15.1 92.3 12.2 93.3 17.4
June 97.2 9.2 98.8 4.3 96.3 11.7 94.4 12.2 93.7 10.8 95.4 13.7
July 98.9 9.3 99.5 3.0 98.4 12.7 96.5 12.0 95.5 11.2 97.7 12.9
August 99.6 8.4 99.7 1.5 99.3 12.2 97.8 12.4 96.1 11.6 98.8 13.0
September 99.8 8.1 99.5 1.6 99.8 11.9 98.5 11.5 97.4 10.4 99.4 12.7
October 99.8 8.3 99.9 2.1 99.6 12.0 99.2 13.2 98.4 12.6 100.0 14.0
November 100.0 8.8 100.0 3.3 100.0 12.0 100.0 14.2 100.0 14.5 100.0 14.0
December 101.4 9.3 101.3 3.6 101.6 13.4 102.8 16.6 101.7 15.4 103.1 16.8
2010
January 102.6 10.5 102.5 6.1 102.8 13.6 103.6 16.5 101.9 15.1 104.4 17.2
February 104.4 11.6 105.4 9.4 102.9 11.8 105.6 17.9 103.8 16.0 106.4 18.8
March 106.0 12.9 105.7 9.5 106.1 14.8 104.0 15.3 102.8 14.5 104.6 15.6
April 105.9 12.2 105.4 8.2 106.3 14.9 105.6 16.4 103.6 14.9 106.8 17.0
May 103.8 8.5 103.7 5.6 103.8 10.3 107.2 15.8 106.5 15.4 107.2 14.9
June 107.7 10.8 107.0 8.3 108.5 12.7 109.6 16.1 107.8 15.0 111.2 16.6
July 109.1 10.3 107.9 8.4 110.4 12.2 110.7 14.6 107.6 12.7 112.6 15.3
August 110.5 10.9 109.0 9.3 112.8 13.6 113.0 15.6 109.6 14.0 114.7 16.1
September 110.6 10.9 109.4 9.9 112.6 12.8 113.8 15.6 111.7 14.7 115.1 15.8
October 111.2 11.5 110.0 10.1 113.5 14.0 114.0 15.0 113.5 15.3 114.4 14.4
November 111.7 11.7 111.3 11.3 112.8 12.8 113.6 13.6 112.1 12.1 115.7 15.7
December 112.2 10.7 111.2 9.8 113.4 11.6 115.9 12.7 113.8 11.9 117.1 13.6
2011
January 110.7 7.9 108.5 5.9 111.7 8.7 119.7 15.6 119.5 17.3 116.5 14.4
February 114.2 9.4 114.1 8.3 115.5 12.2 118.8 12.5 116.7 12.4 119.4 12.7
March 115.0 8.5 114.9 8.7 116.0 9.3 121.1 16.4 119.6 16.3 119.9 14.6
April 115.5 9.1 116.3 10.3 116.4 9.5 119.4 13.1 119.2 15.1 121.1 13.4
May 115.8 11.5 116.8 12.6 116.7 12.4 121.2 13.0 120.6 13.2 120.1 12.0
June 116.6 8.3 116.6 9.0 118.0 8.8 122.6 11.8 122.4 13.5 121.9 9.6
July 116.3 6.6 116.8 8.2 118.0 6.9 123.6 11.7 122.8 14.1 122.4 8.7
August 118.3 7.1 118.7 8.9 119.9 6.3 125.6 11.1 123.3 12.5 126.9 10.6
September 120.0 8.4 121.3 10.9 120.7 7.2 127.4 11.9 125.3 12.2 128.2 11.4
October 119.9 7.8 121.2 10.2 120.9 6.5 128.6 12.8 127.8 12.6 128.4 12.2
November 120.0 7.4 121.1 8.8 120.8 7.1 128.6 13.1 127.4 13.6 129.1 11.6
December 122.3 9.0 122.0 9.7 124.5 9.8 129.0 11.3 127.1 11.7 131.1 12.0
2012
January 128.9 16.4 128.2 18.2 125.5 12.4 131.3 9.7 129.9 8.7 132.4 10.9
February 129.2 13.1 128.4 12.5 126.3 9.4 131.6 10.9 130.0 11.4 131.8 9.9
March 130.7 13.7 132.6 15.4 129.1 11.3 134.4 11.0 137.1 14.6 134.9 11.4
April 131.1 13.4 133.0 14.4 129.4 11.2 134.4 12.5 137.0 14.9 135.0 11.5
May 132.1 14.1 134.0 14.7 131.1 12.3 135.4 11.7 138.9 15.2 136.5 13.7
June 134.1 15.0 135.8 16.5 131.4 11.4 136.5 11.4 139.8 14.2 137.4 12.7
Urban Rural
CBN Half Year Economic Report for 2012
112
Source: National Bureau of Statistics (NBS)
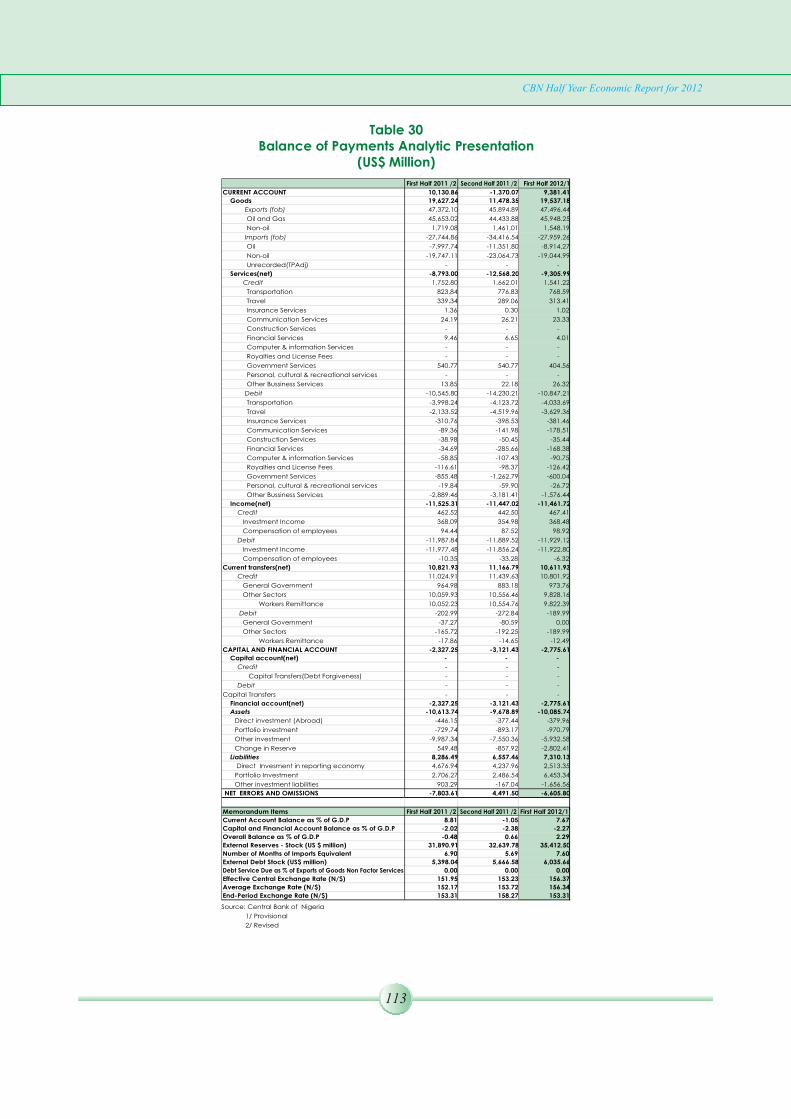
Table 30Balance of Payments Analytic Presentation
(US$ Million)
First Half 2011 /2 Second Half 2011 /2 First Half 2012/1
CURRENT ACCOUNT 10,130.86 -1,370.07 9,381.41
Goods 19,627.24 11,478.35 19,537.18
Exports (fob) 47,372.10 45,894.89 47,496.44
Oil and Gas 45,653.02 44,433.88 45,948.25
Non-oil 1,719.08 1,461.01 1,548.19
Imports (fob) -27,744.86 -34,416.54 -27,959.26
Oil -7,997.74 -11,351.80 -8,914.27
Non-oil -19,747.11 -23,064.73 -19,044.99
Unrecorded(TPAdj) - - -
Services(net) -8,793.00 -12,568.20 -9,305.99
Credit 1,752.80 1,662.01 1,541.22
Transportation 823.84 776.83 768.59
Travel 339.34 289.06 313.41
Insurance Services 1.36 0.30 1.02
Communication Services 24.19 26.21 23.33
Construction Services - - -
Financial Services 9.46 6.65 4.01
Computer & information Services - - -
Royalties and License Fees - - -
Government Services 540.77 540.77 404.56
Personal, cultural & recreational services - - -
Other Bussiness Services 13.85 22.18 26.32
Debit -10,545.80 -14,230.21 -10,847.21
Transportation -3,998.24 -4,123.72 -4,033.69
Travel -2,133.52 -4,519.96 -3,629.36
Insurance Services -310.76 -398.53 -381.46
Communication Services -89.36 -141.98 -178.51
Construction Services -38.98 -50.45 -35.44
Financial Services -34.69 -285.66 -168.38
Computer & information Services -58.85 -107.43 -90.75
Royalties and License Fees -116.61 -98.37 -126.42
Government Services -855.48 -1,262.79 -600.04
Personal, cultural & recreational services -19.84 -59.90 -26.72
Other Bussiness Services -2,889.46 -3,181.41 -1,576.44
Income(net) -11,525.31 -11,447.02 -11,461.72
Credit 462.52 442.50 467.41
Investment Income 368.09 354.98 368.48
Compensation of employees 94.44 87.52 98.92
Debit -11,987.84 -11,889.52 -11,929.12
Investment Income -11,977.48 -11,856.24 -11,922.80
Compensation of employees -10.35 -33.28 -6.32
Current transfers(net) 10,821.93 11,166.79 10,611.93
Credit 11,024.91 11,439.63 10,801.92
General Government 964.98 883.18 973.76
Other Sectors 10,059.93 10,556.46 9,828.16
Workers Remittance 10,052.23 10,554.76 9,822.39
Debit -202.99 -272.84 -189.99
General Government -37.27 -80.59 0.00
Other Sectors -165.72 -192.25 -189.99
Workers Remittance -17.86 -14.65 -12.49
CAPITAL AND FINANCIAL ACCOUNT -2,327.25 -3,121.43 -2,775.61
Capital account(net) - - -
Credit - - -
Capital Transfers(Debt Forgiveness) - - -
Debit - - -
Capital Transfers - - -
Financial account(net) -2,327.25 -3,121.43 -2,775.61
Assets -10,613.74 -9,678.89 -10,085.74
Direct investment (Abroad) -446.15 -377.44 -379.96
Portfolio investment -729.74 -893.17 -970.79
Other investment -9,987.34 -7,550.36 -5,932.58
Change in Reserve 549.48 -857.92 -2,802.41
Liabilities 8,286.49 6,557.46 7,310.13
Direct Invesment in reporting economy 4,676.94 4,237.96 2,513.35
Portfolio Investment 2,706.27 2,486.54 6,453.34
Other investment liabilities 903.29 -167.04 -1,656.56
NET ERRORS AND OMISSIONS -7,803.61 4,491.50 -6,605.80
Memorandum Items First Half 2011 /2 Second Half 2011 /2 First Half 2012/1
Current Account Balance as % of G.D.P 8.81 -1.05 7.67
Capital and Financial Account Balance as % of G.D.P -2.02 -2.38 -2.27
Overall Balance as % of G.D.P -0.48 0.66 2.29
External Reserves - Stock (US $ million) 31,890.91 32,639.78 35,412.50
Number of Months of Imports Equivalent 6.90 5.69 7.60
External Debt Stock (US$ million) 5,398.04 5,666.58 6,035.66
Debt Service Due as % of Exports of Goods Non Factor Services 0.00 0.00 0.00
Effective Central Exchange Rate (N/$) 151.95 153.23 156.37
Average Exchange Rate (N/$) 152.17 153.72 156.34
End-Period Exchange Rate (N/$) 153.31 158.27 153.31
Source: Central Bank of Nigeria
1/ Provisional
2/ Revised
CBN Half Year Economic Report for 2012
113

Table 31Balance of Payments Analytic Presentation
(N' Million)
First Half 2011 /2 Second Half 2011 /2 First Half 2012/1
CURRENT ACCOUNT 1,540,202.77 -202,215.29 1,468,216.59
Goods 2,984,377.00 1,765,367.08 3,056,821.11
Exports (fob) 7,200,751.10 7,033,424.95 7,429,841.43
Oil and Gas 6,939,739.29 6,809,369.00 7,187,687.56
Non-oil 261,011.81 224,055.96 242,153.87
Imports (fob) -4,216,374.10 -5,268,057.87 -4,373,020.32
Oil -1,218,279.16 -1,735,448.15 -1,394,256.70
Non-oil -2,998,094.93 -3,532,609.72 -2,978,763.62
Unrecorded(TPAdj) - - -
Services(net) -1,335,853.37 -1,926,214.47 -1,455,837.54
Credit 266,384.26 254,530.13 241,045.54
Transportation 125,237.98 118,904.91 120,228.94
Travel 51,546.15 44,277.59 49,022.46
Insurance Services 206.44 45.64 159.30
Communication Services 3,678.35 4,018.26 3,648.58
Construction Services - - -
Financial Services 1,443.61 1,023.30 625.87
Computer & information Services - - -
Royalties and License Fees - - -
Government Services 82,168.90 82,861.55 63,244.43
Personal, cultural & recreational services - - -
Other Bussiness Services 2,102.83 3,398.88 4,115.95
Debit -1,602,237.63 -2,180,744.60 -1,696,883.08
Transportation -607,349.89 -631,849.13 -630,958.50
Travel -324,523.03 -692,885.52 -567,735.36
Insurance Services -47,269.41 -61,005.24 -59,667.71
Communication Services -13,591.98 -21,796.49 -27,927.43
Construction Services -5,912.44 -7,736.17 -5,543.56
Financial Services -5,266.72 -43,705.98 -26,329.31
Computer & information Services -8,978.68 -16,445.81 -14,198.46
Royalties and License Fees -17,723.58 -15,069.78 -19,774.13
Government Services -129,690.28 -194,045.96 -93,867.52
Personal, cultural & recreational services -3,012.01 -9,238.48 -4,173.64
Other Bussiness Services -438,919.61 -486,966.05 -246,707.44
Income(net) -1,752,884.98 -1,752,806.80 -1,792,626.96
Credit 70,358.55 67,729.69 73,108.05
Investment Income 56,000.99 54,327.03 57,636.96
Compensation of employees 14,357.56 13,402.66 15,471.09
Debit -1,823,243.53 -1,820,536.49 -1,865,735.01
Investment Income -1,821,676.20 -1,815,405.04 -1,864,744.74
Compensation of employees -1,567.33 -5,131.45 -990.28
Current transfers(net) 1,644,564.12 1,711,438.89 1,659,859.98
Credit 1,675,421.66 1,753,179.71 1,689,576.37
General Government 146,701.98 135,252.48 152,293.59
Other Sectors 1,528,719.68 1,617,927.23 1,537,282.78
Workers Remittance 1,527,549.88 1,617,668.63 1,536,380.06
Debit -30,857.55 -41,740.81 -29,716.39
General Government -5,658.54 -12,288.10 0.00
Other Sectors -25,199.00 -29,452.71 -29,716.39
Workers Remittance -2,720.14 -2,246.94 -1,953.98
CAPITAL AND FINANCIAL ACCOUNT -364,206.94 -477,084.34 -432,575.85
Capital account(net) - - -
Credit - - -
Capital Transfers(Debt Forgiveness) - - -
Debit - - -
Capital Transfers - - -
Financial account(net) -364,206.94 -477,084.34 -432,575.85
Assets -1,622,887.32 -1,483,592.36 -1,576,234.02
Direct investment (Abroad) -67,656.35 -58,546.53 -59,226.85
Portfolio investment -110,914.94 -136,798.89 -151,692.40
Other investment -1,530,419.46 -1,155,539.10 -926,389.31
Change in Reserve 86,103.44 -132,707.85 -438,925.46
Liabilities 1,258,680.38 1,006,508.03 1,143,658.17
Direct Invesment in reporting economy 710,838.15 649,399.28 393,365.33
Portfolio Investment 411,736.74 381,284.46 1,009,709.88
Other investment liabilities 136,105.49 -24,175.72 -259,417.04
NET ERRORS AND OMISSIONS -1,175,995.83 679,299.63 -1,035,640.74
Memorandum Items First Half 2011 /2 Second Half 2011 /2 First Half 2012/1
Current Account Balance as % of G.D.P 8.81 -1.05 7.67
Capital and Financial Account Balance as % of G.D.P -2.02 -2.38 -2.27
Overall Balance as % of G.D.P -0.48 0.66 2.29
External Reserves - Stock (US $ million) 31,890.91 32,639.78 35,412.50
Number of Months of Imports Equivalent 6.90 5.69 7.60
External Debt Stock (US$ million) 5,398.04 5,666.58 6,035.66
Debt Service Due as % of Exports of Goods Non Factor Services 0.00 0.00 0.00
Effective Central Exchange Rate (N/$) 151.95 153.23 156.37
Average Exchange Rate (N/$) 152.17 153.72 156.34
End-Period Exchange Rate (N/$) 153.31 158.27 153.31
Source: Central Bank of Nigeria
1/ Provisional
2/ Revised
CBN Half Year Economic Report for 2012
114

Table 32Foreign Exchange Flows Through the Economy
(US$ Million)
CATEGORY 2008 2009 2010 2011 /2 2012 /3
INFLOW 54,503.01 30,812.91 39,297.43 50,257.07 55,663.17
A. Through the Central Bank 23,970.18 11,084.16 12,982.08 19,574.33 22,140.75
1. Oil 20,998.24 7,482.62 12,159.31 18,140.18 21,298.36
2.Non-oil 2,971.94 3,601.54 822.77 1,434.14 842.38
(i) Drawings on Loans/Grants 0.00 0.00 0.00 0.00 0.00
(ii) RDAS/WDAS Purchases 750.00 2,381.03 9.30 0.00 0.00
(iii) Swaps 945.00 0.00 0.00 0.00 0.00
(iv) Interest on Reserves & Investments 875.99 192.95 375.98 112.56 89.19
(v) Interest Repatriated from overseas 0.00 0.00 0.72
(v) Refund on World Bank/IBRD/IMF Loans/SDR Allocation 0.00 0.00 0.00
(vi) Other official Receipts 400.95 1,027.56 437.49 1,321.59 752.47
0.00 0.00 0.00
0.00 0.00 0.00
B. Through Autonomous Sources 30,532.83 19,728.75 26,315.35 30,682.74 33,522.42
1. Non-oil exports 816.40 652.34 977.56 1,355.60 2,007.62
2. Capital Inflow 98.27 15.31 30.06 9.83 110.57
3. Invisibles 29,618.16 19,061.10 25,307.73 29,317.31 31,404.23
0.00 0.00 0.00
0.00 0.00 0.00
OUTFLOW 16,797.19 20,809.60 17,594.67 21,402.28 20,221.77
A. Through the Central Bank 16,214.64 20,390.76 17,027.91 20,530.52 19,372.63
1. WDAS/RDAS Utilisation 14,060.52 17,722.01 14,146.35 17,002.27 16,689.14
(i) WDAS/RDAS Sales 1,315.29 12,861.03 11,715.11 14,638.04 10,414.10
(ii) WDAS Forward 0.00 536.51 681.52
(iii) BDC Sales 4,826.46 2,250.34 2,431.24 1,827.72 3,455.82
(iv) Inter-bank Sales 7,918.77 2,610.64 0.00 0.00 1,612.70
(v) Swaps 0.00 0.00 0.00 0.00 525.00
(vi) Invisibles IFEM 0.00 0.00 0.00 0.00 0.00
2. Drawings on L/C 259.14 568.96 406.83 902.43 291.63
3. External Debt Service 228.84 183.29 178.71 176.46 152.16
(i) Principal 173.13 133.71 137.42 127.63 118.26
(ii) Interest 22.63 15.58 2.80 8.49 5.38
(iii) Others 1/ 33.03 34.00 38.49 40.34 28.52
4. Professional fees/Commission 0.00 0.00 0.06
5. Contributions, Grants & Equities Invests. (AFC Equity Participation) 0.00 0.00 0.00
6. National Priority Projects (Niger-Delta Payments) 0.00 0.00 0.00 35.85 50.64
7. Other Official Payments 1,666.14 1,916.50 2,296.01 2,413.51 2,188.99
(i) Int'l Organisations & Embassies /4 205.82 313.29 280.45 244.32 126.47
(ii) Parastatals & Estacode 272.07 345.27 195.80 592.42 393.43
(iii) NNPC/JV Cash Calls 1,165.40 1,233.94 1,789.14 1,475.16 1,628.69
(iv) Miscellaneous(CBN Uses) 22.85 24.00 30.62 101.61 40.40
0.00 0.00 0.00
B. Through Autonomous Sources 582.55 418.84 566.76 871.76 849.14
1. Imports 576.92 403.35 498.00 847.53 837.48
2. Invisibles 5.63 15.49 1.61 24.24 11.66
0.00 0.00 0.00
NETFLOW THROUGH THE CBN 7,755.54 (9,306.60) (4,045.82) (956.19) 2,768.12
NETFLOW 37,705.82 10,003.31 21,702.77 28,854.79 35,441.40
Source: Central Bank of Nigeria
1/ Includes penalty and service charges
2/ Revised
3/ Provisional
4/ Includes IMF (SDR charges)
CBN Half Year Economic Report for 2012
115
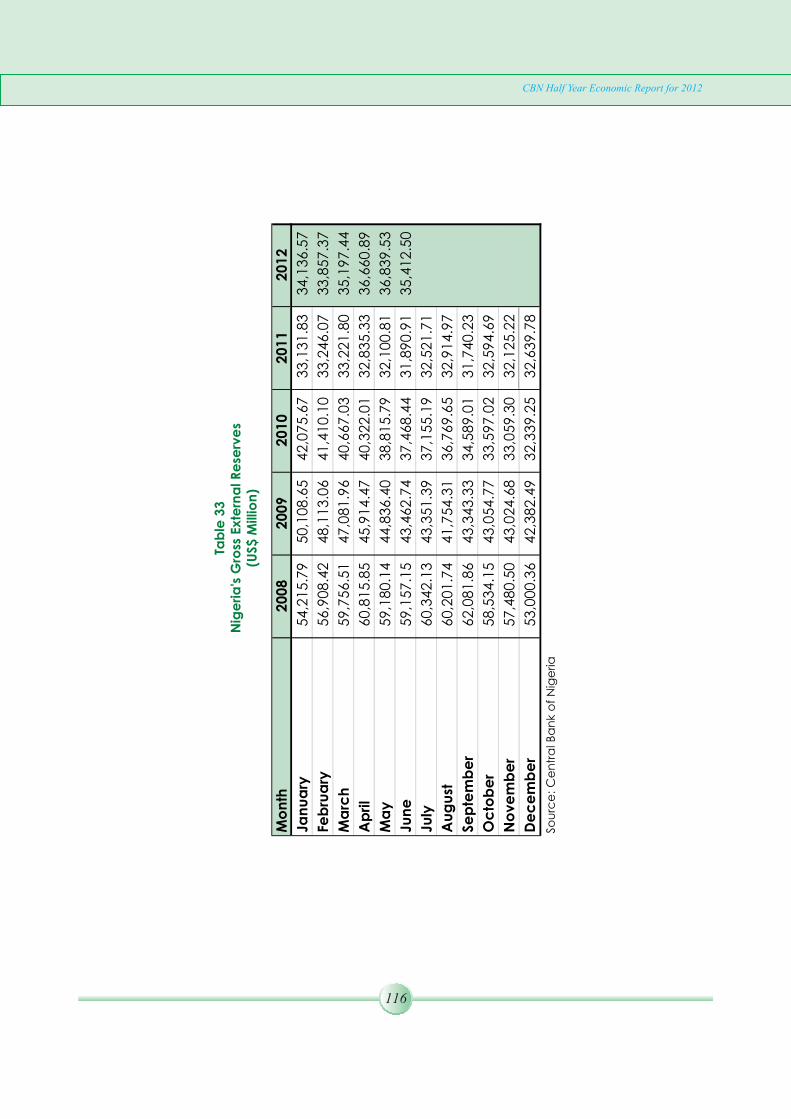
Tab
le 3
3N
ige
ria
's G
ross
Ex
tern
al R
ese
rve
s(U
S$
Mill
ion
)
Mo
nth
2008
2009
2010
2011
2012
Jan
ua
ry
54,2
15.7
9
50,1
08.6
5
42,0
75.6
733,1
31.8
334,1
36.5
7
Feb
rua
ry56,9
08.4
2
48,1
13.0
6
41,4
10.1
033,2
46.0
733,8
57.3
7
Ma
rch
59,7
56.5
1
47,0
81.9
6
40,6
67.0
333,2
21.8
035,1
97.4
4
Ap
ril
60,8
15.8
5
45,9
14.4
7
40,3
22.0
132,8
35.3
336,6
60.8
9
Ma
y59,1
80.1
4
44,8
36.4
0
38,8
15.7
932,1
00.8
136,8
39.5
3
Jun
e59,1
57.1
5
43,4
62.7
4
37,4
68.4
431,8
90.9
135,4
12.5
0
July
60,3
42.1
3
43,3
51.3
9
37,1
55.1
932,5
21.7
1
Au
gu
st60,2
01.7
441,7
54.3
136,7
69.6
532,9
14.9
7
Se
pte
mb
er
62,0
81.8
643,3
43.3
334,5
89.0
131,7
40.2
3
Oc
tob
er
58,5
34.1
543,0
54.7
733,5
97.0
232,5
94.6
9
No
ve
mb
er
57,4
80.5
043,0
24.6
833,0
59.3
032,1
25.2
2
De
ce
mb
er
53,0
00.3
642,3
82.4
932,3
39.2
532,6
39.7
8
Sou
rce
: C
en
tra
l Ba
nk o
f N
ige
ria
CBN Half Year Economic Report for 2012
116
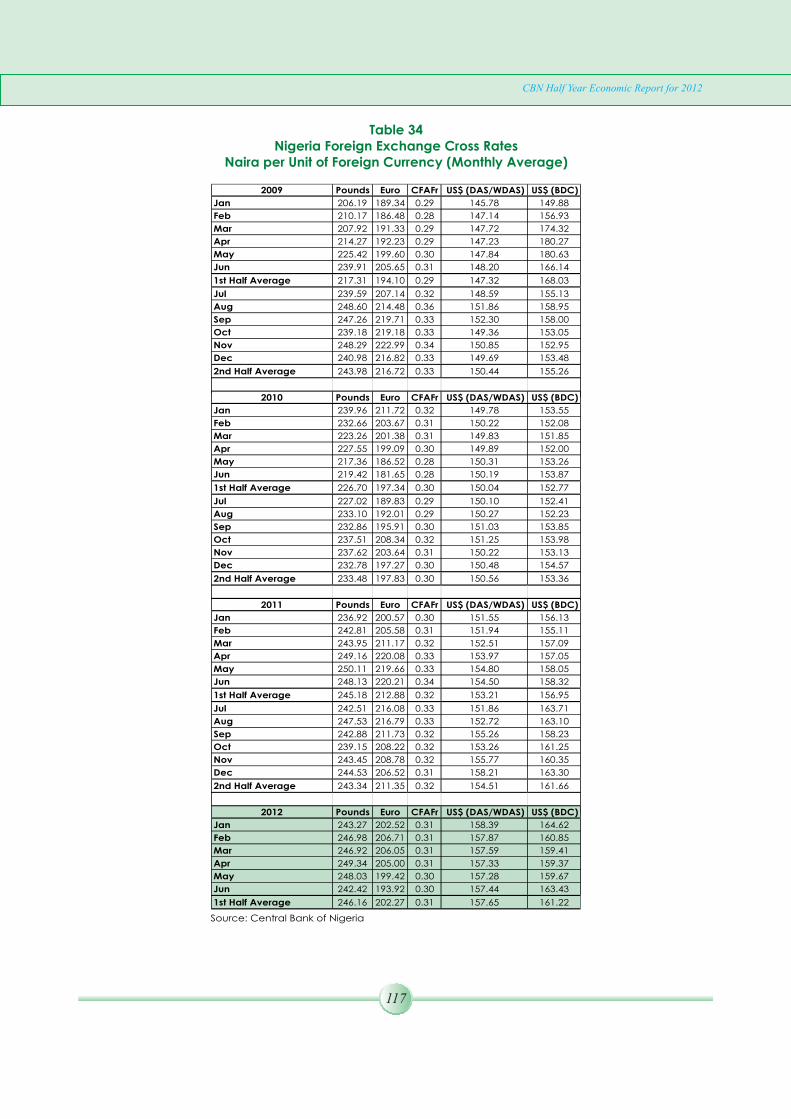
Table 34Nigeria Foreign Exchange Cross Rates
Naira per Unit of Foreign Currency (Monthly Average)
2009 Pounds Euro CFAFr US$ (DAS/WDAS) US$ (BDC)
Jan 206.19 189.34 0.29 145.78 149.88
Feb 210.17 186.48 0.28 147.14 156.93
Mar 207.92 191.33 0.29 147.72 174.32
Apr 214.27 192.23 0.29 147.23 180.27
May 225.42 199.60 0.30 147.84 180.63
Jun 239.91 205.65 0.31 148.20 166.14
1st Half Average 217.31 194.10 0.29 147.32 168.03
Jul 239.59 207.14 0.32 148.59 155.13
Aug 248.60 214.48 0.36 151.86 158.95
Sep 247.26 219.71 0.33 152.30 158.00
Oct 239.18 219.18 0.33 149.36 153.05
Nov 248.29 222.99 0.34 150.85 152.95
Dec 240.98 216.82 0.33 149.69 153.48
2nd Half Average 243.98 216.72 0.33 150.44 155.26
2010 Pounds Euro CFAFr US$ (DAS/WDAS) US$ (BDC)
Jan 239.96 211.72 0.32 149.78 153.55
Feb 232.66 203.67 0.31 150.22 152.08
Mar 223.26 201.38 0.31 149.83 151.85
Apr 227.55 199.09 0.30 149.89 152.00
May 217.36 186.52 0.28 150.31 153.26
Jun 219.42 181.65 0.28 150.19 153.87
1st Half Average 226.70 197.34 0.30 150.04 152.77
Jul 227.02 189.83 0.29 150.10 152.41
Aug 233.10 192.01 0.29 150.27 152.23
Sep 232.86 195.91 0.30 151.03 153.85
Oct 237.51 208.34 0.32 151.25 153.98
Nov 237.62 203.64 0.31 150.22 153.13
Dec 232.78 197.27 0.30 150.48 154.57
2nd Half Average 233.48 197.83 0.30 150.56 153.36
2011 Pounds Euro CFAFr US$ (DAS/WDAS) US$ (BDC)
Jan 236.92 200.57 0.30 151.55 156.13
Feb 242.81 205.58 0.31 151.94 155.11
Mar 243.95 211.17 0.32 152.51 157.09
Apr 249.16 220.08 0.33 153.97 157.05
May 250.11 219.66 0.33 154.80 158.05
Jun 248.13 220.21 0.34 154.50 158.32
1st Half Average 245.18 212.88 0.32 153.21 156.95
Jul 242.51 216.08 0.33 151.86 163.71
Aug 247.53 216.79 0.33 152.72 163.10
Sep 242.88 211.73 0.32 155.26 158.23
Oct 239.15 208.22 0.32 153.26 161.25
Nov 243.45 208.78 0.32 155.77 160.35
Dec 244.53 206.52 0.31 158.21 163.30
2nd Half Average 243.34 211.35 0.32 154.51 161.66
2012 Pounds Euro CFAFr US$ (DAS/WDAS) US$ (BDC)
Jan 243.27 202.52 0.31 158.39 164.62
Feb 246.98 206.71 0.31 157.87 160.85
Mar 246.92 206.05 0.31 157.59 159.41
Apr 249.34 205.00 0.31 157.33 159.37
May 248.03 199.42 0.30 157.28 159.67
Jun 242.42 193.92 0.30 157.44 163.43
1st Half Average 246.16 202.27 0.31 157.65 161.22
Source: Central Bank of Nigeria
CBN Half Year Economic Report for 2012
117

Table 35Monthly Average Exchange Rate Movements
(N/US$ 1.00)
2010 WDAS Interbank BDC
Jan 149.78 150.33 153.55
Feb 150.22 150.97 152.08
Mar 149.83 150.08 151.85
Apr 149.89 150.38 152.00
May 150.31 151.49 153.26
Jun 150.19 151.28 153.87
1st Half 150.04 150.75 152.77
End-Period 149.99 150.00 153.50
Jul 150.10 150.27 152.41
Aug 150.27 150.70 152.23
Sep 151.03 152.62 153.85
Oct 151.25 151.78 153.98
Nov 150.22 150.55 153.13
Dec 150.48 152.63 154.57
2nd Half 150.56 151.42 153.36
End-Period 150.66 152.00 156.00
2011 WDAS Interbank BDC
Jan 151.55 152.47 156.13
Feb 151.94 152.86 155.11
Mar 152.51 155.21 157.09
Apr 153.97 154.60 157.05
May 154.80 156.17 158.05
Jun 154.50 155.65 158.32
1st Half 153.21 154.49 156.95
End-Period 153.31 152.52 159.00
Jul 151.86 152.41 163.71
Aug 152.72 153.79 163.10
Sep 155.26 156.70 158.23
Oct 153.26 159.82 161.25
Nov 155.77 158.83 160.35
Dec 158.21 162.17 163.30
2nd Half 154.51 157.29 161.66
End-Period 158.27 159.70 165.00
2012 WDAS Interbank BDC
Jan 158.39 161.31 164.62
Feb 157.87 158.59 160.85
Mar 157.59 157.72 159.41
Apr 157.33 157.44 159.37
May 157.28 158.46 159.67
Jun 157.44 162.33 163.43
1st Half 157.65 159.31 161.22
End-Period 157.50 162.85 164.00
Source: Central Bank of Nigeria
CBN Half Year Economic Report for 2012
118

Ye
ar/
Mo
nth
WD
AS
BDC
WD
AS
-
WD
AS -
Forw
ard
WD
AS
BDC
WD
AS
-W
DA
S -
Forw
ard
De
ma
nd
De
ma
nd
Forw
ard
De
ma
nd
me
nt
on
D
em
an
dD
em
an
d
Forw
ard
De
ma
nd
me
nt
on
Jan
ua
ry
2,80
0.42
13
5.54
0.0
2,
935.
962,
000.
00
135.5
40.
002,
135.
542,
134.
003
65
.73
17
7.4
22,
677.
151,
640.
65365.7
32
96
.67
2,30
3.05
Feb
rua
ry2,
041.
09
300.
04
0.0
2,34
1.13
1,79
4.85
300.0
40.
002,
094.
891,
891.
967
20
.59
56
.88
2,66
9.43
1,94
2.18
720.5
91
87
.03
2,84
9.80
Ma
rch
4,08
0.28
330.
53
26
9.4
4,68
0.17
3,27
4.38
330.5
30.
003,
604.
911,
426.
456
98
.16
10
6.9
92,
231.
601,
452.
75698.1
63
6.8
52,
187.
76
Ap
ril2,
780.
4132
2.26
26
5.1
3,36
7.75
2,37
5.58
322.2
610
.00
2,70
7.84
1,05
2.88
49
2.7
61
28
.46
1,67
4.10
891.
52492.7
64
3.9
71,
428.
25
Ma
y2,
878.
4339
2.03
28
1.3
3,55
1.71
2,54
9.89
392.0
327
5.30
3,21
7.22
1,68
1.26
63
3.7
75
2.6
22,
367.
651,
487.
00633.7
71
14
.21
2,23
4.98
Jun
e3,
325.
5334
7.32
41
9.2
4,09
2.04
2,64
3.34
347.3
225
1.21
3,24
1.87
2,77
7.62
54
4.8
14
8.3
73,
370.
803,
000.
00544.8
12
.79
3,54
7.60
Firs
t Ha
lf17
,906
.16
1,82
7.72
1,2
34.8
820
,968
.76
14,6
38.0
41,8
27.7
2536.5
117
,002
.26
10,9
64.1
73
,45
5.8
2570.7
414
,990
.73
10,4
14.1
03
,45
5.8
26
81
.52
14,5
51.4
4
July
3,06
5.41
398.
151
27
.43,
590.
952,
643.
34398.1
525
2.17
3,29
3.66
Au
gu
st4,
504.
4950
4.28
58
8.1
5,59
6.82
2,89
9.05
504.2
827
3.64
3,67
6.97
Sep
tem
be
r4,
081.
1899
5.65
66
0.8
5,73
7.66
3,85
0.00
995.6
533
9.05
5,18
4.70
Oc
tob
er
3,89
9.58
716.
761
13
0.3
5,74
6.68
2,60
7.00
716.7
639
7.71
3,72
1.47
No
vem
be
r3,
054.
4379
5.37
34
9.3
4,19
9.06
1,74
9.62
795.3
754
7.04
3,09
2.03
De
ce
mb
er
1,41
5.28
675.
652
66
.62,
357.
541,
397.
86675.6
544
6.44
2,51
9.95
Sec
ond
Ha
lf20
,020
.37
4,08
5.86
3,1
22.4
827
,228
.71
15,1
46.8
74,0
85.8
62,2
56.0
521
,488
.78
20
12
Tota
l
De
ma
nd
20
11
Tota
l
Sup
ply
**
WD
AS
Sa
les
BD
C
Sa
les
Tota
l
Sup
ply
*To
tal
De
ma
nd
WD
AS
Sa
les
BD
C
Sa
les
Sou
rce
: C
en
tra
l Ba
nk o
f N
ige
ria
Tota
l su
pp
ly*
inc
lud
es
WD
AS
sale
s (s
po
t a
nd
fo
rwa
rd),
BD
C a
nd
In
terb
an
k s
ale
s a
s w
ell
as
Swa
ps.
Tota
l su
pp
ly**
inc
lud
es
WD
AS
spo
t sa
les,
WD
AS
forw
ard
dis
bu
rse
me
nt
at
ma
turity
, B
DC
an
d In
terb
an
k s
ale
s a
s w
ell
as
Swa
ps.
Tab
le 3
6D
em
an
d a
nd
Su
pp
ly o
f Fo
reig
n E
xc
ha
ng
e(U
S$
Mill
ion
)
CBN Half Year Economic Report for 2012
119
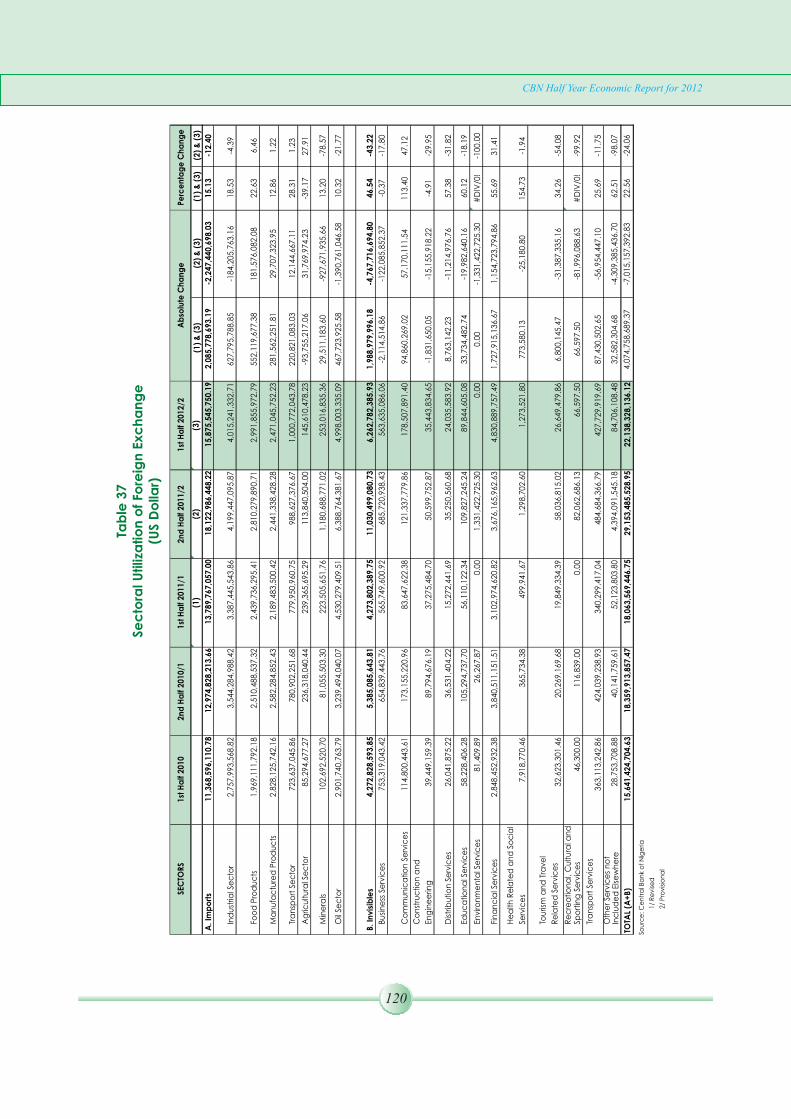
Tab
le 3
7Se
cto
ral U
tiliz
atio
n o
f Fo
reig
n E
xc
ha
ng
e(U
S D
olla
r)
(1)
(2)
(3)
(1
) &
(3
)(2
) &
(3
) (
1)
& (
3)
(2)
& (
3)
A.
Imp
ort
s1
1,3
68
,59
6,1
10
.78
12
,97
4,8
28
,21
3.6
61
3,7
89
,76
7,0
57
.00
18
,12
2,9
86
,44
8.2
21
5,8
75
,54
5,7
50
.19
2,0
85
,77
8,6
93
.19
-2,2
47
,44
0,6
98
.03
15
.13
-12
.40
Ind
ust
rial S
ec
tor
2,7
57
,99
3,5
68
.82
3,5
44
,28
4,9
88
.42
3,3
87
,44
5,5
43
.86
4,1
99
,44
7,0
95
.87
4,0
15
,24
1,3
32
.71
62
7,7
95
,78
8.8
5-1
84
,20
5,7
63
.16
18
.53
-4.3
9
Foo
d P
rod
uc
ts1
,96
9,1
11
,79
2.1
82
,51
0,4
88
,53
7.3
22
,43
9,7
36
,29
5.4
12
,81
0,2
79
,89
0.7
12
,99
1,8
55
,97
2.7
95
52
,11
9,6
77
.38
18
1,5
76
,08
2.0
82
2.6
36
.46
M
an
ufa
ctu
red
Pro
du
cts
2,8
28
,12
5,7
42
.16
2,5
82
,28
4,8
52
.43
2,1
89
,48
3,5
00
.42
2,4
41
,33
8,4
28
.28
2,4
71
,04
5,7
52
.23
28
1,5
62
,25
1.8
12
9,7
07
,32
3.9
51
2.8
61
.22
T
ran
spo
rt S
ec
tor
72
3,6
37
,04
5.8
67
80
,90
2,2
51
.68
77
9,9
50
,96
0.7
59
88
,62
7,3
76
.67
1,0
00
,77
2,0
43
.78
22
0,8
21
,08
3.0
31
2,1
44
,66
7.1
12
8.3
11
.23
Ag
ricu
ltu
ral S
ec
tor
85
,29
4,6
77
.27
23
6,3
18
,04
0.4
42
39
,36
5,6
95
.29
11
3,8
40
,50
4.0
01
45
,61
0,4
78
.23
-93
,75
5,2
17
.06
31
,76
9,9
74
.23
-39
.17
27
.91
Min
era
ls1
02
,69
2,5
20
.70
81
,05
5,5
03
.30
22
3,5
05
,65
1.7
61
,18
0,6
88
,77
1.0
22
53
,01
6,8
35
.36
29
,51
1,1
83
.60
-92
7,6
71
,93
5.6
61
3.2
0-7
8.5
7
Oil
Sec
tor
2,9
01
,74
0,7
63
.79
3,2
39
,49
4,0
40
.07
4,5
30
,27
9,4
09
.51
6,3
88
,76
4,3
81
.67
4,9
98
,00
3,3
35
.09
46
7,7
23
,92
5.5
8-1
,39
0,7
61
,04
6.5
81
0.3
2-2
1.7
7
B.
Inv
isib
les
4,2
72
,82
8,5
93
.85
5,3
85
,08
5,6
43
.81
4,2
73
,80
2,3
89
.75
11
,03
0,4
99
,08
0.7
36
,26
2,7
82
,38
5.9
31
,98
8,9
79
,99
6.1
8-4
,76
7,7
16
,69
4.8
04
6.5
4-4
3.2
2
Bu
sin
ess
Se
rvic
es
75
3,3
19
,04
3.4
26
54
,83
9,4
43
.76
56
5,7
49
,60
0.9
26
85
,72
0,9
38
.43
56
3,6
35
,08
6.0
6-2
,11
4,5
14
.86
-12
2,0
85
,85
2.3
7-0
.37
-17
.80
Co
mm
un
ica
tio
n S
erv
ice
s1
14
,80
0,4
43
.61
17
3,1
55
,22
0.9
68
3,6
47
,62
2.3
81
21
,33
7,7
79
.86
17
8,5
07
,89
1.4
09
4,8
60
,26
9.0
25
7,1
70
,11
1.5
41
13
.40
47
.12
Co
nst
ruc
tio
n a
nd
Eng
ine
erin
g3
9,4
49
,15
9.3
98
9,7
94
,67
6.1
93
7,2
75
,48
4.7
05
0,5
99
,75
2.8
73
5,4
43
,83
4.6
5-1
,83
1,6
50
.05
-15
,15
5,9
18
.22
-4.9
1-2
9.9
5
Dis
trib
utio
n S
erv
ice
s2
6,0
41
,87
5.2
23
6,5
31
,40
4.2
21
5,2
72
,44
1.6
93
5,2
50
,56
0.6
82
4,0
35
,58
3.9
28
,76
3,1
42
.23
-11
,21
4,9
76
.76
57
.38
-31
.82
Ed
uc
atio
na
l Se
rvic
es
58
,22
8,4
06
.28
10
5,2
94
,73
7.7
05
6,1
10
,12
2.3
41
09
,82
7,2
45
.24
89
,84
4,6
05
.08
33
,73
4,4
82
.74
-19
,98
2,6
40
.16
60
.12
-18
.19
En
viro
nm
en
tal S
erv
ice
s8
1,4
09
.89
26
,26
7.8
70
.00
1,3
31
,42
2,7
25
.30
0.0
00
.00
-1,3
31
,42
2,7
25
.30
#D
IV/0
!-1
00
.00
Fin
an
cia
l Se
rvic
es
2,8
48
,45
2,9
32
.38
3,8
40
,51
1,1
51
.51
3,1
02
,97
4,6
20
.82
3,6
76
,16
5,9
62
.63
4,8
30
,88
9,7
57
.49
1,7
27
,91
5,1
36
.67
1,1
54
,72
3,7
94
.86
55
.69
31
.41
He
alth
Re
late
d a
nd
So
cia
l
Serv
ice
s7
,91
8,7
70
.46
36
5,7
34
.38
49
9,9
41
.67
1,2
98
,70
2.6
01
,27
3,5
21
.80
77
3,5
80
.13
-25
,18
0.8
01
54
.73
-1.9
4
To
uris
m a
nd
Tra
ve
l
Re
late
d S
erv
ice
s3
2,6
23
,30
1.4
62
0,2
69
,16
9.6
81
9,8
49
,33
4.3
95
8,0
36
,81
5.0
22
6,6
49
,47
9.8
66
,80
0,1
45
.47
-31
,38
7,3
35
.16
34
.26
-54
.08
Re
cre
atio
na
l, C
ultu
ral a
nd
Sp
ort
ing
Se
rvic
es
46
,30
0.0
01
16
,83
9.0
00
.00
82
,06
2,6
86
.13
66
,59
7.5
06
6,5
97
.50
-81
,99
6,0
88
.63
#D
IV/0
!-9
9.9
2
Tra
nsp
ort
Se
rvic
es
36
3,1
13
,24
2.8
64
24
,03
9,2
38
.93
34
0,2
99
,41
7.0
44
84
,68
4,3
66
.79
42
7,7
29
,91
9.6
98
7,4
30
,50
2.6
5-5
6,9
54
,44
7.1
02
5.6
9-1
1.7
5O
the
r Se
rvic
es
no
t In
clu
de
d E
lse
wh
ere
28
,75
3,7
08
.88
40
,14
1,7
59
.61
52
,12
3,8
03
.80
4,3
94
,09
1,5
45
.18
84
,70
6,1
08
.48
32
,58
2,3
04
.68
-4,3
09
,38
5,4
36
.70
62
.51
-98
.07
TOTA
L (A
+B
)1
5,6
41
,42
4,7
04
.63
18
,35
9,9
13
,85
7.4
71
8,0
63
,56
9,4
46
.75
29
,15
3,4
85
,52
8.9
52
2,1
38
,32
8,1
36
.12
4,0
74
,75
8,6
89
.37
-7,0
15
,15
7,3
92
.83
22
.56
-24
.06
Sou
rce
: C
en
tra
l Ba
nk
of
Nig
eria
1/
Re
vis
ed
2/
Pro
vis
ion
al
Ab
solu
te C
ha
ng
eP
erc
en
tag
e C
ha
ng
eSE
CTO
RS
1st
Ha
lf 2
01
02
nd
Ha
lf 2
01
0/1
1st
Ha
lf 2
01
1/1
2n
d H
alf
20
11
/21
st H
alf
20
12
/2
CBN Half Year Economic Report for 2012
120
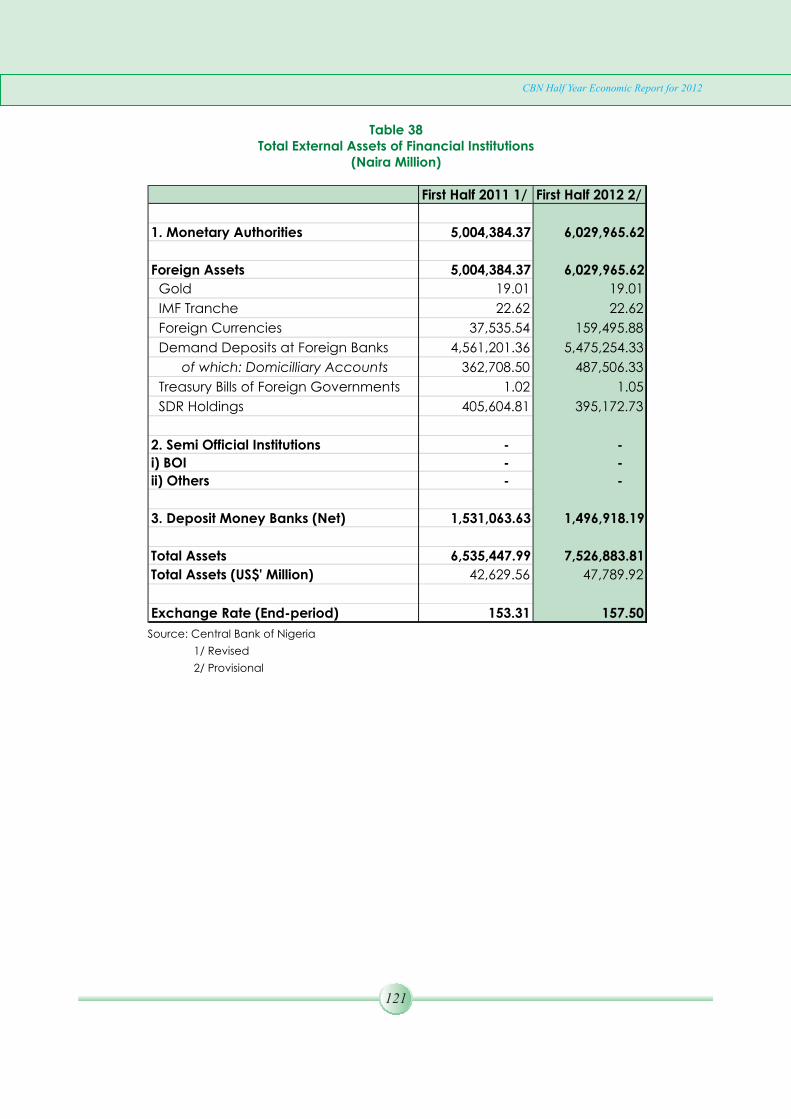
Table 38Total External Assets of Financial Institutions
(Naira Million)
First Half 2011 1/ First Half 2012 2/
1. Monetary Authorities 5,004,384.37 6,029,965.62
Foreign Assets 5,004,384.37 6,029,965.62
Gold 19.01 19.01
IMF Tranche 22.62 22.62
Foreign Currencies 37,535.54 159,495.88
Demand Deposits at Foreign Banks 4,561,201.36 5,475,254.33
of which: Domicilliary Accounts 362,708.50 487,506.33
Treasury Bills of Foreign Governments 1.02 1.05
SDR Holdings 405,604.81 395,172.73
2. Semi Official Institutions -
-
i) BOI - -
ii) Others - -
3. Deposit Money Banks (Net) 1,531,063.63 1,496,918.19
Total Assets 6,535,447.99 7,526,883.81
Total Assets (US$' Million) 42,629.56 47,789.92
Exchange Rate (End-period) 153.31 157.50
Source: Central Bank of Nigeria
1/ Revised
2/ Provisional
CBN Half Year Economic Report for 2012
121