Embed Size (px)
Citation preview
ARTICLE
Central dogma rates and the trade-off betweenprecision and economy in gene expressionJean Hausser 1, Avi Mayo1, Leeat Keren1 & Uri Alon1
Steady-state protein abundance is set by four rates: transcription, translation, mRNA decay
and protein decay. A given protein abundance can be obtained from infinitely many com-
binations of these rates. This raises the question of whether the natural rates for each gene
result from historical accidents, or are there rules that give certain combinations a selective
advantage? We address this question using high-throughput measurements in rapidly
growing cells from diverse organisms to find that about half of the rate combinations do not
exist: genes that combine high transcription with low translation are strongly depleted. This
depletion is due to a trade-off between precision and economy: high transcription decreases
stochastic fluctuations but increases transcription costs. Our theory quantitatively explains
which rate combinations are missing, and predicts the curvature of the fitness function for
each gene. It may guide the design of gene circuits with desired expression levels and noise.
https://doi.org/10.1038/s41467-018-07391-8 OPEN
1 Department of Molecular Cell Biology, Weizmann Institute of Science, Rehovot 76100, Israel. Correspondence and requests for materials should beaddressed to J.H. (email: [email protected]) or to U.A. (email: [email protected])
NATURE COMMUNICATIONS | (2019) 10:68 | https://doi.org/10.1038/s41467-018-07391-8 | www.nature.com/naturecommunications 1
1234
5678
90():,;
To function well in a given environment, cells need toexpress genes at the right protein copy number1–3. Steady-state protein abundance is set by two reactions of synthesis
—transcription and translation—balanced by two processes ofdecay—dilution and degradation of mRNAs and proteins4.Together, these make up the four basic rates of the centraldogma5.
The rates of these four central dogma reactions are controlledby diverse regulators. Transcription rate is set by transcriptionfactors and chromatin remodelers6. Translation is modulated byRNA-binding proteins and non-coding RNAs7,8, and so on. Theeffects of these molecular controls can be summarized by thecentral dogma rates, such that each protein is a point in a fourdimensional space whose axes are the four rates. In this study, wename this the Crick space, in honor of Francis Crick who pro-posed the central dogma5.
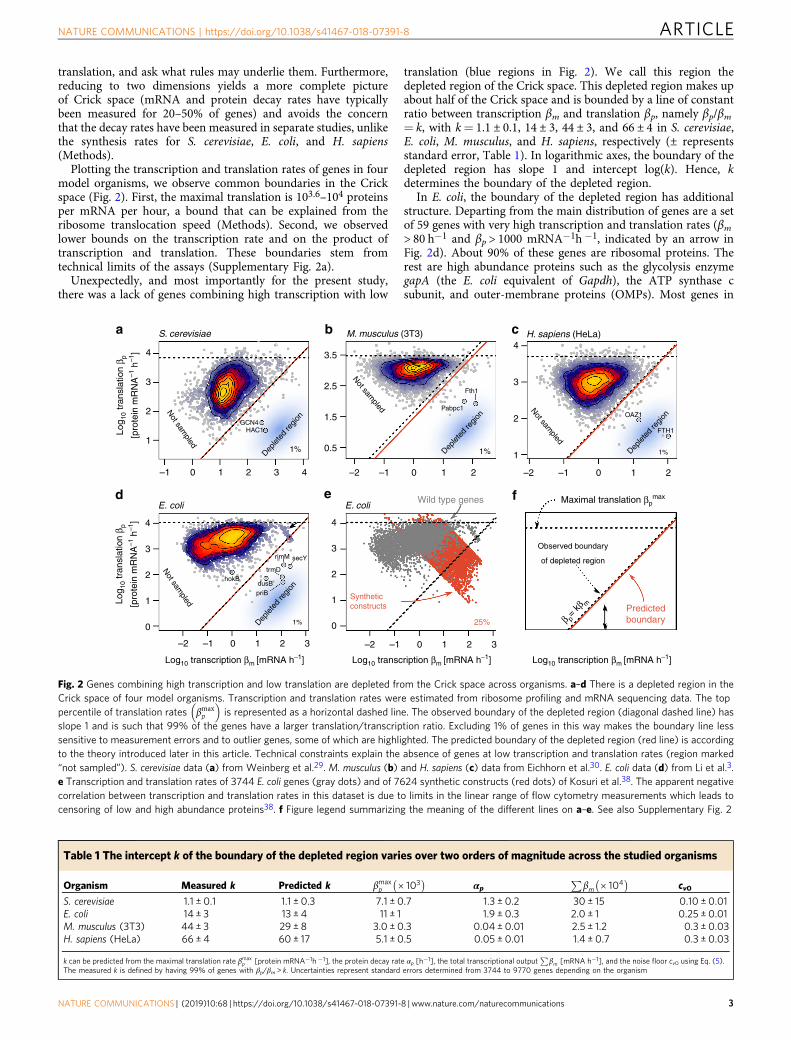
One important property of Crick space is that the same steady-state protein abundance can be achieved by many combinations ofrates. For example, consider a protein made at 1000 copies perhour (Fig. 1). This can be achieved by transcribing 100 mRNAsand translating 10 proteins from each mRNA every hour. Alter-natively, the 1000 proteins could be made from one mRNAtranslated into 1000 proteins per hour (in this example, we fixedmRNA and protein decay). There is an infinite number of ways tocombine transcription and translation rates, βm [mRNA h−1] andβp [protein mRNA−1 h−1)], in order to supply a given steady-statenumber of proteins p, namely βmβp/αmαp= p where αm [h−1] andαp [h−1] are the rates of mRNA and protein decay by dilution anddegradation (Methods).
Here we ask whether such combinations occur randomly, asexpected if they are equally beneficial and historical accident orgenetic drift is at play, or whether there are rules based on specifictranslation/transcription ratios that have selective advantage. Ifsuch rules exist, we might expect to see patterns in the way thatgenes occupy Crick space.
While there has not been systematic evidence for rules so far,previous work described how different combinations of centraldogma rates can differ in their biological impact. One line of workshows that intrinsic noise9–12, the stochastic variation in proteinnumber due to small-number effects, is largest when there are fewmRNAs translated into many proteins13–16. This large noiseoccurs because the relative fluctuations in the number of a fewmRNAs are large, and are amplified by strong translation. Thisidea was first proposed by McAdams & Arkin13 based on theo-retical arguments. The prediction that a given protein abundancecan be reached with the least noise when transcription is high andtranslation is low was validated by Ozbudak et al.14 using syn-thetic constructs with defined transcription and translation rates.Bar-Even et al.16 measured the noise and abundance of 43 S.cerevisiae proteins and found that noise scaled with proteinabundance in a way consistent with the predictions of McAdams& Arkin13. Also in S. cerevisiae, Newman et al.17 observed acorrelation between noise and mRNA abundance for 2500+genes.
Another difference between combinations of rates that give thesame steady-state protein abundance is mRNA cost—the reduc-tion in fitness due to production of mRNA18–22. Theoreticalstudies proposed that the cost of synthesizing mRNAs confers aselectable disadvantage13,18,19. Experiments in S. cerevisiae21
indicate that expressing a non-beneficial mRNA penalizes thegrowth rate in proportion to the transcription rate (Methods). InE. coli, expressing a protein at a given abundance from a largernumber of mRNAs decreases fitness22.
Noise and cost are thought to be significant components indetermining the fitness and selection of biological designs13,23–27.In particular McAdams & Arkin13, and others14 proposed that
there should be a trade-off between minimizing gene expressioncosts and minimizing noise in protein abundance. Testing thishypothesis has been difficult, partly because the central dogmarates could not be measured genome-wide until recently28.Another hurdle that prevented testing the hypothesis of aprecision-economy trade-off in gene expression is that it isunclear how the interplay of precision and economy should affectthe distribution of genes in the Crick space.
Here we address the question of rules for protein expression byanalyzing comprehensive data on central dogma rates from sev-eral model organisms3,17,26,29–31 and by theory on evolutionarytrade-offs. We find that about half of the Crick space is empty:genes do not seem to combine high transcription with lowtranslation. This depleted region is accessible by synthetic con-structs, and hence its emptiness is not based on mechanisticconstraints. We explain the empty Crick space by a trade-offbetween cost and noise of gene expression. This theory accuratelypredicts the boundary of the empty region which varies by 2orders of magnitude between the model organisms we considered.This approach might be of use to design synthetic gene expressioncircuits, and suggests rules for central dogma rates that seem toapply from bacteria to humans.
ResultsGenes combining high transcription and low translation aredepleted. We estimated transcription βm and translation βp rates,as well as mRNA and protein decay rates, for thousands of genesfrom previous mRNAseq and ribosome profiling (RP) experi-ments in S. cerevisiae29, M. musculus, H. sapiens30, and E. coli3
(Methods). All data were collected under conditions of rapidgrowth.
We find, in accordance with previous studies3,26,32,33, thattranscription and translation rates in rapidly growing cells varymuch more from gene to gene than mRNA and protein decayrates. Transcription and translation rates vary over a 1000-foldrange compared to a 10-fold range for decay rates of mRNA andprotein (Supplementary Fig. 1a–d). Taking into account gene-specific mRNA and protein decay rates has only a small impact onthe position of genes in 2D Crick space (Supplementary Fig. 1e–g,Methods). We therefore simplify our discussion by considering a2D Crick space, formed by transcription and translation rates.
Reducing the 4-dimensional Crick space to two dimensionsneglects aspects of cell biology such as the dynamics of generegulation in response to environmental perturbations34,35, but itallows us to focus on the most variable rates in setting steady-state protein abundance in growing cells, transcription and
1 mRNA ×1000 proteins mRNA–1h–1
100 mRNAs ×10 proteins mRNA–1 h–1
Crickspace
1000 proteins h –1
Log
tran
slat
ion
β p[p
rote
in m
RN
A–1
h–1]
Log transcription βm[mRNA h–1]
= 1000 proteins h–1
Fig. 1 For each gene, an infinite number of combinations of transcriptionand translation rates can achieve a given protein abundance. For example,to obtain 1000 proteins per hour, one possibility is to translate 1000proteins per hour from a single mRNA. Another option is to translate10 proteins per hour from 100 mRNAs. We assumed fixed mRNA andprotein decay to simplify the visualization. See also Supplementary Fig. 1
ARTICLE NATURE COMMUNICATIONS | https://doi.org/10.1038/s41467-018-07391-8
2 NATURE COMMUNICATIONS | (2019) 10:68 | https://doi.org/10.1038/s41467-018-07391-8 | www.nature.com/naturecommunications
translation, and ask what rules may underlie them. Furthermore,reducing to two dimensions yields a more complete pictureof Crick space (mRNA and protein decay rates have typicallybeen measured for 20–50% of genes) and avoids the concernthat the decay rates have been measured in separate studies, unlikethe synthesis rates for S. cerevisiae, E. coli, and H. sapiens(Methods).
Plotting the transcription and translation rates of genes in fourmodel organisms, we observe common boundaries in the Crickspace (Fig. 2). First, the maximal translation is 103.6–104 proteinsper mRNA per hour, a bound that can be explained from theribosome translocation speed (Methods). Second, we observedlower bounds on the transcription rate and on the product oftranscription and translation. These boundaries stem fromtechnical limits of the assays (Supplementary Fig. 2a).
Unexpectedly, and most importantly for the present study,there was a lack of genes combining high transcription with low
translation (blue regions in Fig. 2). We call this region thedepleted region of the Crick space. This depleted region makes upabout half of the Crick space and is bounded by a line of constantratio between transcription βm and translation βp, namely βp/βm= k, with k= 1.1 ± 0.1, 14 ± 3, 44 ± 3, and 66 ± 4 in S. cerevisiae,E. coli, M. musculus, and H. sapiens, respectively (± representsstandard error, Table 1). In logarithmic axes, the boundary of thedepleted region has slope 1 and intercept log(k). Hence, kdetermines the boundary of the depleted region.
In E. coli, the boundary of the depleted region has additionalstructure. Departing from the main distribution of genes are a setof 59 genes with very high transcription and translation rates (βm> 80 h−1 and βp > 1000 mRNA−1h −1, indicated by an arrow inFig. 2d). About 90% of these genes are ribosomal proteins. Therest are high abundance proteins such as the glycolysis enzymegapA (the E. coli equivalent of Gapdh), the ATP synthase csubunit, and outer-membrane proteins (OMPs). Most genes in
S. cerevisiae
4
3
2
1
Log 1
0 tr
ansl
atio
n β p
[pro
tein
mR
NA
–1 h
–1]
Log 1
0 tr
ansl
atio
n β p
[pro
tein
mR
NA
–1 h
–1]
Not sam
pled
Not sam
pled
GCN4HAC1
Deplet
ed re
gion
Deplet
ed re
gion
1%
–1 0 1 2 3 4
M. musculus (3T3)
3.5
2.5
1.5
0.5Not sam
pled Not sampled
Fth1
OAZ1
FTH1
Pabpc1
Deplet
ed re
gion
Deplet
ed re
gion
1% 1%
–2 –1 0 1 2
H. sapiens (HeLa)4
3
2
1
–2 –1 0 1 2
4
3
2
1
0
hokB
rimM secY
trmD
dusBpriB
1%
–2 –1 0 1 2 3
Log10 transcription βm [mRNA h–1] Log10 transcription βm [mRNA h–1] Log10 transcription βm [mRNA h–1]
E. coli E. coliWild type genes
4
3
2
1
0
Syntheticconstructs
25%
–2 –1 0 1 2 3
Maximal translation βpmax
Observed boundary
of depleted region
β p=
kβ m Predictedboundary
a
d e f
b c
Fig. 2 Genes combining high transcription and low translation are depleted from the Crick space across organisms. a–d There is a depleted region in theCrick space of four model organisms. Transcription and translation rates were estimated from ribosome profiling and mRNA sequencing data. The toppercentile of translation rates βmax
p
� �is represented as a horizontal dashed line. The observed boundary of the depleted region (diagonal dashed line) has
slope 1 and is such that 99% of the genes have a larger translation/transcription ratio. Excluding 1% of genes in this way makes the boundary line lesssensitive to measurement errors and to outlier genes, some of which are highlighted. The predicted boundary of the depleted region (red line) is accordingto the theory introduced later in this article. Technical constraints explain the absence of genes at low transcription and translation rates (region marked“not sampled”). S. cerevisiae data (a) from Weinberg et al.29. M. musculus (b) and H. sapiens (c) data from Eichhorn et al.30. E. coli data (d) from Li et al.3.e Transcription and translation rates of 3744 E. coli genes (gray dots) and of 7624 synthetic constructs (red dots) of Kosuri et al.38. The apparent negativecorrelation between transcription and translation rates in this dataset is due to limits in the linear range of flow cytometry measurements which leads tocensoring of low and high abundance proteins38. f Figure legend summarizing the meaning of the different lines on a–e. See also Supplementary Fig. 2
Table 1 The intercept k of the boundary of the depleted region varies over two orders of magnitude across the studied organisms
Organism Measured k Predicted k βmaxp ´ 103
� �αp
Pβm ´ 104
� �cv0
S. cerevisiae 1.1 ± 0.1 1.1 ± 0.3 7.1 ± 0.7 1.3 ± 0.2 30 ± 15 0.10 ± 0.01E. coli 14 ± 3 13 ± 4 11 ± 1 1.9 ± 0.3 2.0 ± 1 0.25 ± 0.01M. musculus (3T3) 44 ± 3 29 ± 8 3.0 ± 0.3 0.04 ± 0.01 2.5 ± 1.2 0.3 ± 0.03H. sapiens (HeLa) 66 ± 4 60 ± 17 5.1 ± 0.5 0.05 ± 0.01 1.4 ± 0.7 0.3 ± 0.03
k can be predicted from the maximal translation rate βmaxp [protein mRNA−1h −1], the protein decay rate αp [h−1], the total transcriptional output
Pβm [mRNA h−1], and the noise floor cv0 using Eq. (5).
The measured k is defined by having 99% of genes with βp/βm > k. Uncertainties represent standard errors determined from 3744 to 9770 genes depending on the organism
NATURE COMMUNICATIONS | https://doi.org/10.1038/s41467-018-07391-8 ARTICLE
NATURE COMMUNICATIONS | (2019) 10:68 | https://doi.org/10.1038/s41467-018-07391-8 | www.nature.com/naturecommunications 3
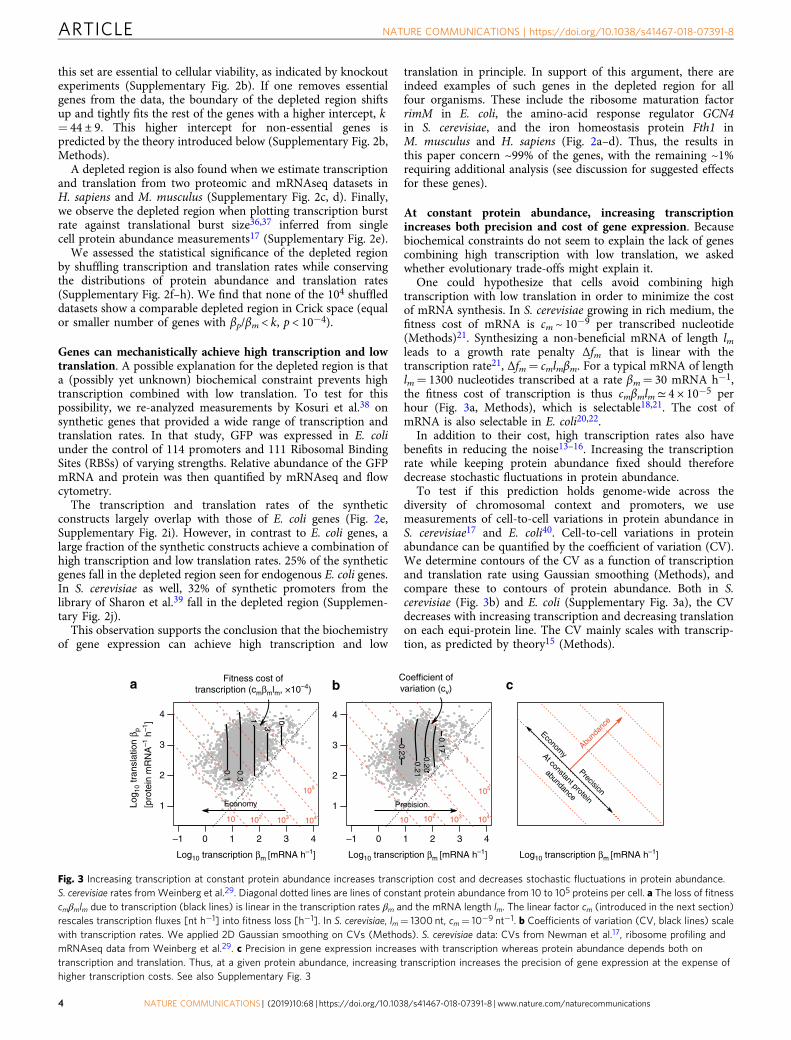
this set are essential to cellular viability, as indicated by knockoutexperiments (Supplementary Fig. 2b). If one removes essentialgenes from the data, the boundary of the depleted region shiftsup and tightly fits the rest of the genes with a higher intercept, k= 44 ± 9. This higher intercept for non-essential genes ispredicted by the theory introduced below (Supplementary Fig. 2b,Methods).
A depleted region is also found when we estimate transcriptionand translation from two proteomic and mRNAseq datasets inH. sapiens and M. musculus (Supplementary Fig. 2c, d). Finally,we observe the depleted region when plotting transcription burstrate against translational burst size36,37 inferred from singlecell protein abundance measurements17 (Supplementary Fig. 2e).
We assessed the statistical significance of the depleted regionby shuffling transcription and translation rates while conservingthe distributions of protein abundance and translation rates(Supplementary Fig. 2f–h). We find that none of the 104 shuffleddatasets show a comparable depleted region in Crick space (equalor smaller number of genes with βp/βm < k, p < 10−4).
Genes can mechanistically achieve high transcription and lowtranslation. A possible explanation for the depleted region is thata (possibly yet unknown) biochemical constraint prevents hightranscription combined with low translation. To test for thispossibility, we re-analyzed measurements by Kosuri et al.38 onsynthetic genes that provided a wide range of transcription andtranslation rates. In that study, GFP was expressed in E. coliunder the control of 114 promoters and 111 Ribosomal BindingSites (RBSs) of varying strengths. Relative abundance of the GFPmRNA and protein was then quantified by mRNAseq and flowcytometry.
The transcription and translation rates of the syntheticconstructs largely overlap with those of E. coli genes (Fig. 2e,Supplementary Fig. 2i). However, in contrast to E. coli genes, alarge fraction of the synthetic constructs achieve a combination ofhigh transcription and low translation rates. 25% of the syntheticgenes fall in the depleted region seen for endogenous E. coli genes.In S. cerevisiae as well, 32% of synthetic promoters from thelibrary of Sharon et al.39 fall in the depleted region (Supplemen-tary Fig. 2j).
This observation supports the conclusion that the biochemistryof gene expression can achieve high transcription and low
translation in principle. In support of this argument, there areindeed examples of such genes in the depleted region for allfour organisms. These include the ribosome maturation factorrimM in E. coli, the amino-acid response regulator GCN4in S. cerevisiae, and the iron homeostasis protein Fth1 inM. musculus and H. sapiens (Fig. 2a–d). Thus, the results inthis paper concern ~99% of the genes, with the remaining ~1%requiring additional analysis (see discussion for suggested effectsfor these genes).
At constant protein abundance, increasing transcriptionincreases both precision and cost of gene expression. Becausebiochemical constraints do not seem to explain the lack of genescombining high transcription with low translation, we askedwhether evolutionary trade-offs might explain it.
One could hypothesize that cells avoid combining hightranscription with low translation in order to minimize the costof mRNA synthesis. In S. cerevisiae growing in rich medium, thefitness cost of mRNA is cm ~ 10−9 per transcribed nucleotide(Methods)21. Synthesizing a non-beneficial mRNA of length lmleads to a growth rate penalty Δfm that is linear with thetranscription rate21, Δfm= cmlmβm. For a typical mRNA of lengthlm= 1300 nucleotides transcribed at a rate βm= 30 mRNA h−1,the fitness cost of transcription is thus cmβmlm≃ 4 × 10⁻⁵ perhour (Fig. 3a, Methods), which is selectable18,21. The cost ofmRNA is also selectable in E. coli20,22.
In addition to their cost, high transcription rates also havebenefits in reducing the noise13–16. Increasing the transcriptionrate while keeping protein abundance fixed should thereforedecrease stochastic fluctuations in protein abundance.
To test if this prediction holds genome-wide across thediversity of chromosomal context and promoters, we usemeasurements of cell-to-cell variations in protein abundance inS. cerevisiae17 and E. coli40. Cell-to-cell variations in proteinabundance can be quantified by the coefficient of variation (CV).We determine contours of the CV as a function of transcriptionand translation rate using Gaussian smoothing (Methods), andcompare these to contours of protein abundance. Both in S.cerevisiae (Fig. 3b) and E. coli (Supplementary Fig. 3a), the CVdecreases with increasing transcription and decreasing translationon each equi-protein line. The CV mainly scales with transcrip-tion, as predicted by theory15 (Methods).
Fitness cost oftranscription (cmβmlm, ×10–4)
4
3
2
1Log 1
0 tr
ansl
atio
n β p
[pro
tein
mR
NA
–1 h
–1]
–1 0 1 2 3 4
Log10 transcription βm [mRNA h–1] Log10 transcription βm [mRNA h–1] Log10 transcription βm [mRNA h–1]
1
3
10
0.3
0.1
Economy
105105
104 104103 103102 10210 10
Coefficient ofvariation (cv)
4
3
2
1
0.17
0.200.21
0.23
Precision
–1 0 1 2 3 4
Abund
ance
Economy
Precision
At constant protein
abundance
a b c
Fig. 3 Increasing transcription at constant protein abundance increases transcription cost and decreases stochastic fluctuations in protein abundance.S. cerevisiae rates fromWeinberg et al.29. Diagonal dotted lines are lines of constant protein abundance from 10 to 105 proteins per cell. a The loss of fitnesscmβmlm due to transcription (black lines) is linear in the transcription rates βm and the mRNA length lm. The linear factor cm (introduced in the next section)rescales transcription fluxes [nt h−1] into fitness loss [h−1]. In S. cerevisiae, lm= 1300 nt, cm= 10−9 nt−1. b Coefficients of variation (CV, black lines) scalewith transcription rates. We applied 2D Gaussian smoothing on CVs (Methods). S. cerevisiae data: CVs from Newman et al.17, ribosome profiling andmRNAseq data from Weinberg et al.29. c Precision in gene expression increases with transcription whereas protein abundance depends both ontranscription and translation. Thus, at a given protein abundance, increasing transcription increases the precision of gene expression at the expense ofhigher transcription costs. See also Supplementary Fig. 3
ARTICLE NATURE COMMUNICATIONS | https://doi.org/10.1038/s41467-018-07391-8
4 NATURE COMMUNICATIONS | (2019) 10:68 | https://doi.org/10.1038/s41467-018-07391-8 | www.nature.com/naturecommunications
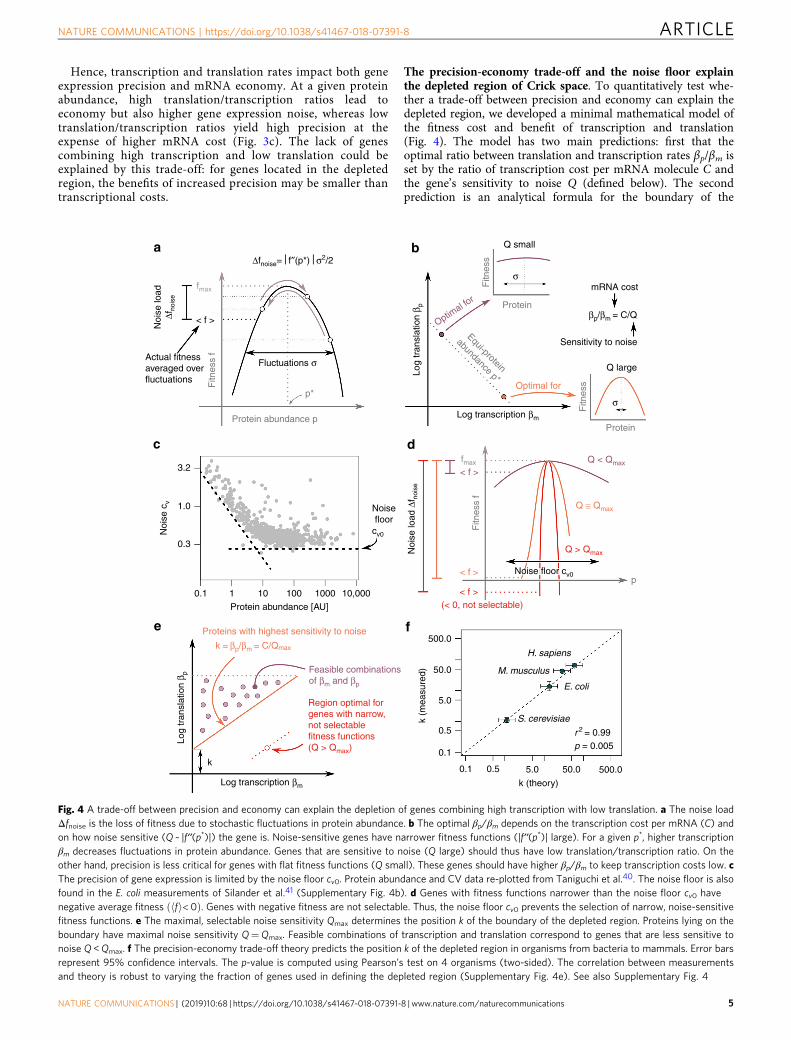
Hence, transcription and translation rates impact both geneexpression precision and mRNA economy. At a given proteinabundance, high translation/transcription ratios lead toeconomy but also higher gene expression noise, whereas lowtranslation/transcription ratios yield high precision at theexpense of higher mRNA cost (Fig. 3c). The lack of genescombining high transcription and low translation could beexplained by this trade-off: for genes located in the depletedregion, the benefits of increased precision may be smaller thantranscriptional costs.
The precision-economy trade-off and the noise floor explainthe depleted region of Crick space. To quantitatively test whe-ther a trade-off between precision and economy can explain thedepleted region, we developed a minimal mathematical model ofthe fitness cost and benefit of transcription and translation(Fig. 4). The model has two main predictions: first that theoptimal ratio between translation and transcription rates βp/βm isset by the ratio of transcription cost per mRNA molecule C andthe gene’s sensitivity to noise Q (defined below). The secondprediction is an analytical formula for the boundary of the
Noi
se lo
adΔf
nois
e
fmax
< f >
Actual fitnessaveraged overfluctuations F
itnes
s f
Δfnoise=⎮f″(p*)⎮σ2/2
Fluctuations σ
p*
Protein abundance pLo
g tr
ansl
atio
n β p
Optimal fo
r
Fitn
ess
Q small
Protein
σ
σ
Equi-protein
abundance p*
mRNA cost
Sensitivity to noise
βp/βm = C/Q
Optimal for
Q large
Fitn
ess
ProteinLog transcription βm
3.2
1.0
0.3
Noi
se c
v
Noisefloor
cv0
0.1 1 10 100 1000 10,000
Protein abundance [AU]
Noi
se lo
ad Δ
f noi
se
fmax
< f >
< f >
< f >
Fitn
ess
f
Q < Qmax
Q > Qmax
Q ≅ Qmax
Noise floor cv0
(< 0, not selectable)
Proteins with highest sensitivity to noise
Log
tran
slat
ion
β p
k = βp/βm = C/Qmax
Feasible combinationsof βm and βp
Region optimal forgenes with narrow,not selectablefitness functions(Q > Qmax)
Log transcription βm
k
500.0
50.0
5.0
0.5
0.1
k (m
easu
red)
H. sapiens
M. musculus
E. coli
S. cerevisiae
r 2 = 0.99p = 0.005
0.1 0.5 5.0 50.0 500.0
k (theory)
a
c
e f
d
b
p
Fig. 4 A trade-off between precision and economy can explain the depletion of genes combining high transcription with low translation. a The noise loadΔfnoise is the loss of fitness due to stochastic fluctuations in protein abundance. b The optimal βp/βm depends on the transcription cost per mRNA (C) andon how noise sensitive (Q ~ |f′′(p*)|) the gene is. Noise-sensitive genes have narrower fitness functions (|f′′(p*)| large). For a given p*, higher transcriptionβm decreases fluctuations in protein abundance. Genes that are sensitive to noise (Q large) should thus have low translation/transcription ratio. On theother hand, precision is less critical for genes with flat fitness functions (Q small). These genes should have higher βp/βm to keep transcription costs low. cThe precision of gene expression is limited by the noise floor cv0. Protein abundance and CV data re-plotted from Taniguchi et al.40. The noise floor is alsofound in the E. coli measurements of Silander et al.41 (Supplementary Fig. 4b). d Genes with fitness functions narrower than the noise floor cv0 havenegative average fitness fh i<0ð Þ. Genes with negative fitness are not selectable. Thus, the noise floor cv0 prevents the selection of narrow, noise-sensitivefitness functions. e The maximal, selectable noise sensitivity Qmax determines the position k of the boundary of the depleted region. Proteins lying on theboundary have maximal noise sensitivity Q=Qmax. Feasible combinations of transcription and translation correspond to genes that are less sensitive tonoise Q <Qmax. f The precision-economy trade-off theory predicts the position k of the depleted region in organisms from bacteria to mammals. Error barsrepresent 95% confidence intervals. The p-value is computed using Pearson’s test on 4 organisms (two-sided). The correlation between measurementsand theory is robust to varying the fraction of genes used in defining the depleted region (Supplementary Fig. 4e). See also Supplementary Fig. 4
NATURE COMMUNICATIONS | https://doi.org/10.1038/s41467-018-07391-8 ARTICLE
NATURE COMMUNICATIONS | (2019) 10:68 | https://doi.org/10.1038/s41467-018-07391-8 | www.nature.com/naturecommunications 5
depleted region—the lower bound k on the βp/βm ratio—based onfundamental parameters.
To determine the optimal βp/βm ratio under the precision-economy trade-off, we first model how the βp/βm ratio affectsmRNA economy and precision. We then model how mRNAeconomy and precision affect fitness. Finally, we determine ananalytical expression for the optimal βp/βm ratio.
To compute how the βp/βm ratio affects economy, we modelthe fitness cost of transcription21 by the linear function Δfm=cmlmβm where lm is the (pre-)mRNA length and cm is the fitnesspenalty per transcribed nucleotide. cm can be estimated from thegrowth rate μ and the total transcriptional output
Pβm if we
assume that non-beneficial mRNA are transcribed at the expenseof mRNAs which code for beneficial proteins. If a total of
Pβmlm
nucleotides are transcribed in a cell, the average fitnesscontribution of each nucleotide is μ=
Pβmlm. This is also the
fitness lost per nucleotide of transcribing a non-beneficial mRNAat the expense of a beneficial mRNA. Thus, the fitness cost pertranscribed nucleotide is
cm ¼ μPβmlm
: ð1Þ
This provides cm ~ 10−9 per nucleotide in S. cerevisiae whichagrees well with experimental measurements mentioned above(Methods).
Although the cost of transcription is typically smaller than thecost of translation18,20,21, the cost of translation needs not bemodeled here. To see why, note that the cost of translation of agene depends on how many proteins are made, regardless ofwhether the proteins are synthesized from few mRNAs or manymRNAs. Thus, provided that p protein copies are needed, thetrade-off is determined by transcription, i.e., whether many or fewmRNAs are made to supply the p copies. The relevant cost ishence the cost of transcription.
To see how βp/βm and precision affect fitness, we consider aprotein of abundance p. The protein contributes a quantity f(p) tothe organism’s fitness (Fig. 4a). Because protein abundancefluctuates around the average expression ph i ¼ p�, the cell doesnot experience the maximum fitness fmax but rather a loweraverage fitness f ðpÞh i. The fitness lost due to stochasticfluctuations in protein abundance Δfnoise is called the noiseload24,25 (Fig. 4a). By expanding the fitness function f to secondorder and averaging over fluctuations in protein abundance, wecan compute the noise load:
Δfnoise ¼ fmax � f ðpÞh i¼ fmax � fmax þ f ′ p�ð Þ p� p�ð Þh
þ 12 f ′′ p
�ð Þ p� p�ð Þ2�¼ 1
2 f ′′ p�ð Þj jσ2:
ð2Þ
Noise load increases with the curvature of the fitness functionsf ′′ p�ð Þj j and with noise σ.To find how βm and βp affect fitness through the precision of
gene expression, we note that βm and βp affect the noise level σ2 ina well-characterized way. Theory and experiments15–17,40 indicatethat the variance of protein abundance is given by
σ2 ’ p21pþ αpβm
þ c2v0
� �ð3Þ
where αp is the protein decay rate and cv0 is the noise floor(Methods). The noise floor is the minimal amount of cell-to-cellvariation in protein abundance in clonal populations17,40–42.
We can now determine the optimal transcription andtranslation rates βm and βp that minimize the combination of
the transcription cost Δfm and of the noise load Δfnoise (Methods),
d cmβmlm þ f ′′ p�ð Þj jσ2=2� �dβm
¼ 0 ) βm ¼ffiffiffiffiffiffiffiffiffiffiffiffiffiffiffiffiffiffiffiαpαmC
Qp�r
) βpβm
¼ CQ
ð4Þ
where C= cmlmαm= cmlmβm/m quantifies the cost of transcriptionper mRNA molecule m for this gene, and Q ¼ 1
2 f ′′ p�ð Þj jp� is thegene’s sensitivity to noise. Genes with narrower fitness functions(larger f ′′ p�ð Þj j) are more sensitive to noise because the noise kicksprotein abundance farther from optimum. The sensitivity of agene to noise also depends on protein abundance p* because thenoise generally scales with protein abundance σ2 ~ p*.
The model therefore predicts a relationship between βp/βmratios and the shape of fitness functions (Fig. 4b). Broad fitnessfunctions should have large βp/βm because genes with broadfitness functions are not sensitive to noise. For those, highprecision provides little benefit, and it is best to maximizeeconomy by lowering transcription. On the other hand, geneswith narrow fitness functions are sensitive to noise. For those,requirements of high precision to keep the noise load lowdominate the cost of transcription. Genes with narrow fitnessfunctions should therefore have small βp/βm ratios.
We compared the model prediction for the curvature of thefitness function near its peak to recent measurement of fitnessfunctions of 21 genes in S. cerevisiae43. We find that thecurvatures predicted from βp/βm are within an order ofmagnitude of the measured curvatures without any fittingparameters (Supplementary Fig. 4a). Predictions and measure-ments correlate positively (r= 0.39). A shuffling test suggests thatthe agreement between the predictions and measurements isunlikely due to chance (p= 0.04, Methods). However, variabilityin the experimental measurements precludes a conclusivecomparison.
To find a lower bound k on βp/βm and explain the boundary ofthe depleted region, we note that there is a limit to how small thenoise in gene expression can be. This limit, called the noise floorcv0, is revealed by measurements of cell-to-cell variation ofprotein abundance in clonal populations17,40–42 (Fig. 4c, Supple-mentary Fig. 4b, c). The cause for the noise floor is a currentresearch topic12 and it has been proposed that it is due toextrinsic noise40 or larger transcriptional burst size of highabundance proteins42. The noise floor puts an upper bound Qmax
on how noise-sensitive genes can be: if a gene had a fitnessfunction narrower than this limit (Q >Qmax), the noise loadwould dominate the benefit of expressing the gene (Fig. 4d),leading to negative fitness. Because genes with Q >Qmax cannotbe selected for, all expressed genes must satisfy Q <Qmax. Theboundary of the depleted region βp/βm= k hence corresponds togenes with highest sensitivity to noise Qmax (Fig. 4e). Thedepleted region βp/βm < k corresponds to transcription andtranslation rates that are optimal for genes with fitness functionstoo narrow given the noise floor.
To find k, we substitute Q=Qmax in Eq. (4) for the optimal βp/βmratio and rewrite k in terms of the noise floor and other cell biologyconstants (Methods):
k ¼ CQmax
¼ βmaxp cv0ffiffiffiffiffiffiffiffiffiffiffiffiffiffiffiffiαpP
βm
q ð5Þ
whereP
βm is the combined transcriptional output of all genes.This expression provides an intuition for the cellular
parameters which set the boundary of the depleted region ofthe Crick space. For example, a larger noise floor cv0 raises theboundary because there is less benefit in having high
ARTICLE NATURE COMMUNICATIONS | https://doi.org/10.1038/s41467-018-07391-8
6 NATURE COMMUNICATIONS | (2019) 10:68 | https://doi.org/10.1038/s41467-018-07391-8 | www.nature.com/naturecommunications
transcription. An increased transcriptional outputP
βm lowersthe boundary because individual mRNAs are less costly, allowingincreased precision in gene expression.
This formula for k accurately predicts the boundary of thedepleted region of Crick space (Fig. 4f; red lines on Fig. 2) despitethe fact that k varies by nearly two orders of magnitude betweenorganisms (Table 1). Thus, the depleted region can be explainedin terms of fundamental parameters such as the noise floor,maximal translation rate, total transcription output, and meanprotein decay rate. Individual cellular constants alone cannotaccurately predict k (Supplementary Fig. 4d). Neither can k bepredicted by noise alone without considering economy, such ashypothesizing that the depleted region is made of all βm and βpfor which increasing transcription provides little extra precisionrelative to the the noise floor (Methods).
DiscussionWe find that the distribution of genes in Crick space is notrandom: genes combining high transcription and low translationare depleted. Such combinations of high transcription and lowtranslation can be achieved with synthetic gene constructs38.Therefore, mechanistic constraints cannot explain this depletion.We explain the depletion by a trade-off between precision andeconomy: increasing transcription at constant protein abundancediminishes stochastic fluctuations, but at a fitness penalty due tothe cost of transcription. High transcription rates are thereforeoptimal for genes that are sensitive to noise whereas low tran-scription rates are well suited for genes that can tolerate highnoise (Fig. 5a). A quantitative model of this trade-off predicts thecurvature of the fitness function for each gene and quantitativelyexplains the boundary of the depleted region.
Combinations of high transcription and low translation areachievable by the gene expression machinery, as evidenced by thethousands of synthetic reporter constructs in the depleted region,and the ~1% natural genes in the depleted region. The depletedregion is also easily reachable by mutations from naturallyoccurring genes—for example, it typically takes a single mutationto turn a strong RBS into a weak RBS44, and single mutations inpromoters can strongly affect transcription45. This strengthensthe hypothesis that the depleted region is due to selection. Weevaluate other hypotheses to explain the depleted region inthe Supplementary Discussion.
Ninety nine percent of the genes lie above the predictedboundary of the depleted region. The remaining 1% fall in the
depleted region. For some of these genes, evidence from focusedstudies indicates low translation rates and/or translation control,such as the E. coli outliers rimM and trmD46, HAC1 in S. cere-visiae47, and Fth1 in M. musculus and H. sapiens48. One expla-nation for such outlier genes is that they face constraints beyondthe precision-economy trade-off. For example, the amino-acidresponse regulator GCN4 in S. cerevisiae is strongly transcribedand poorly translated in rich medium. But under amino-acidimbalance conditions, a general decrease in protein translationtriggers derepression of GCN4 translation through a translationreinitiation mechanism involving short upstream open readingframes49. This regulatory mechanism couples GCN4 synthesis totranslation stress. It also bypasses transcription, which couldallow for rapid upregulation. Such considerations of regulatorycouplings or speed might overshadow precision-economy-basedlimits for certain genes, especially genes responsible for survivalupon changes in the environment50. We consider other aspects ofgene regulation beyond precision and economy in the Supple-mentary Discussion.
The distribution of genes in Crick space is bounded aboveby the maximal translation rate (103.6–104 proteins h−1), andbelow by the boundary of the depleted region. The positionof each gene in this space is determined, in the present picture,by the curvature of its fitness function. Genes with a narrowfitness function are most sensitive to noise, and are predicted tolie near the boundary of the depleted region. Genes with abroader fitness function are predicted to lie farther abovethis boundary. This prediction suggests an experimental testby measuring the curvature of the fitness function and comparingto the prediction. Accurate measurements of fitness functionscan be performed by titrating protein concentration experimen-tally and measuring fitness. A recent experiment measured suchfitness functions for 85 genes in S. cerevisiae43. While we founda statistical agreement between the predicted and measuredcurvatures of fitness functions, the measurement errors weretoo large to permit a meaningful comparison to the presentpredictions (Supplementary Fig. 4a). Further experiments tomeasure fitness functions can test whether transcription andtranslation rates predict fitness curvature near the peak. Alter-natively, transcription and translation could be manipulated toquantify the effect of precision and economy on fitness. Suchexperiments are challenging because state-of-the art assays candetect fitness changes of ~1% which is bigger than the fitnesschanges visible to natural selection (10−8 to 10−4 h−1 dependingon the species).
Log
tran
slat
ion
β p
Log transcription βm Log transcription βm Log transcription βm
βpmax
Genes that tolerate noise
Genes
sens
itive
to n
oise
Deplet
ed
regio
n Log
tran
slat
ion
β p
Log
tran
slat
ion
β p
Equi-proteinabundance
a b c
Abund
ance
Precision
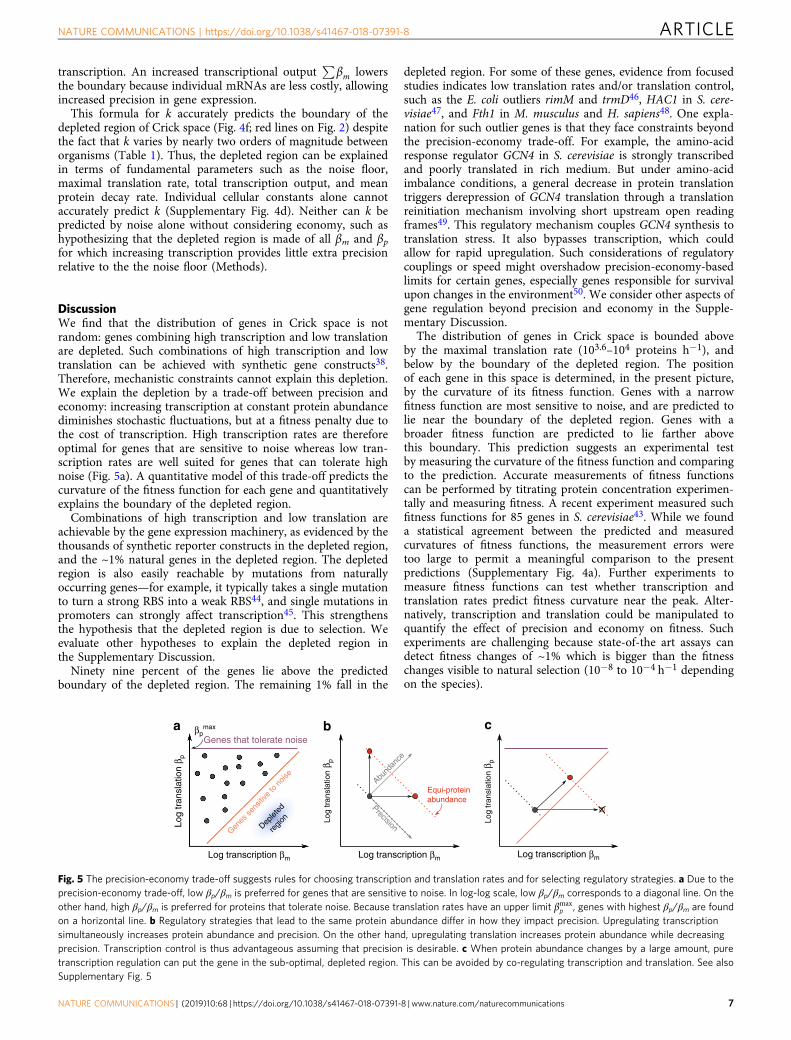
Fig. 5 The precision-economy trade-off suggests rules for choosing transcription and translation rates and for selecting regulatory strategies. a Due to theprecision-economy trade-off, low βp/βm is preferred for genes that are sensitive to noise. In log-log scale, low βp/βm corresponds to a diagonal line. On theother hand, high βp/βm is preferred for proteins that tolerate noise. Because translation rates have an upper limit βmax
p , genes with highest βp/βm are foundon a horizontal line. b Regulatory strategies that lead to the same protein abundance differ in how they impact precision. Upregulating transcriptionsimultaneously increases protein abundance and precision. On the other hand, upregulating translation increases protein abundance while decreasingprecision. Transcription control is thus advantageous assuming that precision is desirable. c When protein abundance changes by a large amount, puretranscription regulation can put the gene in the sub-optimal, depleted region. This can be avoided by co-regulating transcription and translation. See alsoSupplementary Fig. 5
NATURE COMMUNICATIONS | https://doi.org/10.1038/s41467-018-07391-8 ARTICLE
NATURE COMMUNICATIONS | (2019) 10:68 | https://doi.org/10.1038/s41467-018-07391-8 | www.nature.com/naturecommunications 7
Beyond optimizing transcription and translation under aprecision-economy trade-off, an additional reason why genes maylie farther above the boundary of the depleted region is thepossibility that noise is beneficial for some genes. This occurs forexample in cases of bet hedging where a gene product brings littleor no fitness advantage at present, but expression is maintainedin case conditions change so that the gene productbecomes important. In such cases, theory and experiments haveshown that a wide cell–cell variation in protein level can bebeneficial51–55. Such genes expressed for possible future needs arepredicted to lie far above the boundary of the depleted region.This prediction is in agreement with the finding of stress genes atrelatively high positions above the boundary, and of essentialgenes closer to the boundary (Supplementary Fig. 5a, b, Supple-mentary Table S2, Supplementary Data 1).
The theory has further testable predictions. By expressinga protein from different synthetically produced combinationsof translation and transcription rates, one should find thatthere is an optimal translation/transcription ratio. Upon changinggrowth conditions such that the protein becomes even moreimportant for growth, the optimal transcription rate shouldincrease whereas the optimal translation rate should show littlechange.
The finding that essential, high-precision genes are locatedclose to the boundary of the depleted region has implications forsynthetic circuit design. If a protein needs to have a specificabundance for the circuit to function properly, that proteinshould be expressed using a promoter and ribosomal binding sitethat puts it close to the boundary of the depleted region. Inother words, the optimal design should have βp/βm= k witha value of k appropriate to the organism (Table 1). On theother hand, if the circuit is insensitive to the exact concentrationof that protein, the protein should be expressed using a weakerpromoter and stronger RBS to save transcriptional resources.Combinations of strong transcription (promoters, enhancers)with weak translation (RBS and so on) should be avoided becausethey incur high transcriptional cost with no extra precisionbenefit.
The present approach can also help interpret the mode ofregulation when the abundance of a protein needs to change.Increasing a protein level can be done by increasing transcription,translation, or both. Studies in several organisms indicate thattranscription regulation is more prevalent and strong thantranslation regulation for most genes3,28,32,33,56. The presenttheory provides a possible explanation for this observation(Fig. 5b). Transcription regulation increases protein abundanceand at the same time decreases noise. Translation regulation willincrease noise. Thus transcription control is advantageousassuming that precision is more desirable than economy. Preci-sion could be more desirable than economy for genes whichbecome key to growth upon a change in condition, such asamino-acids biosynthesis genes upon a sudden amino-aciddepletion (Supplementary Fig. 5j). For these genes, fluctuationsleading to low expression would be penalizing. This penalty canbe mitigated by increasing transcription. The relatively rare casesof strong translation regulation may be due to considerations offaster response time, or to cases where it is beneficial to reduceprecision, such as in bet hedging51. One interesting case is whenproteins need to be upregulated from a very-low to a very-highlevel. Geometric considerations rule out a purely transcriptionalregulation, because this will put the gene into the depleted region;instead, a combined transcription and translation upregulation ispredicted (Fig. 5c).
The present findings suggest that translation/transcriptionratios are determined to some extent by rules, such as precision-economy trade-offs. Rules have been proposed in the past to
explain features of the complexity of biological systems57–59.Patterns such as empty regions of the Crick space can help definethe rules, similar to the way empty regions of morphospaces inanimal morphology or single-cell gene expression can be used toinfer potential evolutionary tasks and trade-offs60–62. It would beinteresting to discover additional rules for gene expression inorder to interpret the evolved design of cells and to improveengineering of synthetic circuits.
MethodsCentral dogma rates and steady-state mRNA & protein abundance. Using acommonly used formalism4,26, gene expression can be modeled as a dynamicsystem. The system has two variables, m and p which represent the number ofmRNAs and proteins per cell.
mRNAs are transcribed at a rate βm [mRNA/h] and decay at a rate αm. Proteinsare translated at a rate βp [protein mRNA−1 h−1)] and decay at a rate αp.
The protein decay rate αp [h−1] combines the effect of 1. degradation αdeg [h−1]and 2. dilution by cell growth and division which takes place at rate μ [h−1].Thus αp= αdeg+ μ64. This consideration also applies to mRNA decay rates.However, mRNA decay is typically much faster than the cell cycle time(Supplementary Table 1). As a result, mRNA decay rate is set by thedegradation rate.
Using these reaction rates, we can write the dynamics of m and p as
dmdt
¼ βm � αmm ð6Þ
dpdt
¼ βpm� αpp: ð7Þ
To compute steady-state mRNA and protein abundance, we set dm/dt= dp/dt= 0. Solving for m and p yields expressions for steady-state mRNA and proteinabundance as function of the central dogma reaction rates
m ¼ βmαm
ð8Þ
p ¼ βmβpαmαp
: ð9Þ
Data sources and cellular constants in four organisms. S. cerevisiae: Weobtained the processed Reads Per Kilobase per Million (RPKMs) of themRNAseq and RP experiments of Weinberg et al.29 from GEO (GSE75897). Weused the RiboZero mRNAseq experiment. Experimental measurements estimateNm= 60,000 mRNA copies per cell65 cellular volume at 37 μm3 (BNID10043066).Given a protein concentration67 of 3 × 106 μm−3, we estimate that there are Np≃1.1 × 10⁸ proteins per cell. We used a cell division time of 99 min (BNID101310).Given that the median protein half-life (excluding the dilution factor) is 45 min68,the typical protein decay rate is αp= 60(log(2)/45+ log(2)/99)= 1.34 h−1. Eseret al.69 estimated the typical mRNA decay rate at αm= 5.1 h−1. Multiple experi-ments found a noise floor cv0≃ 0.116,17,70.
E. coli: From the sequence reads archive, we downloaded the mRNAseq readsand RP reads from the experiments Li et al.3 performed in rich medium(mRNAseq: SRR1067773, SRR1067774, RP: SRR1067765, SRR1067766,SRR1067767, SRR1067768). We obtained the E. coli genome sequence andtranscriptome annotation from NCBI (accession NC_000913.3).
All genome mappings were performed using Bowtie2 in local alignmentmode. We discarded all technical reads as well as reads that mapped against non-coding RNAs, defined as transcripts marked as ncRNA, rRNA, or tRNA in thegenome annotation. Remaining reads were mapped to transcripts marked as CDSin the genome annotation. RP reads were mapped to coding transcripts aftertrimming the first and last 5 codons to remove the effect of translation initiationand termination. Reads that mapped equally well to multiple loci were assigned toone of the loci at random. We then computed RPKMs per gene. Becausereproducibility between runs was high, we combined reads from all runs forsubsequent analyses.
The resulting mRNA abundances and protein synthesis rates estimates werehighly correlated with those computed by Li et al.3 (r2 > 0.99). Differences could bedue to the updated genome version we used (NC_000913.3 vs NC_000913.2 in theoriginal analysis of Li et al.), differences in the aligner (we used Bowtie2 while Liet al.3 used Bowtie), and other differences in the implementation of thebioinformatics pipeline. Repeating all the E. coli analyses using the proteinsynthesis rates from Supplementary Table 1 and mRNA abundance SupplementaryTable S4 of Li et al.3 leads to minor changes in the exact position of genes in Crickspace and supports all conclusions presented in this article.
ARTICLE NATURE COMMUNICATIONS | https://doi.org/10.1038/s41467-018-07391-8
8 NATURE COMMUNICATIONS | (2019) 10:68 | https://doi.org/10.1038/s41467-018-07391-8 | www.nature.com/naturecommunications
There are 1380 mRNAs per cell (BNID100064). Cell volume is ≃1 μm3
(BNID100004). Assuming a protein concentration67 of 3 × 106 μm−3, there are about3 × 106 proteins per cell. Doubling time was measured by Li et al.3 at 21.5min, whichputs the growth rate at μ= 60 log(2)/21.5= 1.93 h−1. RP RPKMs correlate well withprotein abundance3. This suggests that protein decay mainly takes place throughdilution. Thus, protein degradation can be neglected in estimating protein decay formost proteins: αdeg= 0⇒ αp= αdeg+ μ= μ. The median mRNA half-life is 2.8min71, which corresponds to decay rate αm= 14.9 h−1. The noise floor cv0 wasmeasured to be about 0.25: 0.27 ± 0.01 in Taniguchi et al.40, 0.22 ± 0.01 in Silanderet al.41.
M. musculus: We downloaded the processed RPKMs of the mRNAseq and RPexperiments of30 from GEO (GSE60426).
Given a 3T3 cell volume of V= 2000 μm326 and a protein concentration of 3 × 10⁶
per μm3, there are Np≃ 6.0 × 10⁹ proteins per cell67. Measurements suggest that thereare around Nm= 180,000 mRNAs per 3T3 cell26. Following experimentalmeasurements26, we used a cell cycle time of 24 h and a protein half-life of 48 h (afterremoving the effect of cell division26). These numbers correspond to a growth rate μ= 0.03 h−1 and a degradation rate αdeg= 0.01 h−1, which puts the protein decay rateat αp= μ+ αdeg= 0.04 h−1. Friedel et al.72 found a median mRNA decay rate of αm= 0.14 h−1 in 3T3 cells, which is the value we used here. Another study26, also in 3T3cells, measured a median decay rate of αm= 0.08 h−1, a value for which the predictedboundary is also in good agreement with rates measurements (SupplementaryFig. 2k). To our knowledge, the noise floor cv0 hasn’t been measured in mouse. Wetherefore used the noise floor from the closest organism in evolutionary terms, namelyH. sapiens.
H. sapiens: We downloaded the processed RPKMs of the mRNAseq and RPexperiments of30 from GEO (GSE60426).
Given a cellular volume of V= 2500 μm3 (BNID103725) and a proteinconcentration67 of 3 × 10⁶/μm3, there are about Np= 7.5 × 10⁹ proteins per cell. Adivision time of 22 h (BNID109393) corresponds to a growth rate μ= 0.03 h−1.The protein degradation rate measurements of Cambridge et al.73 found αdeg=0.02 h−1. This puts the effective protein decay rate at αp= μ+ αdeg= 0.05 h−1. Wecould not find direct measurements of the number of mRNAs per HeLa cell Nm. Aback of the envelope calculation puts Nm in the 105–106 range67. This is consistentwith recent smFISH and RNAseq measurements which found 105 mRNAs inMIN6 and 106 mRNAs in liver cells74. Starting with the 180,000 mRNAs per 3T3cells26 and assuming that mRNA content scales with cell volume, we estimate Nm
≃ 180,000 × 2500/2000= 225,000 mRNA per HeLa cell. The accuracy of thepredicted boundary of the depleted region is robust to halving or doubling Nm
(112,500 <Nm < 450,000, see Supplementary Fig. 2l, m). Gregersen et al.75
measured mRNA half-lives in (human) HEK293 cells and found a median half-lifeof 11.4 h, which we used to compute the mRNA decay rate (αm= 0.06 h−1).Another study measured a median half-life of 5 h in human B-cells (BL41)72, avalue for which the predicted boundary of the depleted region is also in goodagreement with experimental data (Supplementary Fig. 2n). Dar et al.42 found anoise floor cv0≃ 0.3.
Estimating transcription and translation from omics datasets. For each gene i,we estimated the number of mRNAs per cell mi from the total number of mRNAsper cell Nm from the per-gene mRNAseq RPKM ri data as
mi ¼ NmriPj rj
: ð10Þ
At steady-state, mRNA abundance m is the ratio of the transcription rate βm to themRNA decay rate αm4. We thus estimated the transcription rates of each gene as
βm;i ¼ miαm ð11Þ
where αm is the median mRNA decay rate (Supplementary Table 1). Finally, weestimated translation rates βp by combining three numbers: the total number ofproteins per cell Np, the protein decay rate αp, and the gene’s RP RPKM si of gene i.The number of proteins synthesized per time unit is Npαp. A fraction si=
Pi si of
this protein synthesis flux is translated from mRNAs mi of gene i. We estimate thetranslation rate βp,i (expressed per mRNA copy per cell) by dividing the proteinsynthesis of each gene by the mRNA copy number mi:
βp;i ¼Npαpmi
siPj sj
: ð12Þ
Estimates of Np and αp are provided in Supplementary Table 1.To address the concern that gene-to-gene variations in the translation
elongation rate may bias our estimates, we compared protein synthesis ratescomputed from protein abundance and decay data pαp measured by mass-spectrometry26 to the protein synthesis rates estimated from ribosomaldensity βpm29 on the same cell line (Mouse 3T3). We find that protein synthesisrates correlate well (Supplementary Fig. 1e, r= 0.70, p < 10−15 at Pearson’stest on more than 3000 genes). This agreement is probably due to the factthat although elongation rates vary from gene to gene, the initiation rates varymore (3-fold versus 1000-fold)76. Thus the latter tend to determine most of thevariation.
To evaluate the effect of this simplification, we plot genes in 2D Crick spacetaking gene-specific mRNA and protein decay rates into account (SupplementaryFig. 1f). We then assign the same median mRNA and protein decay rates toall genes to re-estimate transcription and translation rates (Supplementary Fig. 1g).The gene positions in the two resulting 2D Crick spaces differ by less than 0.3(root mean square deviation in log10 rates), which is ≃10% of the total variation(about 3 log10 units in transcription and translation rates). We conclude thattaking into account gene-specific mRNA and protein decay rates has only asmall impact on the position of genes in 2D Crick space and thus on presentconclusions.
Sequencing data processing. We consider only genes for which the measurementerror was small enough to allow accurate estimation of transcription and trans-lation rates. Accurate estimation of these rates is difficult for low abundancemRNAs because they may only collect a handful of reads. This leads to a largeuncertainty on the mRNA copy number m, and thus on the transcription rate βm=mαm. How many reads per gene should we require to be confident about ourestimates of transcription rates?
Estimates of mRNA abundance m scale with the number of reads n mapping toa given gene (relative to the gene length). We thus compute the minimum numberof reads per gene needed to keep the sampling noise on log10 mRNA abundancebelow a certain threshold ε
log10nþ σ
n
� �< ε ð13Þ
where σ is the standard deviation on n due to the sampling error. We modelsequencing as a Poisson process, and thus σ ¼ ffiffiffi
np
. Substituting this expression forσ into Eq. (13), we compute the minimal number of reads necessary to control for agiven error ε on log10 mRNA abundances:
n>1
10ε � 1
� �2
: ð14Þ
A minimum of 10 reads per mRNA is needed to keep the sampling error onlog10 transcription rates in the ±0.1 range (Supplementary Fig. 2o). We thereforediscard genes with less than 10 reads per gene, a procedure which keeps thesampling error low while keeping as many genes as possible in the analysis.Similarly, we require at least ribosomal profiling 20 reads per gene. We applied thesame criteria to all four organisms. We repeated the analyses keeping only geneswith at least 100 RP reads and reached the same conclusions as the one presentedin the article.
In M. musculus and H. sapiens, we discarded canonical histone genes from theanalysis because their mRNAs lack a polyA-tail. The polyA+ selection step ofmRNAseq discriminates against these mRNAs. Consequently, the abundance ofcanonical histone mRNAs is underestimated by mRNAseq RPKMs, leading toaberrant (high) translation rate estimates.
Estimating maximal translation rates. To estimate the maximal translation rate,we ask how fast proteins can be translated βmax
p from a single mRNA in the limitwhere translation initiation is no longer limiting. In this regime, ribosomes followeach other closely along the mRNA. A given ribosome needs to move forwardbefore the next one can advance. The speed at which ribosome elongate the peptidechain and how many codons each ribosome occupies on the mRNA determine howfast proteins can be synthesized.
If a ribosome occupies L codons on the mRNA and v codons are translated intoamino-acids per second, it takes L/v seconds for a ribosome to free space for thenext ribosome. The maximal flux of ribosomes at given codon is thus v/L. This fluxsets an upper bound on the translation rate: βmax
p ¼ v=L.In S. cerevisiae, the elongation rate v in favorable growth conditions is 10
amino-acids per second (BNID107871). Each ribosome occupies 28 nucleotides(BNID107874), so L= 9.3 codons. This puts the maximal translation rate βmax
p at103.6 proteins per hour. This bound is in good agreement with estimatedtranslation rate in S. cerevisiae and other eukaryotes.
In E. coli, translation rate can be up to 104 proteins per hour (Fig. 2). While thesize of ribosomal footprints have not been determined, prokaryotes have smallerribosomes (21 nm, BNID102320) than eukaryotes (26.5 nm, BNID111542) and soribosomal footprints should be smaller. Assuming that ribosomal footprints areproportional to the size of the ribosome, we estimate that prokaryotic ribosomescover 22 nt or L= 7.3 codons. In favorable conditions, E. coli can elongate up to v= 21 amino-acids per second (BNID100059). This leads to a maximal translationrate of βmax
p ¼ 104 proteins per hour.
Testing the statistical depletion of genes in Crick space. To test for a statisticalsignificant depletion of genes combining high transcription with low translation,we used a randomization strategy.
First, we defined the depleted region as the sub-region of the Crick space lyingbelow a line of slope 1 that has 1% of the genes below it. We defined the depletedregion in this way because yielded a visually convincing fit between the boundary
NATURE COMMUNICATIONS | https://doi.org/10.1038/s41467-018-07391-8 ARTICLE
NATURE COMMUNICATIONS | (2019) 10:68 | https://doi.org/10.1038/s41467-018-07391-8 | www.nature.com/naturecommunications 9
and the data in all four organisms, using a uniform criteria. We then asked if thisfigure of 1% was high or low compared to chance.
To find out, we randomized transcription and translation rates. Because themain goal of gene expression is to express proteins at the right abundance, werequired that randomized datasets have the same distribution of protein abundanceas the original dataset. Also, we enforced the observed upper bound βp,max ontranslation rates. To do so, we randomly sampled a protein abundance p and atranslation rate βp for each gene. We then computed the correspondingtranscription rates βm= pαmαp/βp, with αm and αp the mRNA and protein decayrates reported in Supplementary Table 1. Finally, we determined what fraction ofgenes in the randomized dataset were found below the line of slope 1 and leaving1% of the genes of the original dataset below it.
We repeated the procedure 104 times to determine the distribution of thefraction of genes in the depleted region expected by chance. We finally estimatedthe p-value that genes avoid combining high transcription with low translationfrom the fraction of randomized datasets with more genes in the depleted regionthan the original dataset.
Estimating transcription and translation for synthetic genes. We compared thedistribution of transcription and translation rates of E. coli genes to that of thesynthetic constructs library of Kosuri et al.38. This study quantified the mRNA andprotein abundance of each construct. The constructs only differed in their ribo-somal binding sites and promoters. We thus assumed that they shared the samemRNA decay rates and protein decay rates. As a result, the transcription rate ofeach construct is proportional to mRNA abundance. Translation rates are pro-portional to the ratio of protein abundance to mRNA abundance.
To compare these measurements to our absolute transcription and translationrates estimates of E. coli genes, we assumed that the strongest promoters and RBSsof Kosuri et al.38 yielded transcription and translation rates comparable to E. coli’sstrongest promoters and RBS. We did so by aligning the 99th percentiles of thetranscription and translation rates of the synthetic constructs to those of E. coligenes.
The conclusions of the comparison are robust to this assumption. For instance,even if we assume that the strongest Kosuri promoters and RBSs achievetranscription rates 10 times higher or lower than the strongest E. coli promoters(i.e., shifting the red cloud of Fig. 2e to the right or to the left by one unit), the hightranscription–low translation region would still be covered by a sizable fraction ofsynthetic constructs.
Expression for the fitness cost of transcription. Experiments and theory suggestthat the fitness cost of transcription Δfm scales with the transcription rates21,22 and(pre-)mRNA length19,77. For a pre-mRNA of length lm and transcription rate βm,we thus write the fitness cost of transcription Δfm as
Δfm ¼ cmlmβm ð15Þ
where the constant cm rescales transcription fluxes (nucleotides per hour) intofitness units (per hour).
The exact biochemical process responsible for the cost of transcription costsis still under debate. The main candidates include the limited availability of theRNA polymerase which limits the initiation step21 and the availability ofnucleotides18.
To estimate the proportionality constant cm, we hypothesize that transcriptionalresources are limiting. In this case, making one non-beneficial mRNA comes at acost because it replaces mRNAs coding for fitness-contributing proteins, whichleads to a loss of fitness. On average, the fitness contribution of a useful mRNA isμNm
where μ is the growth rate and Nm ¼ Pβm=αm is the total number of mRNAs
per cell. Therefore, the fitness cost of making m= βm/αm mRNAs is
Δfm ¼ μ
Nmm ¼ μ
lmNmlm
βmαm
: ð16Þ
By identifying the terms in Eqs. (15) and (16), we see that cm can be estimated fromthe growth rate μ, the typical pre-mRNA length lm and the total transcriptionalcapacity
Pβm
cm ¼ μ
lmαmNm¼ μ
lmP
βm: ð17Þ
cm has units of nt−1. Alternatively, cm can also be expressed per mRNA copy(which we will use in the next section):
cm ¼ μPm
¼ μ
Nmð18Þ
where Nm is the number of mRNAs per cell.
Predicting mRNA cost from cellular constants in E. coli. In this section, we showthat the expression for cm derived in the previous section predicts the fitness cost ofsynthesizing mRNA in E. coli. For this, we use the data of Kosuri et al.38 whoquantified the abundance of 10,000 different clones that express a fluorescent
protein under the control of different promoters and RBSs. As a result, differentclones express the fluorescent protein at a different abundance p, from a differentnumber of mRNAs m.
We model mRNA and protein cost cm and cp as linear penalties on the growthrate μ
μ ¼ μ0 � cpp� cmm ð19Þ
where μ0 is the rate at which cells would grow in the absence of a fluorescentprotein construct. If cells are growing exponentially for t hours, the concentrationxm,p(t) of a clone that expresses m non-beneficial mRNAs and p proteins is
xm;pðtÞ ¼ xm;pð0Þeμt : ð20Þ
We can normalize xm,p(t) to the concentration of clones x0,0(t) that express m and pat low levels and hence don’t experience a growth penalty (μ≃ μ0):
logxm;pðtÞx0;0ðtÞ
¼ �tcpp� tcmm: ð21Þ
Here, we have assumed that the transformation efficiency of clones is independentof m and p (xm,p(0)≃ x0,0(0)). We estimate xm,p(t)/x0,0(t) from the ratio between theDNA counts of each clone and the DNA counts of clone that expressed low levelsof GFP (prot < 1.5 × 10³ in Table S3 of Kosuri et al.38).
To test if mRNA cost is selectable, we perform two linear regression analyses:
one regression of logxm;pðtÞx0;0ðtÞ on p alone, and one regression of log
xm;pðtÞx0;0ðtÞ on p and m.
Using the F-test for nested linear models, we find that the squared residuals for theregression on m and p are significantly smaller than the squared residuals for theregression on p alone (p < 10−15). Therefore, a model that accounts for mRNA andprotein cost is significantly more accurate at predicting fitness than a model thataccount for protein cost alone. This suggests that the cost of synthesizing mRNA isselectable in E. coli.
The linear regression estimates of mRNA and protein cost are tcm= 4.0 × 10⁻²
mRNA−1, and tcp= 2.2 × 10⁻⁶ protein−1.Since the growth time t is not known precisely, we cannot determine cm and cp
individually. But we can determine their ratio: cm/cp≃ 630. The fitness cost oftranscription theory introduced in the previous section (Eq. (18)) predicts
cmcp
¼ Np
Nm’ 2100 ð22Þ
where Np is the total number of proteins per cell and Nm is the total number ofmRNAs per cell (Supplementary Table 1). Given the typical uncertainty onmeasurements of Np and Nm (2-fold), the 95% confidence for cm/cp ranges from 300to 14,000. We thus find that predictions of mRNA and protein cost agree with themeasurements of Kosuri et al.38.
Finally, we test whether the theoretical estimates for cm and cp,
cm ¼ μ0Nm
; cp ¼μ0Np
; ð23Þ
can predict the abundance of clones. While we need to know the growth time t topredict clone abundance, the correlation between measured and predicted cloneabundance is independent of t (see Eq. (21), which relates clone abundance to thegrowth time and the costs of mRNA and protein).
We find a positive correlation between predictions and measurements of cloneabundance (r= 0.67, p < 10−15). We set t to one day (t= 24 h) in SupplementaryFig. 3b to illustrate the correlation.
In conclusion, the cost of mRNA synthesis in E. coli can be predicted from thegrowth rate and the total transcription output.
Estimating the fitness cost of mRNA in S. cerevisiae. Here we estimate thegrowth penalty of transcription in S. cerevisiae from the measurements of Kafriet al.21. This study introduced a fluorescent protein construct of pre-mRNA lengthlm at different copy numbers n in the S. cerevisiae genome. The protein abundancep of the fluorescent protein depended on the genomic copy number of the con-struct, as did the transcription rate βm.
This study found that the growth rate μ decreases linearly with the genomiccopy number n of the fluorescent protein construct,
μ ¼ μ0 � n cppþ cmlmβm
� �ð24Þ
where μ0 is the growth rate of the WT strain, cm is the growth penalty oftranscription (expressed per transcribed nucleotide) and cp is the protein burden(growth penalty per protein). To compare cost across growth conditions, the studynormalized the growth rate μ of strains with genomic insertions of the construct tothat of WT μ0 (e.g., Fig. 4b of Kafri et al.21):
μ
μ0� 1 ¼ �n
cppþ cmlmβmμ0
� �: ð25Þ
ARTICLE NATURE COMMUNICATIONS | https://doi.org/10.1038/s41467-018-07391-8
10 NATURE COMMUNICATIONS | (2019) 10:68 | https://doi.org/10.1038/s41467-018-07391-8 | www.nature.com/naturecommunications
Following the notation of Kafri et al.21, we call sN the slope of the relative growthrate μ/μ0 as function of the genomic copy number of the construct n. We can writesN in terms of the fitness cost parameters cm and cp:
sN ¼ cppþ cmlmβmμ0
: ð26Þ
To distinguish between the cost of protein and transcription, Kafri et al.21
designed a second construct (DAmP) lacking a terminator, which makes themRNA unstable. This reduces protein synthesis between 10 fold (according toprotein fluorescence) and 30 fold (according to qPCR) with minimal effect ontranscription21. Similar to sN, Kafri et al.21 defined sD as the slope of μ/μ0 as afunction of the genomic copy number n of the DAmP construct. We can also writesD as a function of fitness cost parameters cp and cm:
sD ¼ cpϕpþ cmlmβmμ0
ð27Þ
where the factor ϕ accounts for the decrease in protein synthesis of the DAmPstrains.
From experimental measurements of sN, sD, ϕ, lm, and βm, one can estimate thetranslation cost per nucleotide cm:
ϕsN � sD ¼ cmlmβmðϕ� 1Þμ0
) cm ¼ μ0sD � sNϕ
lmβmð1� ϕÞ : ð28Þ
Experiments in YPD medium21 measured the following values: sN≃ 9.0 × 10⁻³, sD≃ 4.1 × 10⁻³, lm≃ 1000 nt/mRNA, ϕ≃ 0.06, βm≃ 1300 mRNAs h−1, and μ0≃ 0.42h−1. Plugging in these values in Eq. (28) estimates the fitness cost cm pertranscribed nucleotide,
cm ’ 1:2 ´ 10�9 nt�1: ð29Þ
All parameters are known up to two significant digits, except for ϕ (10 ≤ ϕ−1 ≤ 30),which is known up to one significant digit. This puts the measurement uncertaintyat ±1 × 10⁻⁹ nt−1.
Predicting mRNA cost from cellular constants in yeast. Plugging the cellularconstants of S. cerevisiae from Table 1 into the formula for cm (Eq. (17)) estimatesthe transcription cost at cm ¼ μ0=
Pβmlm ’ 1:2 ´ 10�9 nt�1. This value is in
excellent agreement with the experimental measurements of Kafri et al.21. Such anagreement between experimental fitness parameters in the order of the 10−9 mayappear surprising given the typical accuracy of biological measurements. Thereason for such a good agreement is that the parameters are expressed per tran-scribed nucleotide whereas actual measurements were performed for full-lengthmRNAs of a highly transcribed S. cerevisiae gene. Because both the transcriptlength lm and the transcription rates βm are in the order of 103 in the experimentsof Kafri et al.21, we are actually comparing fitness parameters in the order of 10−3,which are accessible experimentally.
Plotting the coefficient of variation over Crick space. We obtained measure-ments of the coefficients of variation cv of S. cerevisiae and E. coli genes from thestudies of Newman et al.17 and Taniguchi et al.40. To determine the contours of cvas a function of transcription and translation, we first applied a Gaussian smoother.The smoother estimates the coefficient of variation cv for given transcription βmand translation βp rates from a weighted average of genes with similar βm and βp.Genes with comparable βm and βp weight more in the average than genes with verydifferent βm and βp.
Formally, we estimated cv(βm, βp) as a weighted average,
cv βm; βp
� �¼ 1P
jwj
Xi
wicv;i ð30Þ
where the Gaussian weights wi are defined as:
wi ¼1ffiffiffiffiffiffiffiffiffiffi2πσ2
p e�1
2
βm�βm;iσ
� �2þ βp�βp;i
σ
� �2h i
: ð31Þ
We set the smoothing width σ to one fifth of the data range. We only plottedcontours of cv(βm, βp) for densely populated regions of the Crick spaceP
wi � 200ð Þ.
Protein fluctuations as a function of the central dogma rates. In this section, wederive an expression for the coefficient of variation cv as a function of the tran-scription rate βm, the protein abundance p and the protein decay rate αp. Followinga extensive line of theoretical and experimental research15,78, we model geneactivation and inactivation as a telegraph process (Supplementary Fig. 3c). Genesare activated at a rate kon and inactivated at a rate koff. Active genes synthesizemRNAs at a rate δ. Messenger RNAs are translated into proteins at a rate βp and
degrade at a rate αm. At steady-state, the coefficient of variation cv on proteinabundance of this stochastic process can be computed analytically15:
c2v ¼ σp
� �2
¼ 1p þ
αpαmβm αpþαmð Þ
þ αpαmkoff αpþαmþkoffþkonð Þkon αpþαmð Þ αpþkoffþkonð Þ αmþkoffþkonð Þ
ð32Þ
The first term of the equation accounts for the Poisson noise on protein abundancestemming from the protein birth-death process. The second term accounts for thenoise caused by translating proteins from mRNAs of low copy number. The lastterm models the noise caused by gene activation and inactivation and transcrip-tional bursting.
At present time, it is difficult to measure koff and kon genome-wideexperimentally. We therefore seek a simplified, approximate expression forthe coefficient of variation cv in which these parameters occur only implicitlythrough the transcription rate βm. Note that βm and kon, koff are related to eachother,
βm ¼ δPon ¼ δkon
kon þ koffð33Þ
where δ is the transcription rate when the gene is in the on state, and Pon is thefraction of time when the gene is active.
E. coli: With a median half-life of 2.5 min71, mRNAs decay much faster thanproteins ðαm � αpÞ. In addition, protein decay αp is mainly set by the cell divisiontime (20 min or longer)79, which is slow compared to gene inactivation which takesplace at the time-scale of seconds78 ðkoff � αpÞ. In this regime, we canapproximate the analytical expression for the coefficient of variation (Eq. (32)) as:
σ
p
� �2
’ 1pþ αp
1βm
þ koffkon koff þ konð Þ
� �: ð34Þ
The gene activation rate kon≃ 10 h−1 is largely constant across E. coli promoters, incontrast to koff which determines the transcription rate βm78. Using Eq. (33) whichrelates the transcription rate βm to gene (in-)activation rates kon and koff, we canrewrite the coefficient of variation in terms of βm,
σ
p
� �2
’ 1pþ αpβm
þ αp1� βm=δ
konð35Þ
where δ≃ 800/h and kon≃ 10/h78.The Poisson noise term 1/p is typically negligible compared to the two
other terms. The small mRNA copy number noise term αp/βm dominates at low βm(Supplementary Fig. 3d). This term is consistent with the observation thatprotein noise initially decreases with protein abundance (Fig. 4c, SupplementaryFig. 4b, c), and that protein noise decreases with transcription (Fig. 3b).
The third term (gene activation noise) becomes dominant for large βm(Supplementary Fig. 3d). Because the third term is almost a constant forphysiological values of βm (Supplementary Fig. 3d), we ask whether it could explainthe noise floor found in the single cell experiments of Taniguchi et al.40 andSilander et al.41.
In the growth conditions of Taniguchi et al.40, the doubling time was150 min, which implies a protein decay rate αp= 0.28 h−1. Plugging this αp inEq. (35), the third term is about 0.03, which is two-fold below the noise floorc2v0 ¼ 0:07 observed in the measurements of Taniguchi et al.40 (Fig. 4c). InSilander et al.41 grew E. coli in M9+ 0.2% arabinose, a condition in whichαp≃ 0.45 h−180. With this αp, the third term is about 0.04, which is comparable tothe noise floor c2v0 ’ 0:05 in the measurements of Silander et al.41 (SupplementaryFig. 4b).
We conclude that gene activation noise may explain the noise floor in themeasurements of Silander et al.41. In the experiments of Taniguchi et al.40, geneactivation noise is too small to explain the noise floor. There, the noise floor may beexplained by other factors such as as extrinsic noise9,40. Independently of thespecific cause of the noise floor, we model it as a phenomenological constantc2v0 ’ 0:06 inferred from the measurements of Taniguchi et al.40 and Silanderet al.41 (or cv0≃ 0.25). This yields an expression for the noise that is accurate withboth datasets,
σ
p
� �2
¼ 1pþ αpβm
þ c2v0: ð36Þ
S. cerevisiae, H. sapiens, M. musculus: In eukaryotes, an approximate expressionfor the coefficient of variation can also be derived, but is slightly more complicatedbecause the separation of time-scales is less clear than in E. coli: messenger RNAsdecay typically faster than proteins, but not by a full order of magnitude. A morerealistic, data-driven assumption is
αm ¼ qαp ð37Þ
NATURE COMMUNICATIONS | https://doi.org/10.1038/s41467-018-07391-8 ARTICLE
NATURE COMMUNICATIONS | (2019) 10:68 | https://doi.org/10.1038/s41467-018-07391-8 | www.nature.com/naturecommunications 11
with q ≃ 3 (Supplementary Table 1). Measurements in S. cerevisiae65 and H.sapiens42 suggest that gene activation dynamics are much faster than protein decay,
kon þ koff � αp: ð38Þ
Under these assumptions, we can approximate the analytical expression for thecoefficient of variation (Eq. (32)) as
σ
p
� �2
’ 1pþ αpβm
q1þ q
1þ βmkoffkon koff þ konð Þ
� �: ð39Þ
Using Eq. (33) which expresses transcription βm as function of gene (in)activationparameters kon, koff, δ, we can eliminate βm from the last term:
σ
p
� �2
’ 1pþ αpβm
q1þ q
1þ δ
koff1� Ponð Þ2
� �: ð40Þ
We also eliminate δ by introducing the transcriptional burst size b, which is theaverage number of mRNAs that are synthesized each time the gene is activated:
b ¼ δ
koff: ð41Þ
Plugging Eq. (41) for b into Eq. (40) for c2v , we obtain:
σ
p
� �2
¼ 1pþ αpβm
ϕ ð42Þ
where
ϕ ¼ q1þ q
1þ b 1� Ponð Þ2� �ð43Þ
accounts for gene activation dynamics.Except for highly expressed genes, the transcriptional burst size b is
typically small (b≃ 1)12. For q= 3 (Supplementary Table 1), varying Pon across itsfull range causes ϕ to vary only between 0.75 and 1.5 (Supplementary Fig. 3e).Hence, in the worst case, neglecting gene activation dynamics by setting ϕ= 1would result in a 1.5-fold error on c2v . We conclude that neglecting geneactivation dynamics by setting ϕ= 1 in Eq. (42) for c2v results in a reasonableapproximation of the coefficient of variation for most genes, except for highlyexpressed genes.
For highly expressed genes, experiments in S. cerevisiae17 and H. sapiens42
found a noise floor. This noise floor might occur when the transcription rateexceeds the maximal rate of gene activation42. In this scenario, high transcriptionrate can only be achieved by increasing the burst size b12,42. Since b is not aconstant in the large βm regime, we rewrite b as in terms of the transcription rateβm. To do so, we combine Eq. (33) which expresses βm in terms of the kinetic ratesof gene activation (kon, koff, δ) and Eq. (41) which defines the burst size b in termsof δ and koff to find
b ¼ δ
koff¼ βm
Ponkoff: ð44Þ
Plugging in this expression for b in Eq. (42) eliminates the burst size:
σ
p
� �2
¼ 1pþ q1þ q
αpβm
þ q1þ q
1� Ponð Þ2αpkoffPon
: ð45Þ
Neglecting the 1/p term which is in the order of 10−3 or smaller, we can get anexpression for the noise floor cv0 by taking the limit of large βm. In this limit, thesecond term in Eq. (45) vanishes and c2v approaches
c2v0 ’q
1þ q
1� Ponð Þ2αpkoffPon
: ð46Þ
Plugging in gene activation parameter values typical for H. sapiens42 (Pon= 0.18,koff= 2 h−1) and setting q= αm/αp= 3, αp= 0.05 h−1 (see Table 1) puts the noisefloor cv0 at 0.27, a value comparable to experimental observations42 (cv0≃ 0.3).Hence, the noise floor on protein abundance could occur when transcription ratessaturate gene activation kinetics. In this case, substituting Eq. (46) for c2v0 into Eq.(45) leads to:
c2v ¼σ
p
� �2
’ 1pþ αpβm
þ c2v0: ð47Þ
This final expression is identical to the one we previously derived for E. coli(Eq. (36)). It would also hold if the noise floor was caused by a mechanismdifferent from the transcriptional saturation of gene activation dynamics, such asextrinsic noise. Note that we neglected the q/(1+ q) term of Eq. (45). This isbecause the resulting approximation error on c2v would be less than 50%(Supplementary Fig. 3e). Because βm scales inversely with c2v (Eq. (47)), neglecting
gene activation kinetics implies at most a 50% error on βm, or equivalently a 0.2error on log10βm. This is small compared the dynamic range of transcription rateswhich vary over 2–3 order of magnitudes.
Expression for the optimal translation/transcription ratio. We consider aprotein of abundance p. The protein contributes a quantity f(p) to the organism’sfitness. The cost of transcription Δfm is linear in the transcription rate βm, the (pre-)mRNA length lm and the fitness cost of transcription per nucleotide cm,
Δfm ¼ cmlmβm: ð48Þ
The overall fitness is thus F= f(p)− Δfm. The fitness function f(p) reaches itsmaximum fmax at p= p* (Fig. 4a). Expanding f(p) around the optimum p= p* tosecond order, the overall fitness becomes
F p; βm� � ’ fmax þ f ′ p�ð Þ p� p�ð Þ
þ 12 f ′′ p
�ð Þ p� p�ð Þ2�Δfm:ð49Þ
f′(p*)= 0 since f(p) reaches its optimum fmax at p= p*. f″(p*) is the curvature of thefitness function at its maximum. It is a negative number which characterizes hownarrow the fitness function is.
Because protein abundance fluctuates around p*, the cell doesn’t experience themaximum fitness fmax but rather a lower average fitness fh i. Averaging F overfluctuations in protein abundance, we obtain
F p; βm� � �¼ fmax þ 1
2 f ′′ p�ð Þσ2 � cmlmβm
¼ fmax � Δfnoise � Δfmð50Þ
where σ2 is the variance of protein abundance fluctuations (Fig. 4a). Thecurvature times this variance, � 1
2 f ′′ p�ð Þσ2, is the noise load Δfnoise, the fitness
lost due to the stochastic fluctuations in protein abundance24,25 (Fig. 4a). Itis a positive quantity because the curvature f″(p) is negative at the maximump= p*.
We seek the transcription rate βm that maximizes fitness. For this purpose wenote that βm affects the noise level σ2 in a well-characterized way. Theory andexperiments of gene expression noise15–17,40 indicate that variance of protein noiseis given by
σ2 ’ p21pþ αpβm
þ c2v0
� �ð51Þ
where αp is the protein decay rate and cv0 is the noise floor due to extrinsic noise40
or the larger transcriptional burst size of high abundance proteins42 (see previous
section). We can now solve for the βm that maximizes fitness, by finding d Fh idβm
¼ 0.
The optimal translation/transcription ratio rate βp/βm satisfies
βpβm
¼ 2cmlmαm�f ′′ p�ð Þp� ¼
CQ
ð52Þ
where we have used p� ¼ βmβpαmαp
. Note that we introduced two new variables C and Q.
C :¼ cmlmαm ¼ cmlmβm=m ¼ Δfm=m ð53Þ
represents the fitness cost of transcription per mRNA molecule for a gene with pre-mRNA length lm.
Q :¼ � 12f ′′ p�ð Þp� ð54Þ
is the gene’s sensitivity to noise. Genes with narrower fitness functionsf ′′ p�ð Þ � 0ð Þ are more noise sensitive. A gene’s sensitivity to noise also depends onp* because stochastic fluctuations σ2 scale with p* (Eq. (51)).
From the expression for the optimal βp/βm (Eq. (52)), we see that genesdominated by comparable requirements of precision and economy are predicted toshare the same translation/transcription ratio. Genes with narrow fitness functionrequire more precision and thus have lower translation/transcription ratios(Fig. 4b). Higher transcription cost per mRNA molecule—due to longer mRNAs lmor rapid mRNA turn-over αm or a scarcity of nucleotides leading to increased costcm—shifts the balance towards higher ratios.
Note that the translation/transcription ratio does not depend on translationcost, although this cost is typically larger than transcriptional cost18,20,21. This isbecause we assumed that, for a given protein abundance, translation cost are thesame if the proteins are synthesized from few or many mRNAs.
Predicting the boundary of the depleted region of Crick space. In this section,we ask what is the predicted offset of the line that forms the boundary of thedepleted region, namely the constant k such that βp/βm > k for all genes. Weprovide estimates based on known fundamental parameters of cell biology sug-gested by the theory.
ARTICLE NATURE COMMUNICATIONS | https://doi.org/10.1038/s41467-018-07391-8
12 NATURE COMMUNICATIONS | (2019) 10:68 | https://doi.org/10.1038/s41467-018-07391-8 | www.nature.com/naturecommunications
To estimate k, we note that the precision-economy theory predicts that low βp/βm occur for genes with narrow fitness functions (Eq. (52), Fig. 4b). But the noisefloor cv0 (Fig. 4c) sets a limit on how narrow fitness functions can be: for fitnessfunctions that are too narrow given the noise floor, average fitness is negative(Fig. 4d). Such fitness functions cannot be selected for in evolution. We cantherefore estimate the maximal transcription rate by determining the largest,selectable fitness function curvature, and then compute the optimal transcriptionrate for that function. The curvature should be small enough that the smallest,unavoidable protein fluctuations (set by the organism’s noise floor cv0) do notdominate the fitness benefit of expressing the protein. In other words, thefitness benefit of expressing the protein fmax should be larger than the noiseload Δfnoise:
fmax � Δfnoise>0 ) fmax �12f ′′ p�ð Þj jσ2>0: ð55Þ
Here we neglected mRNA cost because for proteins with narrow fitness functions,it is small compared to the noise load Δfnoise.
If fitness is mainly set by the growth rate μ, the fitness contribution fmax of agene cannot be larger than the growth rate: fmax < μ. In addition, fluctuationscannot be smaller than the noise floor, σ/p* > cv017,40–42. From these twoconsiderations, we can compute an upper bound on the noise sensitivity Q,
Q ¼ 12f ′′ p�ð Þj jp�< fmax
p�c2v<
μ
p�c2v0: ð56Þ
By substituting this upper bound in Eq. (52) for the optimal βp/βm, we find anupper bound on βmax
m on transcription rates
βm<βmaxm ¼ 1
cv0
ffiffiffiffiffiffiffiffiffiffiffiffiffiαpαmμ
C
r: ð57Þ
We now consider the (hypothetical) protein expressed at maximal transcriptionβmaxm and maximal translation βmax
p . This protein has highest protein abundance p*.It also has narrowest fitness function (narrower fitness are not selectable due to thenoise floor), and thus highest noise sensitivity Qmax. We can plug Eq. (57) for βmax
minto Eq. (52) for the optimal βp/βm to find Qmax:
βmaxp
βmaxm
¼ CQmax
) Qmax ¼ffiffiffiffiffiffiffiffiffiffiffiffiffiffiffiffiαpαmμC
pβmaxp cv0
: ð58Þ
In this expression, we can see that a higher noise floor implies that genes need to beless sensitive to noise. We now use Qmax in the Eq. (52) for the optimal βp/βm tofind k,
βpβm
¼ CQ>
CQmax
¼ k ) k ¼ βmaxp cv0
ffiffiffiffiffiffiffiffiffiffiffiffiffiC
αpαmμ
s¼ βmax
p cv0
ffiffiffiffiffiffiffiffifficmlmαpμ
sð59Þ
where we have used C= cmlmαm (Eq. (53)). The fitness cost per transcribednucleotide cm can be estimated from the average contribution of each nucleotide ofeach mRNA to the organism’s fitness, cm ¼ μ=
Pβmlm (Eq. (17)). Neglecting
differences in mRNA length between genes, we finally find:
k ’ βmaxp cv0ffiffiffiffiffiffiffiffiffiffiffiffiffiffiffiffiαpP
βm
q : ð60Þ
Thus, the lowest translation/transcription ratio can be predicted from measurable,fundamental parameters of each organism.
In this derivation, we have assumed that the gene’s contribution to fitness fmax issmaller than the growth rate μ, fmax < μ (Eq. (56)). For essential genes, fmax≃ μ. Fornon-essential genes, we can use a tighter upper bound on fmax:
fmax<ρμ ð61Þ
with 0 < ρ < 1. For example, if deleting a gene decreases fitness by 1% or less, wehave ρ= 0.01. By repeating the derivation, we find
k ’ βmaxp cv0ffiffiffiffiffiffiffiffiffiffiffiffiffiffiffiffiffiffiαpρ
Pβm
q : ð62Þ
Thus, for non-essential genes ρ � 1ð Þ, the predicted boundary of the depletedregion has higher intercept.
In the Supplementary Methods, we consider alternative theories to explain theboundary of the depleted region, such as the existence of a power-law scaling ofmRNA noise with mRNA abundance. None of the alternative theories can explainthe depleted region.
Code availability. We deposited the code used to produce the figures of the presentmanuscript at Mendeley data, https://doi.org/10.17632/2vbrg3w4p3.1 [https://data.
mendeley.com/datasets/2vbrg3w4p3/draft?a=955cbbdf-9f26-4fbb-970b-e6b4081c1f3e].
Data availabilityThe data (RPKMs from RNAseq and ribosomal profiling) from which we estimatedtranscription and translation rates was deposited at Mendeley data, https://doi.org/10.17632/2vbrg3w4p3.1 [https://data.mendeley.com/datasets/2vbrg3w4p3/draft?a=955cbbdf-9f26-4fbb-970b-e6b4081c1f3e]. Estimated transcription and transla-tion rates are also found at that address. In addition, downloadable tables containextra fields (such as coefficient of variation on protein abundance fluctuations)needed to reproduce Figs. 3b and 4c.
Received: 7 March 2018 Accepted: 18 October 2018
References1. Dekel, E. & Alon, U. Optimality and evolutionary tuning of the expression
level of a protein. Nature 436, 588–592 (2005).2. Scott, M., Gunderson, C. W., Mateescu, E. M., Zhang, Z. & Hwa, T.
Interdependence of cell growth and gene expression: origins andconsequences. Science 330, 1099–1102 (2010).
3. Li, G.-W., Burkhardt, D., Gross, C. & Weissman, J. S. Quantifying absoluteprotein synthesis rates reveals principles underlying allocation of cellularresources. Cell 157, 624–635 (2014).
4. Hargrove, J. L. & Schmidt, F. H. The role of mRNA and protein stability ingene expression. FASEB J. 3, 2360–2370 (1989).
5. Crick, F. Central dogma of molecular biology. Nature 227, 561 (1970).6. Lee, T. I. & Young, Ra Transcriptional regulation and its misregulation in
disease. Cell 152, 1237–1251 (2013).7. Schoenberg, D. R. & Maquat, L. E. Regulation of cytoplasmic mRNA decay.
Nat. Rev. Genet. 13, 246–259 (2012).8. Kong, J. & Lasko, P. Translational control in cellular and developmental
processes. Nat. Rev. Genet. 13, 383–394 (2012).9. Elowitz, M. B., Levine, A. J., Siggia, E. D. & Swain, P. S. Stochastic gene
expression in a single cell. Science 297, 1183–1186 (2002).10. Blake, W. J., KAErn, M., Cantor, C. R. & Collins, J. J. Noise in eukaryotic gene
expression. Nature 422, 633–637 (2003).11. Raser, J. M. & O’Shea, E. K. Noise in gene expression: origins, consequences,
and control. Science 309, 2010–2013 (2005).12. Sanchez, A. & Golding, I. Genetic determinants and cellular constraints in
noisy gene expression. Science 342, 1188–1193 (2013).13. McAdams, H. H. & Arkin, A. P. Stochastic mechanisms in gene expression.
Proc. Natl Acad. Sci. USA 94, 814–819 (1997).14. Ozbudak, E. M., Thattai, M., Kurtser, I., Grossman, A. D. & van Oudenaarden,
A. Regulation of noise in the expression of a single gene. Nat. Genet. 31, 69–73(2002).
15. Paulsson, J. Models of stochastic gene expression. Phys. Life Rev. 2, 157–175(2005).
16. Bar-Even, A. et al. Noise in protein expression scales with natural proteinabundance. Nat. Genet. 38, 636–643 (2006).
17. Newman, J. R. S. et al. Single-cell proteomic analysis of S. cerevisiae reveals thearchitecture of biological noise. Nature 441, 840–846 (2006).
18. Wagner, A. Energy constraints on the evolution of gene expression. Mol. Biol.Evol. 22, 1365–1374 (2005).
19. Rogozin, I. B., Carmel, L., Csuros, M. & Koonin, E. V. Origin and evolution ofspliceosomal introns. Biol. Direct 7, 11 (2012).
20. Lynch, M. & Marinov, G. K. The bioenergetic costs of a gene. Proc. Natl Acad.Sci. USA 112, 201514974 (2015).
21. Kafri, M., Metzl-Raz, E., Jona, G. & Barkai, N. The cost of protein production.Cell Rep. 14, 22–31 (2016).
22. Frumkin, I. et al. Gene architectures that minimize cost of gene expression.Mol. Cell 65, 142–153 (2017).
23. Fraser, H. B., Hirsh, A. E., Giaever, G., Kumm, J. & Eisen, M. B. Noiseminimization in eukaryotic gene expression. PLoS Biol. 2, e137 (2004).
24. Kalisky, T., Dekel, E. & Alon, U. Cost-benefit theory and optimal design ofgene regulation functions. Phys. Biol. 4, 229–245 (2007).
25. Tǎnase-Nicola, S., Ten Wolde, P. R., Tǎnase-Nicola, S. & Ten Wolde, P. R.Regulatory control and the costs and benefits of biochemical noise.PLoS Comput. Biol. 4, e1000125 (2008).
26. Schwanhüusser, B. et al. Global quantification of mammalian gene expressioncontrol. Nature 473, 337–342 (2011).
27. Lan, G., Sartori, P., Neumann, S., Sourjik, V. & Tu, Y. The energy—speed—accuracy trade-off in sensory adaptation. Nat. Phys. 8, 422–428(2012).
NATURE COMMUNICATIONS | https://doi.org/10.1038/s41467-018-07391-8 ARTICLE
NATURE COMMUNICATIONS | (2019) 10:68 | https://doi.org/10.1038/s41467-018-07391-8 | www.nature.com/naturecommunications 13
28. Liu, Y., Beyer, A. & Aebersold, R. On the dependency of cellular protein levelson mRNA abundance. Cell 165, 535–550 (2016).
29. Weinberg, D. E. et al. Improved ribosome-footprint and mrna measurementsprovide insights into dynamics and regulation of yeast translation. Cell Rep.14, 1787–1799 (2016).
30. Eichhorn, S. W. et al. mRNA destabilization is the dominant effect ofmammalian MicroRNAs by the time substantial repression ensues. Mol. Cell56, 104–115 (2014).
31. Nagaraj, N. et al. Deep proteome and transcriptome mapping of a humancancer cell line. Mol. Syst. Biol. 7, 548 (2011).
32. Jovanovic, M. et al. Immunogenetics. Dynamic profiling of the protein lifecycle in response to pathogens. Science 347, 1259038 (2015).
33. Li, J. J., Bickel, P. J. & Biggin, M. D. System wide analyses have underestimatedprotein abundances and the importance of transcription in mammals. PeerJ 2,e270 (2014).
34. Rabani, M. et al. Metabolic labeling of RNA uncovers principles of RNAproduction and degradation dynamics in mammalian cells. Nat. Biotechnol.29, 436–442 (2011).
35. Trcek, T., Larson, D. R., Moldón, A., Query, C. C. & Singer, R. H. Single-molecule mRNA decay measurements reveal promoter- regulated mRNAstability in yeast. Cell 147, 1484–1497 (2011).
36. Friedman, N., Cai, L. & Xie, X. S. Linking stochastic dynamics to populationdistribution: an analytical framework of gene expression. Phys. Rev. Lett. 97,168302 (2006).
37. Friedman, N., Cai, L. & Xie, X. S. Stochasticity in gene expression as observedby single-molecule experiments in live cells. Isr. J. Chem. 49, 333–342(2009).
38. Kosuri, S. et al. Composability of regulatory sequences controllingtranscription and translation in Escherichia coli. Proc. Natl Acad. Sci. USA110, 14024–14029 (2013).
39. Sharon, E. et al. Probing the effect of promoters on noise in gene expressionusing thousands of designed sequences. Genome Res. 24, 1698–1706(2014).
40. Taniguchi, Y. et al. Quantifying E. coli proteome and transcriptomewith single-molecule sensitivity in single cells. Science 329, 533–538(2010).
41. Silander, O. K. et al. A genome-wide analysis of promoter-mediatedphenotypic noise in Escherichia coli. PLoS Genet. 8, e1002443 (2012).
42. Dar, R. D. et al. Transcriptional burst frequency and burst size are equallymodulated across the human genome. Proc. Natl Acad. Sci. USA 109,17454–17459 (2012).
43. Keren, L. et al. Massively parallel interrogation of the effects of geneexpression levels on fitness. Cell 166, 636–643 (2016).
44. Salis, H. M., Mirsky, E. A. & Voigt, Ca Automated design of syntheticribosome binding sites to precisely control protein expression. Nat. Biotechnol.27, 946–950 (2010).
45. Yona, A. H., Alm, E. J. & Gore, J. Random sequences rapidly evolve into denovo promoters. Nat. Commun. 9, 1530 (2018).
46. Wikström, P. M., Lind, L. K., Berg, D. E. & Björk, G. R. Importance ofmRNA folding and start codon accessibility in the expression of genes in aribosomal protein operon of Escherichia coli. J. Mol. Biol. 224, 949–966(1992).
47. Sathe, L., Bolinger, C., Mannan, M. A.-u, Dever, T. E. & Dey, M. Evidence thatbase-pairing interaction between intron and mRNA Leader sequences inhibitsinitiation of HAC1 mRNA translation in yeast. J. Biol. Chem. 290,21821–21832 (2015).
48. Rogers, J. & Munro, H. Translation of ferritin light and heavy subunit mRNAsis regulated by intracellular chelatable iron levels in rat hepatoma cells. Proc.Natl Acad. Sci. USA 84, 2277–2281 (1987).
49. Hinnebusch, A. G. Translational regulation of GCN4 and the general aminoacid control of yeast. Annu. Rev. Microbiol. 59, 407–450 (2005).
50. Pérez-Ortín, J. E., Alepuz, P. M. & Moreno, J. Genomics and genetranscription kinetics in yeast. Trends Genet. 23, 250–257 (2007).
51. Kussell, E. & Leibler, S. Phenotypic diversity, population growth, andinformation in fluctuating environments. Science 309, 2075–2078(2005).
52. Zhang, Z., Qian, W. & Zhang, J. Positive selection for elevated gene expressionnoise in yeast. Mol. Syst. Biol. 5, 299 (2009).
53. Frankel, N. W. et al. Adaptability of non-genetic diversity in bacterialchemotaxis. eLife 3, 1–30 (2014).
54. Wolf, L., Silander, O. K. & van Nimwegen, E. Expression noise facilitates theevolution of gene regulation. eLife 4, e05856 (2015).
55. Shaffer, S. M. et al. Rare cell variability and drug-induced reprogramming as amode of cancer drug resistance. Nature 546, 431–435 (2017).
56. Edfors, F. et al. Gene-specific correlation of RNA and protein levels in humancells and tissues. Mol. Syst. Biol. 12, 883 (2016).
57. Savageau, M. A. Theoretical Biology: epigenetic and evolutionary order fromcomplex sytesms (eds Goodwin, B. & Saunders, P.) Ch. 5 (EdinburghUniversity Press, Edinburgh, 1989).
58. Weghorn, D. & Lassig, M. Fitness landscape for nucleosome positioning. Proc.Natl Acad. Sci. USA 110, 10988–10993 (2013).
59. Serohijos, A. W. R., Lee, S. Y. R. & Shakhnovich, E. I. Highly abundant proteinsfavor more stable 3D structures in yeast. Biophys. J. 104, L1–L3 (2013).
60. Shoval, O. et al. Evolutionary trade-offs, pareto optimality, and the geometryof phenotype space. Science 336, 1157–1160 (2012).
61. Tendler, A., Mayo, A. & Alon, U. Evolutionary tradeoffs, Pareto optimalityand the morphology of ammonite shells. BMC Syst. Biol. 9, 12 (2015).
62. Hart, Y. et al. Inferring biological tasks using Pareto analysis of high-dimensional data. Nat. Methods 12, 233–235 (2015).
63. Korem, Y. et al. Geometry of the gene expression space of individual cells.PLOS Comput. Biol. 11, e1004224 (2015).
64. Eden, E. et al. Proteome half-life dynamics in living human cells. Science 331,764–768 (2011).
65. Zenklusen, D., Larson, D. R. & Singer, R. H. Single-RNA counting revealsalternative modes of gene expression in yeast. Nat. Struct. Mol. Biol. 15,1263–1271 (2008).
66. Milo, R., Jorgensen, P., Moran, U., Weber, G. & Springer, M. BioNumbers: thedatabase of key numbers in molecular and cell biology. Nucleic Acids Res. 38,D750–D753 (2009).
67. Milo, R. What is the total number of protein molecules per cell volume? A callto rethink some published values. Bioessays 35, 1050–1055 (2013).
68. Belle, A., Tanay, A., Bitincka, L., Shamir, R. & O’Shea, E. K. Quantification ofprotein half-lives in the budding yeast proteome. Proc. Natl Acad. Sci. USA103, 13004–13009 (2006).
69. Eser, P. et al. Periodic mRNA synthesis and degradation co-operate during cellcycle gene expression. Mol. Syst. Biol. 10, 717 (2014).
70. Keren, L. et al. Noise in gene expression is coupled to growth rate. GenomeRes. 25, 1893–1902 (2015).
71. Chen, H., Shiroguchi, K., Ge, H. & Xie, X. S. Genome-wide study of mRNAdegradation and transcript elongation in Escherichia coli. Mol. Syst. Biol. 11,781–781 (2015).
72. Friedel, C. C., Dölken, L., Ruzsics, Z., Koszinowski, U. H. & Zimmer, R.Conserved principles of mammalian transcriptional regulation revealed byRNA half-life. Nucleic Acids Res. 37, e115 (2009).
73. Cambridge, S. B. et al. Systems-wide proteomic analysis in mammalian cellsreveals conserved, functional protein turnover. J. Proteome Res. 10, 5275–5284(2011).
74. Bahar Halpern, K. et al. Nuclear retention of mRNA in mammalian tissues.Cell Rep. 13, 2653–2662 (2015).
75. Gregersen, L. H. et al. MOV10 Is a 5′ to 3′ RNA helicase contributing to UPF1mRNA target degradation by translocation along 3′ UTRs. Mol. Cell 54,573–585 (2014).
76. Shah, P., Ding, Y., Niemczyk, M., Kudla, G. & Plotkin, J. B. Rate-limiting stepsin yeast protein translation. Cell 153, 1589–1601 (2013).
77. Castillo-Davis, C. I., Mekhedov, S. L., Hartl, D. L., Koonin, E. V. &Kondrashov, F. A. Selection for short introns in highly expressed genes. Nat.Genet. 31, 415–418 (2002).
78. So, L.-H. H. et al. General properties of transcriptional time series inEscherichia coli. Nat. Genet. 43, 554–560 (2011).
79. Koch, A. & Levy, H. Protein turnover in growing cultures of Escherichia coli.J. Biol. Chem. 217, 947–958 (1955).
80. Aidelberg, G. et al. Hierarchy of non-glucose sugars in Escherichia coli. BMCSyst. Biol. 8, 133 (2014).
AcknowledgementsWe thank Benjamin Towbin, Shalev Itzkovitz, Ron Milo, Naama Barkai, Moshe Kafri,Mihaela Zavolan, Luca Ciandrini, Nir Friedman, Yoav Voichek, Tzachi Pilpel, IdanFrumkin, Dvir Schirman, Noam Stern-Ginossar, Michal Shreberk, Dan Davidi, DanielGoodman, Tabitha Bucher, and members of the Alon lab for scientific discussions andfeedback on the manuscript.This work was supported by the European Research Council under the European Union’sSeventh Framework Program/ERC Grant agreement 249919, and the Israel ScienceFoundation. U.A. is the incumbent of the Abisch-Frenkel Professorial Chair. J.H.acknowledges the support of EMBO (ALTF 1160-2012), the Swiss National ScienceFoundation (P300P3_158472), and the Swiss Society of Friends of the Weizmann Institute.
Author contributionsConceptualization, J.H. and U.A.; methodology, J.H., A.M., L.K. and U.A.; formal ana-lysis, J.H.; Writing, J.H. and U.A.; and funding acquisition, J.H. and U.A.
ARTICLE NATURE COMMUNICATIONS | https://doi.org/10.1038/s41467-018-07391-8
14 NATURE COMMUNICATIONS | (2019) 10:68 | https://doi.org/10.1038/s41467-018-07391-8 | www.nature.com/naturecommunications
Additional informationSupplementary Information accompanies this paper at https://doi.org/10.1038/s41467-018-07391-8.
Competing interests: The authors declare no competing interests.
Reprints and permission information is available online at http://npg.nature.com/reprintsandpermissions/
Publisher’s note: Springer Nature remains neutral with regard to jurisdictional claims inpublished maps and institutional affiliations.
Open Access This article is licensed under a Creative CommonsAttribution 4.0 International License, which permits use, sharing,
adaptation, distribution and reproduction in any medium or format, as long as you giveappropriate credit to the original author(s) and the source, provide a link to the CreativeCommons license, and indicate if changes were made. The images or other third partymaterial in this article are included in the article’s Creative Commons license, unlessindicated otherwise in a credit line to the material. If material is not included in thearticle’s Creative Commons license and your intended use is not permitted by statutoryregulation or exceeds the permitted use, you will need to obtain permission directly fromthe copyright holder. To view a copy of this license, visit http://creativecommons.org/licenses/by/4.0/.
© The Author(s) 2019
NATURE COMMUNICATIONS | https://doi.org/10.1038/s41467-018-07391-8 ARTICLE
NATURE COMMUNICATIONS | (2019) 10:68 | https://doi.org/10.1038/s41467-018-07391-8 | www.nature.com/naturecommunications 15