Embed Size (px)
Citation preview
2012 Research Progress Report
Central Great Plains Research Station and
Colorado State University
Merle Vigil—ARS Research Leader Joseph Benjamin—ARS Soil Scientist Francisco Calderón—ARS Soil Scientist Maysoon Mikha—ARS Soil Scientist David Nielsen—ARS Agronomist David Poss—ARS Support Scientist Joel Schneekloth—CSU Water Resources Specialist
R. Wayne Shawcroft, CSU (ret.) www.akron.ars.usda.gov
Agricultural Research Service
I
TABLE OF CONTENTS
MISSION STATEMENT .................................................................................................. 1 CENTRAL GREAT PLAINS RESEARCH STATION STAFF ......................................... 2 SUMMARY OF 2012 WEATHER .................................................................................... 3 R. Wayne Shawcroft USING STRIP TILLAGE TO TRANSITION FROM SWEEP TILLAGE TO NO TILLAGE........................................................................................................... 15 J.G. Benjamin SEQUENCING SUNFLOWER IN A WINTER WHEAT ROTATION ............................ 17 J.G. Benjamin, and F.J. Calderón ORGANIC WHEAT AND FORAGE ROTATIONS IN THE CGPRS .............................. 19 F.J. Calderón DRYLAND WINTER WHEAT VARIETY PERFORMANCE TRIAL............................... 23 J.J. Johnson, S. Haley, J. Hain, S. Sauer, and M.F. Vigil DRYLAND AND IRRIGATED FORAGE SORGHUM PERFORMANCE TRIAL ........... 25 C. Jahn, M. Turner, J.J. Johnson, J. Hain, S. Sauer, J. Schneekloth, D. Nielsen, and M.F. Vigil CORN PRODUCTIVITY INFLUENCED BY RESIDUE REMOVAL AND NITROGEN SOURCES ........................................................................................ 28 M.M. Mikha, and J.G. Benjamin CROP ROTATION AND TILLAGE EFFECTS ON WATER USE AND YIELD OF ALTERNATIVE CROP ROTATIONS FOR THE CENTRAL GREAT PLAINS ......................................................................................... 31 D.C. Nielsen, M.F. Vigil., J.G. Benjamin, M.M. Mikha, F.J. Calderon, and D.J. Poss DEVELOPMENT OF A DECISION SUPPORT SYSTEM FOR SUMMER CROP SELECTION IN THE CENTRAL GREAT PLAINS ........................... 32 D.C. Nielsen, and A.J. Thompson USING AQUA CROP TO MODEL WINTER WHEAT PRODUCTION .......................... 33 D.C. Nielsen, D.J. Lyon, and J.J. Miceli-Garcia
II
EFFECTS OF WATER STRESS TIMING ON IRRIGATED CORN PRODUCTION ................................................................................................... 35 D.C. Nielsen, and J.P. Schneekloth SPRING-PLANTED COVER CROP WATER USE, BIOMASS PRODUCTION, SOIL MICROBIAL ACTIVITY – DO MIXTURES BEHAVE DIFFERENTLY THAN SINGLE-SPECIES PLANTINGS? ..................................................................... 37 D.C. Nielsen, D.J. Lyon, and F.J. Calderón CANOLA ROTATION STUDY ...................................................................................... 40 M.F. Vigil, and D.J. Poss SOIL REMEDIATION USING BEEF MANURE AND VARIOUS TILLAGE TECHNIQUES .............................................................................................. 42 M.F. Vigil, D.J. Poss, M.M. Mikha, and J.G. Benjamin SOIL WATER LOSS FROM TILLAGE, AND RESIDUE MANAGEMENT .................... 46 M.F. Vigil, D.J. Poss, D.C. Nielsen, W. Greb and D. Smika EXPECTATION FOR DROUGHT IN THE CENTRAL GREAT PLAINS ....................... 50 M.F. Vigil, F.J. Calderón and D.J. Poss 2012 HISTORICAL REPORT ....................................................................................... 53 PUBLICATIONS ........................................................................................................... 55
1
Central Plains Resource Management Research Unit
MISSION STATEMENT
To enhance the economic and environmental well-being of agriculture by development of integrated cropping systems and technologies for optimal utilization of soil and water resources. Emphasis is on efficient use of plant nutrients, pesticides, and water and soil conservation/preservation.
Thursday, January 24th, 2013
2
CENTRAL GREAT PLAINS RESEARCH
STATION STAFF
Research Scientists Joseph Benjamin Francisco Calderón Maysoon Mikha David Nielsen Merle Vigil Colorado State University Jim Hain Joel Schneekloth
Administrative Support Staff Sarah Bernhardt Carolyn Brandon
Linda Pieper
Research Support Staff Paul Campbell Jamie Littleton-Sauer Karen Couch Brandon Peterson Linda Hardesty Stacey Poland Cody Hardy David Poss Delbert Koch
SUMMARY OF 2012 WEATHER
CENTRAL GREAT PLAINS RESEARCH STATIONAKRON, CO[ORADO
R. Wayne ShaweroftRegional Extension irrigation Agronomist (Retired)
Colorado State University Cooperative Extension andFarm Service Representative (Retired), Citizens National Bank of Akron
The 2012 Weather Year can be described in two words, RECORD SETTING.A running count of the number of new daily, monthly, and yearly records set during theyear is up to 70, and this is not to guarantee that another analysis might even find a fewmore that were overlooked. Of the 70 new records, 63 were new record high temperaturerecords, 2 were new record low precipitation records, and only 5 were new record lowtemperature records.
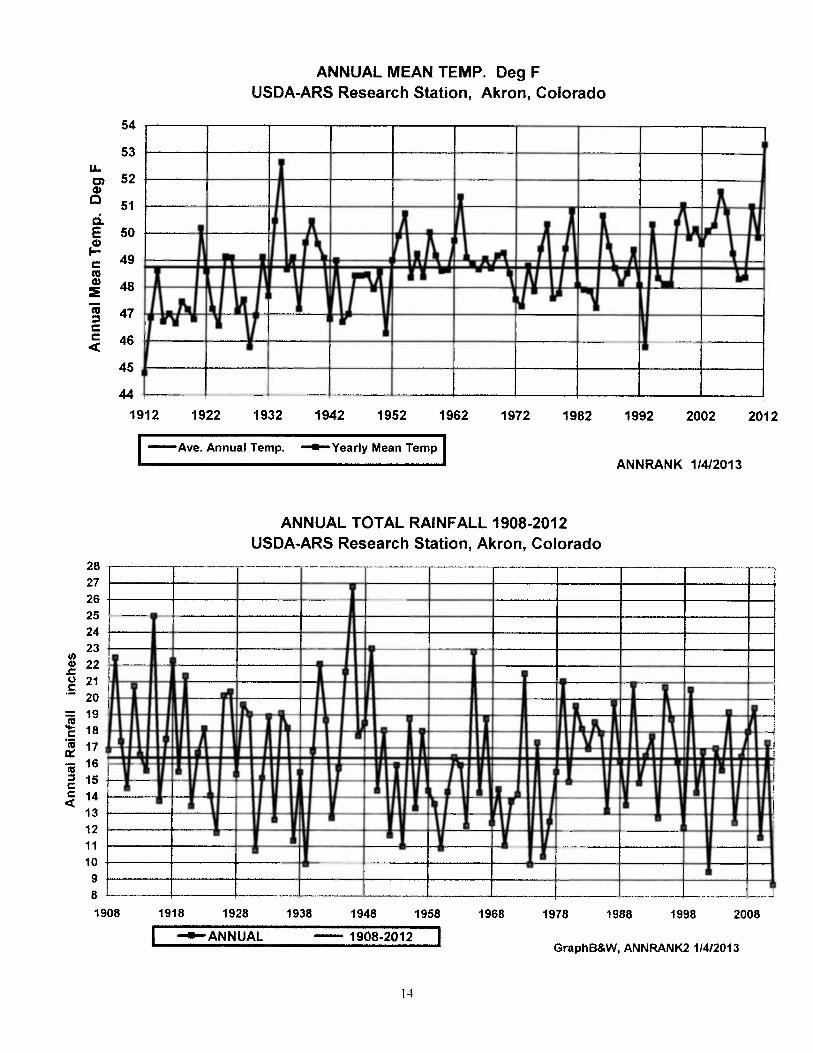
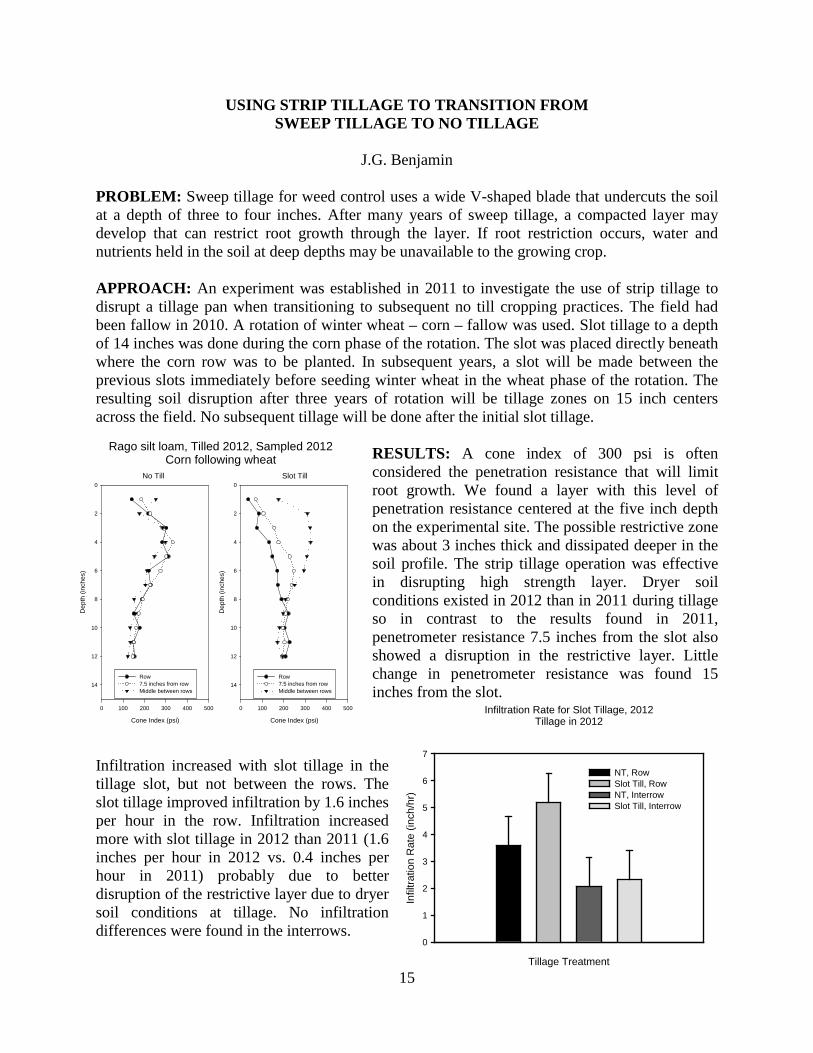
So with emphasis, 2012 will be recorded as the HOTTEST and DRIEST Yearin the i05year record at the Research Station. The new Annual Average Temperatureof 53.36 °F broke the previous record held by 1934 of 52,64 °F. The AnnualPrecipitation Total of 8.71 inches is also a new record low total set previously, just afew years ago, in 2002 of 9.49 inches. Prior to 2002, the two driest years were someyears ago with 9.93 inches in both 1939 and 1974.
Other significant records, that reflect just how 2012 will be remembered, includenew records for the number of days of 100 °F or greater at 27 days, breaking the recordof 1936 of 24 days, and a tie for the number of days of 90 °F or greater at 77 days. The77-total does include a 91 in April to account for the tie, Other significant recordsinclude a new record consecutive string of 100-plus degrees of 13 days, and a newconsecutive string of 90-plus degrees of 24 days. These break an 11-day string of 100-plus days in 1934, and a 21-day string of 90-plus days in 1939. A summary of thenumber of days 90 and 100 or above is shown in Table 4. In terms of percentage for thefive month period of May — Sept.. the 105-year average for days 90 or greater is only28.7% and for 100 or greater is only 2.5%. These corresponding figures for 2012 showthat for 90-plus days, 2012 had 49.7% and for 100-plus days 2012 had a new record of176%.
With the unprecedented heat of the year, the total frost4ree period from Apri.l. •18until October 4 of 169 days ranked as the third longest trost-free (32 °F or helowi periodran.king he]..ow ti..ie 179 days in 1949 and 170 days in i..916.
An.other interesting statistic for the summ r rnonth.s wa:.s the average weeklymaximum temperature For the 22-week. period from. May 1. -7 throug....h Sept. 25-30,there were onl two periods, May 8-1.4 and Aug. 14-20, with an average maximumtemperature below the long-term average. All other weekly average maximums wereabove the long-term average. Several periods had weekly averages as much as 12 to 15degrees above the long-term average.. Th.e week of June 26 to July 2 had an averagemaximum of 103 1 °F a mhopping 15 5 degrees aboe the aserage
TEM.PERATU RESMonthly mean, maximum, and minimum temperatures are shown in Tables 1, 2, and 3
(also see the graph of the Monthly Mean Temperatures). Significant features of themonthly temperature table and graph show that there were only two months, Februaryand October, with average monthly mean, maximum, and minimum temperatures thatwere below the long-term average. All other months were above the averages for allthree measures of monthly average temperature. Also note that three months, March,April, and June all set new record high monthly means. New record high maximumtemperatures were set in March and June, and a new record high minimum was set inApril. Several other months had near record monthly averages ranking well into the topten of the records for individual months.
Because of the number of significant events and records during the year, thefollowing i..arrative includes a m.ont.h by month su.mmary. Th.e year began with acarryover from Dec. 2011 of a relatively warm month with highs of 56, 61, 60 and awarm minimum of 33 on Dec. 3i, Warm days continued in January with a recordmaximum of 70 and a new record minimum of 34 °F on the 6th A snow of only one inch,brought some colder, winter-like temperatures of —8 on the 17th, but by the 22maximums in the 60’s and minimums in the mid 30’s prevailed, including a new recordhigh minimum of 35 °F on the 22. Overall the average maximum for January was 10.4degrees above the average and the average mean was 7,5 degrees above the average.February brought a hint of winter with a good snow of 6 inches on the 3, and anadditional 7 inches on the 4th, Three more snowy periods would bring the snowfall totalfor February to 19 inches and the 2 wettest February with 153 inches of precipitation.The 24 days of snow cover for the month kept temperatures colder than average for themonth.
The move into March began the onset of the record-breaking year that was tocome. Daily maximums of 71 on March 6th and 7th and a string of 70’s from March 13th
through the 19th were followed by new records of 80 and 76 on the 1 8th and 19th, and arecord minimum of 40 on the 18th set the stage for the year. Winds were very strong inthe middle of the month as noted by the Yuma area fire on the 18th and 19th, Marchended with new record high mean of 47.66 °F, a full 1078 degrees above the average.The average maximum for the month was also a new record of 64.23 degrees, a full1.3,93 degrees above the average. J8ot much m..oderation ws to follow in AprIl Whichstalled out with new record highs of 82 and 84 on the 1 and 2. A new record highminimum, of 44 °F was also recorded on the A light snow cooled things on the 3rU,
but a string of 60’s nd 70’s would return from the 9 to the 23w. The last freeze of th.espring, a 31 F,. would occur on the 18th, Temperatures of 82, 91, 84,..a..nd 79 formaximums an.d new record minimums of 54, 57, and 51 for the 24 through 27th wouldset up April with also and new record average mean of 54.22 de.grees and a new recordaverage minimum of 39,97 degrees. These records would be well over 7,5 degreesabove the averages for both, By the end of April the cumulative new record count forhigh temperature records would be up to 20.
May brought some moderation, but by this time all indicators of anunprecedented year were in place. The ii.iacs had already finished their bloom., and
4
wheat was heading at the same time that corn was just being planted. Maximumtemperatures of 75,79,80,80,88, and 84 with corresponding minimums of 46,44A6,42,45,and 41 set up May for another record month, Another string of 79,83,89,88, and 93 withnew record maximums of 95 on the 23” and 97 on the 27th brought out the combines forwheat harvest looked like it was gong to occur before Memorial Day rather than thenormal start on the 4th of July! Five more daily records were set in May, but surprisinglythe averages for the month only ranked as the 4th highest max, the 7th highest mean, andthe 28 highest mm, Cumulative new record count was now at 25.
June brought a continuation of the heat, and as will be seen, might be consideredthe peak of the heat wave, Instead of talking only about new daily records, counts ofconsecutive strings of 90-plus and 100-plus temperatures became the norm. With a stringof 90-plus days beginning on the 2, and a record high minimum of 60 on the 6w, andfinally reaching the first 100-degree day on the 9th, the record count was in full swing.By the end of June 19 new records would be set, 18 were temperature. related and one,the 0.12 inches of rainfall, would be a new record low rainfall for June. Thetemperature related records would include a tie of the all-time record high of 107 °F onthe 26th, new record highs of 104,105,106, and 106 on the 18th, 23w, 24th & 25th; withnew record minimums of 60,65,68, and 70 on the 6th, 25th27th and 30th, These records,along with six corresponding daily record mean temperatures, and a new record monthlyaverage mean of 75,07 and a new record monthly average maximum of 92.67 degrees,bring the total of 19 new records set in June. June also became part of a new recordstring of 100-plus days of 13 days. In terms of records count June had a record numberof days of 90-plus at 19 and a record count of days 100-plus at 10. To top off therecords in June, it also had the highest wind run total in the last 21 years.
After being part of the consecutive 100-plus string in the first of July, a 93 on the7th seemed like a “cold wave” and several days in the 80’s and even a 74 on the 8brought an anticipation of some moderation. This was not to last however as 100-plusdays returned with a string of seven 100-plus days from the 18th through the 24t5,
Overall, July had 27 days with 90 or greater maximums, which tied July 1939. The 14days of 100 or greater in July was just barely under the July 1936 record of 15 days. Interms of monthly averages for maximum, minimum, and mean July 2012 ranked 4thi, 7t5
and 2 respectively. There were only two days in July with minimums of 55 or less. Allother minimums were 58 degrees or above,
The first part of August brought a continuation of the string of 90-plusmaxim .: ins. A. break in the heat occurred aroun,d the 13th, but 90’s and new record highsof 1,00 each occurred on Aug. 28 and 29. Some moderation occurred in August., since theaverag max ranked as the 9th highest, the average mm as the l4 highest, and the.average mean as the 6. There were ‘.1 0 new daily records set in August,. which brings thecumulative rec.ord c.ount through August to 59.
Although the first five days of September were in the 90’s, some moderation ofthe heat wave was beginning to show. A 71 on Sept. 8th was the coolest maximum sincea 70 on May 24, and a 42on the morning of the 8th was the coolest temperature since May31 . There were no freezing temperatures in September and the coolest minimum was a40 on... th.e 22’. Maximurn. temperatures from. the 13t5 were near the average high of 78for the month No nen records were set in September The string of 90 or greater dais
was ended at the 77 mentioned earlier, October started with a few 80’s. but a cold fronton October brought a sudden first-freeze of 28 degrees on the 4th, This brought awelcome snow of about 2 inches with new record cold maximums of 34 and 36 on the 5th
and 6th, and a new record low minimum of 21 on the 6th, Temperatures moderated until acold and snowy period on the 25th and 26th, New record count was now 63 with four ofthese now being cold temperature records, October accounted for only the 2’ month ofthe year to be below the averages for the month,
After the relatively cool October, the heat or warmth returned in November withmany 70’s and mid 60’s for the highs and even a balmy 77 on Nov. 7th, A brief cold spellon the 10th and 11th brought a light snow and a cold maximum of 29 on the 11th and acold minimum of 6 on the 12th, Highs in the 70’s would return with 71 and 72 on the 21t
and Overall the average maximum for the month would end up 9.25 degrees abovethe average ranking as the 3 highest average maximum on record. The average meanwould rank as the 5th warr*est November on record. Thi.s mild an.d warm con.diticnwould continue into December with highs into the 60’s including a 68 on the 2w’, andnew record high minimums of 34 and 38 on the 1a and 6th, A turn too colder, but dryweather, occurred around the 9th and 10th with minimums of 12 and 1 °F and a highmaximum of only 23. The first real winter-like conditions came around the 20th with a 4-inch snow and a 3 °F minimum. This snow coupled with another snow on the 25th
provided a “White (Jhrisimas” and brought highs of 19 and 18 and a low of —11 on the26’’. December ended slightly warmer than average, but not near any records, With onenew daily record in November and four new daily records in December, the overall countwas up the 68 with 63 new high temperature records and 5 new cold temperature records.Adding in the two new driest records and some new strings of 90 and I 00-plus day, thenew record count for the year is at 70.
As stated above the average annual mean temperature for 2012 (an average ofthe daily mean for the 366 days of the year), as shown in the “Annual Mean Temp.”graph, was 53.36 °F. This ranks 2012 as warmest year on record. For comparison theprevious warmest year on record was 1934 with an average of 52.62 °F, and thecoldest 1912 with an average of 44.81 ° F. Coinciding with the new record meantemperature, 2012 also set records for the warmest average maximum temperature of68.81 °F, and a new record high average minimum temperature of 37.90 °F
A summary of the Growing-Degree-Days (GDD’ for the May through Septemberperiod is shown. in Table 4. The 201.2 GDD accumiiiati.oi.i of 3261 GDI) unIts was28.5% above the average thr the season., ar.d set a new re.cord for the hi.ghest GD.Daccum.ui.ati.on of the i05year record. The average GDD accumulation My-Sept.. forthe lOS-year record is 2538.7 units. The GD1) accumulation graph funs that sum.merstarted tracking abo e average from the beginning of May and grew increasingh aboveaverage th.rough.ou...t the sun. mer m.oi.i.ths. .if Much an.d .Aprii were i...nclud.ed in ti..:,istracking, which is an accumulation of the... number of deg.rees a.bove a 50-degre.e dailymean temperature , the GDD index would be substantially g.reater. There. were se.veraidaily means well above 60 and 70-degree daily means in both months, The bar graphshows that all five months had monthly accumulations above the corresponding monthlyaverag.e.
6
PRE(i PIT ATIONThe annual total precipitation for 2012 was only 8.71 inches. which is the
driest on record. The May-Sept. period total was only 4.09 inches is also a record lowfor this period. This is compared to the 11,35 inches average. The Monthly Totals areshown in Table 5. There were only two months. February and April that had rainfalltotals above the averaee for the month. The snow in Feb. caused the total for the monthto rank as the 2’ highest total for the month. April was lust slightly ahoe the averagetotal for the month July was the only summer month that had any sinificant rainfall.and may have saved a few crops during this extremely dry ear While the rainfallaccumulation by months was tracking at 110% of the average through April. the dry Mayand record dry June soon brought the accumulation much below the average. The 7.66-inch deficit for the year amounted to a record low of only 53.2% of the average yearlytotal, The graph of the monthly rainfall includes a comparison to the 2002 monthlytotals, which was the previous driest year on record.
The snowfall log shows a calendar year total of 34.4 inches of snow with 2.69inches of precipitation. This is again in the “Ball Park” of the 30-inches of snow perear or winter. The Jan-April sprmg’ period brought 2 I 1 inches of snow with 62% ofthat in February. and the “fall-winter” period, so far, of 13.3 inches of snow with 0.99inches of precipitation.
Intermittent drought conditions still continue to plague the area, although it
appeared that a reversal of the trend had occurred in 2009. The 2010 trended back tosevere drought conditions, and was close to the record low rainfall year of 2002. Withtwo out ofthe last three sears well below the average, and now the record .eIting year o/2012, ,
look.v like the same trend i in place. What is like/v a better .5/on’ is that evenwith the trend sum/ar to the 1930 ‘5 titid / 9.)Os, the crop conditions seemed iniusontihI’i (1Ot/ shijx 11/IL!? compaiLLI to otha dicastct itci, s lhis is hAck a ,esul/ (1/
knowledge and new lec/nuques available to handle iroug/u and severe heat conditions.f/i.e whtai crop actual/i had almost ideal conditions with i/it accelerated i oi.i th in eat/sspring, and coming out of the snow of february, the wheat crop developed and maturec4although amazingly early, almost without stress.
The cooler summer trend of 2008 and 2009 has been replaced with more heai\fi as in 2010 2011 and at cow Sc i/u ;ecorthsL iiinç that at 20 ‘2 JIop tails theL(Jr 1 iPcJsc[1 fl 1 L1S l 01 c?Iiii”lO miii rIit 20 I /(4117 a”
a/those ‘ once in a lif7i inje” eveni. i’ather than a ‘new j.i.7iO or new (eta?,
.7 he h..i/owin• ta.b/es and ,n.n2h.s s/so other thso. ares of the 2012 weather rear.
and ecrnpare the 2012 season with the tonglerrn record i/s completes the 105th viarof ecrirp/lotion crfdaiy ca/ni/ill and temperature recordc at the Research Station, Thiscontinues the milestone of 105 yeals of counuous tetj.erature and rabfall records atthe Research Station. ibis is a .significant miles/one, and ii is unfrirtunaic that more
in the hasfern I ‘Iain.c, and pai’ticuiark wtthni individual count sos, do not haveIon L’erOcrfli weather on ortB toe characieri:mnt i/ic’ m’esourccs far the area.
137.90 1F 34.594 F 3.310 F
UPDATE THRU DEC. 31. 2012
s. tab ManMMn n fU TEMPI2A pfltd 1/4/2013
TABLE 1. AVERAGE MONTHLY MEAN TEMPERATURES
(Based on 8:00 am daily observation time)
[gAN TEMPS2012
AVERAGE
1 05-YEAR1908-2012
AVERAGE
20 1 2 TEMPERATURESU . AKRON CO
New Records
HI LOWMONTH DEPARTURE AVERAGE (YEAR) AVERAGE (YEAR)
JAN 3 10 F 2572 F 7 ‘U5, 78 (1937FEB 2702 2997 295 4’ i954t 160 (1929tMAR 47.66 3688 1078 47.66 (2012) 199 19(2APR 54.22 4664 758 54.22 (2012) 359 ( 9204MAY 608 5635 446 653 (1934) 480 t1995tJUN 75.07 6674 833 75.07 (2012) 59 I (1945)JUL 7877 7362 515 °9 (1934) 676 (1915i
AUG 75 16 71 64 352 2 (201 1, 653 ( 1927SEP 6600 6246 354 684 (1998) 538 (1965)OCT 4881 5034 1 53 590 ) (963) 40 t (1969)NOV 4355 3697 658 458 (1949) 235 (1929)DEC 3016 2771 245 363 ç1980) 127 (1983)YEARLY AVE
t(EA lLM 53.360 F 48.7541 F 4606 F 53.36 (2012) 44.81 (1912)
UPDATE THRU DEC 31. 2012 FINAL 2012 2012 DATA INCLUDED IN AVERAGEALL TEMPERATURES (N DEGREES F
I MAX TEMPS I I = New Records
TABLE 2. AVERAGE MONTHLY MAXIMUM TEMPERATURES
JAN 48 81 F 3848 F 10 33 F 524 (2006) 208 (1937)FEB 3748 4280 532 560 (1954) 286 (1929)MAR 123 1 5029 1393 6423 (2012) 287 (1912)APR 68.47 6075 772 699 (1908) 457 .
.
MAY 7742 7021 7.21 819 (1934) 575 (1995)JUN 92 87 j 8151 1 1 36 j 92 87 (2012) 70 0 - - — — (1928)JUL 9565 8906 658 976 11( (1915)AUG 9145 8698 447 938 (1937) 775 (1927)SEP 8200 7808 39 88 (1998) 656 (1965)OCT 6345 65.74 229 751 (1963) 50.8 (9_)NOV 5987 5071 916 622 (1949) 330 (19291DEC 4410 Ji4 516 (1957) 224
YEARLY AVE
tflAX rUMp 68.815 F 62.914 I 5 901 F 68.81 2O12UPDATE 1 HRU DI C 31 2012 F INAL 2012 2012 DAT A INCE UDED IN AVERAI;I
I MIN TEMPS I I New RecordsTABLE 3. AVERAGE MONTHLY MINIMUM TEMPERATURES
JAN 39 1 1297 443 .2c,
FEB 1 ‘‘. ) 14 ‘1 ). fl. .. ‘ 4
MAR . .‘ .. . 2’APR 39.97 . 44 39.97 (2012) I .,
1AY . 4 41. 4
(( . . . .
3u’. . , 4
SEP . 41, 7. .. 4 ...
OCT 4 1 4b . . . .
NOV . 2.’ 2324 4 US ‘ c’OIY 141 ). ‘92
DEC 162) 1507 1 1 2 1946) IYEARLY AVE
MIN TEMP
37.90 (2012)
I NAt 2(112 2012 DA1A INCI UDED IN AVERAGI
S
TABLE 4. SUMMER GROWING SEASON RAINFALL, TEMPERATURE, AND GROWING DEGREEDAY SUMMARYFOR USDAARS RESEARCH STATiON, AKRON, COLORADO [2012 & 105Year AVERAGEI
TEMPERATURE DATA MAY-SEPT. 2012
RAINFALL inches ACoRAGF JiBES Co MACo bo 1 Af30 0 Al. f’S ‘.‘ Bbo. .‘. —
‘‘CAts 01,1012 t-”RtF-’ACo’’ A”.k’N ve’.
MCN’H .5112 A :0’ 2012 A’’G’ 2011 A’,’O” SC’ 1DD Sb ‘ a ., 50. ‘00. 55 a
MA’
.UN : I .
wi
AGO . . ‘ . I . .
SIP :
“GlAL S 409 11 35 71 16 86 16 3261 0 25387 76 27 77 439 38 99 1
Dnp= 726 Dcp 4.999 Dep= 722.3 401 171. 503. 5? 25 0411
2012 data included in ace, FINAL 2012 SUMMARY
Percent of total t153) dave in 5 months
31Oct.12 ‘eIast update 181,420121012112
I
53.2% 28,79 (
NEW RECORD or TIES NEW RECORD
2012 Data Included in average
flofyear cv rayyo raloOt and teroperatore S r(190of2012): and somber of days PC or aboarr, 100 or above, and 55 or Tess:. at Central Great
Plains Rev. .50, Apr00, Colorado
GROWING OEGWAYS dehrred as somber of days with daily mean temperrrtore above a Sooteyree F haae. For examplovMao 85: Mlii
53:Mean(8beS3)i2m55t. DegDrryonlt=6950=1ttGDOonitrr
TABLES. RAINFALL AMOUNTS BY MONTHS. USDAARS, AKRON, COLORADO
(Based on 8r00 am daily observation time)
105YEAR AVE % OF HIGH
MONTH 2012 TOTAL AVE. 19082012 DEPART. AVERAGE TOTAL
20 1 2 RAINFALL SUMMARY
LOW
(YEAR) TOTAL (YEAR)
2012 105YR , DEPART, % OF
GUM AVCUM GUM AVERAGE MON=
A 11 h 0 in 1 41 1 1 (1988) 000 ( YR ) 011 0 2 1 41 JAN
1 0 1 18 4 168 (191 ) 000 ( R ) 164 06 096 24 9A EB
0 4 .06 17 3 (1 0> 000 1 8) 1.78 14 0 11 1 AR
1 64 1 1 1 1 1 (1 4 4 11 0 A
14 1
8.71 16,37 V.7,66 53,2%
sases sIr 255215115, isewatcue pinsted ear OnOhZOIS
LAST UPDATE>> 04.Jan-13
01 MOO ITH.LY AVE:F:.AC0E. IS OAI...OULATE ... NEW .000000 :NCL0005 201.2. R.AINFALL DO TN.
tab ‘Rain2Ol2” in file ‘RAIN2OI2” printed: 114/2013
[ 2012 RAINFALL ICENTRAL GREAT PLAINS RESEARCH STATION AKRON, COLORADO
PRECIPITATION LOG 2012 STANDARD GUAGE inches LOCATION: WEATHER STATION
Ran’all amounts are foi the penoo 8:00 AM to 8:00 AM the 24-.r period end:ng
on the nate recorded
L I MAR APR MAY 1 JUN JUL AUG1 SEP ...QI NOV 1 DEC AY.— i.__=i_
1 0.01. 0.07 ] 1
2 0.03 0.04 23 . 0.54 0.09 0.06 T T 34 0.63 0.36 T 4
0,01 I 0.01 56 4 0.08 87 0.02 0.06 0.13 0.22 78 0.01 0.01 T 1.29 0.02 8
—.i 0,03 910 1011 0.06 0.02 0.15 1112 0.01 0,03 0.02 0.08 0,02 1213 0.07 0,29 0.01 0.43
.
1314 0.09 1415 009 008 1516 0.03 0,01 16170.08 1718 002 T 18
—ii—————— 1920 0.06 0.23 0,19 2021 — 0.10 2122 0.02 2223 T 0.01 0.12 2324 0.22 2425 0.04 0.18 0.13 2526 0.09 0.01 0.11 0.03 2627 0.01 0.65 0.03 2728 0.04 0.02 0.28 T 28
—ii --- 2930 0.38
. 3031 0.41 31
1 73
1.490.29
3,45
3.140.31
JAN FEBj MAR APR MAY JUN JUL AUG’ SEP OCT NOVf DECSUM 0.11 1.53 0.14 1.67 0.65 0.12 2.32 0.09 0.91 0.61 0.15 0.41 MONTHLY TOTALAVE 0.32 0.35 0.82 1.64 2.90 2.44 2.63 2.13 1.24 0.92 0.54 0.42 <<105YEAR AVEDEP .0.21 118 .0.68 0.03 .2.25 .2.32 .0.31 2.04 .0.33 .0.31 .0.39 .0.01 DEPARTURE
%NORM 34.1% 4337%. 17.1% 101.8% 22.4% 4.9% 88.1% 4.2% 73.4% 66.1% 27.8%. 97.0% MONTHLY % OF. E NORMAL
CUM 5.11 1.64 4.22 8.54 6.63 7.54 8.15 3.30 8.71 CURRENT ACUMAVCM 0.32 0.68 3.48 11.12 13.25 14.49 15.41 15.95 16.37 AVE ACUMDEP .0.21 0.96 .4.26 .4.58 .662 .6.95 .7.26 .7.65 .7.66 DEPARTURE%ofNORM 34.1%. 242.9% 119.1% 110.0%, 67.9% 49.8%: 58.8% 50.1% 52.1%: 52.9%: 52.0% 53.2% CUM % OF NORM
6.041.94
10
Table 6. Snowfall Dates and Depths for Calendar Year 2012USDA-ARS Research Station, Akron, Colorado
Period DATE Snow Depth inches Precipitation inchesWintr11-12 Jan12 2012 010 001Winterll-12 Jan 17 2012 1.20 0.06Winterll-12 Jan27 2012 0.10 0.01Wnter1I-42 Feb 3-4 2012 13 10 1 17Winterli-12 Feb 7 8 2012 0.60 0.03Winterll-12 Feb 11 - 13 2012 3,50 0.16Wnter11-12 Feb2O-21 2012 1,50 0.16Winterll-12 Feb23 2012 0.50 001Winterll-12 p__ 2O2 0 50 0.09VVinterll-12 2012Wrnterl 1-12
Sub-Total—Winter Si1n 21.10 1.70Wpr,tr12-13 Oct 6 - 7 20 1 3 00 0 31Wiriterl2 13 Oct 25 - 26 2012 2 30 0 2Wint,rI? 1 I I I 2 7 00W,ntcrl2-13 Dec 20 2012 400 019Wintcrl2-13 Dec. 2 - - 2012 200 C 13Winterl2-13 Dec 28 - 2012 1 — IWinterl2-13 2012Vinter12 13 2012
Sub-Total — Fall/Winter 13.30 0.99
TOTALS -- Calendar Year 34.40 2.69
GROWING DEGREE-DAYS (MAY-SEPT)
SNOWCaIendar_2O12, SNOW2O13. 1/412013
3500
3300
3100LU
29000
2700
2500
2300
2100
1900
1700
1500
USDA-ARS RESEARCH STATION, AKRON, CO
,tyi
=ANN TOT —=105-YR AVE
1908 1916 1924 1932 1940 1948 1956 1964 1972 1980 1988 1996 2004 2012
TAB “graph” FILE “GDDRANK
1908--2012 printed: 11412013
II
1000
900
800
700
600
-jI
400
300
200
100
0
U)
UiLU
0LU
Ui>I
D
0
GROWING DEG-DAYS: 2012 & 105-YR AVEUSDA RESEARCH STATION AKRON, COLORADO
LU(0
LL
3600
3300
3000
2700
2400
2100
1800
1500
1200
900
600
300
01-May
GDD12 PRINTED: 11412013
-
____
—21-May 10-Jun 30-Jun 20-Jul 9-Aug 29-Aug 18-Sep
MAY 1 TOSEPT 30
j =2012 —=105-YR AVE.
MONTHLY DEG-DAY TOTALS: 2012, 2011 & 105-yr AveUSDA-ARS RESEARCH STATION, AKRON, CO
I— I
iir
1; 1 7
I-MAY JUNE JULY AUG. SEPt
MAY I -- SEP 30 : 50 Deg F Base
S2012 H2011 :1O5yrav
saved as: GDDSMYI2 printedlupdated: 11412013
12
0,00
0
LU
zLU
>--J
I.z0
S = 2012 = 105-Year Ave.saved as: TEMPI2A 11412013
U)a,
-CC.)C
CCu
>-C4-’
0
4.0
MONTHLY RAINFALL 2012 &105-Yr Ave inches With 2002 ComparisonUSDA-ARS RESEARCH STATION Akron, Colorado
JAN FEB MAR APR MAY JUN JUL AUG SEP OCT NOV DEC
S =2012 = 105-yr ave. 02002 [Based on 8:00 am Observation Timej
saved as: I2RA1NCLJA printed: 11412013
MONTHLY MEAN TEMP: 2012 & 104-YEAR AVEUSDA-ARS AKRON, COLORADO
90
80
70
60
50
40
30
20
10
0
JAN FEB MAR APR MAY JUN JUL AUG SEP OCT NOV DEC
3.5
3.0
2,5
2.0
1.5
1.0
0.5
0.0 Li9[Li Ji13
LL
ci.E
t
ANNUAL MEAN TEMP. Deg FUSDA-ARS Research Station, Akron, Colorado
54
53
52
51
50
49
48
47
46
45
44
1912
—Ave. Annual Temp. —*—Yearly Mean Temp
1922 1932 1942 1952 1962 1972 1982 1992 2002 2012
ANNRANK 11412013
ANNUAL TOTAL RAINFALL 1908-2012USDA-ARS Research Station, Akron, Colorado
00)
0
282726252423222120191817
16
15
14
13
121110
98
1908
7*1918 1928 1938 1948
[—ANNUAL — 19082O12 I1958 1968 1978 1988 1998 2008
GraphB&W, ANNRANK2 11412013
14
15
USING STRIP TILLAGE TO TRANSITION FROM SWEEP TILLAGE TO NO TILLAGE
J.G. Benjamin
PROBLEM: Sweep tillage for weed control uses a wide V-shaped blade that undercuts the soil at a depth of three to four inches. After many years of sweep tillage, a compacted layer may develop that can restrict root growth through the layer. If root restriction occurs, water and nutrients held in the soil at deep depths may be unavailable to the growing crop. APPROACH: An experiment was established in 2011 to investigate the use of strip tillage to disrupt a tillage pan when transitioning to subsequent no till cropping practices. The field had been fallow in 2010. A rotation of winter wheat – corn – fallow was used. Slot tillage to a depth of 14 inches was done during the corn phase of the rotation. The slot was placed directly beneath where the corn row was to be planted. In subsequent years, a slot will be made between the previous slots immediately before seeding winter wheat in the wheat phase of the rotation. The resulting soil disruption after three years of rotation will be tillage zones on 15 inch centers across the field. No subsequent tillage will be done after the initial slot tillage.
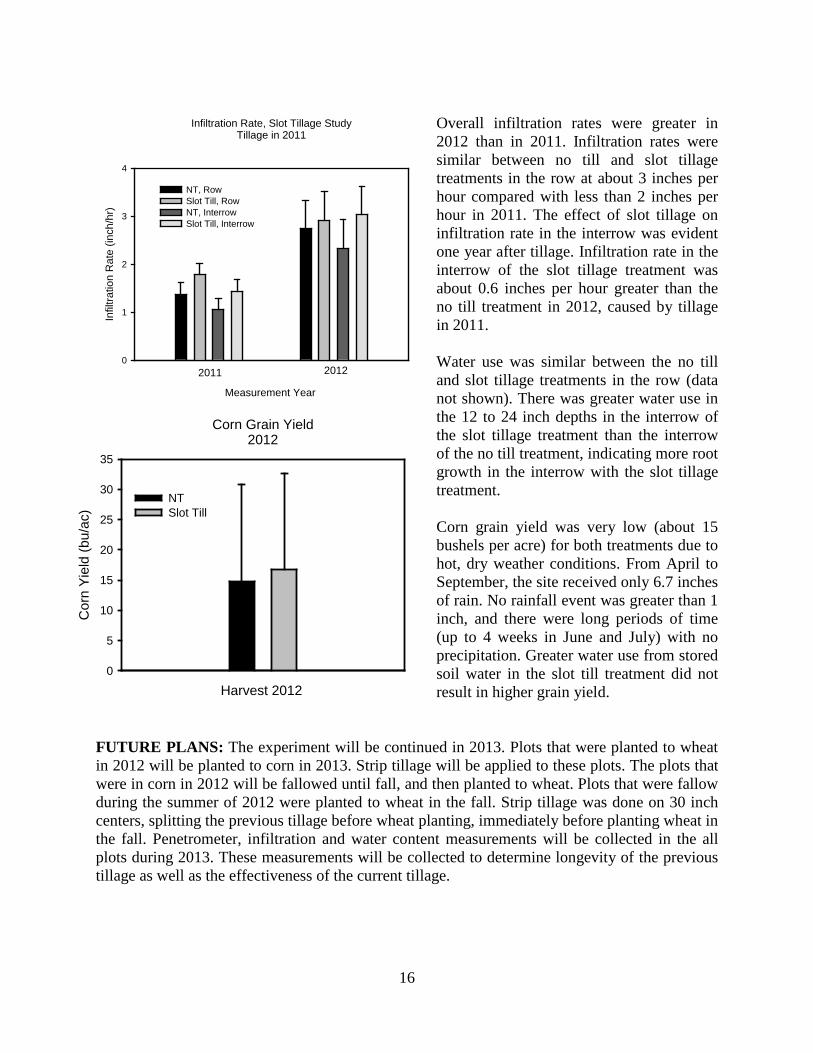
RESULTS: A cone index of 300 psi is often considered the penetration resistance that will limit root growth. We found a layer with this level of penetration resistance centered at the five inch depth on the experimental site. The possible restrictive zone was about 3 inches thick and dissipated deeper in the soil profile. The strip tillage operation was effective in disrupting high strength layer. Dryer soil conditions existed in 2012 than in 2011 during tillage so in contrast to the results found in 2011, penetrometer resistance 7.5 inches from the slot also showed a disruption in the restrictive layer. Little change in penetrometer resistance was found 15 inches from the slot.
Infiltration increased with slot tillage in the tillage slot, but not between the rows. The slot tillage improved infiltration by 1.6 inches per hour in the row. Infiltration increased more with slot tillage in 2012 than 2011 (1.6 inches per hour in 2012 vs. 0.4 inches per hour in 2011) probably due to better disruption of the restrictive layer due to dryer soil conditions at tillage. No infiltration differences were found in the interrows.
No Till
Cone Index (psi)
0 100 200 300 400 500
Dep
th (i
nche
s)
0
2
4
6
8
10
12
14Row7.5 inches from rowMiddle between rows
Slot Till
Cone Index (psi)
0 100 200 300 400 500
Dep
th (i
nche
s)
0
2
4
6
8
10
12
14Row7.5 inches from rowMiddle between rows
Rago silt loam, Tilled 2012, Sampled 2012Corn following wheat
Infiltration Rate for Slot Tillage, 2012Tillage in 2012
Tillage Treatment
Infil
tratio
n R
ate
(inch
/hr)
0
1
2
3
4
5
6
7
NT, RowSlot Till, RowNT, InterrowSlot Till, Interrow
16
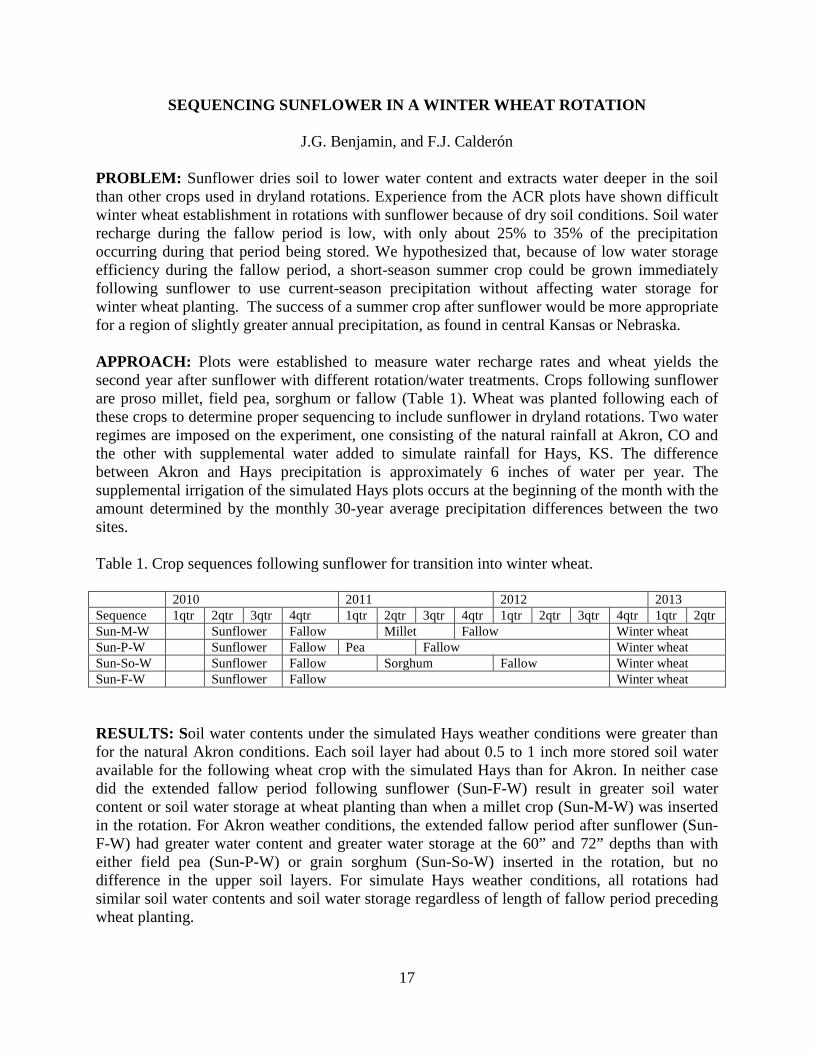
Overall infiltration rates were greater in 2012 than in 2011. Infiltration rates were similar between no till and slot tillage treatments in the row at about 3 inches per hour compared with less than 2 inches per hour in 2011. The effect of slot tillage on infiltration rate in the interrow was evident one year after tillage. Infiltration rate in the interrow of the slot tillage treatment was about 0.6 inches per hour greater than the no till treatment in 2012, caused by tillage in 2011. Water use was similar between the no till and slot tillage treatments in the row (data not shown). There was greater water use in the 12 to 24 inch depths in the interrow of the slot tillage treatment than the interrow of the no till treatment, indicating more root growth in the interrow with the slot tillage treatment. Corn grain yield was very low (about 15 bushels per acre) for both treatments due to hot, dry weather conditions. From April to September, the site received only 6.7 inches of rain. No rainfall event was greater than 1 inch, and there were long periods of time (up to 4 weeks in June and July) with no precipitation. Greater water use from stored soil water in the slot till treatment did not result in higher grain yield.
FUTURE PLANS: The experiment will be continued in 2013. Plots that were planted to wheat in 2012 will be planted to corn in 2013. Strip tillage will be applied to these plots. The plots that were in corn in 2012 will be fallowed until fall, and then planted to wheat. Plots that were fallow during the summer of 2012 were planted to wheat in the fall. Strip tillage was done on 30 inch centers, splitting the previous tillage before wheat planting, immediately before planting wheat in the fall. Penetrometer, infiltration and water content measurements will be collected in the all plots during 2013. These measurements will be collected to determine longevity of the previous tillage as well as the effectiveness of the current tillage.
Infiltration Rate, Slot Tillage StudyTillage in 2011
Measurement Year
Infil
tratio
n R
ate
(inch
/hr)
0
1
2
3
4
NT, RowSlot Till, RowNT, InterrowSlot Till, Interrow
2011 2012
Corn Grain Yield2012
Harvest 2012
Cor
n Yi
eld
(bu/
ac)
0
5
10
15
20
25
30
35
NTSlot Till
17
SEQUENCING SUNFLOWER IN A WINTER WHEAT ROTATION
J.G. Benjamin, and F.J. Calderón PROBLEM: Sunflower dries soil to lower water content and extracts water deeper in the soil than other crops used in dryland rotations. Experience from the ACR plots have shown difficult winter wheat establishment in rotations with sunflower because of dry soil conditions. Soil water recharge during the fallow period is low, with only about 25% to 35% of the precipitation occurring during that period being stored. We hypothesized that, because of low water storage efficiency during the fallow period, a short-season summer crop could be grown immediately following sunflower to use current-season precipitation without affecting water storage for winter wheat planting. The success of a summer crop after sunflower would be more appropriate for a region of slightly greater annual precipitation, as found in central Kansas or Nebraska. APPROACH: Plots were established to measure water recharge rates and wheat yields the second year after sunflower with different rotation/water treatments. Crops following sunflower are proso millet, field pea, sorghum or fallow (Table 1). Wheat was planted following each of these crops to determine proper sequencing to include sunflower in dryland rotations. Two water regimes are imposed on the experiment, one consisting of the natural rainfall at Akron, CO and the other with supplemental water added to simulate rainfall for Hays, KS. The difference between Akron and Hays precipitation is approximately 6 inches of water per year. The supplemental irrigation of the simulated Hays plots occurs at the beginning of the month with the amount determined by the monthly 30-year average precipitation differences between the two sites. Table 1. Crop sequences following sunflower for transition into winter wheat. 2010 2011 2012 2013 Sequence 1qtr 2qtr 3qtr 4qtr 1qtr 2qtr 3qtr 4qtr 1qtr 2qtr 3qtr 4qtr 1qtr 2qtr Sun-M-W Sunflower Fallow Millet Fallow Winter wheat Sun-P-W Sunflower Fallow Pea Fallow Winter wheat Sun-So-W Sunflower Fallow Sorghum Fallow Winter wheat Sun-F-W Sunflower Fallow Winter wheat RESULTS: Soil water contents under the simulated Hays weather conditions were greater than for the natural Akron conditions. Each soil layer had about 0.5 to 1 inch more stored soil water available for the following wheat crop with the simulated Hays than for Akron. In neither case did the extended fallow period following sunflower (Sun-F-W) result in greater soil water content or soil water storage at wheat planting than when a millet crop (Sun-M-W) was inserted in the rotation. For Akron weather conditions, the extended fallow period after sunflower (Sun-F-W) had greater water content and greater water storage at the 60” and 72” depths than with either field pea (Sun-P-W) or grain sorghum (Sun-So-W) inserted in the rotation, but no difference in the upper soil layers. For simulate Hays weather conditions, all rotations had similar soil water contents and soil water storage regardless of length of fallow period preceding wheat planting.
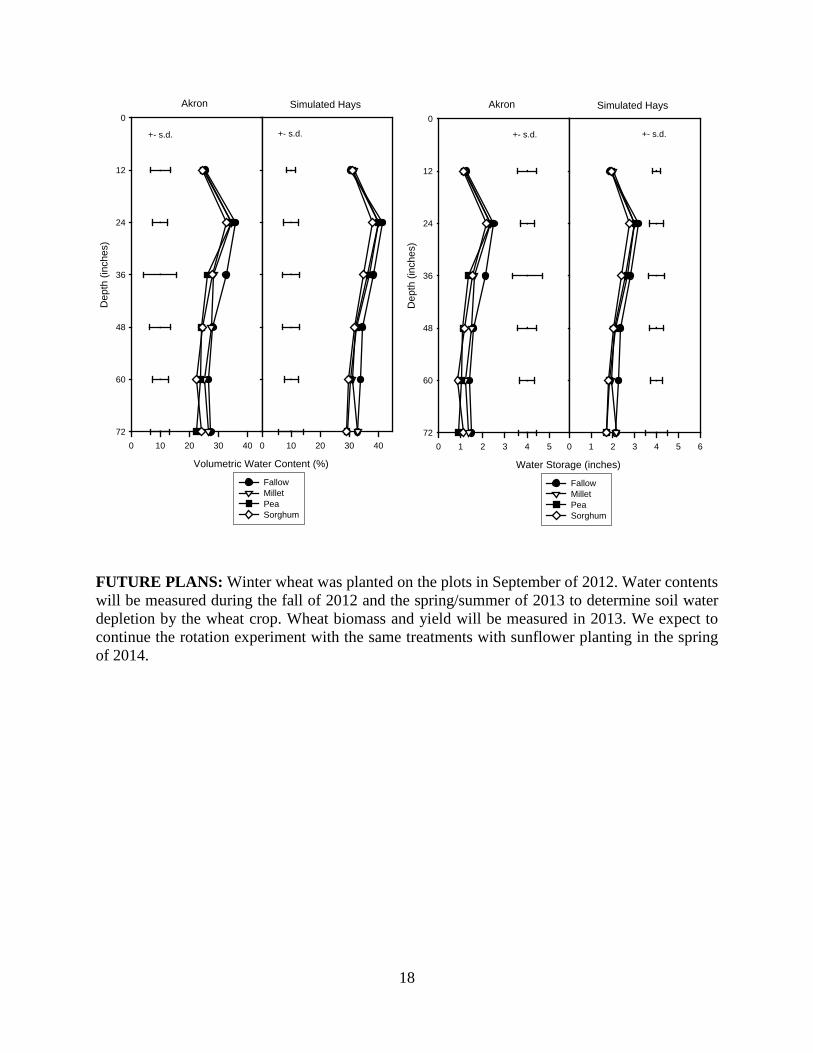
18
FUTURE PLANS: Winter wheat was planted on the plots in September of 2012. Water contents will be measured during the fall of 2012 and the spring/summer of 2013 to determine soil water depletion by the wheat crop. Wheat biomass and yield will be measured in 2013. We expect to continue the rotation experiment with the same treatments with sunflower planting in the spring of 2014.
Akron
Volumetric Water Content (%)
0 10 20 30 40
Dep
th (i
nche
s)0
12
24
36
48
60
72
FallowMilletPeaSorghum
Simulated Hays
0 10 20 30 40
+- s.d. +- s.d.
Akron
Water Storage (inches)
0 1 2 3 4 5
Dep
th (i
nche
s)
0
12
24
36
48
60
72
FallowMilletPeaSorghum
Simulated Hays
0 1 2 3 4 5 6
+- s.d. +- s.d.
19
ORGANIC WHEAT AND FORAGE ROTATIONS IN THE CGPRS
F.J. Calderón, and M.F. Vigil PROBLEM: Using compost instead of synthetic fertilizers has the advantage that the land receives organic matter as well as N and P. This may allow researchers and farmers to increase soil organic matter directly, as well as meeting the crops nutrient demands. This is important in view that dryland cropping practices such as no till, while being beneficial to soil C, are slow to produce results, never reaching the organic matter levels of a virgin prairie soil. Compost could be used to maintain high soil organic matter even in intensively cropped land. Manures and composts are readily available in the Central Great Plains because the climate is favorable for animal feeding operations leading to a good number of feedlots, some of which have composting operations. Thus, compost is a locally available resource, and we should strive to use it effectively. The fertilizer efficiency of the compost will depend on available water, compost stability, and crop demands among other things. Organic dryland cereal grain farming, however, has the disadvantage that tillage is the only economical alternative to herbicides, which diminishes the water capture and erosion control benefits of having a thick residue cover such as in no-till. Compost stability becomes an issue because the more stable the compost, the slower it releases nitrogen into the soil. Because of all these issues and tradeoffs, it is important to carry out field trials to determine the fertility management in compost-based systems. We have established a long-term experiment at the CGPRS to study the sustainability and performance of compost based wheat fallow, side-by-side with a forage winter crop system of triticale/Austrian winter pea in combination with three compost rates. APPROACH: The management of the study began in 2008. The plots were initially certified organic, and are currently managed without synthetic fertilizers or herbicides even though they are no longer organic certified. The prairie soils were plowed and winter wheat was grown in the whole experimental land in the 2008-09 season, then fallowed until establishment of the experiment plots in 2010. In the fall of 2010, three compost treatments were applied to the field: a nothing-added control, a 1x treatment according to expected N demand (10.3 American t/a), and a 5x rate (48.9 t/a). The 1x treatment was based on an expected 40 lbs/acre available N for first season, which assumes that approximately 11% of the compost N is released and accessible to the crop in the first season. The two cropping systems are a wheat-fallow rotaion, and a forage triticale/pea-fallow rotation. The study is a randomized complete block consisting of four blocks, with compost as the main plots and rotations as the subplots, with a total of 36 plots. Both phases of the crop rotations are present every year. Weed control has been done by sweep tillage as needed, and the wheat has been harvested with a stripper header to maximize residue cover. The forage was harvested by mowing and baling once the peas started to flower. Measurements have included: Grain yields, biomass at harvest, pre-plant soil moisture, grain and biomass C and N content, and soil quality according to infrared spectroscopy. As of the winter of 2012-13, two full years have been completed: The 2010-2011season, and the 2011-12 season, which make up one full crop cycle for all the plots. Compost was reapplied in the fall of 2012 before the start of the second crop cycle.
20
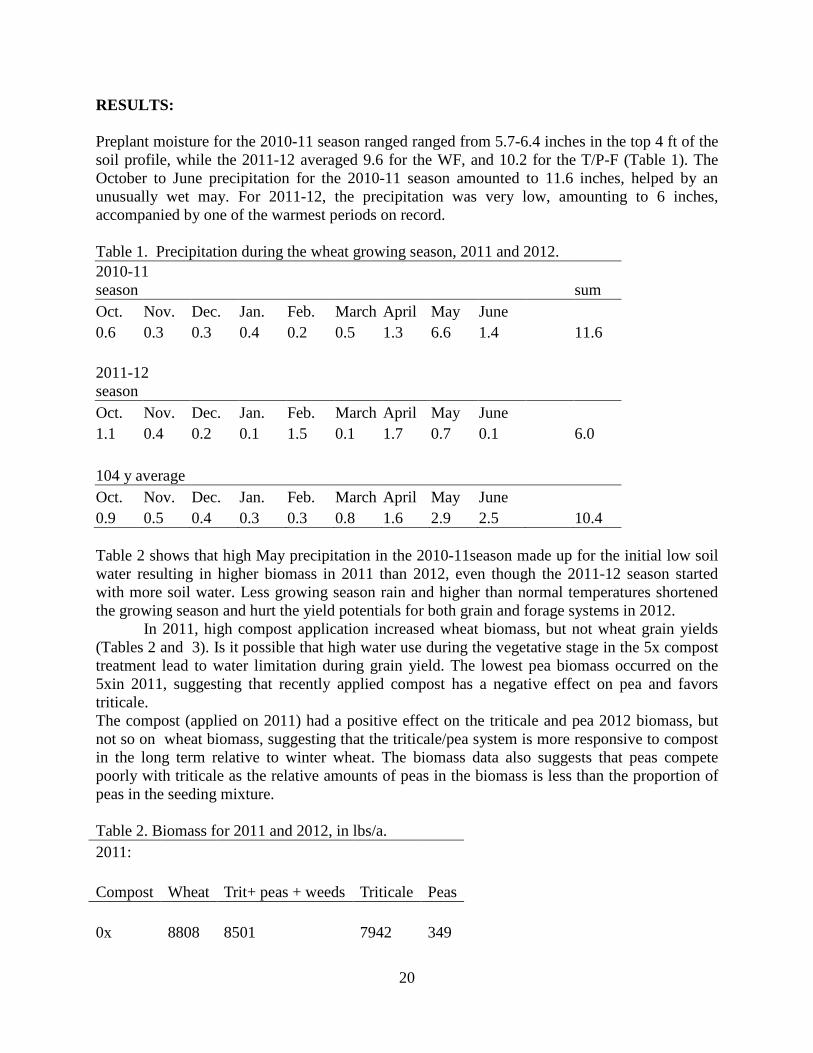
RESULTS: Preplant moisture for the 2010-11 season ranged ranged from 5.7-6.4 inches in the top 4 ft of the soil profile, while the 2011-12 averaged 9.6 for the WF, and 10.2 for the T/P-F (Table 1). The October to June precipitation for the 2010-11 season amounted to 11.6 inches, helped by an unusually wet may. For 2011-12, the precipitation was very low, amounting to 6 inches, accompanied by one of the warmest periods on record. Table 1. Precipitation during the wheat growing season, 2011 and 2012. 2010-11 season
sum
Oct. Nov. Dec. Jan. Feb. March April May June 0.6 0.3 0.3 0.4 0.2 0.5 1.3 6.6 1.4
11.6
2011-12 season
Oct. Nov. Dec. Jan. Feb. March April May June 1.1 0.4 0.2 0.1 1.5 0.1 1.7 0.7 0.1
6.0
104 y average Oct. Nov. Dec. Jan. Feb. March April May June
0.9 0.5 0.4 0.3 0.3 0.8 1.6 2.9 2.5
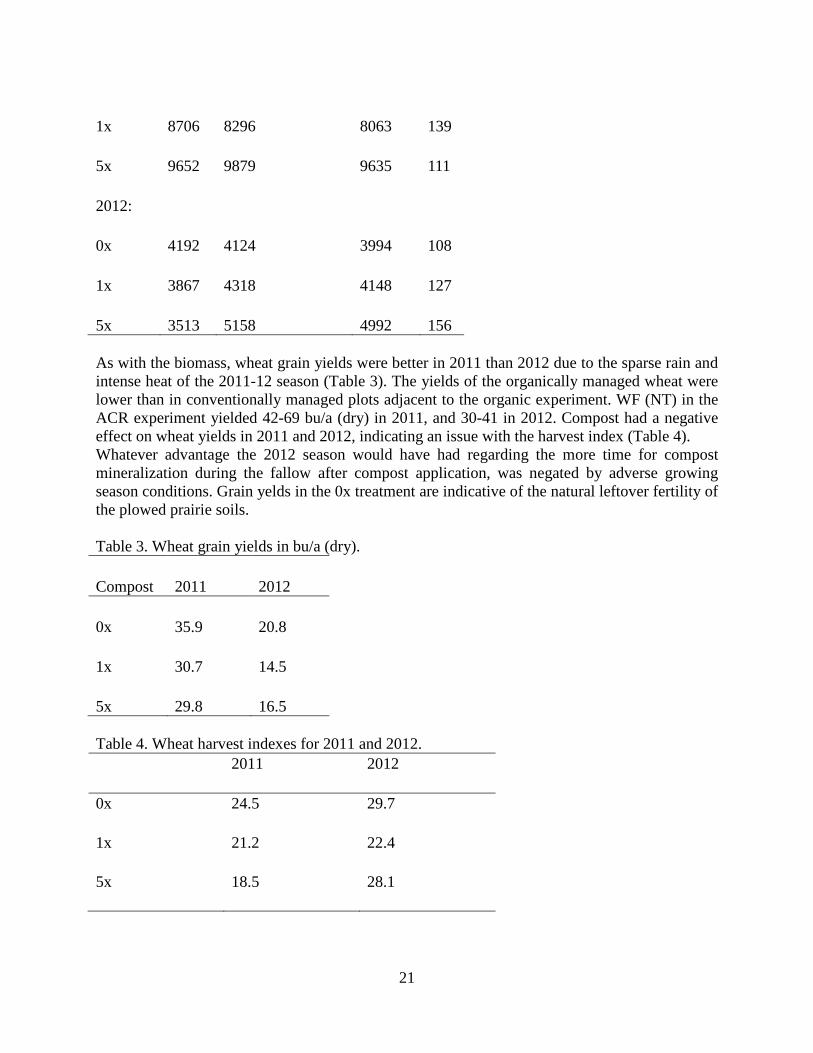
10.4 Table 2 shows that high May precipitation in the 2010-11season made up for the initial low soil water resulting in higher biomass in 2011 than 2012, even though the 2011-12 season started with more soil water. Less growing season rain and higher than normal temperatures shortened the growing season and hurt the yield potentials for both grain and forage systems in 2012. In 2011, high compost application increased wheat biomass, but not wheat grain yields (Tables 2 and 3). Is it possible that high water use during the vegetative stage in the 5x compost treatment lead to water limitation during grain yield. The lowest pea biomass occurred on the 5xin 2011, suggesting that recently applied compost has a negative effect on pea and favors triticale. The compost (applied on 2011) had a positive effect on the triticale and pea 2012 biomass, but not so on wheat biomass, suggesting that the triticale/pea system is more responsive to compost in the long term relative to winter wheat. The biomass data also suggests that peas compete poorly with triticale as the relative amounts of peas in the biomass is less than the proportion of peas in the seeding mixture. Table 2. Biomass for 2011 and 2012, in lbs/a. 2011:
Compost Wheat Trit+ peas + weeds Triticale Peas
0x 8808 8501 7942 349
21
1x 8706 8296 8063 139
5x 9652 9879 9635 111
2012:
0x 4192 4124 3994 108
1x 3867 4318 4148 127
5x 3513 5158 4992 156 As with the biomass, wheat grain yields were better in 2011 than 2012 due to the sparse rain and intense heat of the 2011-12 season (Table 3). The yields of the organically managed wheat were lower than in conventionally managed plots adjacent to the organic experiment. WF (NT) in the ACR experiment yielded 42-69 bu/a (dry) in 2011, and 30-41 in 2012. Compost had a negative effect on wheat yields in 2011 and 2012, indicating an issue with the harvest index (Table 4). Whatever advantage the 2012 season would have had regarding the more time for compost mineralization during the fallow after compost application, was negated by adverse growing season conditions. Grain yelds in the 0x treatment are indicative of the natural leftover fertility of the plowed prairie soils. Table 3. Wheat grain yields in bu/a (dry).
Compost 2011 2012
0x 35.9 20.8
1x 30.7 14.5
5x 29.8 16.5 Table 4. Wheat harvest indexes for 2011 and 2012. 2011 2012
0x 24.5 29.7
1x 21.2 22.4
5x 18.5 28.1
22
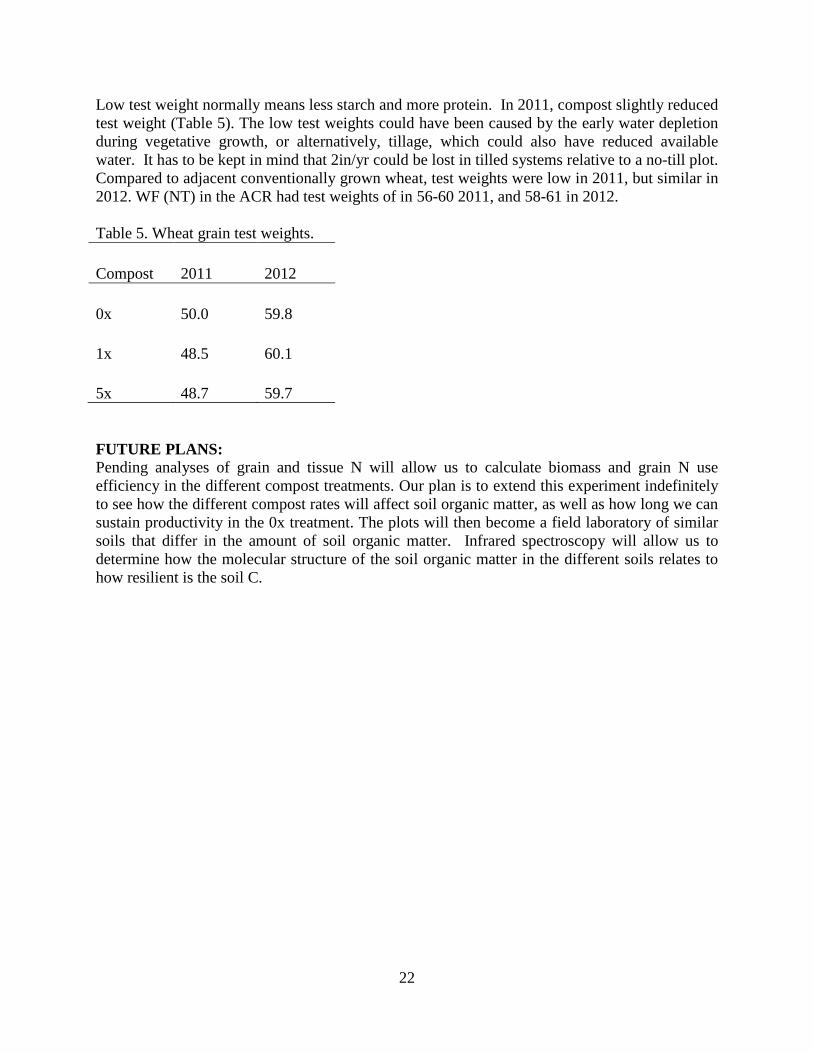
Low test weight normally means less starch and more protein. In 2011, compost slightly reduced test weight (Table 5). The low test weights could have been caused by the early water depletion during vegetative growth, or alternatively, tillage, which could also have reduced available water. It has to be kept in mind that 2in/yr could be lost in tilled systems relative to a no-till plot. Compared to adjacent conventionally grown wheat, test weights were low in 2011, but similar in 2012. WF (NT) in the ACR had test weights of in 56-60 2011, and 58-61 in 2012. Table 5. Wheat grain test weights.
Compost 2011 2012
0x 50.0 59.8
1x 48.5 60.1
5x 48.7 59.7 FUTURE PLANS: Pending analyses of grain and tissue N will allow us to calculate biomass and grain N use efficiency in the different compost treatments. Our plan is to extend this experiment indefinitely to see how the different compost rates will affect soil organic matter, as well as how long we can sustain productivity in the 0x treatment. The plots will then become a field laboratory of similar soils that differ in the amount of soil organic matter. Infrared spectroscopy will allow us to determine how the molecular structure of the soil organic matter in the different soils relates to how resilient is the soil C.
23
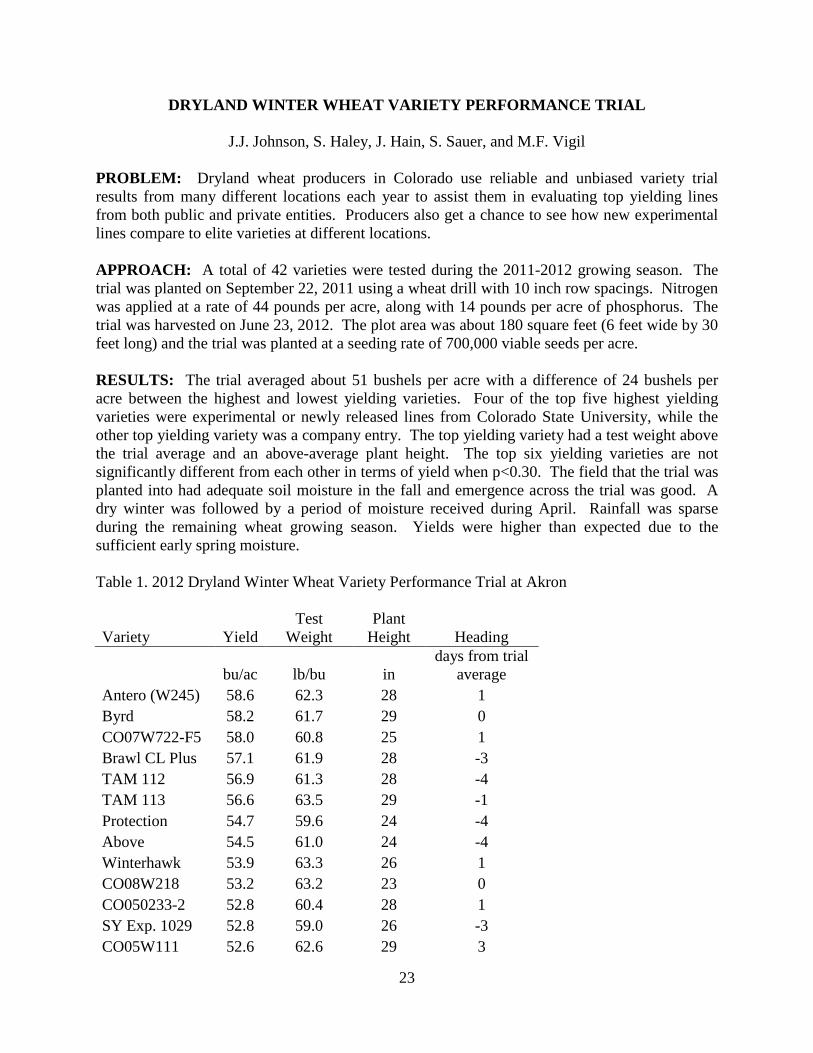
DRYLAND WINTER WHEAT VARIETY PERFORMANCE TRIAL
J.J. Johnson, S. Haley, J. Hain, S. Sauer, and M.F. Vigil
PROBLEM: Dryland wheat producers in Colorado use reliable and unbiased variety trial results from many different locations each year to assist them in evaluating top yielding lines from both public and private entities. Producers also get a chance to see how new experimental lines compare to elite varieties at different locations. APPROACH: A total of 42 varieties were tested during the 2011-2012 growing season. The trial was planted on September 22, 2011 using a wheat drill with 10 inch row spacings. Nitrogen was applied at a rate of 44 pounds per acre, along with 14 pounds per acre of phosphorus. The trial was harvested on June 23, 2012. The plot area was about 180 square feet (6 feet wide by 30 feet long) and the trial was planted at a seeding rate of 700,000 viable seeds per acre. RESULTS: The trial averaged about 51 bushels per acre with a difference of 24 bushels per acre between the highest and lowest yielding varieties. Four of the top five highest yielding varieties were experimental or newly released lines from Colorado State University, while the other top yielding variety was a company entry. The top yielding variety had a test weight above the trial average and an above-average plant height. The top six yielding varieties are not significantly different from each other in terms of yield when p<0.30. The field that the trial was planted into had adequate soil moisture in the fall and emergence across the trial was good. A dry winter was followed by a period of moisture received during April. Rainfall was sparse during the remaining wheat growing season. Yields were higher than expected due to the sufficient early spring moisture. Table 1. 2012 Dryland Winter Wheat Variety Performance Trial at Akron
Variety Yield Test
Weight Plant
Height Heading
bu/ac lb/bu in
days from trial average
Antero (W245) 58.6 62.3 28 1 Byrd 58.2 61.7 29 0 CO07W722-F5 58.0 60.8 25 1 Brawl CL Plus 57.1 61.9 28 -3 TAM 112 56.9 61.3 28 -4 TAM 113 56.6 63.5 29 -1 Protection 54.7 59.6 24 -4 Above 54.5 61.0 24 -4 Winterhawk 53.9 63.3 26 1 CO08W218 53.2 63.2 23 0 CO050233-2 52.8 60.4 28 1 SY Exp. 1029 52.8 59.0 26 -3 CO05W111 52.6 62.6 29 3
24
TAM 111 52.3 61.7 25 1 Bill Brown 52.3 61.6 26 0 T158 52.2 62.9 25 -2 TAM 304 52.1 60.4 27 -1 Robidoux 51.9 61.5 26 0 Settler CL 51.7 60.8 26 0 Denali 51.5 61.8 28 3 Ripper 51.3 60.8 27 0 Snowmass 51.2 61.4 26 3 T163 50.9 63.4 29 -3 CSU Blend12 50.6 62.1 25 0 Thunder CL 50.6 61.3 24 1 SY Wolf 50.4 61.2 26 4 NE05496 50.4 61.9 24 0 CO08W454 50.3 62.0 25 0 McGill 50.3 61.1 26 1 CO08263 49.8 60.2 25 0 Bond CL 49.7 58.9 27 -2 Hatcher 49.4 61.9 25 0 CO08W328 49.0 61.7 24 2 CO08346 48.7 63.4 27 2 NE05548 48.4 61.0 25 0 KS020319-7-3 48.3 62.7 24 -2 Everest 48.0 62.4 25 -3 Armour 47.9 61.9 25 -4 OK05312 45.7 62.8 24 3 CO08M011 45.3 60.0 25 2 Clara CL 44.3 63.4 25 0 Judee 34.7 61.8 24 4 Average 51.2 61.6 26 May 13, 2012 LSDa 2.6
aIf the difference between two variety yields equals or exceeds the LSD value, the difference is significant.
FUTURE PLANS: Another wheat variety performance trial has already been planted at Akron for the 2012-2013 growing season, and new releases along with promising experimental lines and some elite varieties have been included. NOTE: 2012 spring crop hybrid performance trials (corn, grain sorghum, and sunflower) conducted at Akron in 2012 were lost due to the extreme drought and heat conditions during the growing season. These crop performance trials will be conducted again in 2013.
25
DRYLAND AND IRRIGATED FORAGE SORGHUM PERFORMANCE TRIAL
C. Jahn, M. Turner, J.J. Johnson, J. Hain, S. Sauer, J.P. Schneekloth, D.C. Nielson, and M.F. Vigil
PROBLEM: In recent years, general interest in the production of biomass crops for both forage as well as ethanol and cellulosic biofuels has greatly increased in the Great Plains. However, the successful cultivation of many biomass crops is often strongly dependent on the amount of water available, and not all biofuel crops have adequate drought-tolerance for reliable production in this semi-arid region. In contrast, many forage sorghum varieties perform well even under heat and drought stress, although there is a substantial variation for this tolerance across genotypes. To determine which forage sorghum varieties represent viable options for biomass production in the Great Plains, entries with different maturities and plant types from multiple companies were grown under both irrigated and dryland conditions at multiple locations. Dryland and irrigated forage sorghum producers in Colorado rely on these reliable and unbiased variety trial results to assist them in making production decisions. APPROACH: A total of 17 varieties were tested during the 2012 growing season using a randomized complete block design with four replications for dryland and irrigated treatments. The trial was planted on May 31, 2012 using a four-row cone planter with 30 inch row spacing. Nitrogen was applied at a rate of 40 pounds per acre. Two subsamples measuring one meter in length each were hand-harvested from each plot on September 25, 2012. The plot area was about 300 square feet (10 feet wide by 30 feet long) and the trial was planted at a seeding rate of 69,700 seeds per acre for the dryland treatment and 113,250 seeds per acre for the irrigated treatment. RESULTS: Dryland Results The dryland trial biomass yield average was about 3.4 tons per acre with a difference of about 3.6 tons per acre between the highest and lowest yielding varieties. The top yielding variety had a stem sugar content below the trial average and an above-average plant height. The top seven yielding varieties are not significantly different from each other in terms of biomass production when p<0.20.
26
The trial was planted into dry soil moisture conditions and irrigated with overhead risers for stand establishment. Because of the extremely dry and hot season, the trial received rescue irrigations from late July through mid-September however, hot and windy conditions during the season greatly reduced the effectiveness of these overhead irrigations. The precipitation was far below normal for the growing season with June, August, and September being extremely dry. Weeds (particularly Russian thistle, puncture vine, and kochia) were a problem during the growing season and hard to control due to the weather conditions. Multiple herbicides were applied, but the hot and dry weather compromised their effectiveness. Forage yields were poor and variable because of the dry and hot season. Table 1. 2012 Dryland Forage Sorghum Variety Performance Trial at Akron
Source VarietyForage Yielda
Brix (Stem Sugar)
Plant Height Flowering Type
Maturity Groupb
tons/ac percent in percent at harvestChromatin FS0000HS 5.26 10.9 17.1 0.0 Forage PGayland Ward Seed Super Sugar 4.76 13.8 27.2 62.5 Sweet EAERC CSSPM-7 4.40 10.4 30.4 62.5 Pearl Millet EEastern CO Seeds HP1010BMR 4.19 11.5 15.5 0.0 Forage LEastern CO Seeds HPECS12EXP 3.92 11.6 12.3 0.0 Forage MEEastern CO Seeds HP99BMR 3.86 12.0 18.8 0.0 Forage MEGayland Ward Seed Sweet for Ever 3.56 12.5 14.5 25.0 Sweet PRichardson Seeds X38400 3.54 11.5 17.0 62.5 Sorghum x Sudan MEChromatin FS00504 3.40 11.9 15.5 0.0 Forage LEastern CO Seeds HP85BMR 3.25 11.1 22.0 37.5 Forage ERichardson Seeds Silo 700D 3.13 12.1 9.9 0.0 Hybrid Forage MLChromatin FS00991 3.09 11.5 12.4 0.0 Forage LEastern CO Seeds HP95BMR 2.98 12.0 15.4 12.5 Forage MEAERC CSSH-45 2.70 12.9 19.2 0.0 Sweet EEastern CO Seeds HP120BMR 2.22 13.3 8.6 0.0 Forage LRichardson Seeds X36400 1.82 11.1 9.4 0.0 Hybrid Forage LChromatin FS0000HT 1.66 11.8 7.6 0.0 Forage PAverage 3.40 11.9 16.0 15.4cLSD (P<0.05) 2.41cLSD (P<0.20) 1.66aYields are adjusted to 70% moisture content based on oven-dried samples.bMaturity Group: E=early; ME=medium-early; ML=medium-late; L=late, P=Photoperiod sensitive.cIf the difference between two varieties yields equals or exceeds the LSD value, there is a 95% (at P<0.05) or 80% (at P<0.20) chance the difference is statistically significant.
27
Irrigated Results The irrigated trial averaged about 7.6 tons per acre with a difference of about 6.1 tons per acre between the highest and lowest yielding varieties. The top yielding variety had a stem sugar content a little below the trial average and a very tall plant height. The top eleven yielding varieties are not significantly different from each other in terms of biomass production when p<0.20. The trial was planted into dry soil moisture conditions and irrigated with overhead risers for stand establishment. In-season overhead irrigations were applied from late June through mid-September. Weeds (particularly Russian thistle, puncture vine, and kochia) were hard to control. Multiple herbicides were applied, but the hot and dry weather compromised their effectiveness. Forage yields were poor and variable. Chronic hot and windy conditions made overhead irrigation difficult and created substantial spatial variability across the field. Table 2. 2012 Irrigated Forage Sorghum Variety Performance Trial at Akron
Source VarietyForage Yielda
Brix (Stem Sugar)
Plant Height Flowering Type
Maturity Groupb
tons/ac percent in percent at harvestChromatin FS0000HT 10.17 12.7 41.9 0.0 Forage PEastern CO Seeds HP95BMR 9.81 14.0 50.3 100.0 Forage MERichardson Seeds Silo 700D 9.65 15.0 25.0 62.5 Hybrid Forage MLEastern CO Seeds HP99BMR 9.59 13.7 43.0 25.0 Forage MEAERC CSSPM-7 9.03 12.0 49.0 100.0 Pearl Millet EEastern CO Seeds HP1010BMR 8.73 12.9 44.7 25.0 Forage LRichardson Seeds X38400 8.69 13.3 30.2 50.0 Sorghum x Sudan MEChromatin FS00504 7.83 11.6 44.9 12.5 Forage LEastern CO Seeds HP120BMR 7.61 13.7 23.8 37.5 Forage LChromatin FS00991 7.45 11.6 19.2 12.5 Forage LAERC CSSH-45 7.34 14.8 40.4 50.0 Sweet EEastern CO Seeds HPECS12EXP 7.02 14.1 21.4 50.0 Forage MEChromatin FS0000HS 6.59 12.5 24.5 0.0 Forage PGayland Ward Seed Super Sugar 6.58 13.4 46.9 100.0 Sweet EEastern CO Seeds HP85BMR 4.67 12.8 35.4 37.5 Forage EGayland Ward Seed Sweet for Ever 4.10 12.2 20.2 37.5 Sweet PRichardson Seeds X36400 4.07 12.1 15.4 12.5 Hybrid Forage LAverage 7.58 13.1 33.9 41.9cLSD (P<0.05) 4.62cLSD (P<0.20) 2.85aYields are adjusted to 70% moisture content based on oven-dried samples.bMaturity Group: E=early; ME=medium-early; ML=medium-late; L=late, P=Photoperiod sensitive.cIf the difference between two varieties yields equals or exceeds the LSD value, there is a 95% (at P<0.05) or 80% (at P<0.20) chance the difference is statistically significant. FUTURE PLANS: The forage sorghum trial will be not repeated at Akron in 2013.
28
CORN PRODUCTIVITY INFLUENCED BY RESIDUE
REMOVAL AND NITROGEN
M.M. Mikha, and J.G. Benjamin
PROBLEM: In recent years, interest in alternative energy sources has shifted toward using non-grain cellulosic biomass as the feedstock for bioenergy. From a soil perspective, keeping residue in the field maintains soil organic matter (SOM), improves soil quality, and reduces soil erosion. The estimates of the amount of crop residue available for harvest are based on soil loss tolerance (T) to reduce soil erosion. In the Central Great Plains Region (CGPR), residue removal (non-grain biomass) could have the potential to affect soil loss through erosion (especially wind erosion), deteriorate soil quality (such as soil chemical and physical properties), and reduce plant productivity. Understanding the impacts of crop residue biomass removal on soil processes could help in developing harvest management systems. Therefore, guidelines and best management practices are necessary to protect the soil from degradation and productivity loss. OBJECTIVES: • Identify the residue removal rate that prevents soil degradation and maintains soil quality
and productivity. • Evaluate the impact of using different types of nitrogen source (beef manure vs.
commercial fertilizer) on soil quality and plant productivity in relation to residue removal rates.
• Quantify the effect of beef manure amendment on preventing degradation of soil quality and maintaining plant productivity after removing crop residues compared with commercial nitrogen fertilizer.
• Over all, identify some guidelines for the best management practices to protect the soil from degradation and productivity loss due to residue removal.
APPROACH: An experiment was initiated (Spring 2008) on irrigated land at the Central Great Plains Research Station, Akron, CO to address the effects of crop residue removal and beef manure additions on soil quality and plant productivity. The experiment is a randomized strip design with no-tillage management and two nitrogen sources (manure vs. commercial fertilizer). The same N rate of manure nitrogen and commercial fertilizer nitrogen (urea) was added every spring for corn crop production. The Excess N leaching through soil profile is being evaluated by deep soil sampling (4 feet). Three residue removal levels are being evaluated: No residue removal (0%), Medium residue removal (40-55%), and Maximum residue removal (75-95%).
29
Jan Feb Mar Apr May Jun Jul Aug Sep Oct Nov Dec
Mea
n Tem
perat
ure (
o F)
0
10
20
30
40
50
60
70
80
902010 2011 2012 104-yr Ave
RESULTS: Corn grain yield, within each individual growing season, was not significantly influenced by N sources (manure vs. fertilizer) or by residue removal rates (Fig. 1). Throughout the duration of the study (2008-2012), there is a tendency for yield reduction associated with fertilizer treatments and ~80% residue removal, but it is not significant at this time.
Average across the N sources, residue removal rates did not influence corn grain yield during the first three years, 2008-2010, of this study (Fig. 2). Apparently, during the fourth (2011) and the fifth (2012) years of the growing season, grain yield were lower (P < 0.05) with residue removing. Although there is a reduction in grain yield from 2010 to 2012, this overall reduction in yield could probably be related to the ambient temperature (Fig. 3) since moisture was not a limiting factor in this irrigated site. The ambient temperature (2010-2012) was higher than the 104-yr average especially from Jun to October (Fig. 3). Apparently, the combination of high ambient temperature and the residue
removal at ~50% and ~80% influenced grain yield in 2011 and 2012 compared with 0% removal.
2008 2009 2010 2011 2012
Corn
grain
yield
(bu a
c-1)
0
50
100
150
200
250F 0% F 50% F 80% M 0% M 50% M 80%
2008 2009 2010 2011 2012
Cor
n gr
ain
yiel
d (b
u ac
-1)
0
50
100
150
200
250 0% 50% 80% a
aa aaa
aaaab
ab
b
a
Figure 2: Corn grain yield (bu/ac) across N sources influenced by differnt residue removal rates (0%, ~50%, and ~80%) from 2008 to 2012 growing seasons.
Figure 1: Corn grain yield (bu/ac) influenced by differnt residue removal rates (0%, ~50%, and ~80%) and N sources (beef manure; M and commercial fertilizer; F) from 2008 to 2012 growing seasons.
Figure 3: Ambient temperature (degree oF) for 2010, 2011, 2012, and 104 years average for Akron, CO.
30
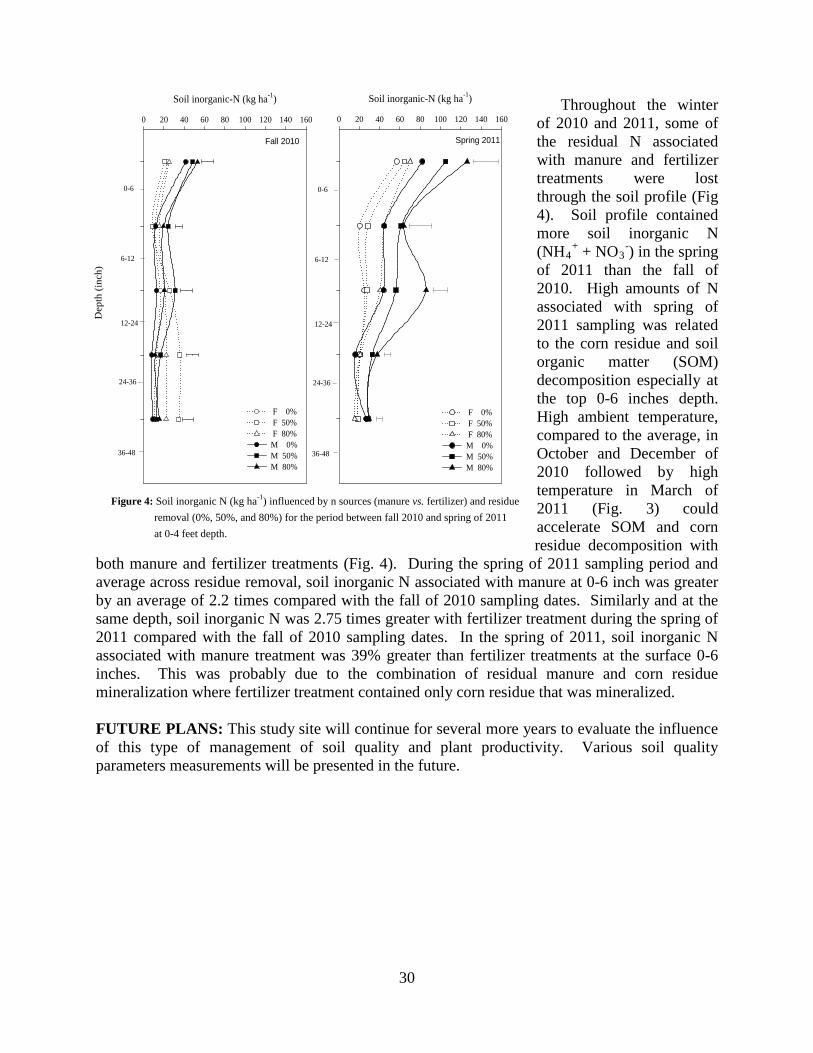
Throughout the winter of 2010 and 2011, some of the residual N associated with manure and fertilizer treatments were lost through the soil profile (Fig 4). Soil profile contained more soil inorganic N (NH4
+ + NO3-) in the spring
of 2011 than the fall of 2010. High amounts of N associated with spring of 2011 sampling was related to the corn residue and soil organic matter (SOM) decomposition especially at the top 0-6 inches depth. High ambient temperature, compared to the average, in October and December of 2010 followed by high temperature in March of 2011 (Fig. 3) could accelerate SOM and corn residue decomposition with
both manure and fertilizer treatments (Fig. 4). During the spring of 2011 sampling period and average across residue removal, soil inorganic N associated with manure at 0-6 inch was greater by an average of 2.2 times compared with the fall of 2010 sampling dates. Similarly and at the same depth, soil inorganic N was 2.75 times greater with fertilizer treatment during the spring of 2011 compared with the fall of 2010 sampling dates. In the spring of 2011, soil inorganic N associated with manure treatment was 39% greater than fertilizer treatments at the surface 0-6 inches. This was probably due to the combination of residual manure and corn residue mineralization where fertilizer treatment contained only corn residue that was mineralized.
FUTURE PLANS: This study site will continue for several more years to evaluate the influence of this type of management of soil quality and plant productivity. Various soil quality parameters measurements will be presented in the future.
Soil inorganic-N (kg ha-1)
0 20 40 60 80 100 120 140 160
Dep
th (i
nch)
F 0% F 50% F 80% M 0% M 50% M 80%
Soil inorganic-N (kg ha-1)
0 20 40 60 80 100 120 140 160
F 0% F 50% F 80%M 0%M 50%M 80%
Fall 2010 Spring 2011
36-48
24-36
12-24
6-12
0-6
36-48
24-36
12-24
6-12
0-6
Figure 4: Soil inorganic N (kg ha-1) influenced by n sources (manure vs. fertilizer) and residue removal (0%, 50%, and 80%) for the period between fall 2010 and spring of 2011 at 0-4 feet depth.

31
CROP ROTATION AND TILLAGE EFFECTS ON WATER USE AND YIELD OF ALTERNATIVE CROP ROTATIONS FOR THE CENTRAL GREAT PLAINS
D.C. Nielsen, M.F. Vigil, J.G. Benjamin, M.M Mikha, F.J. Calderón, and D. J.Poss
PROBLEM: Increased use of conservation tillage practices has made more soil moisture available for crop production in the central Great Plains, thereby providing greater opportunities for more intensive crop production as compared with conventional wheat-fallow. Information is needed regarding water use patterns, rooting depth, water use/yield relationships, precipitation storage and use efficiencies, and water stress effects of crops grown in proposed alternative rotations for the central Great Plains. APPROACH: Nine rotations [W-F(CT), W-F(NT), W-C-F(NT), W-M-F(NT), W-C-M(NT), W-C(skip row)-PEA(NT), W-Sorg(skip row)-F(NT), W-M-SUN-F(NT), W-SUN-M-PEA(NT)] are used for intensive measurements of water use and water stress effects on yield. (W:winter wheat, C:corn, F:fallow, M:proso millet, Sorg:grain sorghum, SUN:sunflower, PEA:pea; CT:conventional till, NT:no till). Measurements include soil water content, plant height, leaf area index, above-ground biomass, grain yield, residue cover, and precipitation. RESULTS:
Rotation
Crop
ET (in)
Yield (lb/a)
Rotation
Crop
ET (in)
Yield (lb/a)
W-F(CT) wheat 11.08 1661 W-Sorg*-F sorghum 7.25 650 W-F(NT) wheat 14.54 2165 W-M-SAF-F safflower 3.6 0 W-C-F wheat 12.59 2041 W-SAF-M-PEA safflower 5.53 0 W-M-F wheat 13.46 2037 W-C-F corn 6.67 0 W-Sorg*-F wheat 14.12 1972 W-C*-F corn 5.36 0 W-C-M wheat 6.68 195 W-C-M corn 6.12 0 W-C*-F wheat 12.30 2176 W-M-F millet 4.92 0 W-M-SAF-F wheat 11.37 1755 W-C-M millet 3.58 0 W-SAF-M-PEA wheat 7.54 713 W-M-SAF-F millet 6.37 154 W-SAF-M-PEA pea 3.51 0 W-SAF-M-PEA millet 3.19 0
* indicates “plant 2 skip 2” skip row planting configuration INTERPRETATION: Wheat yields were below average due to drought conditions. Wheat following fallow averaged 1972 lb/a (33 bu/a). Wheat following pea or millet averaged only 454 lb/a (8 bu/a). The effects of the drought were much more severe for other crops, with no yield recorded for corn, safflower, or pea. Additionally, only one of the millet rotations produced measureable seed yield (Wheat-Millet-Safflower-Fallow). Skip row grain sorghum yielded 650 lb/a while skip row corn did not produce any yield. FUTURE PLANS: The experiment will continue as in past years. Modeling of rotations will continue. The millet water use/grain yield relationship will be analyzed in further detail and submitted for publication. A manuscript is being prepared for publication that addresses erroneous conclusions previously published from this experiment purporting the synergistic effects of corn and pea on millet and wheat yields. A long-term database of volumetric soil water contents from this experiment has been submitted to Dr. Steven Quiring, Texas A&M University, to be included in the North American Soil Moisture Database.
32
DEVELOPMENT OF A DECISION SUPPORT SYSTEM FOR SUMMER CROP SELECTION IN THE CENTRAL GREAT PLAINS
D.C. Nielsen, and A.J. Thompson
PROBLEM: Better soil conservation, precipitation use efficiency (PUE) and economic returns from the introduction of summer fallow replacement crops into the dryland winter wheat-summer fallow (WF) cropping system have been reported in the semiarid Central Great Plains of USA. However, owing to the uncertain water availability in consequence of highly variable precipitation, selection of a fallow replacement crop with assured net-returns for the system is a challenge. A tool is needed for farmers to use in assessing the production risk incurred by growing a crop in place of summer fallow in a wheat production system. APPROACH: We simulated long-term probability of yield and net return from five summer crops (corn, canola, and proso millet for grain; and spring triticale and foxtail millet for forage) at various levels of plant available water (PAW) at planting, at Akron, CO and Sidney, NE. Long-term weather data collected at the locations and crop modules in the RZWQM2 model that were earlier calibrated and validated at the two locations were used for the study. Yield responses of the crops to 25, 50, 75 and 100% PAW at planting in the whole soil profile (180 cm) or only in the top 45 cm soil profile (with soil layers below 45 cm set at 50% of the maximum PAW) were simulated. Cumulative probability distributions of yield for the 7 starting soil water content scenarios were tabulated and incorporated into an Excel spreadsheet. RESULTS: Spreadsheet logic was developed that would search tables of model-simulated yields based on user input of location, crop, starting water content, and target yield. These inputs then return a value of the probability of producing at least the specified yield. An economic table was also developed that allows a user to input production costs and selling prices so that net returns of the user-specified target yield can be determined. FUTURE PLANS: The spreadsheet decision tool will be tested by volunteers and then distributed to farmers and consultants.
33
USING AQUACROP TO MODEL WINTER WHEAT PRODUCTION
D.C. Nielsen, D.J. Lyon, and J.J. Miceli-Garcia PROBLEM: The foundational crop in dryland cropping systems in the central Great Plains is winter wheat. Successful modeling of management and weather factors on cropping system productivity will therefore require that cropping systems models accurately simulate wheat grain production. The objective of this experiment is to calibrate, validate, and evaluate the AquaCrop model for winter wheat production at Akron, CO. APPROACH: Field studies were conducted at the US Central Great Plains Research Station (Akron) in 2005/2006, 2008/2009, and 2009/2010 as part of a flexible fallow system study in which wheat was grown in either a wheat-fallow system or a system in which wheat rotated with a spring- or summer-planted crop grown in place of the second summer fallow period (rotation treatments replicated four times). These data were used to calibrate the model. Model validation data came from the long-term Alternative Crop Rotation study conducted at the same location (rotation treatments replicated four times). These data came from 2004/2005, 2006/2007, and 2007/2008. Water use was calculated by the water balance method using soil water measurements made with a neutron probe. Plant growth (biomass and leaf area index) and phenological development were monitored during the growing season. Grain and forage yields were collected. Aquacrop is a model developed by the Food and Agriculture Organization of the United Nations and is a relatively simple model which uses relationships between water use and biomass production and harvest index to predict grain yield. During the calibration process, model parameters associated with water productivity, water stress effects on stomatal relationships, rooting, harvest index, canopy expansion etc. were adjusted systematically and incrementally with the goal of minimizing simulation errors for water use, biomass, and yield predictions. RESULTS: The data presented in Table 1 and shown in the subsequent figures indicate that AquaCrop could be adequately calibrated for winter wheat water use, biomass, and grain yield at Arkon, CO. Table 1. Statistics for winter wheat calibration and validation data sets used for AquaCrop evaluations at Akron, CO.
Parameter RMSE MRE D Calibration
Water Use (mm) 351 9 0.89 Biomass (kg/ha) 1050 12 0.94
Yield (kg/ha) 399 13 0.92
Validation Water Use (mm) 22 5 0.97 Biomass (kg/ha) 2220 34 0.88
Yield (kg/ha) 644 35 0.91
34
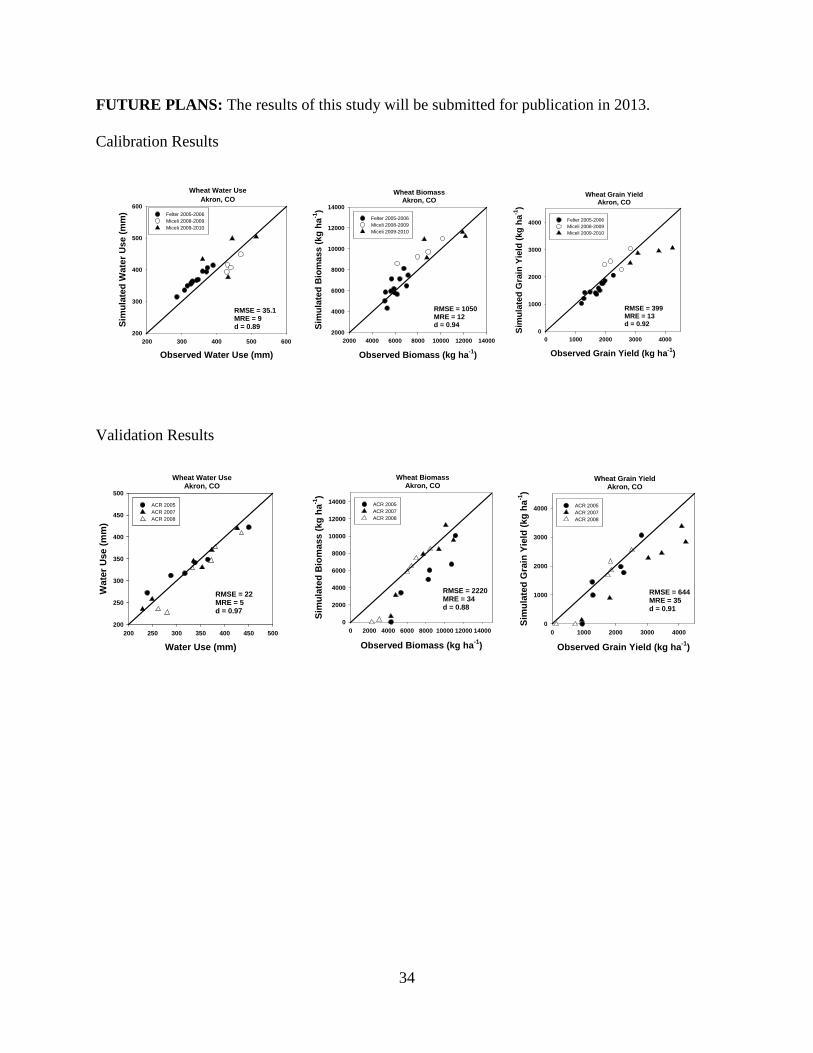
FUTURE PLANS: The results of this study will be submitted for publication in 2013.
Calibration Results
Validation Results
Wheat BiomassAkron, CO
Observed Biomass (kg ha-1)2000 4000 6000 8000 10000 12000 14000
Sim
ulat
ed B
iom
ass
(kg
ha-1
)2000
4000
6000
8000
10000
12000
14000
Felter 2005-2006Miceli 2008-2009Miceli 2009-2010
RMSE = 1050MRE = 12d = 0.94
Wheat Water UseAkron, CO
Observed Water Use (mm)200 300 400 500 600
Sim
ulat
ed W
ater
Use
(mm
)
200
300
400
500
600Felter 2005-2006Miceli 2008-2009Miceli 2009-2010
RMSE = 35.1MRE = 9d = 0.89
Wheat Grain YieldAkron, CO
Observed Grain Yield (kg ha-1)0 1000 2000 3000 4000
Sim
ulat
ed G
rain
Yie
ld (k
g ha
-1)
0
1000
2000
3000
4000 Felter 2005-2006Miceli 2008-2009Miceli 2009-2010
RMSE = 399MRE = 13d = 0.92
Wheat Water UseAkron, CO
Water Use (mm)200 250 300 350 400 450 500
Wat
er U
se (m
m)
200
250
300
350
400
450
500
ACR 2005ACR 2007ACR 2008
RMSE = 22MRE = 5d = 0.97
Wheat BiomassAkron, CO
Observed Biomass (kg ha-1)0 2000 4000 6000 8000 10000 12000 14000
Sim
ulat
ed B
iom
ass
(kg
ha-1
)
0
2000
4000
6000
8000
10000
12000
14000 ACR 2005ACR 2007ACR 2008
RMSE = 2220MRE = 34d = 0.88
Wheat Grain YieldAkron, CO
Observed Grain Yield (kg ha-1)0 1000 2000 3000 4000
Sim
ulat
ed G
rain
Yie
ld (k
g ha
-1)
0
1000
2000
3000
4000 ACR 2005ACR 2007ACR 2008
RMSE = 644MRE = 35d = 0.91
35
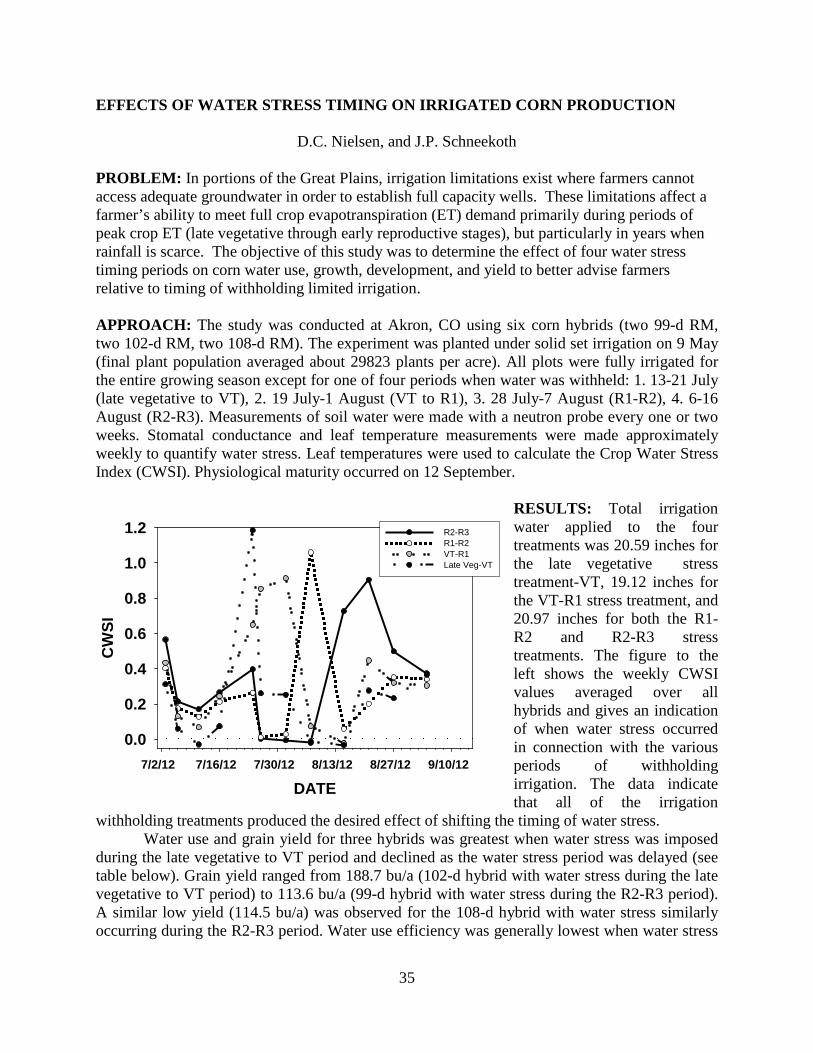
EFFECTS OF WATER STRESS TIMING ON IRRIGATED CORN PRODUCTION
D.C. Nielsen, and J.P. Schneekoth
PROBLEM: In portions of the Great Plains, irrigation limitations exist where farmers cannot access adequate groundwater in order to establish full capacity wells. These limitations affect a farmer’s ability to meet full crop evapotranspiration (ET) demand primarily during periods of peak crop ET (late vegetative through early reproductive stages), but particularly in years when rainfall is scarce. The objective of this study was to determine the effect of four water stress timing periods on corn water use, growth, development, and yield to better advise farmers relative to timing of withholding limited irrigation. APPROACH: The study was conducted at Akron, CO using six corn hybrids (two 99-d RM, two 102-d RM, two 108-d RM). The experiment was planted under solid set irrigation on 9 May (final plant population averaged about 29823 plants per acre). All plots were fully irrigated for the entire growing season except for one of four periods when water was withheld: 1. 13-21 July (late vegetative to VT), 2. 19 July-1 August (VT to R1), 3. 28 July-7 August (R1-R2), 4. 6-16 August (R2-R3). Measurements of soil water were made with a neutron probe every one or two weeks. Stomatal conductance and leaf temperature measurements were made approximately weekly to quantify water stress. Leaf temperatures were used to calculate the Crop Water Stress Index (CWSI). Physiological maturity occurred on 12 September.
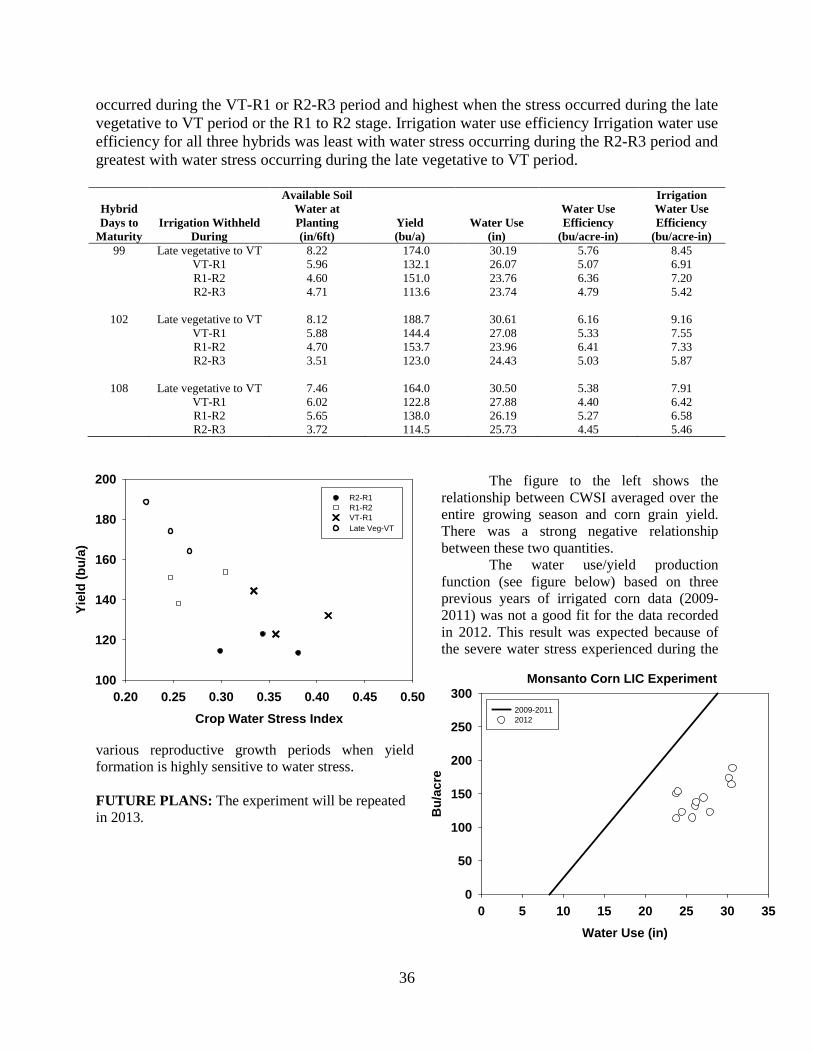
RESULTS: Total irrigation water applied to the four treatments was 20.59 inches for the late vegetative stress treatment-VT, 19.12 inches for the VT-R1 stress treatment, and 20.97 inches for both the R1-R2 and R2-R3 stress treatments. The figure to the left shows the weekly CWSI values averaged over all hybrids and gives an indication of when water stress occurred in connection with the various periods of withholding irrigation. The data indicate that all of the irrigation
withholding treatments produced the desired effect of shifting the timing of water stress. Water use and grain yield for three hybrids was greatest when water stress was imposed
during the late vegetative to VT period and declined as the water stress period was delayed (see table below). Grain yield ranged from 188.7 bu/a (102-d hybrid with water stress during the late vegetative to VT period) to 113.6 bu/a (99-d hybrid with water stress during the R2-R3 period). A similar low yield (114.5 bu/a) was observed for the 108-d hybrid with water stress similarly occurring during the R2-R3 period. Water use efficiency was generally lowest when water stress
DATE7/2/12 7/16/12 7/30/12 8/13/12 8/27/12 9/10/12
CW
SI
0.0
0.2
0.4
0.6
0.8
1.0
1.2 R2-R3R1-R2VT-R1Late Veg-VT
36
occurred during the VT-R1 or R2-R3 period and highest when the stress occurred during the late vegetative to VT period or the R1 to R2 stage. Irrigation water use efficiency Irrigation water use efficiency for all three hybrids was least with water stress occurring during the R2-R3 period and greatest with water stress occurring during the late vegetative to VT period.
Hybrid Days to
Maturity
Irrigation Withheld During
Available Soil Water at Planting (in/6ft)
Yield (bu/a)
Water Use (in)
Water Use Efficiency
(bu/acre-in)
Irrigation Water Use Efficiency
(bu/acre-in) 99 Late vegetative to VT 8.22 174.0 30.19 5.76 8.45 VT-R1 5.96 132.1 26.07 5.07 6.91 R1-R2 4.60 151.0 23.76 6.36 7.20 R2-R3 4.71 113.6 23.74 4.79 5.42
102 Late vegetative to VT 8.12 188.7 30.61 6.16 9.16 VT-R1 5.88 144.4 27.08 5.33 7.55 R1-R2 4.70 153.7 23.96 6.41 7.33 R2-R3 3.51 123.0 24.43 5.03 5.87
108 Late vegetative to VT 7.46 164.0 30.50 5.38 7.91 VT-R1 6.02 122.8 27.88 4.40 6.42 R1-R2 5.65 138.0 26.19 5.27 6.58 R2-R3 3.72 114.5 25.73 4.45 5.46
The figure to the left shows the relationship between CWSI averaged over the entire growing season and corn grain yield. There was a strong negative relationship between these two quantities.
The water use/yield production function (see figure below) based on three previous years of irrigated corn data (2009-2011) was not a good fit for the data recorded in 2012. This result was expected because of the severe water stress experienced during the
various reproductive growth periods when yield formation is highly sensitive to water stress. FUTURE PLANS: The experiment will be repeated in 2013.
Monsanto Corn LIC Experiment
Water Use (in)0 5 10 15 20 25 30 35
Bu/
acre
0
50
100
150
200
250
3002009-20112012Crop Water Stress Index
0.20 0.25 0.30 0.35 0.40 0.45 0.50
Yiel
d (b
u/a)
100
120
140
160
180
200R2-R1R1-R2VT-R1Late Veg-VT
37
SPRING-PLANTED COVER CROP WATER USE, BIOMASS PRODUCTION, SOIL MICROBIAL ACTIVITY – DO MIXTURES BEHAVE DIFFERENTLY THAN
SINGLE-SPECIES PLANTINGS?
D.C. Nielsen, D.J. Lyon, and F.J. Calderón
PROBLEM: The advantages of cover crops for protecting and improving the soil are well established. However, in semiarid environments, the water that cover crops use may result in significant yield loss in following crops such as winter wheat. Recently, there have been reports that a cover crop cocktail, consisting of at least 8 different plant species, uses much less water than a single-species cover crop. The reason given for this lower water use was greater soil microbiological activity with the mixture than with the single-species cover crop. This claim is difficult to believe despite its widespread circulation in the media and at meetings held throughout the region. APPROACH: We requested a cover crop recommendation from Keith Berns at Green Cover Seed in Bladen, NE. He recommended and sent a 10-species cocktail mix containing the following species: spring forage peas, lentils, common vetch, berseem clover, oats, spring barley, rapeseed, flax, phacelia, and safflower. For comparison purposes, we chose one species from each of the seed types, that is, legumes (spring forage peas), grasses (oats), Brassicas (rapeseed), and other broadleaves (flax), to plant as single-species cover crops along with the mixture to evaluate the claim that mixtures use less water than single-species plantings. We also included a no-till fallow with proso millet residue as a check treatment. All cover crop treatments were no-till seeded into proso millet residue on 27 March 27 2012 with 8 in row spacing. The experiment was laid out as a split plot design with four replications. The main plot factor was irrigation treatment (dryland or irrigated) and the split plot factor was cover crop species (mixture, flax, oats, peas, rapeseed, fallow). The experiment was conducted at both Akron and Sidney, NE. Two irrigation treatments were imposed at both locations. At Akron the two treatments were 1. irrigated to simulate average precipitation at Bladen, NE (south-central NE); 2. Irrigated to 80% of average precipitation at Akron, CO. At Sidney the two treatments were: 1. irrigated every two weeks to bring the total amount of precipitation and irrigation equal to the average precipitation for this location for the previous two weeks; 2. Rainfed (no irrigation). Soil water content was measured bi-weekly with a neutron probe at six depths (0-180 cm). These measurements were made approximately every two weeks during the cover crop growing season, and monthly during the following fallow period. The cover crops were terminated by chemical spraying on 16 June. Biomass measurements were taken on three dates (15 May 2012, 1 June 2012, 13 June 2012) during the growing season, with the final biomass measurement taken just prior to termination by spraying. Soil samples (0-5 cm, 5-15 cm) were taken on 27 June 2012 from each plot following cover crop termination and again at wheat planting. Another sample will be taken at wheat harvest for assessment of biological activity. The plot area was planted to winter wheat in mid-September 2012. Soil water measurements and wheat biomass measurements will be made periodically during the wheat growing season to quantify cover crop effects on subsequent wheat growth and development, and yield will be measured.
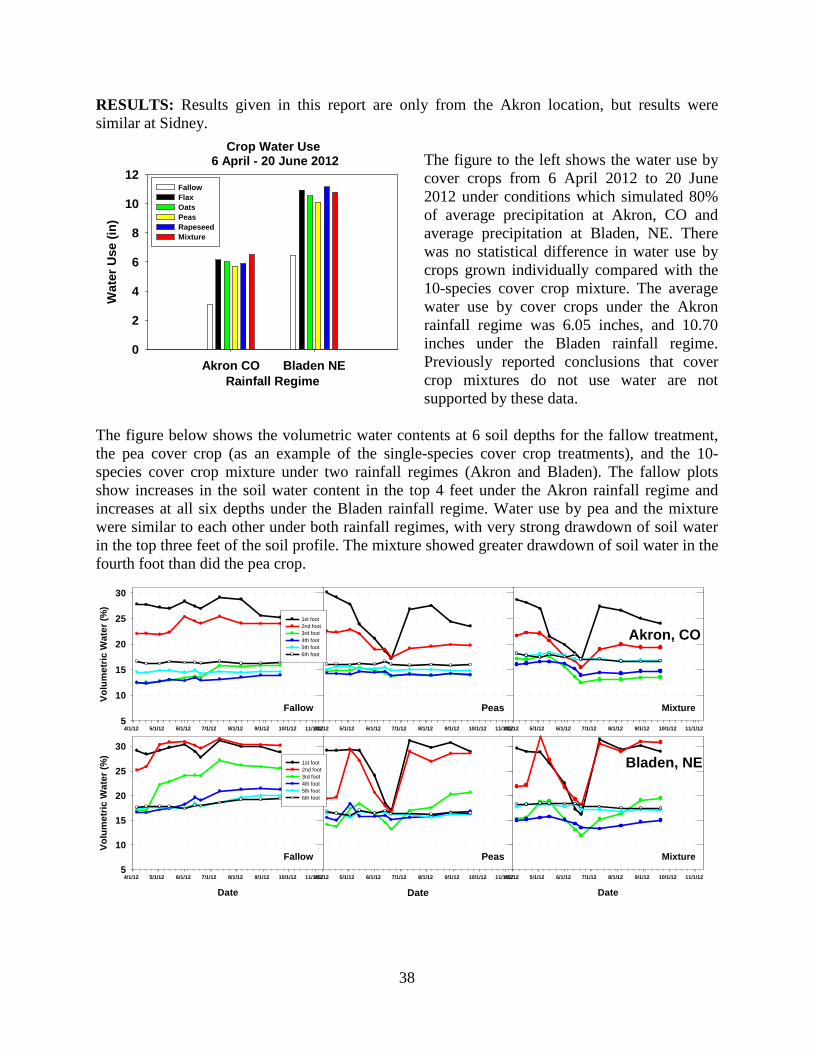
38
RESULTS: Results given in this report are only from the Akron location, but results were similar at Sidney.
The figure to the left shows the water use by cover crops from 6 April 2012 to 20 June 2012 under conditions which simulated 80% of average precipitation at Akron, CO and average precipitation at Bladen, NE. There was no statistical difference in water use by crops grown individually compared with the 10-species cover crop mixture. The average water use by cover crops under the Akron rainfall regime was 6.05 inches, and 10.70 inches under the Bladen rainfall regime. Previously reported conclusions that cover crop mixtures do not use water are not supported by these data.
The figure below shows the volumetric water contents at 6 soil depths for the fallow treatment, the pea cover crop (as an example of the single-species cover crop treatments), and the 10-species cover crop mixture under two rainfall regimes (Akron and Bladen). The fallow plots show increases in the soil water content in the top 4 feet under the Akron rainfall regime and increases at all six depths under the Bladen rainfall regime. Water use by pea and the mixture were similar to each other under both rainfall regimes, with very strong drawdown of soil water in the top three feet of the soil profile. The mixture showed greater drawdown of soil water in the fourth foot than did the pea crop.
Mixture
Date
4/1/12 5/1/12 6/1/12 7/1/12 8/1/12 9/1/12 10/1/12 11/1/12
Peas
Date4/1/12 5/1/12 6/1/12 7/1/12 8/1/12 9/1/12 10/1/12 11/1/12
Fallow
Date
4/1/12 5/1/12 6/1/12 7/1/12 8/1/12 9/1/12 10/1/12 11/1/12
Volu
met
ric W
ater
(%)
5
10
15
20
25
30
1st foot2nd foot3rd foot4th foot5th foot6th foot
Peas
Date4/1/12 5/1/12 6/1/12 7/1/12 8/1/12 9/1/12 10/1/12 11/1/12
Mixture
Date
4/1/12 5/1/12 6/1/12 7/1/12 8/1/12 9/1/12 10/1/12 11/1/12
Irrigated to simulate Blue Hill, NE Fallow
Date
4/1/12 5/1/12 6/1/12 7/1/12 8/1/12 9/1/12 10/1/12 11/1/12
Volu
met
ric W
ater
(%)
5
10
15
20
25
301st foot2nd foot3rd foot4th foot5th foot6th foot
Akron, CO
Bladen, NE
Crop Water Use 6 April - 20 June 2012
Rainfall RegimeAkron CO Bladen NE
Wat
er U
se (i
n)
0
2
4
6
8
10
12FallowFlaxOatsPeasRapeseedMixture
39
The FAME microbiological activity analysis found no effect of irrigation treatment, but lower concentration of total FAME in fallow. The cover crop mixture did not have greater concentration of total FAME than single-species cover crop plantings. Based on previously reported relationships between soil water at planting and wheat yield for this region, the likely difference we would expect in 2013 wheat yield between wheat grown on fallow and wheat following the cover crop mixture due to starting soil water differences would only be about 3.5 bu/a for the Akron precipitation regime, but 10 bu/a for the Bladen precipitation regime. However, we will need to wait and see if there are some enhanced microbiological effects due to the presence of the cover crop that would mitigate the detrimental effects of the cover crop’s water use and lower available water at wheat planting. FUTURE PLANS: The second phase of the experiment (effects of cover crop on subsequent winter wheat) will be concluded in the summer of 2013. The first phase (cover crop planting and evaluation) will be repeated in a new area at each location with planting occurring in the spring of 2013. Following the harvest of the second wheat crop in the summer of 2014 the results will be submitted for publication.
40
CANOLA ROTATION STUDY
M.F. Vigil, and D.J. Poss
PROBLEM: Canola studies have been conducted at the Central Great Plains Research Station for many years. Recently we have conducted an oilseed variety trial and have planted canola on some bulk fields. We have used a couple different drills and planted into different types of residue and have noticed some studies/fields of canola have significantly better yields and stands than others. We haven’t been able to positively identify why these differences exist. These questions in addition to some acceptable wheat yields following canola on bulk fields got us interested in establishing a new study. With this study we’re evaluating the effect different crops preceding canola have on stand establishment and yield and the effect canola has on wheat following canola verses wheat following fallow. APPROACH: A study established as a four year rotation (Wheat-Sorghum-Millet-Fallow) which compared yields under stripper headed residue vs. conventionally harvested residue was converted to rotations which contained canola. The two rotations are: Wheat-Corn-Millet-Canola and Wheat-Canola-Corn-Fallow. Since this study followed an existing study every effort was made to match the new rotations with the old with regard to cropping history and to have the harvest treatment from the previous study be distributed evenly across each of the new rotations. Our primary focus of this study are yields, however measurements such as soil water and soil N at planting and harvest are also being taken. We will also measure the total N of the grain samples and the oil content of the canola. RESULTS: 2012 was the driest year recorded of the 105 years of data at the Central Great Plains Research Station. This caused all yields to be very low or zero in the case of canola (Table 1). Canola was planted as planned and emergence was good in all plots. The soil water at the time of planting canola was low at less than 7% for any depth for both rotations. The soil water at canola planting in the Wheat-Canola-Corn-Fallow(WCaCF) rotation was higher than the Wheat-Corn-Millet-Canola (WCMCa) rotation with average water contents in the top four feet of 4.7% and 3.5%, respectively. The wettest depth was the 12 to 24 inch depth. The differences in the soil water level and planting along with higher residue levels resulted in more growth and longer survival of the canola in the WCaCF rotation compared to the WCMCa rotation. Seed pods were set and seed was produced, however the seed was so small and light that it all blew out the back of the combine. Wheat yields were significantly higher in the rotation where wheat followed fallow compared to the rotation where wheat followed Canola. The above average precipitation received in 2011, especially during the months of May and July, allowed more water to be available to the 2011-12 wheat crop that had a longer fallow period that included the May and July 2011. Corn yields were very low at 13.2 bu/ac. The corn in the WCaCF rotation, which follows Canola in 2011, had lower yields than that which followed wheat in the WCMCa rotation. This was due to the slightly shorter fallow phase following canola compared to wheat. This was exaggerated this year since the precipitation amounts in during the first two weeks of July 2011 were significantly above average receiving 4.00 inches during that period. Since the wheat was
41
at maturity at this time, the water in that rotation would be saved until the next crop (corn) assuming good weed control; however with the canola maturing later than wheat it depleted the soil of some of this stored soil water before maturing. Millet yields were very low with an average of less than 5 bu/ac.
Table 1. Grain Yields from Canola Rotation Study in 2012. Crop Rotation Wheat Corn Canola Millet -------------------- bu/ac -------------------- WCaCF 32.5 9.1 0 NA WCMCa 21.6 17.2 0 4.7
FUTURE PLANS: We plan to continue this study examining how canola can fit into our systems.
42
SOIL REMEDIATION USING BEEF MANURE AND VARIOUS TILLAGE TECHNIQUES
M.F. Vigil, D.J. Poss, M.M. Mikha, and J.G. Benjamin
PROBLEM: Driving across the Great Plains one can see hilltops and side-slopes that are light in color. These are signs these soils have been eroded by wind and/or water. Corn, proso millet, and sorghum will typically show zinc and iron deficiency symptoms when planted in these eroded soils. APPROACH: An on farm study site was selected that showed signed of erosion. Proso millet planted on the field in 2005 showed obvious signs of micronutrient deficiencies. A rotation was established using crops that are commonly grown in our region. We also preferred not to have a fallow period so that manure could be applied every year. The rotation currently used is Corn (2006) – Proso Millet (2007) – Forage Winter Triticale (2008) – Winter Wheat (2009) – Proso Millet (2010)—Corn (2011)—Fallow (2012). These crops are planted on all of the plots and alleys except for the eight grass and grass/legume plots. For the grass and grass/legume plots forage sorghum was planted in June 2007 as a cover crop. The grass and grass/legume seed was planted in November 2007. Manure is applied in the fall to allow for winter precipitation to restore moisture lost during tillage operations. The two manure treatments consist of a low and a high rate. The low rate was determined by estimating the amount of nitrogen required to meet crop needs average over the next six years which was determined to be approximately 30 lb/ac. Based on past studies, we assumed that 25% of the organic nitrogen would be available to the crop the first year. The high rate is simply three times the low rate. The high rate, we hope, is excessive enough to significantly increase soil organic matter content and change soil textural properties within the next six year cycle of the experiment. Chemical N fertilizer rates are 30 and 60 lb/ac. The chemical N fertilizer treatments are broadcast (as urea) on the surface annually to the un-manured lots including the deep tillage plots, just prior to planting. Nitrogen fertilizer rates are 30 and 60 lb/ac for the low and high rates, respectively. Nitrogen fertilizer is applied annually to all plots including the deep tillage plots. Nitrogen fertilizer is applied as urea immediately prior to planting in contrast to the manure which is always applied in the fall even if the next crop is planted in the spring.
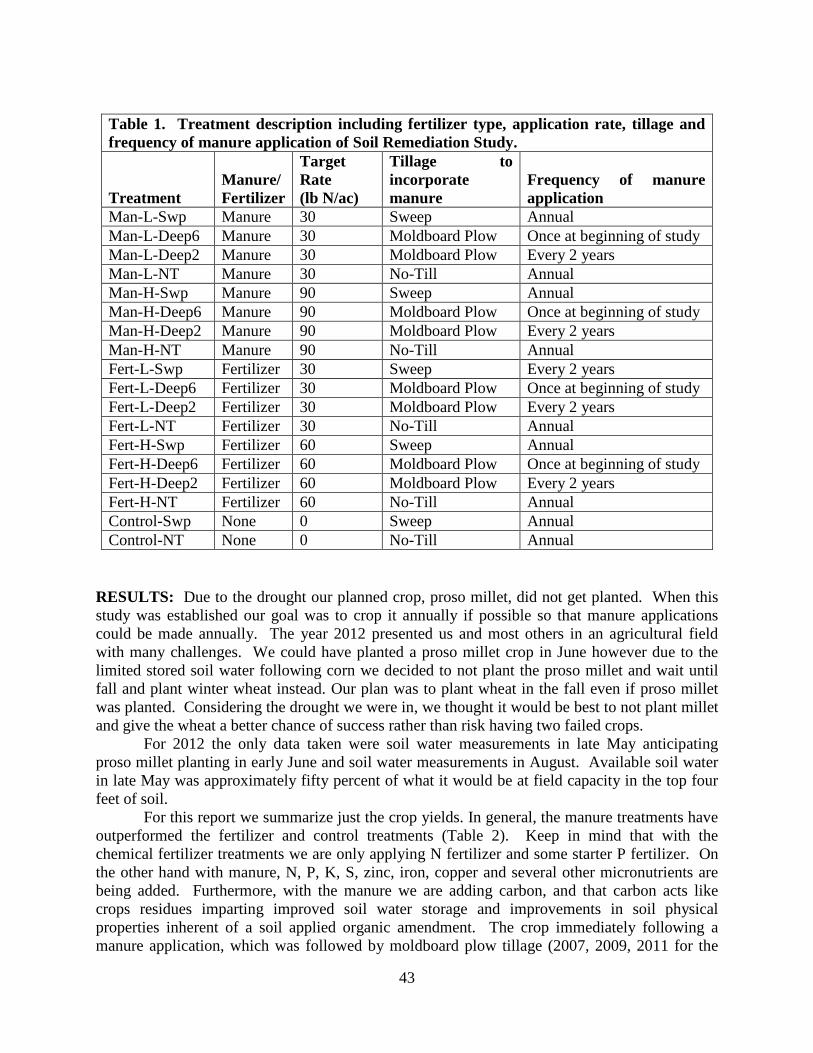
43
Table 1. Treatment description including fertilizer type, application rate, tillage and frequency of manure application of Soil Remediation Study.
Treatment Manure/ Fertilizer
Target Rate (lb N/ac)
Tillage to incorporate manure
Frequency of manure application
Man-L-Swp Manure 30 Sweep Annual Man-L-Deep6 Manure 30 Moldboard Plow Once at beginning of study Man-L-Deep2 Manure 30 Moldboard Plow Every 2 years Man-L-NT Manure 30 No-Till Annual Man-H-Swp Manure 90 Sweep Annual Man-H-Deep6 Manure 90 Moldboard Plow Once at beginning of study Man-H-Deep2 Manure 90 Moldboard Plow Every 2 years Man-H-NT Manure 90 No-Till Annual Fert-L-Swp Fertilizer 30 Sweep Every 2 years Fert-L-Deep6 Fertilizer 30 Moldboard Plow Once at beginning of study Fert-L-Deep2 Fertilizer 30 Moldboard Plow Every 2 years Fert-L-NT Fertilizer 30 No-Till Annual Fert-H-Swp Fertilizer 60 Sweep Annual Fert-H-Deep6 Fertilizer 60 Moldboard Plow Once at beginning of study Fert-H-Deep2 Fertilizer 60 Moldboard Plow Every 2 years Fert-H-NT Fertilizer 60 No-Till Annual Control-Swp None 0 Sweep Annual Control-NT None 0 No-Till Annual
RESULTS: Due to the drought our planned crop, proso millet, did not get planted. When this study was established our goal was to crop it annually if possible so that manure applications could be made annually. The year 2012 presented us and most others in an agricultural field with many challenges. We could have planted a proso millet crop in June however due to the limited stored soil water following corn we decided to not plant the proso millet and wait until fall and plant winter wheat instead. Our plan was to plant wheat in the fall even if proso millet was planted. Considering the drought we were in, we thought it would be best to not plant millet and give the wheat a better chance of success rather than risk having two failed crops.
For 2012 the only data taken were soil water measurements in late May anticipating proso millet planting in early June and soil water measurements in August. Available soil water in late May was approximately fifty percent of what it would be at field capacity in the top four feet of soil.
For this report we summarize just the crop yields. In general, the manure treatments have outperformed the fertilizer and control treatments (Table 2). Keep in mind that with the chemical fertilizer treatments we are only applying N fertilizer and some starter P fertilizer. On the other hand with manure, N, P, K, S, zinc, iron, copper and several other micronutrients are being added. Furthermore, with the manure we are adding carbon, and that carbon acts like crops residues imparting improved soil water storage and improvements in soil physical properties inherent of a soil applied organic amendment. The crop immediately following a manure application, which was followed by moldboard plow tillage (2007, 2009, 2011 for the

44
Dp2 tillage treatment), has had lower yields due to poor seedbed resulting in poor stand establishment. The corn yields in 2011 ranged from 403 lb/ac for to 4,141 lb/ac. The no-till and sweep plots with manure applied had significantly higher yields than most of the other treatments. The high rate of manure applied to the no-till and sweep tilled plot yields were 3,953 lb/ac compared to 2,421 lb/ac for the high fertilizer plots with the same treatment. This is a 63% increase in yield compared to the common practice in the area. The two years we’ve
Table 2. Dry Grain Yield from Soil Remediation Study from 2007 through 2011.
Treatment 2007 (Proso)
2008 (Triticale)
2009 (Wheat)
2010 (Proso)
2011 (Corn)
2012 (Fallow) Average
-------------------------------------- lb/ac -------------------------------------- Man-L-Swp 1340 bcd* Forage 2680 a 2070 a 2840 cd NA 2230 abc Man-L-NT 1700 ab Only 2490 ab 1790 ab 3140 bcd NA 2280 abc Man-L-Dp6 1410 bcd 680 FE 1820 ab 2270 cde NA 1550 cd Man-L-Dp2 1450 bcd 1680 dc 1790 ab 400 g NA 1330 d Man-H-Swp 1640 ab No 1730 bcd 1870 ab 4140 a NA 2350 abc Man-H-NT 1980 ab Grain 2150 abcd 1850 ab 3760 ab NA 2440 abc Man-H-Dp6 1000 cd 1050 ef 1840 ab 3000 bcd NA 1720 bcd Man-H-Dp2 1300 bcd 1450 de 1720 ab 450 g NA 1230 d Fert-L-Swp 1320 bcd 2330 abcd 1480 ab 2360 cde NA 1870 abcd Fert-L-NT 1140 bcd 1670 cd 1740 ab 2540 cde NA 1770 abcd Fert-L-Dp6 1430 bcd 1590 cd 1680 ab 1940 def NA 1660 bcd Fert-L-Dp2 1190 bcd 1890 bcd 1470 ab 1040 fg NA 1400 d Fert-H-Swp 1240 bcd 2380 abcd 1600 ab 2450 cd NA 1920 abcd Fert-H-NT 1180 bcd 1760 bcd 1230 b 2400 cde NA 1640 bcd Fert-H-Dp6 1590 abc 1760 bcd 1730 ab 2550 cde NA 1910 abcd Fert-H-Dp2 1160 bcd 1900 bcd 1270 b 1310 fg NA 1410 d Control-Swp 1300 bcd 2150 abcd 1420 ab 1890 def NA 1690 bcd Control-NT 990 d 1900 bcd 1460 ab 1590 ef NA 1480 d Mean 1350 1848 1657 2226 1771 *Means followed by the same letter are not significantly different using the SNK mean
separation test with alpha = 0.10. had proso millet in the study there was a noticeable difference in plant color. Chlorophyll readings were taken to quantify these observations; however the data hasn’t been analyzed yet. There did appear to be a difference between years in the ranking of the yields. The two years that proso was planted, the treatments that contained manure had higher yields than the year wheat was planted. This is probably due to the proso being more susceptible to micronutrient deficiencies such as iron.
We were interested in the affect tillage had on yields so we analyzed the data by tillage averaging across all other treatments (Table 3). The yields in 2009 and 2011 were statistically different. These were also the years immediately following manure application and deep plowing of the Deep2yr treatment. The yield differences in 2009 were at least partially due to poor stand establishment in these plots. In 2011 the stands were excellent in these plots
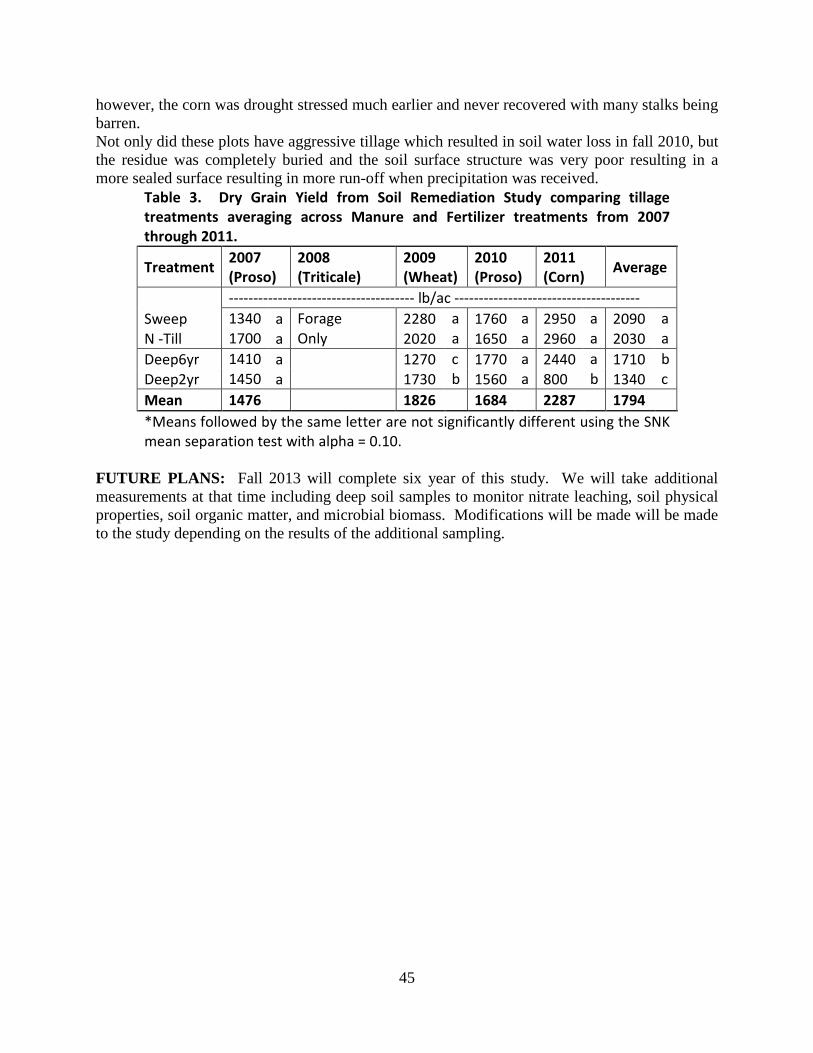
45
however, the corn was drought stressed much earlier and never recovered with many stalks being barren. Not only did these plots have aggressive tillage which resulted in soil water loss in fall 2010, but the residue was completely buried and the soil surface structure was very poor resulting in a more sealed surface resulting in more run-off when precipitation was received.
Table 3. Dry Grain Yield from Soil Remediation Study comparing tillage treatments averaging across Manure and Fertilizer treatments from 2007 through 2011.
Treatment 2007 (Proso)
2008 (Triticale)
2009 (Wheat)
2010 (Proso)
2011 (Corn) Average
-------------------------------------- lb/ac -------------------------------------- Sweep 1340 a Forage 2280 a 1760 a 2950 a 2090 a N -Till 1700 a Only 2020 a 1650 a 2960 a 2030 a Deep6yr 1410 a 1270 c 1770 a 2440 a 1710 b Deep2yr 1450 a 1730 b 1560 a 800 b 1340 c Mean 1476 1826 1684 2287 1794 *Means followed by the same letter are not significantly different using the SNK mean separation test with alpha = 0.10.
FUTURE PLANS: Fall 2013 will complete six year of this study. We will take additional measurements at that time including deep soil samples to monitor nitrate leaching, soil physical properties, soil organic matter, and microbial biomass. Modifications will be made will be made to the study depending on the results of the additional sampling.
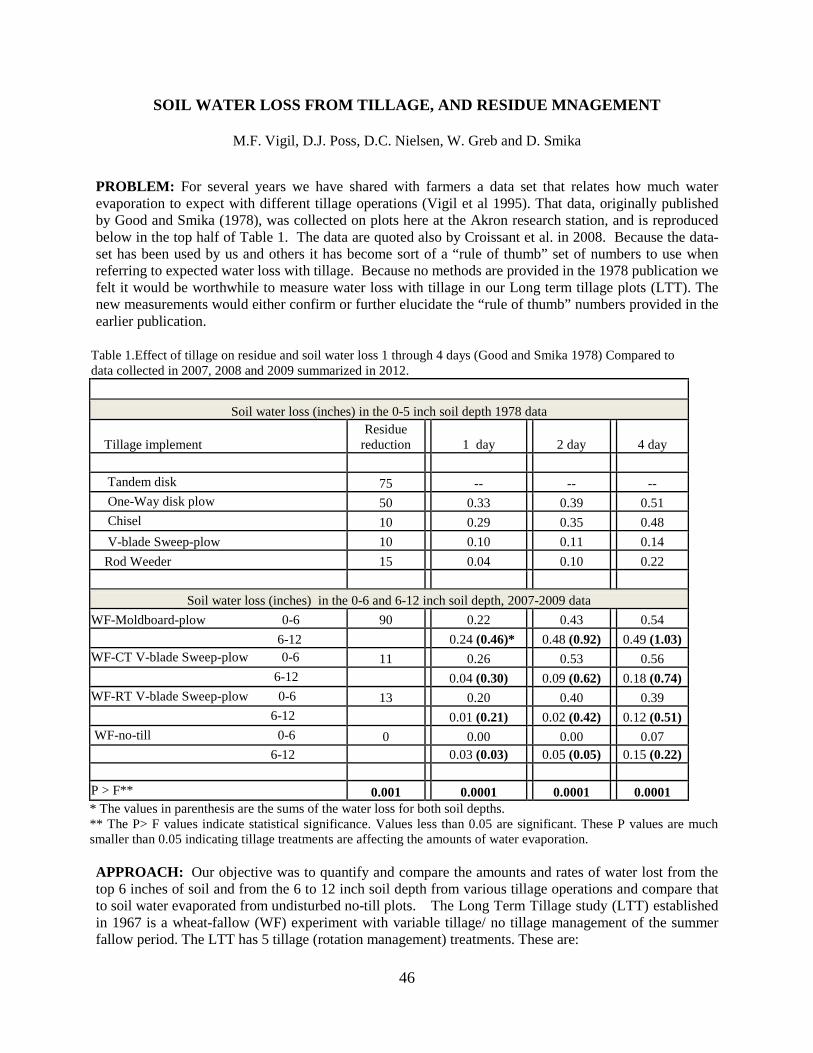
46
SOIL WATER LOSS FROM TILLAGE, AND RESIDUE MNAGEMENT
M.F. Vigil, D.J. Poss, D.C. Nielsen, W. Greb and D. Smika
PROBLEM: For several years we have shared with farmers a data set that relates how much water evaporation to expect with different tillage operations (Vigil et al 1995). That data, originally published by Good and Smika (1978), was collected on plots here at the Akron research station, and is reproduced below in the top half of Table 1. The data are quoted also by Croissant et al. in 2008. Because the data-set has been used by us and others it has become sort of a “rule of thumb” set of numbers to use when referring to expected water loss with tillage. Because no methods are provided in the 1978 publication we felt it would be worthwhile to measure water loss with tillage in our Long term tillage plots (LTT). The new measurements would either confirm or further elucidate the “rule of thumb” numbers provided in the earlier publication.
Table 1.Effect of tillage on residue and soil water loss 1 through 4 days (Good and Smika 1978) Compared to data collected in 2007, 2008 and 2009 summarized in 2012.
Soil water loss (inches) in the 0-5 inch soil depth 1978 data
Tillage implement Residue
reduction 1 day 2 day 4 day Tandem disk 75 -- -- -- One-Way disk plow 50 0.33 0.39 0.51 Chisel 10 0.29 0.35 0.48 V-blade Sweep-plow 10 0.10 0.11 0.14 Rod Weeder 15 0.04 0.10 0.22
Soil water loss (inches) in the 0-6 and 6-12 inch soil depth, 2007-2009 data WF-Moldboard-plow 0-6 90 0.22 0.43 0.54 6-12 0.24 (0.46)* 0.48 (0.92) 0.49 (1.03) WF-CT V-blade Sweep-plow 0-6 11 0.26 0.53 0.56 6-12 0.04 (0.30) 0.09 (0.62) 0.18 (0.74) WF-RT V-blade Sweep-plow 0-6 13 0.20 0.40 0.39 6-12 0.01 (0.21) 0.02 (0.42) 0.12 (0.51) WF-no-till 0-6 0 0.00 0.00 0.07 6-12 0.03 (0.03) 0.05 (0.05) 0.15 (0.22) P > F** 0.001 0.0001 0.0001 0.0001 * The values in parenthesis are the sums of the water loss for both soil depths. ** The P> F values indicate statistical significance. Values less than 0.05 are significant. These P values are much smaller than 0.05 indicating tillage treatments are affecting the amounts of water evaporation. APPROACH: Our objective was to quantify and compare the amounts and rates of water lost from the top 6 inches of soil and from the 6 to 12 inch soil depth from various tillage operations and compare that to soil water evaporated from undisturbed no-till plots. The Long Term Tillage study (LTT) established in 1967 is a wheat-fallow (WF) experiment with variable tillage/ no tillage management of the summer fallow period. The LTT has 5 tillage (rotation management) treatments. These are:
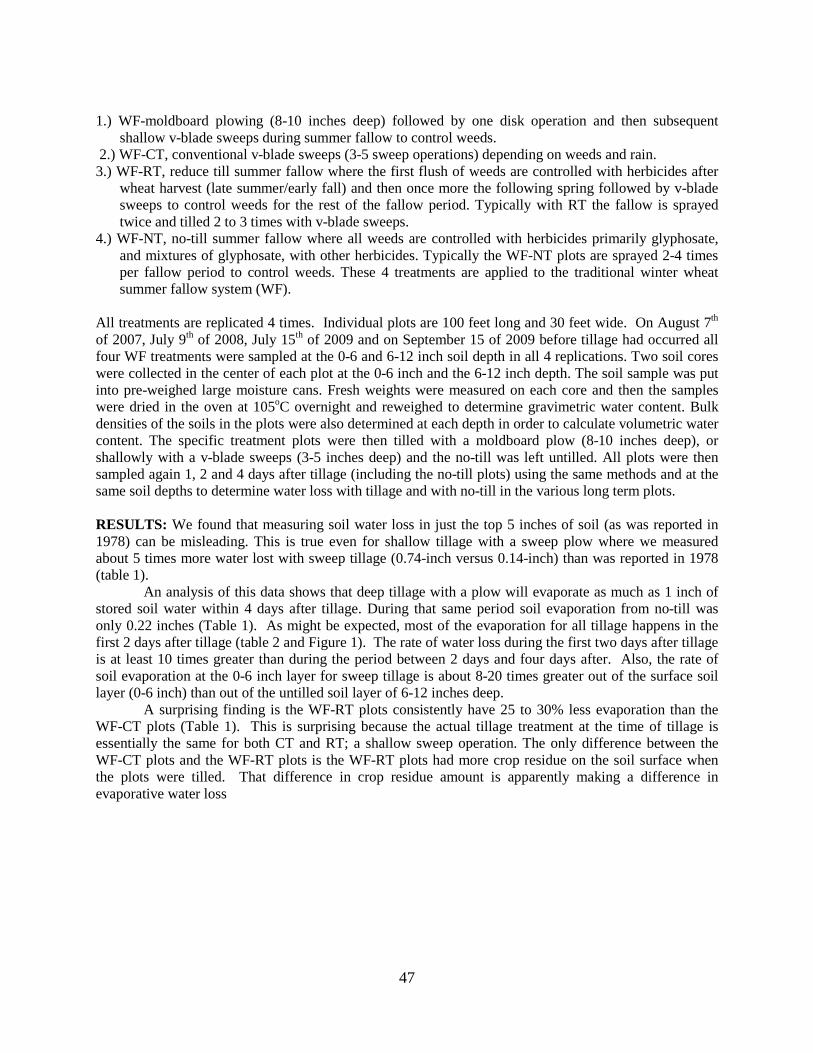
47
1.) WF-moldboard plowing (8-10 inches deep) followed by one disk operation and then subsequent
shallow v-blade sweeps during summer fallow to control weeds. 2.) WF-CT, conventional v-blade sweeps (3-5 sweep operations) depending on weeds and rain. 3.) WF-RT, reduce till summer fallow where the first flush of weeds are controlled with herbicides after
wheat harvest (late summer/early fall) and then once more the following spring followed by v-blade sweeps to control weeds for the rest of the fallow period. Typically with RT the fallow is sprayed twice and tilled 2 to 3 times with v-blade sweeps.
4.) WF-NT, no-till summer fallow where all weeds are controlled with herbicides primarily glyphosate, and mixtures of glyphosate, with other herbicides. Typically the WF-NT plots are sprayed 2-4 times per fallow period to control weeds. These 4 treatments are applied to the traditional winter wheat summer fallow system (WF).
All treatments are replicated 4 times. Individual plots are 100 feet long and 30 feet wide. On August 7th of 2007, July 9th of 2008, July 15th of 2009 and on September 15 of 2009 before tillage had occurred all four WF treatments were sampled at the 0-6 and 6-12 inch soil depth in all 4 replications. Two soil cores were collected in the center of each plot at the 0-6 inch and the 6-12 inch depth. The soil sample was put into pre-weighed large moisture cans. Fresh weights were measured on each core and then the samples were dried in the oven at 105oC overnight and reweighed to determine gravimetric water content. Bulk densities of the soils in the plots were also determined at each depth in order to calculate volumetric water content. The specific treatment plots were then tilled with a moldboard plow (8-10 inches deep), or shallowly with a v-blade sweeps (3-5 inches deep) and the no-till was left untilled. All plots were then sampled again 1, 2 and 4 days after tillage (including the no-till plots) using the same methods and at the same soil depths to determine water loss with tillage and with no-till in the various long term plots. RESULTS: We found that measuring soil water loss in just the top 5 inches of soil (as was reported in 1978) can be misleading. This is true even for shallow tillage with a sweep plow where we measured about 5 times more water lost with sweep tillage (0.74-inch versus 0.14-inch) than was reported in 1978 (table 1). An analysis of this data shows that deep tillage with a plow will evaporate as much as 1 inch of stored soil water within 4 days after tillage. During that same period soil evaporation from no-till was only 0.22 inches (Table 1). As might be expected, most of the evaporation for all tillage happens in the first 2 days after tillage (table 2 and Figure 1). The rate of water loss during the first two days after tillage is at least 10 times greater than during the period between 2 days and four days after. Also, the rate of soil evaporation at the 0-6 inch layer for sweep tillage is about 8-20 times greater out of the surface soil layer (0-6 inch) than out of the untilled soil layer of 6-12 inches deep. A surprising finding is the WF-RT plots consistently have 25 to 30% less evaporation than the WF-CT plots (Table 1). This is surprising because the actual tillage treatment at the time of tillage is essentially the same for both CT and RT; a shallow sweep operation. The only difference between the WF-CT plots and the WF-RT plots is the WF-RT plots had more crop residue on the soil surface when the plots were tilled. That difference in crop residue amount is apparently making a difference in evaporative water loss
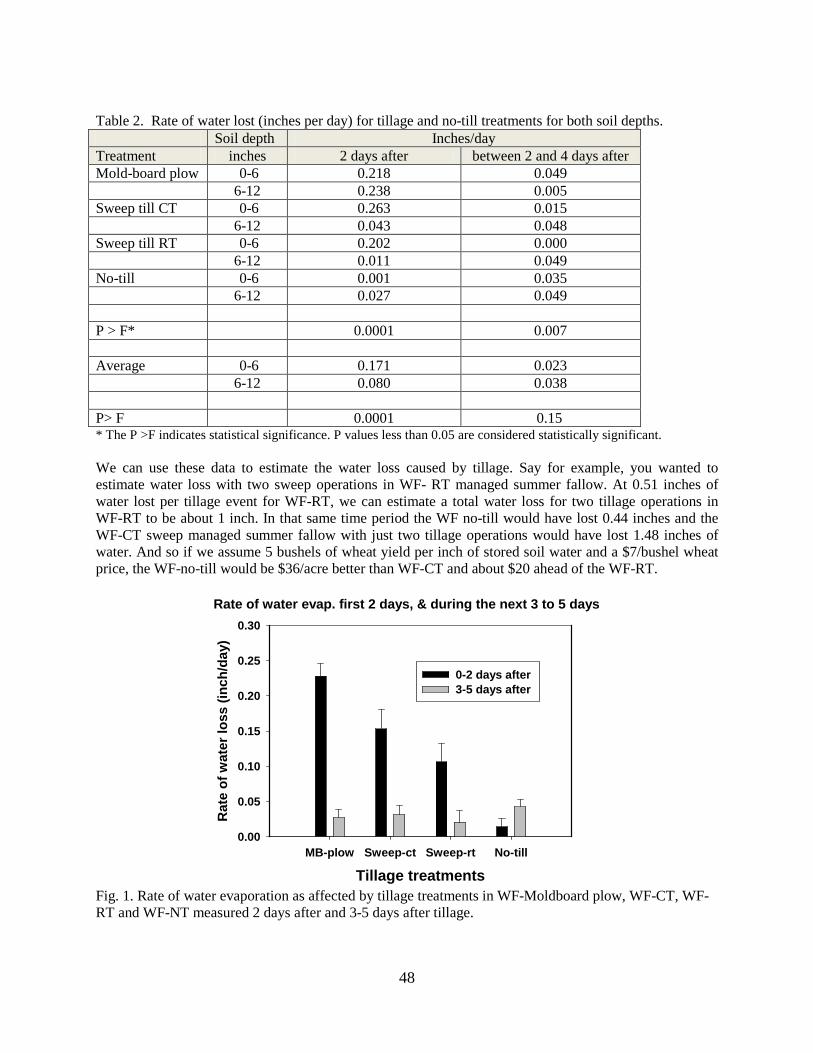
48
Table 2. Rate of water lost (inches per day) for tillage and no-till treatments for both soil depths. Soil depth Inches/day Treatment inches 2 days after between 2 and 4 days after Mold-board plow 0-6 0.218 0.049 6-12 0.238 0.005 Sweep till CT 0-6 0.263 0.015 6-12 0.043 0.048 Sweep till RT 0-6 0.202 0.000 6-12 0.011 0.049 No-till 0-6 0.001 0.035 6-12 0.027 0.049 P > F* 0.0001 0.007 Average 0-6 0.171 0.023 6-12 0.080 0.038 P> F 0.0001 0.15 * The P >F indicates statistical significance. P values less than 0.05 are considered statistically significant. We can use these data to estimate the water loss caused by tillage. Say for example, you wanted to estimate water loss with two sweep operations in WF- RT managed summer fallow. At 0.51 inches of water lost per tillage event for WF-RT, we can estimate a total water loss for two tillage operations in WF-RT to be about 1 inch. In that same time period the WF no-till would have lost 0.44 inches and the WF-CT sweep managed summer fallow with just two tillage operations would have lost 1.48 inches of water. And so if we assume 5 bushels of wheat yield per inch of stored soil water and a $7/bushel wheat price, the WF-no-till would be $36/acre better than WF-CT and about $20 ahead of the WF-RT.
Rate of water evap. first 2 days, & during the next 3 to 5 days
Tillage treatmentsMB-plow Sweep-ct Sweep-rt No-till
Rat
e of
wat
er lo
ss (i
nch/
day)
0.00
0.05
0.10
0.15
0.20
0.25
0.30
0-2 days after 3-5 days after
Fig. 1. Rate of water evaporation as affected by tillage treatments in WF-Moldboard plow, WF-CT, WF-RT and WF-NT measured 2 days after and 3-5 days after tillage.
49
References Good, L.G., and D.E. Smika. 1978. Chemical Fallow for Soil and Water Conservation in the Great Plains. Journal of Soil and Water Conservation 33:2 p89-90. Croissant, R.L., G.A. Peterson and D.G. Westfall. 2008. Dryland Cropping Systems. Colorado State University Cooperative Extension Fact Sheet No. 0.516. Vigil, M.F. D.C. Nielsen R.L. Anderson and R Bowman. 1995. Taking Advantage of the Benefits of No-till. Conservation Tillage Fact Sheet #4-95. Published by USDA-ARS and USDA-NRCS.
50
EXPECTATION FOR DROUGHT IN THE CENTRAL GREAT PLAINS
M.F. Vigil, F.J. Calderón and D.J. Poss
PROBLEM: In 2012, we experienced the driest year for precipitation received in 105 years of weather recorded at the research station. We measured only 8.7 inches of precipitation received for 2012. We normally get 16.45 inches (105 year average). This year was also warmer than normal. At the station we recorded 27 days over 100 0F in 2012. That broke the record set in 1936 of 24 days over 100. This June was the warmest June on record. This past June we had the earliest recorded wheat harvest in the last 30 years. With all the talk about global climate change one might ask if this is going to be the new normal for our region. Our weather record of 105 years, is valuable, but limited when considering prediction of a weather trend. That said there are others who have used tree ring data to try to retro-project droughts that have occurred from 1552 through 1995 for the Central Great Plains region (CGPR). Their findings are interesting and useful for putting a perspective on the expectation of drought in our region. APPROACH: This report will include some of our own weather data collected over the years, a review of a publication by Woodhouse and Brown (2001) and a discussion of a regional weather summer presented by Nebraska climatologist Steve Hu in 1994. Woodhouse and Brown reported on a retro-projection of drought occurrence in the Central Great Plains region (CGPR) from 1552 through 1995. They used tree rings from living trees and from tree stumps from multiple sites in the CGPR to assess historical droughts in the region. Obviously the trees sampled were alive during the early period of the 1500’s. The thickness of the seasonal growth rings made by the trees each year, were used as a proxy for the weather seen that year. Steve Hu (University of Nebraska climatologist) reported that the weather in Nebraska follows a persistent recurring 16-20 year cycle. He used several statistical techniques to manipulate and then summarize 110 years of weather data from several weather stations in Nebraska. RESULTS: In Steve Hu’s analysis they reported that the weather in Western Nebraska follows a 16-20 year cycle. Half of the cycle, 8-10 years would include 4-5 years that were wetter than average. The other half of the 16-20 year cycle (again 8-10 years long) would include 4-5 years, perhaps the middle 4-5 years which would tend to be drier than average. The predicted extremes were oscillating between wet and dry by about 1 inch in either direction. That is during the wet cycle the wet years could be on average 1 inch wetter than average and the dry years could be as much as 1 inch drier than normal. Steve did a lot of statistical smoothing to develop the pattern and so the extremes are also smoothed out. In other words the 1 inch peak and valley predicted on either side of the average is very conservative and the actual extremes could be as great as perhaps 10 times that value. In our own weather data set at Akron we have found that the extremes are about 10 inches more than the average for the maximum precipitation and about half the average for the minimum. The wettest year on record was 1946 where we received 26.8 inches of precipitation. The minimum precipitation of 8.7 received this past year is about half of the long term average of 16.45 inches. The usefulness of Hu’s analysis is that it suggests from the Nebraska data that the normal pattern is an oscillation between wet and dry periods that are about 4-5 years in duration and that occur once in a 16 to 20 year period. One wet period and one drought period.
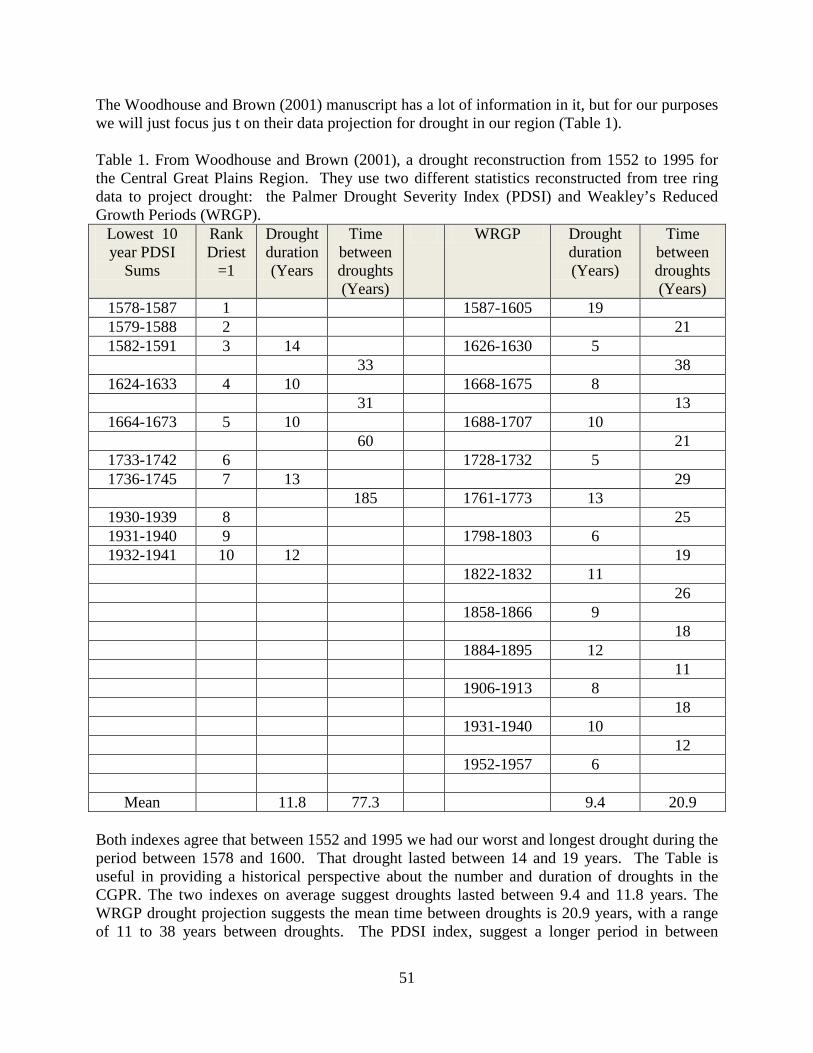
51
The Woodhouse and Brown (2001) manuscript has a lot of information in it, but for our purposes we will just focus jus t on their data projection for drought in our region (Table 1). Table 1. From Woodhouse and Brown (2001), a drought reconstruction from 1552 to 1995 for the Central Great Plains Region. They use two different statistics reconstructed from tree ring data to project drought: the Palmer Drought Severity Index (PDSI) and Weakley’s Reduced Growth Periods (WRGP).
Lowest 10 year PDSI
Sums
Rank Driest
=1
Drought duration (Years
Time between droughts (Years)
WRGP Drought duration (Years)
Time between droughts (Years)
1578-1587 1 1587-1605 19 1579-1588 2 21 1582-1591 3 14 1626-1630 5
33 38 1624-1633 4 10 1668-1675 8
31 13 1664-1673 5 10 1688-1707 10
60 21 1733-1742 6 1728-1732 5 1736-1745 7 13 29
185 1761-1773 13 1930-1939 8 25 1931-1940 9 1798-1803 6 1932-1941 10 12 19
1822-1832 11 26 1858-1866 9 18 1884-1895 12 11 1906-1913 8 18 1931-1940 10 12 1952-1957 6
Mean 11.8 77.3 9.4 20.9 Both indexes agree that between 1552 and 1995 we had our worst and longest drought during the period between 1578 and 1600. That drought lasted between 14 and 19 years. The Table is useful in providing a historical perspective about the number and duration of droughts in the CGPR. The two indexes on average suggest droughts lasted between 9.4 and 11.8 years. The WRGP drought projection suggests the mean time between droughts is 20.9 years, with a range of 11 to 38 years between droughts. The PDSI index, suggest a longer period in between
52
droughts. The important take home message is that both indexes project drought as a recurring theme in our part of the prairie and should be expected at least every 20 to 30 years. Also drought could reoccur in as short of a period as 11 years. The WRGP index somewhat agrees with Steve Hu’s report of a recurring cycle of drought. From our Akron weather data set we plotted the average temperature from 1908 to 2010 as a running average and as a decade average (Fig 1.) A simple linear regression was fit to the decade average temperature data as a function of time (years). The equation was statistically significant but has an R2 value of only 0.48. In other words, only 48% of the variability in the temperature is explained by the fitted equation. The equation suggests a 0.02 degree rise in temperature each year. That would suggest that temperatures are going up but very slowly.
Decade and Running Average from 1912 - 2010 at Akron
Year
1910 1920 1930 1940 1950 1960 1970 1980 1990 2000 2010 2020
Tem
pera
ture
deg
F
46.5
47.0
47.5
48.0
48.5
49.0
49.5
50.0
50.5
Year vs Decade Average Year vs Running Average Year vs Predicted Decade Average
Slope =0.020527; R2 = 0.48
Fig. 1. The average air temperature at the USDA-ARS weather Station from 1908-2010. Data plotted are the decade average temperatures and a running average temperature plotted at the end of each decade. The red line is a fitted line between time in the last year in each decade and that decade’s average temperature. FUTURE PLANS: We will continue to collect weather data here at the weather station and evaluate the literature for drought projection and drought expectation. References Woodhouse C.A., and P.M. Brown 2001. Tree-ring evidence for Great Plains drought. Tree-Ring Research vol 57 (1) pp 89-103. Steve Hu’s (personal communication at a TDTW meeting in 1994 with Steve Hu and Drew Lyon).
53
2012 HISTORICAL REPORT Events - The annual Customer Focus Meeting was held on 4 January 2012 - The annual Field Day was held on 19 June 2012 with attendance of approximately 85
Visitors to station - Dr. Zizhong Li and Dr. Kelim Hu, China Agricultural University, 12 January 2012 - U.S. Senator Michael Bennett, US Senator, 6 August 2012
-Natalie Farr, aide to US Congressman Cory Gardner, 8 August 2012 -Colorado Governor John Hickenlooper, 21 September 2012
Changes to buildings and ground
- Water line, electrical power, main breaker panel and data wire installed in Building #23 (headhouse for new greenhouse)
- Retrofit one-third of Building #1 (Main Office) from T12 fluorescent lights to T8 fluorescent lights
- Back (north) parking lot for Building 1 (main office and laboratory) redone (removal of asphalt, pouring of concrete)
New instrumentation and equipment - TIG welder for shop - In-house fabricated large scale dump box for Carter forage harvester - Carbon Dioxide Isotope Analyzer (Los Gatos Research)
Funding changes
- Dr. Vigil was awarded a NIFA Grant received for $400,000 for oilseed evaluations for the Central Great Plains region.
Personnel changes
- Albert Figueroa, Agricultural Research Technician, was let go from federal employment. - ARS summer students in 2012 were Colton Uhrig, Caleb Christenson, Kyle Michaelis,
Brandon Woods, Jaden Dreher, Reed Christenson, Erin Krause, Sidney Merrill, and Gail Hall. CSU summer students were Shelby Guy, Lexi Thompson, and Shelby Dunker.
Honors and awards
- Merle Vigil was name a Fellow of the American Society of Agronomy and David Nielsen was named a Fellow of the Crop Science Society of America at the Annual Meeting of the American Society of Agronomy, Crop Science Society of America, and Soil Science Society of America held 21-25 October 2012, Cincinnati, OH.
- David Nielsen, as member of the Root Zone Water Quality development team, received the CO-LABS Governor’s Award for High Impact Research in the area of Sustainability, awarded 25 October 2012, University of Colorado, Boulder, CO.

54
International Travel and Significant Invitations David Nielsen was invited to present the opening talk (“Principles of Water Capture, Evaporation, and Retention”) at the Semiarid Dryland Cropping Systems Community symposium at the Annual Meeting of the American Society of Agronomy, Crop Science Society of America, and Soil Science Society of America held 21-25 October 2012, Cincinnati, OH. Merle Vigil served as the division chair for the Soil Science Society and presided over the distinguished Walsh Lecture at the Annual Meeting of the American Society of Agronomy, Crop Science Society of America, and Soil Science Society of America held 21-25 October 2012, Cincinnati, OH. Merle Vigil was invited to present a key note address at the Western Alfalfa Seed Growers Association meetings (Canola Production and its potential for use as an on farm fuel); in Las Vegas Nevada held January 2012 .
55
PUBLISHED PUBLICATIONS Acosta-Martinez, V., M.M. Mikha, K.R. Sistani, P.W. Stahlman, J.G. Benjamin, M.F. Vigil, and R. Erickson. 2011.. Multi-Location Study of Soil Enzyme Activities as Affected by Types and Rates of Manure Application and Tillage Practices. Agriculture 1:4-21. Open Access J.: www.mdpi.com/journal/agriculture.
Calderón, F.J., D.J. Schultz, and E. A. Paul. 2012. Carbon Allocation, Below Ground Transfers and Lipid Turnover in a Plant-Microbial Association. Soil Sci. Soc. Amer. J. 76:1614-1623. Collins, H.P., M.M. Mikha, T.T. Brown, J.L. Smith, D. Huggins, U.M. Sainju 2012. Agricultural Management and Soil Carbon Dynamics: Western U.S. Croplands. P. 59-77. In M. Liebig et al. (ed.) Managing Agricultural Greenhouse Gases. 1st edition. Elsevier, San Diego, CA, USA.
Hurisso, T.T., J.G. Davis, J.E. Brummer, M.E. Stromberger, M.M. Mikha, M.L Haddix, M.R. Booher, E.A. Paul. 2012. Rapid changes in microbial biomass and aggregate size distribution in response to changes in organic matter management in grass pasture. Geoderma 193-194:68-75. Davinic M., Fultz L.M., Acosta-Martinez V., Calderon F.J., Cox S.R., Dowd S.E., Allen V., and Moore-Kucera. J. 2012. Pyrosequencing and mid-infrared spectroscopy reveal distinct aggregate stratification of soil bacterial communities and organic matter composition: Coupling Pyrosequencing and Mid-Infrared Spectroscopy Techniques. Soil Biol. Biochem. 46: 63-72. Calderón F.J., M.F. Vigil, D.C. Nielsen, J.G. Benjamin, and D.J. Poss. 2012. Water Use and Yields of no-till Managed Dryland Grasspea and Yellow Pea under Different Planting Configurations. Field Crops Research. 125: 179-185. Gardner T., V. Acosta Martinez, F.J. Calderón, T.M. Zobeck, M. Baddock, R.S. Van Pelt, Z. Senwo, S. Dowd, and S.Cox. 2012. Pyrosequencing Reveal Bacteria Carried in Different Wind Eroded Sediments. Journal of Environmental Quality. 41(3):744-53. Ko, Jonghan, L.R. Ahuja, S.A. Anapalli, T.R. Green, L. Ma, and D.C. Nielsen, and C.L. Walthall. 2012. Climate change impacts on dryland cropping systems in the central Great Plains, USA. Climate Change 111:445-472. (doi:10.1007/s10584-011-0175-9) Lal, R., J.A. Delgado, J. Gulliford, D. Nielsen, C.W. Rice, and R.S. Van Pelt. 2012. Adapting agriculture to drought and extreme events. J. Soil Water Conserv. 67:162A-167A. (doi:10.2489/jswc.67.6.162A) Ma, L., T.J. Trout, L.R. Ahuja, W.C. Bausch, S.A. Saseendran, R.W. Malone, and D.C. Nielsen. 2011. Calibrating RZWQM2 model for maize responses to deficit irrigation agricultural water management. Agric. Water Manage 103:140-149. (doi:10.1016/j.agwat.2011.11.005)
56
Mikha, M.M., P.W. Stahlman, J.G. Benjamin, and P.W. Geier. 2012. Management Practices Influence Productivity of Degraded or Eroded Soils. p. 26-28. In Kansas Fertilizer Research. http://www.ksre.ksu.edu/library/crpsl2/SRP1066.pdf. Mikha, M.M., and A. J. Schlegel 2012. Organic Amendment and Residue Removal Rates Influence Soil Productivity. p. 29-30. In Kansas Fertilizer Research. http://www.ksre.ksu.edu/library/crpsl2/SRP1066.pdf.
Mikha, M.M., J.G. Benjamin, A.D. Halvorson, and D.C. Nielsen 2012. Comparison of Methods to Evaluate Soil and Crop Management-Induced Soil Carbon Changes. The Great Plains Soil Fertility Conference, March 6-7, Denver, CO, p. 14:258-264. Nielsen, D.C., S.A. Saseendran, L. Ma, and L.R. Ahuja. 2012. Simulating the production potential of dryland spring canola in the central Great Plains. Agron. J. 104:1182-1188. (doi:10.2134/agronj2012.0048) Nielsen, D.C., J.J. Miceli-Garcia, and D.J. Lyon. 2012. Canopy cover and leaf area index relationships for wheat, triticale, and corn. Agron. J. 104:1569-1573. (doi:10.2134/agronj2012.0107n) Saseendran, S.A., D.C. Nielsen, L.R. Ahuja, L. Ma, and D.J. Lyon. 2013 . Simulated yield and profitability of five potential crops for intensifying the dryland wheat-fallow production system. Agric. Water Manage. 116:175-192. (doi:10.1016/j.agwat.2012.07.009)
ACCEPTED FOR PUBLICATION Benjamin, J.G. 2013. Effect of soil attributes on root growth and distribution in some common crops: a synthesis of knowledge and future needs. In CSA Special Publication: Enhancing Understanding and Quantification of Soil-Root Growth Interactions. Blanco-Canqui, H., and J.G. Benjamin. 2013 Impacts of soil organic carbon on soil physical behavior. In CSA Special Publication: Quantifying And Modeling Soil Structure Dynamics.
IN PREPARATION Benjamin, J.G., D.C. Nielsen, M. F. Vigil, M. M. Mikha and F. Calderon. 2013. A comparison of two models to determine soil physical property effects on crop production. Field Crops Research (in preparation) Benjamin, J.G., D.C. Nielsen, M. F. Vigil, M. M. Mikha, and F. Calderon. 2013. A comparison of two models to evaluate soil compaction effects on corn root growth. Agron. J. (submitted)
57
Calderón,F.J., M. L. Haddix, R.T. Conant, K. Magrini-Bair, and E. A. Paul. 2013. Diffuse-Reflectance Fourier-Transform Mid-Infrared Spectroscopy as a Method of Characterizing Changes in Soil Organic Matter. McMaster, G.S., J.C. Ascough II, D.A. Edmunds, D.C. Nielsen, and P.V.V. Prasad. 2013. Simulating crop phenological responses to water stress using the phenology MMS software program. Appl. Eng. Agric. 56:XXX-XXX. (accepted 31 December 2012) Miceli-Garcia, J.J., D.C. Nielsen, and D.J. Lyon. 2013. Calibrating AquaCrop for winter wheat simulations in the central Great Plains. Agron. J. 105:XXX-XXX. (in preparation) Nielsen, D.C., M.F. Vigil, P.F. Byrne, and A.D. Halvorson. 2013. Temperature and precipitation effects on winter wheat yield. Crop Sci. 51:XXX-XXX. (in preparation) Nielsen, D.C., and M.F. Vigil. 2013. Understanding the variable yield response of proso millet to water use. Field Crops Res. 102:XXX-XXX. (in preparation) Nielsen, D.C. 2013. An Excel spreadsheet decision tool for estimating dryland yield probabilities of corn, canola, proso millet, foxtail millet forage, and spring triticale forage grown as summer fallow replacement crops. (in preparation) Parikh S.J., F J. Calderón, K.W. Goyne, and F.N.D. Mukome. 2012. Soil Chemical Insights Provided through Vibrational Spectroscopy. Yu, Q., L. Li, Q. Luo, D. Eamus, E. Wang, D. Nielsen, and S. Xu, C. Chen. 2013. Year patterns of climate impact on wheat yields. International J. Climatol. 30:XXX-XXX. (accepted) Van Pelt, R.S., M.C. Baddock, T.M. Zobeck, A.J. Schlegel, M.F. Vigil, and V. Acosta Martinez. 2012. Field wind tunnel testing of two silt loam soils on the North American Central High Plains. Aeolian Research. (in preparation).


![The great plains[1]](https://img.pdfslide.net/doc/110x75/54b9ed8d4a795905448b470a/the-great-plains1.jpg)