Embed Size (px)
Citation preview
Heading goes here
Sub-heading text goes here
Text page Style 1 body copy goes here.
Central London Rail Termini: Analysing passengers' onward travel patterns
MAYOR OF LONDON Transport for London
Transport for London

2
Central London Rail Termini:
Analysing passengers‟ travel patterns
Policy Analysis Research Report
September 2011
© Transport for London 2011
All rights reserved. Reproduction permitted for research, private study and internal circulation within an
organisation. Extracts may be reproduced provided the source is acknowledged.
Disclaimer
This publication is intended to provide accurate information. However, TfL and the authors accept no liability
or responsibility for any errors or omissions or for any damage or loss arising from use of the information
provided.

3
Central London Rail Termini
4
Contents
Executive Summary 8
Introduction 13
Part One 18
Chapter 1 Who uses the central London termini
Rail passengers in and out of central London
Passengers by age and gender
Why people are travelling
Travel by journey frequency
19
19
21
22
24
Chapter 2 Onward distribution in central London
Distance of onward journeys
Mode share for onward journeys
Onward journeys mode share and distance travelled
The use of bus for onward journeys
The use of Underground for onward journeys
Underground crowding and rail passengers‟ contribution
26
26
28
29
31
31
33
Chapter 3 Have travel patterns changed over time?
Passenger volumes and use of stations
Demographic profile of passengers
Rail journeys by purpose
Mode share for onward journeys
36
37
38
40
41
Chapter 4 How do Londoners’ travel patterns differ from those of non-Londoners?
Overview of travel to or from outside Greater London
Journeys to or from outside Greater London by journey purpose
Journeys to or from outside Greater London by journey frequency
Onward mode used – comparing Londoners and non-Londoners
45
45
47
48
49
Chapter 5 Travel patterns outside central London
Non-central London journeys by purpose
Onward mode at the non-central London end
Onward mode at the non-central London end by distance
Travel at the five busiest non central London rail stations
52
53
54
56
56
Analysing passengers‟ onward travel patterns
5
Chapter 6 Opportunities for walking
Current walk travel to and from central London rail termini
Onward walk journeys by trip distance
Onward walk journeys by purpose
Onward walk journeys by characteristics of trip maker
Whether ever walk for their onward journey
Potentially walkable onward journeys
Who is making potentially walkable onward journeys?
59
60
61
62
63
63
64
67
Chapter 7 Opportunities for cycling
Current cycle travel to and from central London rail termini
Distance of cycle travel
Onward cycle journeys by purpose
Onward cycle journeys by characteristics of trip maker
Type of cycle
Whether ever cycle for their onward journey
Cycling at the non-London end of the journey
Market segmentation of cyclists and non-cyclists
Potentially cyclable journeys
Who is making potentially cyclable journeys?
69
70
71
72
73
73
74
75
76
78
79
Part Two 82
Chapter 8 Cannon Street 83
Chapter 9 Charing Cross 87
Chapter 10 Euston 91
Chapter 11 Fenchurch Street 95
Chapter 12 King’s Cross 99
Chapter 13 Liverpool Street 103
Chapter 14 London Bridge 107
Chapter 15 Marylebone 111
Chapter 16 Moorgate 115
Chapter 17 Paddington 119

Central London Rail Termini
6
Chapter 18 St Pancras 123
Chapter 19 Victoria 127
Chapter 20 Waterloo 131
Appendix 136

Analysing passengers‟ onward travel patterns
7
Central London Rail Termini
8
Executive summary
Purpose of the report
There are over half a million passenger travelling through the central London rail termini in the
morning peak period (07:00-10:00) with over a quarter of a million passengers in the busiest
hour (08:00-09:00). Rail is a key mode for accessing central London, particularly during the peak
periods. The termini are the points at which the majority of rail passengers reach central
London, but although the termini are at the end of the rail line they are rarely the end of the
journey. This report presents new information collected specifically about people travelling
through central London‟s rail termini and their onward journeys.
Catering for the efficient dispersal of the large volumes of rail passengers alighting at central
London‟s rail termini is of importance to the functioning of London‟s economy. With the
number of rail passengers travelling into central London projected to rise over the next 20 years,
the need for efficient onward dispersal will become even greater.
Already, crowding is an issue at many of the termini with the capacity of some public transport
(particularly Underground) services unable to meet peaks in demand. In order to improve
understanding of trips through the stations and patterns of onward distribution, a survey of
passengers was undertaken at each terminus on a representative weekday in either spring or
autumn 2010 (not during school holidays) during the morning and evening peaks, between 7:00
to 10:00 and 16:00 to 19:00. A full passenger count was conducted and postal return origin-
destination questionnaires were distributed to capture journey patterns. This report presents
the results of analysis of surveys carried out at 13 central London rail termini in 2010 (Blackfriars
station was not surveyed as it was affected by closures during the station redevelopment
programme). The analysis presented includes the potential for the use of walking and cycling for
onward travel to increase which can contribute to Mayoral targets for increasing walking and
cycling in London.
Who uses the central London termini?
More than half a million passengers were observed at the central London termini over the
weekday morning peak period, with a similar number observed during the evening peak period.
Just over half (54 per cent) of these were arriving passengers. The busiest of the termini was
Waterloo handling 20 per cent of all central London passengers during the peak periods.
The majority of people travelled to or from central London during the peak periods for work
related purposes, with 72 per cent travelling to their usual workplace and a further nine per cent
stating that they were travelling for „other work‟. There were variations among the stations with
those in or around the City of London having the highest proportions of commuters, while
those stations with long distance connections to the UK regions saw greater numbers of
business trips.
Given the high level of commuting and work related journey purposes it is not surprising that 78
per cent of peak time passengers make the journey at least three times per week.
Analysing passengers‟ onward travel patterns
9
Onward distribution
The majority of onward journeys to and from the central London termini were made either by
Underground (40 per cent) or on foot (36 per cent). A further 10 per cent were made by bus
while nine per cent of passengers made a rail to rail interchange at the termini.
The mode used for onward travel was closely correlated with the distance travelled, with
different modes dominating different distances. Eighty-nine per cent of onward trips made on
foot were shorter than 2 kilometres. Bus use was generally restricted to onward journeys
between 1 and 5 kilometres, with 87 per cent of bus journeys in this range. Eighty-eight per cent
of Underground journeys were longer than 2 kilometres. An individual‟s mode choice is of
course affected by multiple factors.
Passengers travelling to and from the rail termini during the peak periods make more than
400,000 Underground journeys and over 100,000 bus journeys in central London. This is a
significant part of London‟s public transport system with some stations or services suffering
from severe crowding problems.
Have travel patterns changed over time?
The results of the central London termini surveys in 2010 have been compared with the rail
surveys of the London Area Transport Survey (LATS) 2001. Overall, 145,000 more rail
passengers arrived or departed across the two peak periods, an increase of 18 per cent.
Waterloo remained the busiest station among the central London termini stations.
The demographic profile of rail passengers is changing with an increase in the percentage of
women and a shift towards an older age profile.
The overall mode shares for onward journeys in central London have not changed significantly
with Underground and walk remaining the most popular modes. In comparison, bus and cycling
saw the greatest increase with the share for both modes increasing by one and a half percentage
points.
How do Londoners’ travel patterns differ from those of non-Londoners?
Just over half of all rail journeys to and from the central London termini started or finished
outside Greater London. This equates to around 580,000 daily journeys. Passengers arriving at
Marylebone, King‟s Cross and Euston stations are the most likely to have come from outside
Greater London, closely followed by St Pancras. This of course reflects the services available at
these stations.
Among non-Londoners, seven in ten trips involved commuting while one in ten journeys were
for other work purposes. This compares with only one in twenty people travelling within Greater
London making a journey for other work purposes (not commuting).
People starting or ending their journey outside Greater London are less likely to make the
journey every day of the week than people travelling solely within Greater London. Non-
Central London Rail Termini
10
Londoners are also more likely to be very infrequent travellers with one in ten people travelling
once a year or less.
Non-Londoners are less likely to walk and more likely to use the Underground for their onward
journey in central London compared with Londoners. They are, however, more likely to cycle
both at the central London end and non central London end of their journey.
Travel patterns outside central London
The survey also captured access and egress patterns at the end of the rail journey outside
central London. This is referred to as the „non-central‟ end of the trip.
Over 80 per cent of journeys are between home and a usual workplace in central London while
one in ten journeys has a usual workplace as its destination at the non-central end.
The most popular onward mode at the non-central end of the journey is walk at 66 per cent,
followed by bus at 15 per cent. The mode share for car is nine per cent at the non-central end
but is negligible as an onward mode at the central London termini. Conversely Underground,
which is the most popular onward mode in central London, is used by just one per cent of
people to access the non central London rail station.
Walking and cycling are more popular at the non-central end of the journey, with people more
likely to have ever walked or cycled at the end of their journey outside central London. Those
who ever walk or cycle also do so more frequently outside central London.
The five most used non-central stations (based on the number of trips between these stations
and the central London termini) are East Croydon, Clapham Junction, Surbiton, Wimbledon and
Putney, which together handle 57,000 passengers travelling to or from central London rail
termini over the peak periods. This is for rail trips originating or ending at those stations and
excludes interchange between rail services.
Opportunities for walking
At present, 36 per cent of journeys to and from central London rail termini are walked,
amounting to 380,000 walk journeys during the peak periods. The walk mode share ranges from
80 per cent at Cannon Street to 12 per cent at St Pancras and largely reflects the average
distances travelled for onward journeys. Ninety-one per cent of onward journeys shorter than
1km and 55 per cent of those between 1 – 2m are walked.
Analysis was carried out to identify journeys less than 2km that are currently made by a
mechanised mode but could potentially be walked. In total, 123,200 potentially walkable
journeys were identified – 12 per cent of journeys by all modes and 19 per cent of journeys by
mechanised modes. Fifty per cent of these journeys were between 1.5 and 2km, the upper limit
of what is considered potentially walkable.
Analysing passengers‟ onward travel patterns
11
Opportunities for cycling
At present, 1.8 per cent of journeys to and from central London rail termini are cycled,
amounting to approximately 19,000 cycle journeys during the peak periods. The cycle mode
share to and from central London rail termini ranges from 0.3 per cent at Cannon Street to 4.5
per cent at Paddington, and largely reflects the average distance travelled for onward journeys.
Eighty-three per cent of cycled journeys are up to 4.5km. Cycling is dominated by a particular
demographic: 82 per cent of cycle journeys are made by men; 60 per cent of cyclists are aged
between 25 and 44.
In the autumn surveys, questions were asked to ascertain the types of bicycles used from
central London rail termini. Fifty-seven per cent of people cycled on their own bicycle, the
majority of whom used a non-folding bicycle. Thirty-seven per cent of people cycling from a
central London rail terminus did so using a Barclays Cycle Hire bicycle.
Market segmentation is used to group together the range of people that use TfL services to
understand their current travel behaviour and the triggers for maintaining or changing future
travel behaviours. Over 50 per cent of the cycle market is comprised of individuals living in
postcodes categorised as „urban living‟ and „suburban lifestyles‟. People in these segments tend
to be well educated, reasonably well off and tend to cycle for leisure as well as for commuting
to work.
Further information
For enquiries about the content of this publication, please contact:
Tel: 020 7126 4384
Strategic Analysis, Group Planning
Transport for London
9th floor, Windsor House
42-50 Victoria Street
London SW1H 0TL

Central London Rail Termini
12
Analysing passengers‟ onward travel patterns
13
Introduction
This report presents the results of analysis of surveys carried out at 13 central London rail
termini in 2010. Rail is a key mode for accessing central London, particularly during the peak
periods: it is the most popular mode in the morning peak period, accounting for 43 per cent of
people who travel into central London (CAPC survey 2010, Travel in London Report 3). The vast
majority of these rail trips pass through the central London termini, and this report focuses on
new information collected specifically about people travelling through those stations.
Background
The Mayor‟s Transport Strategy (MTS) published in 2010 identifies the need for congestion relief
and efficient onward distribution at central London termini:
“Increasing population and employment, plus the additional capacity on much of London‟s
rail network through the current rail investment programme, means rail arrivals into central
London termini are forecast to increase by about 25 per cent by 2031. This will result in
increased strain on National Rail termini, and on the transport networks and services within
central London.”
- MTS, 2010
Already, crowding is an issue at many of the termini with the capacity of public transport
services unable to meet peaks in demand. Crowding on the Underground can lead to closures
and delays. This reduces the efficiency of onward distribution, with consequences for London‟s
economy. The capacity of the National Rail network into London is growing, and without
intervention the further growth in London‟s population and employment will exacerbate
crowding at stations and on modes used for onward travel.
It is important that we improve our understanding of trips made into central London by rail and
patterns of onward distribution. A survey of passengers at the central London termini was
undertaken to collect information about their characteristics and travel choices. This new
information will provide a useful resource in work to mitigate some of the current issues around
onward travel, and will also to assist in planning for efficient distribution in light of the predicted
growth in travel in central London.

Central London Rail Termini
14
Central London’s rail termini: a special case in London’s transport network
Huge numbers of passengers pose unique challenges
Passenger flows at some of central London‟s rail termini dwarf those at London‟s Underground
stations, with even the busiest Underground stations handling less than half the number of
passengers using Waterloo rail terminus during the morning peak period. Peak time rail
passenger flows at London Bridge, Liverpool Street and Victoria also greatly exceed
Underground passenger flows from Bank, Canary Wharf and Oxford Circus. Moreover, as well as
catering for these vast rail passenger flows, most termini also house an Underground station –
which are in many cases among London‟s busiest stations in their own right.
The end of the line may not mean the end of the journey
The major radial rail routes into London funnel many thousands of passengers every hour from
outlying areas to the 13 central London termini. But while these stations may be the end of the
rail line, they are often not the end of the journey. This means that while some passengers are
able to walk the last few minutes of their journey, thousands more depend on fast, reliable
onward connections to reach their ultimate destination.
Making vital connections between employees and businesses
As well as handling a large proportion of commuter traffic into central London, central London‟s
rail termini are often vitally important gateways for business travel between central London and
the UK‟s most economically active areas, and many of the thousands of passengers travelling
through them each day are travelling on business. The efficient onward distribution of this high
value travel is therefore of significant importance for the economies of London and the UK as a
whole.
Realising the benefits of line upgrades will require close collaboration
With the capacity of trains on routes into central London expected to increase in coming years,
the requirement for efficient onward distribution will become even greater if the maximum
potential for economic growth is to be realised. Since responsibility for operations at each of
central London‟s rail termini is typically shared between Network Rail, one or more Train
Operating Companies and TfL, these stakeholders must collaborate closely to manage large
passenger flows and plan for growth.
Analysing passengers‟ onward travel patterns
15
Introducing the surveys
The 13 central London termini rail stations were surveyed during 2010. A survey was not carried
out at Blackfriars as it was affected by closures during the station redevelopment programme.
The surveys sought to obtain information on passenger journeys including origins and
destinations, as well as modes used to access the station.
Surveys were carried out at each station on a representative weekday in either spring or autumn
2010 (not during school holidays) during the morning and evening peaks, between 7:00 to 10:00
and 16:00 to 19:00. A full passenger count was conducted and postal return origin-destination
questionnaires were distributed to capture journey patterns. In total, over one million
passengers were counted arriving and departing during the peak periods and more than 46,000
questionnaires were returned across all termini, providing a sample of 4.4 per cent of the total
peak time rail passenger population. For more details on the survey methodology see the note
in the Appendix. All the findings presented in this report are based on analysis of the responses
expanded to the total passenger numbers at each station. The analysis generally combines the
data for the AM and PM peak periods throughout the report (unless otherwise stated). The AM
and PM figures are generally similar: the vast majority of passengers (9 in 10 respondents) also
make a return journey through the central London termini.
Structure of the report
The report is divided in two parts; part one consists of chapters presenting the analysis of the
central London termini surveys under different themes while part two presents key survey
results at individual stations.
Part 1
Chapter 1 provides an overview of travel at the termini looking at the number of passengers
arriving or departing during the weekday peak period, the purpose of their journeys and how
frequently they make them. It also includes some passenger demographics.
Chapter 2 presents detailed analysis of onward travel in central London, looking at the modes
used and the distances travelled by passengers between the termini and the end of their trip in
central London. It also looks at where these passengers contribute to or are impacted by
current crowding issues on central London‟s public transport network.
Chapter 3 presents a comparison of the results of the central London termini surveys in 2010
with the results of similar surveys undertaken in 2001 as part of the London Area Transport
Survey (LATS). It examines at how travel patterns have changed over a decade which has seen
many aspects of transport change in London.
Chapter 4 describes travel patterns of passengers travelling to and from the central London
termini from areas outside the Greater London Authority (GLA) area and makes comparisons
between the travel patterns of non-Londoners and those of Londoners.
Chapter 5 presents analysis of rail passengers‟ travel patterns outside central London, looking at
onward travel at rail stations within Greater London (but outside central London).
Central London Rail Termini
16
Chapter 6 presents analysis of onward trips made on foot and explores the potential for growth
in onward trips by walking.
Chapter 7 presents analysis of onward travel by bicycle in central London and looks at the
potential for growth in onward trips by cycling.
Part 2
Chapters 8-20 present more detailed results for each station.
Characteristics of the central London termini
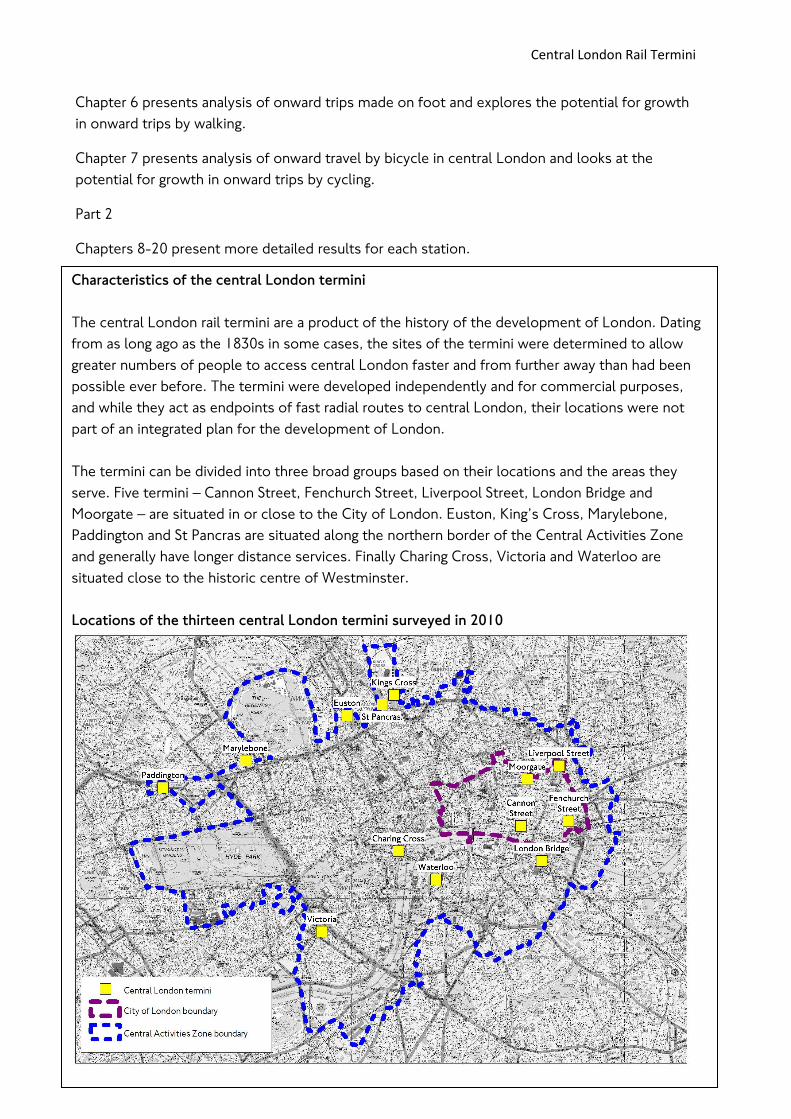
The central London rail termini are a product of the history of the development of London. Dating
from as long ago as the 1830s in some cases, the sites of the termini were determined to allow
greater numbers of people to access central London faster and from further away than had been
possible ever before. The termini were developed independently and for commercial purposes,
and while they act as endpoints of fast radial routes to central London, their locations were not
part of an integrated plan for the development of London.
The termini can be divided into three broad groups based on their locations and the areas they
serve. Five termini – Cannon Street, Fenchurch Street, Liverpool Street, London Bridge and
Moorgate – are situated in or close to the City of London. Euston, King‟s Cross, Marylebone,
Paddington and St Pancras are situated along the northern border of the Central Activities Zone
and generally have longer distance services. Finally Charing Cross, Victoria and Waterloo are
situated close to the historic centre of Westminster.
Locations of the thirteen central London termini surveyed in 2010

Analysing passengers‟ onward travel patterns
17

Central London Rail Termini
18
Part One
Analysing passengers‟ onward travel patterns
19
Chapter 1 Who uses the central London termini
This chapter presents summary results from the 2010 central London termini surveys, providing
information on passenger volumes and characteristics, presenting an overview of rail travel in
central London during weekday peak periods. It provides information on the total number of
arrivals and departures, the characteristics of those journeys and the demographic profiles of
the people making them.
Rail passengers in and out of central London
In total, just over one million (1.07 million) passengers used the central London termini during
the two three-hour peak periods on the weekdays surveyed. Just over half (54 per cent) of these
passengers were arriving in central London. Figure 1.1 shows the breakdown of arriving and
departing passengers by half-hour periods.
Note that passenger flows quoted in this report are those observed during the surveys and are
therefore a snapshot of peak period demand on just one day. Due to fluctuations in passenger
numbers these may not represent the most accurate estimates of passenger flows. Estimates of
passenger flows on an average weekday can be found in other datasets.
Key findings
In total, just over a million people arrived at and departed from the central London termini over
the weekday morning and evening peak periods. Just over half (54 per cent) of these were
arriving passengers.
Waterloo is the busiest of the termini handling 20 per cent of all central London passengers
during the peaks. The other busiest stations are London Bridge, Victoria and Liverpool Street,
with these four accounting for 60 per cent of passengers at the central London termini.
The number of male and female passengers were broadly equal among the passengers
surveyed, while the age profile showed around half in the 25-44 age group and a further third in
the 45-60 age group.
The majority of people travelled to or from central London during the peak periods for work
related purposes, with 72 per cent travelling to their usual workplace and a further nine per
cent stating that they were travelling for „other work‟. There were variations among the stations
with those in or around the City of London having the highest number of commuters.
Given the high level of commuting and work related journey purposes it is not surprising that
78 per cent of passengers make the journey at least three times per week. The stations with
the highest number of infrequent travellers are Euston, St Pancras, Paddington and King's
Cross.
Central London Rail Termini
20
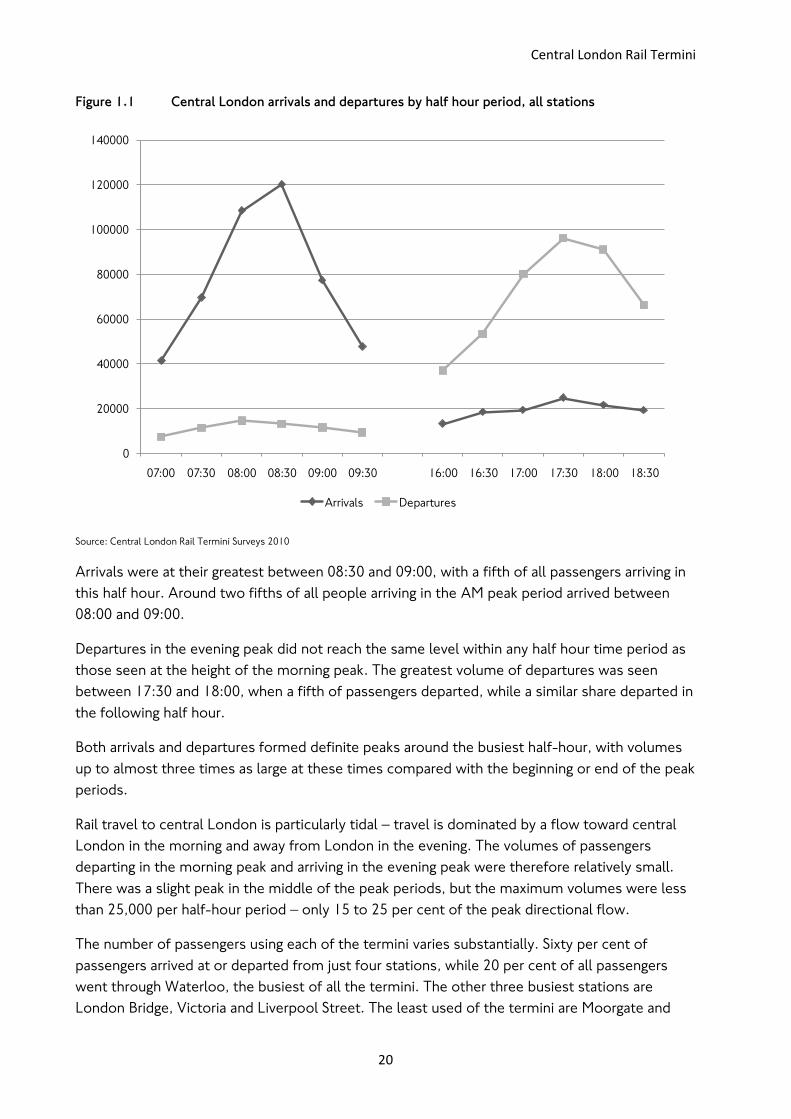
Figure 1.1 Central London arrivals and departures by half hour period, all stations
Source: Central London Rail Termini Surveys 2010
Arrivals were at their greatest between 08:30 and 09:00, with a fifth of all passengers arriving in
this half hour. Around two fifths of all people arriving in the AM peak period arrived between
08:00 and 09:00.
Departures in the evening peak did not reach the same level within any half hour time period as
those seen at the height of the morning peak. The greatest volume of departures was seen
between 17:30 and 18:00, when a fifth of passengers departed, while a similar share departed in
the following half hour.
Both arrivals and departures formed definite peaks around the busiest half-hour, with volumes
up to almost three times as large at these times compared with the beginning or end of the peak
periods.
Rail travel to central London is particularly tidal – travel is dominated by a flow toward central
London in the morning and away from London in the evening. The volumes of passengers
departing in the morning peak and arriving in the evening peak were therefore relatively small.
There was a slight peak in the middle of the peak periods, but the maximum volumes were less
than 25,000 per half-hour period – only 15 to 25 per cent of the peak directional flow.
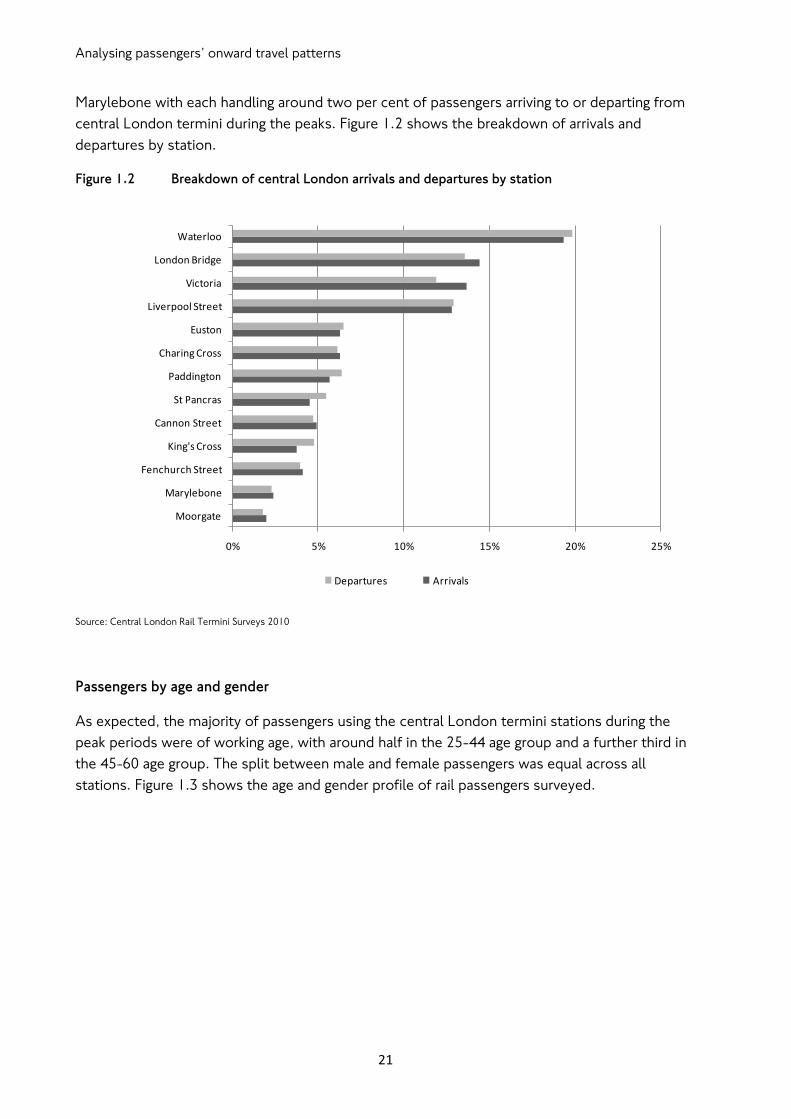
The number of passengers using each of the termini varies substantially. Sixty per cent of
passengers arrived at or departed from just four stations, while 20 per cent of all passengers
went through Waterloo, the busiest of all the termini. The other three busiest stations are
London Bridge, Victoria and Liverpool Street. The least used of the termini are Moorgate and
0
20000
40000
60000
80000
100000
120000
140000
07:00 07:30 08:00 08:30 09:00 09:30 16:00 16:30 17:00 17:30 18:00 18:30
Arrivals Departures
Analysing passengers‟ onward travel patterns
21
Marylebone with each handling around two per cent of passengers arriving to or departing from
central London termini during the peaks. Figure 1.2 shows the breakdown of arrivals and
departures by station.
Figure 1.2 Breakdown of central London arrivals and departures by station
Source: Central London Rail Termini Surveys 2010
Passengers by age and gender
As expected, the majority of passengers using the central London termini stations during the
peak periods were of working age, with around half in the 25-44 age group and a further third in
the 45-60 age group. The split between male and female passengers was equal across all
stations. Figure 1.3 shows the age and gender profile of rail passengers surveyed.
0% 5% 10% 15% 20% 25%
Moorgate
Marylebone
Fenchurch Street
King's Cross
Cannon Street
St Pancras
Paddington
Charing Cross
Euston
Liverpool Street
Victoria
London Bridge
Waterloo
Departures Arrivals

Central London Rail Termini
22
Figure 1.3 Age and gender profile, all stations, arriving and departing passengers
Source: Central London Rail Termini Surveys 2010
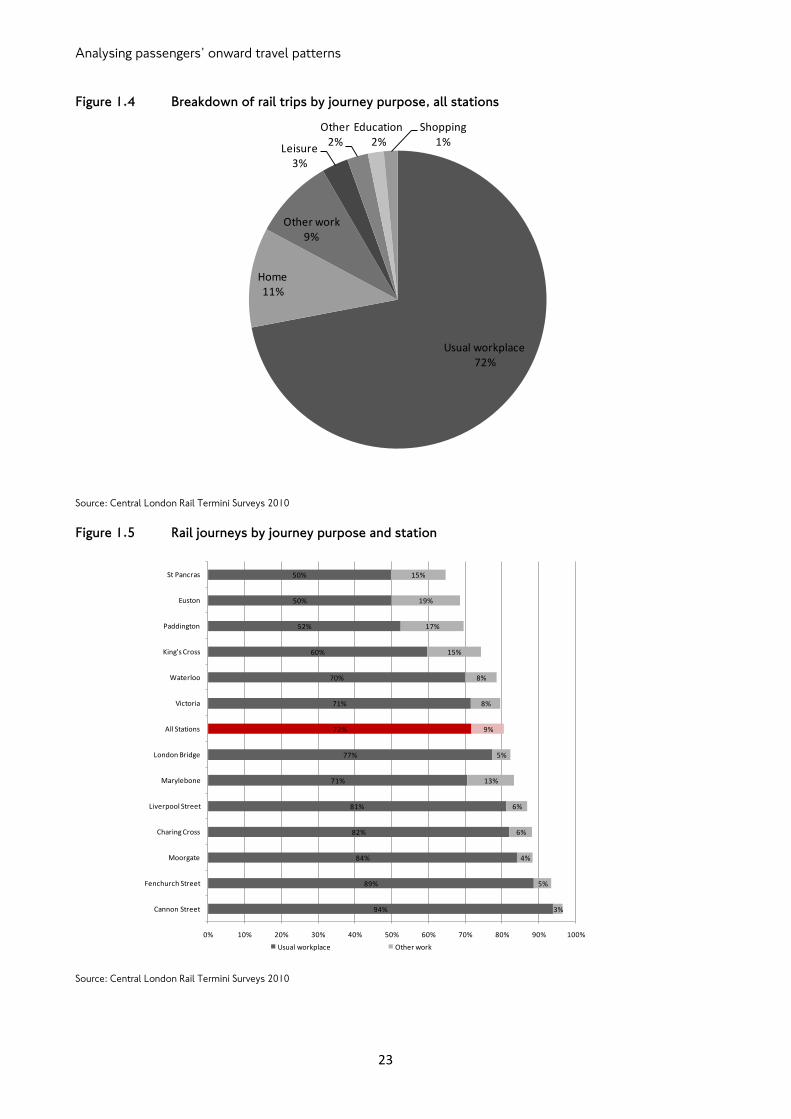
Why people are travelling
The majority of people are travelling to or from central London for work related purposes during
weekday peak periods. Figure 1.4 shows the central London purpose breakdown of arrivals and
departures during the morning and evening peak periods. The vast majority of passengers (72 per
cent) travelled to their usual workplace, and a further nine per cent travelled to other work
destinations, meaning work related trips make up over 80 per cent of peak time rail trips at the
termini.
Figure 1.5 shows the percentage of trips for work related purposes by station. Passengers
travelling for work form the vast majority at stations in or in the vicinity of the City of London
with more than 80 per cent travelling to their usual workplace at Cannon Street, Fenchurch
Street, Moorgate, Charing Cross and Liverpool Street. At Marylebone, London Bridge, Victoria
and Waterloo 7 in 10 passengers surveyed travelled to their usual workplace while at King‟s
Cross that fell to 6 in 10 people. The stations where commuting accounted for only around 50
per cent of the journeys at peak times were Paddington, Euston and St Pancras. St Pancras also
had the lowest share of work related journeys overall at 65 per cent.
At some stations the percentage of „other work‟ journeys was significantly higher than the
average across all stations: Euston at 19 per cent, Paddington at 17 per cent, King‟s Cross and St
Pancras at 15 per cent and Marylebone at 13 per cent.
0
50,000
100,000
150,000
200,000
250,000
300,000
350,000
Under 16 16-24 25-44 45-60 60+
Arr
ivin
g an
d d
ep
arti
ng
pas
sen
gers
Female Male
Analysing passengers‟ onward travel patterns
23
Figure 1.4 Breakdown of rail trips by journey purpose, all stations
Source: Central London Rail Termini Surveys 2010
Figure 1.5 Rail journeys by journey purpose and station
Source: Central London Rail Termini Surveys 2010
Usual workplace72%
Home11%
Other work9%
Leisure3%
Other2%
Education2%
Shopping1%
94%
89%
84%
82%
81%
71%
77%
72%
71%
70%
60%
52%
50%
50%
3%
5%
4%
6%
6%
13%
5%
9%
8%
8%
15%
17%
19%
15%
0% 10% 20% 30% 40% 50% 60% 70% 80% 90% 100%
Cannon Street
Fenchurch Street
Moorgate
Charing Cross
Liverpool Street
Marylebone
London Bridge
All Stations
Victoria
Waterloo
King's Cross
Paddington
Euston
St Pancras
Usual workplace Other work

Central London Rail Termini
24
Travel by journey frequency
Given that a large majority of the trips reported in the survey were work related, it is not
surprising that the frequency with which people made those journeys was high. Seventy-eight
per cent of passengers said they made the journey at least three times per week (see Figure 1.6).
Only 1 in 10 said they made the journey less than once per month. This may mean that the
majority of passengers had a good level of familiarity with the station, the area and the transport
options available to them.
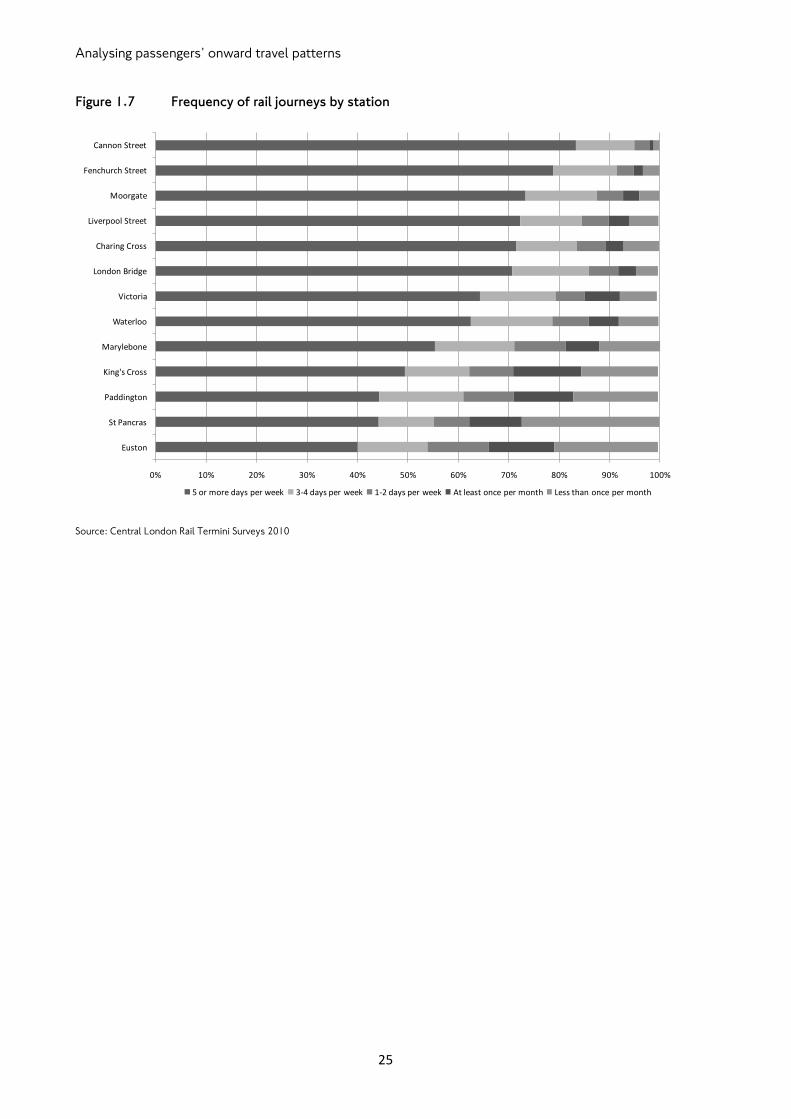
Figure 1.7 shows the frequency of travel by station. Stations with the highest proportion of
commuters, such as those serving the City of London, also saw the greatest proportion of
frequent travellers. Stations with the highest volumes of infrequent travellers included Euston,
St Pancras, Paddington and King's Cross. There is potential at these stations for providing more
information to passengers regarding the options available to them in order to help them make
the right decisions for an efficient onward journey.
Figure 1.6 Breakdown of rail trips by frequency, all stations
Source: Central London Rail Termini Surveys 2010
5 or more days per week64%
3-4 days per week14%
1-2 days per week7%
At least once per month
6%
At least once per year5%
Not in the last twelve months
4%
Analysing passengers‟ onward travel patterns
25
Figure 1.7 Frequency of rail journeys by station
Source: Central London Rail Termini Surveys 2010
0% 10% 20% 30% 40% 50% 60% 70% 80% 90% 100%
Euston
St Pancras
Paddington
King's Cross
Marylebone
Waterloo
Victoria
London Bridge
Charing Cross
Liverpool Street
Moorgate
Fenchurch Street
Cannon Street
5 or more days per week 3-4 days per week 1-2 days per week At least once per month Less than once per month
Central London Rail Termini
26
Chapter 2 Onward distribution
This chapter describes and analyses onward travel journeys from central London rail termini
stations. It describes the modes used and the distances travelled between the rail stations and
the origin/destination of the journey. It also seeks to quantify the impact rail passengers have on
some of the known constraints of the public transport system in central London.
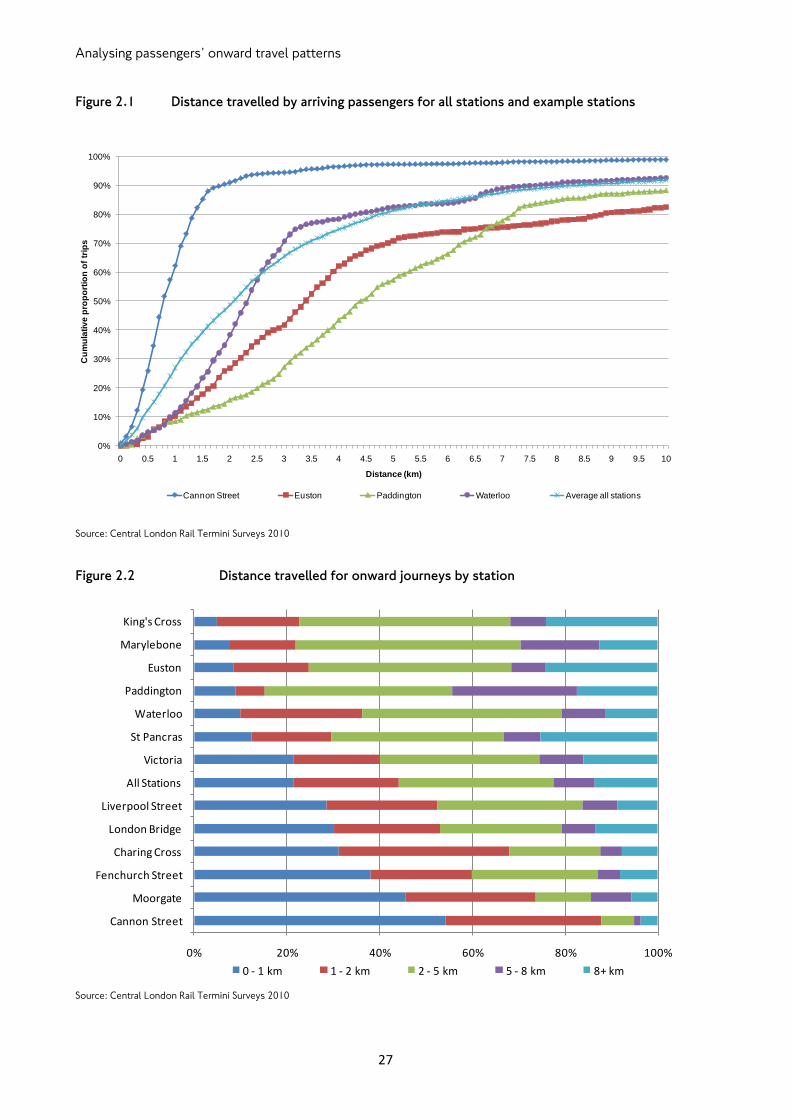
Distance of onward journeys
Figure 2.1 shows the distance travelled by passengers arriving at Cannon Street, Euston,
Paddington and Waterloo as well as the average distance for all stations. Onward journeys of
less than 1.5 kilometres accounted for 85 per cent of arrivals at Cannon Street but only 12 per
cent of arrivals at Paddington. These two stations present two different examples of distribution
patterns and reflect the station locations in relation to key employment locations. Passengers
using termini in or around the City of London have shorter onward distances to travel. Figure 2.2
shows the onward distance travelled by station.
Key findings
The majority of onward journeys to and from the central London termini were made either by
Underground (40 per cent) or on foot (36 per cent). A further 10 per cent were made by bus
while nine per cent of passengers made a rail to rail interchange at the stations.
The mode share for onward journeys varied substantially between the different termini with
Cannon Street having the highest walk mode share at 80 per cent while Paddington had the
lowest at 12 per cent.
The mode used for onward travel was closely correlated with the distance travelled, with
different modes dominating different distances. Eighty-nine per cent of onward trips made on
foot were shorter that 2 kilometres. Bus use was generally restricted to onward journeys
between 1 and 5 kilometres, with 87 per cent of bus journeys in this range. Eighty-eight per
cent of Underground journeys were longer than 2 kilometres.
More than 100,000 bus journeys and over 400,000 Underground journeys in central London are
generated by passengers travelling to and from the rail termini during the peak periods. This
puts a significant burden on London‟s public transport system with some stations or services
suffering from severe crowding problems.
Analysing passengers‟ onward travel patterns
27
Figure 2.1 Distance travelled by arriving passengers for all stations and example stations
Source: Central London Rail Termini Surveys 2010
Figure 2.2 Distance travelled for onward journeys by station
Source: Central London Rail Termini Surveys 2010
0%
10%
20%
30%
40%
50%
60%
70%
80%
90%
100%
0 0.5 1 1.5 2 2.5 3 3.5 4 4.5 5 5.5 6 6.5 7 7.5 8 8.5 9 9.5 10
Cu
mu
lati
ve
pro
po
rtio
n o
f tr
ips
Distance (km)
Cannon Street Euston Paddington Waterloo Average all stations
0% 20% 40% 60% 80% 100%
Cannon Street
Moorgate
Fenchurch Street
Charing Cross
London Bridge
Liverpool Street
All Stations
Victoria
St Pancras
Waterloo
Paddington
Euston
Marylebone
King's Cross
0 - 1 km 1 - 2 km 2 - 5 km 5 - 8 km 8+ km
Central London Rail Termini
28
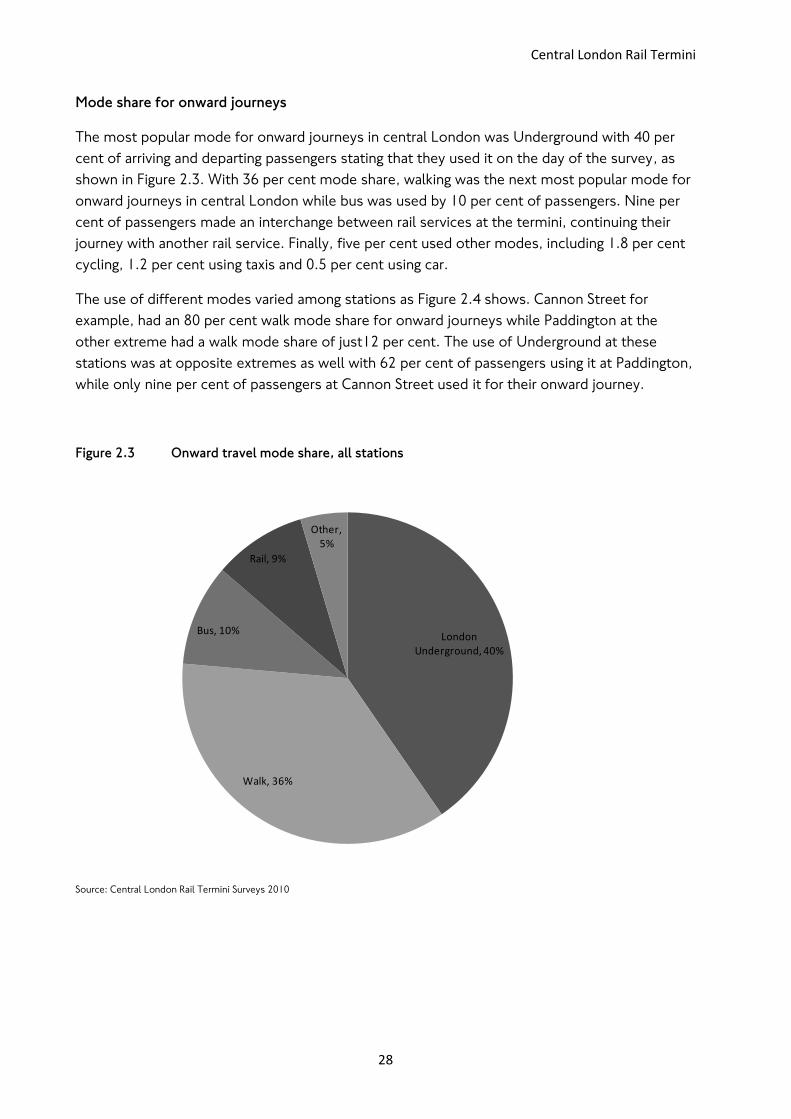
Mode share for onward journeys
The most popular mode for onward journeys in central London was Underground with 40 per
cent of arriving and departing passengers stating that they used it on the day of the survey, as
shown in Figure 2.3. With 36 per cent mode share, walking was the next most popular mode for
onward journeys in central London while bus was used by 10 per cent of passengers. Nine per
cent of passengers made an interchange between rail services at the termini, continuing their
journey with another rail service. Finally, five per cent used other modes, including 1.8 per cent
cycling, 1.2 per cent using taxis and 0.5 per cent using car.
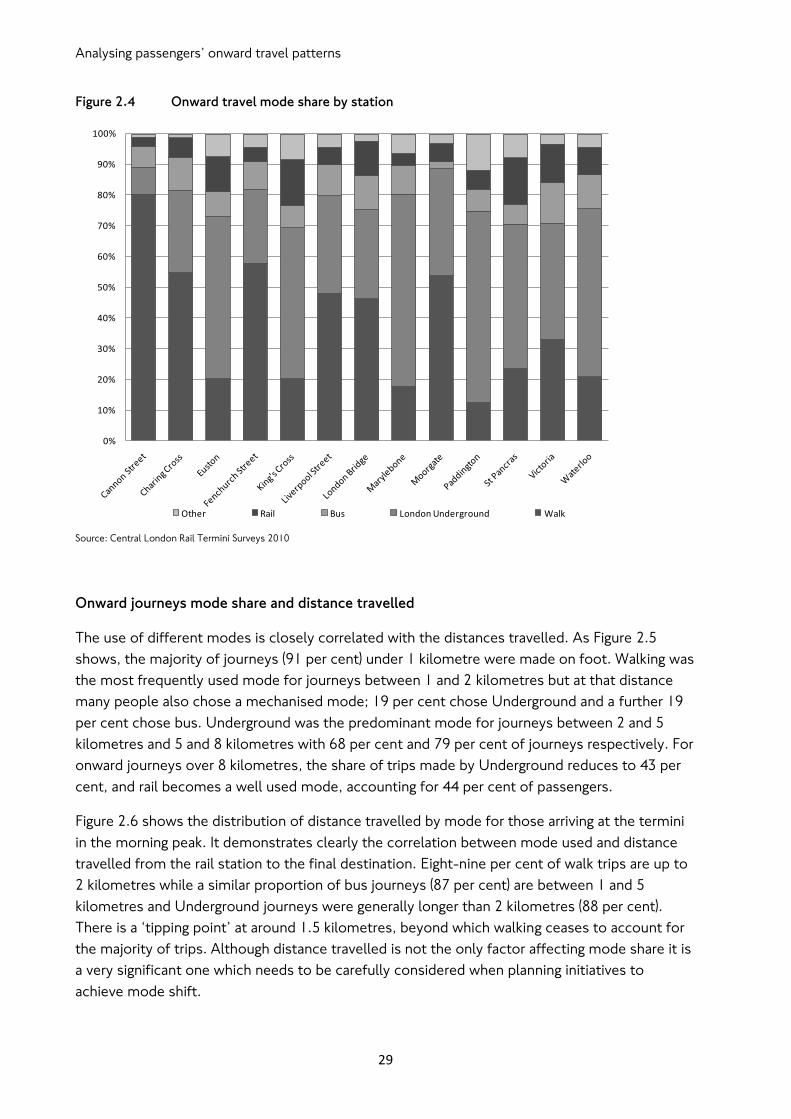
The use of different modes varied among stations as Figure 2.4 shows. Cannon Street for
example, had an 80 per cent walk mode share for onward journeys while Paddington at the
other extreme had a walk mode share of just12 per cent. The use of Underground at these
stations was at opposite extremes as well with 62 per cent of passengers using it at Paddington,
while only nine per cent of passengers at Cannon Street used it for their onward journey.
Figure 2.3 Onward travel mode share, all stations
Source: Central London Rail Termini Surveys 2010
London Underground, 40%
Walk, 36%
Bus, 10%
Rail, 9%
Other, 5%
Analysing passengers‟ onward travel patterns
29
Figure 2.4 Onward travel mode share by station
Source: Central London Rail Termini Surveys 2010
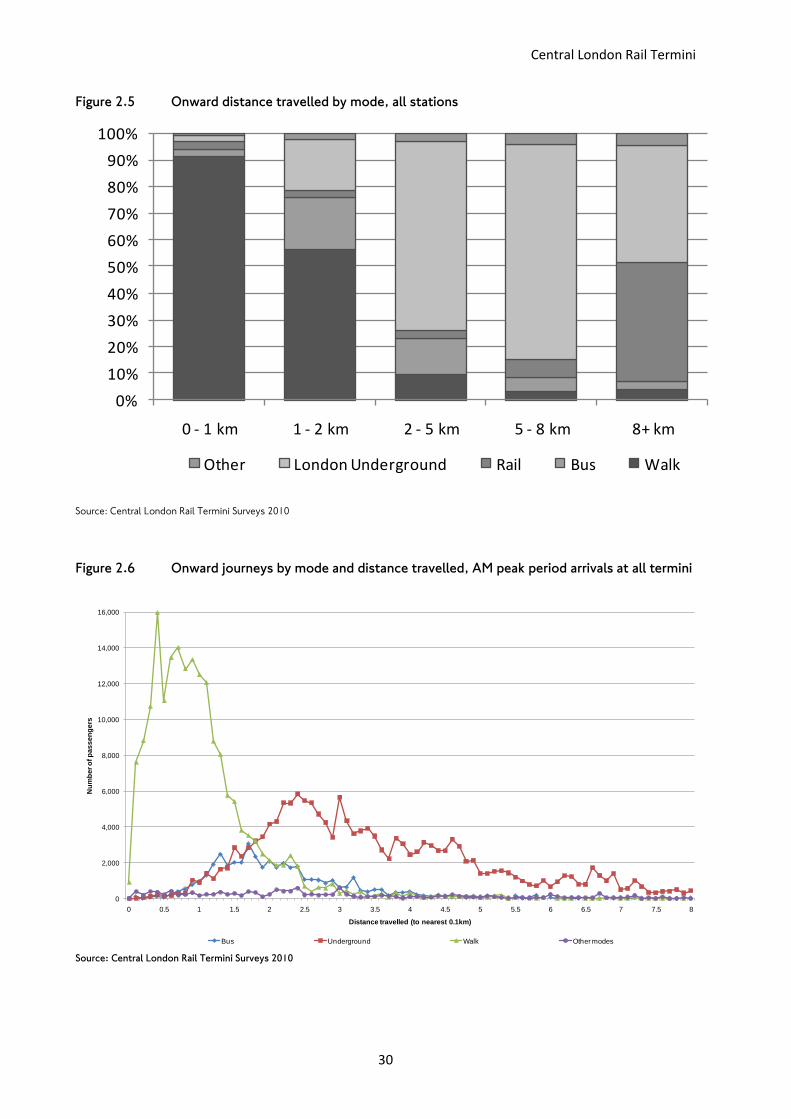
Onward journeys mode share and distance travelled
The use of different modes is closely correlated with the distances travelled. As Figure 2.5
shows, the majority of journeys (91 per cent) under 1 kilometre were made on foot. Walking was
the most frequently used mode for journeys between 1 and 2 kilometres but at that distance
many people also chose a mechanised mode; 19 per cent chose Underground and a further 19
per cent chose bus. Underground was the predominant mode for journeys between 2 and 5
kilometres and 5 and 8 kilometres with 68 per cent and 79 per cent of journeys respectively. For
onward journeys over 8 kilometres, the share of trips made by Underground reduces to 43 per
cent, and rail becomes a well used mode, accounting for 44 per cent of passengers.
Figure 2.6 shows the distribution of distance travelled by mode for those arriving at the termini
in the morning peak. It demonstrates clearly the correlation between mode used and distance
travelled from the rail station to the final destination. Eight-nine per cent of walk trips are up to
2 kilometres while a similar proportion of bus journeys (87 per cent) are between 1 and 5
kilometres and Underground journeys were generally longer than 2 kilometres (88 per cent).
There is a „tipping point‟ at around 1.5 kilometres, beyond which walking ceases to account for
the majority of trips. Although distance travelled is not the only factor affecting mode share it is
a very significant one which needs to be carefully considered when planning initiatives to
achieve mode shift.
0%
10%
20%
30%
40%
50%
60%
70%
80%
90%
100%
Other Rail Bus London Underground Walk
Central London Rail Termini
30
Figure 2.5 Onward distance travelled by mode, all stations
Source: Central London Rail Termini Surveys 2010
Figure 2.6 Onward journeys by mode and distance travelled, AM peak period arrivals at all termini
Source: Central London Rail Termini Surveys 2010
0%
10%
20%
30%
40%
50%
60%
70%
80%
90%
100%
0 - 1 km 1 - 2 km 2 - 5 km 5 - 8 km 8+ km
Other London Underground Rail Bus Walk
0
2,000
4,000
6,000
8,000
10,000
12,000
14,000
16,000
0 0.5 1 1.5 2 2.5 3 3.5 4 4.5 5 5.5 6 6.5 7 7.5 8
Nu
mb
er
of
pa
ss
en
ge
rs
Distance travelled (to nearest 0.1km)
Bus Underground Walk Other modes
Analysing passengers‟ onward travel patterns
31
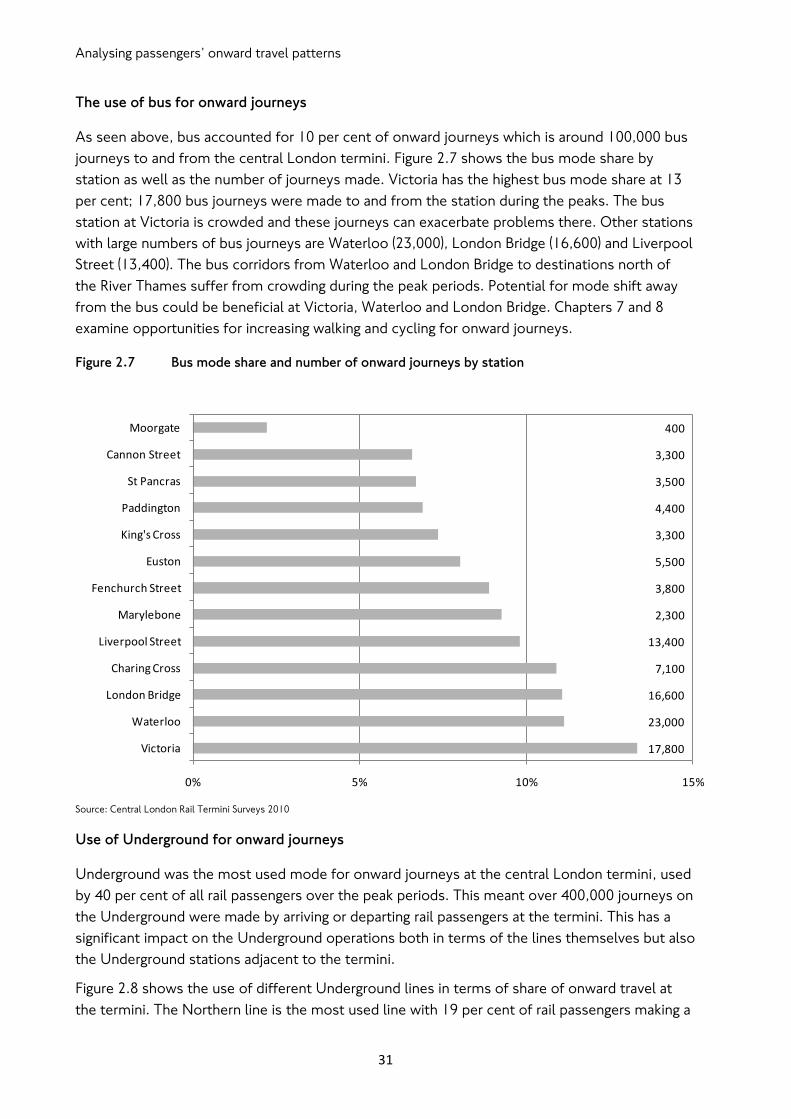
The use of bus for onward journeys
As seen above, bus accounted for 10 per cent of onward journeys which is around 100,000 bus
journeys to and from the central London termini. Figure 2.7 shows the bus mode share by
station as well as the number of journeys made. Victoria has the highest bus mode share at 13
per cent; 17,800 bus journeys were made to and from the station during the peaks. The bus
station at Victoria is crowded and these journeys can exacerbate problems there. Other stations
with large numbers of bus journeys are Waterloo (23,000), London Bridge (16,600) and Liverpool
Street (13,400). The bus corridors from Waterloo and London Bridge to destinations north of
the River Thames suffer from crowding during the peak periods. Potential for mode shift away
from the bus could be beneficial at Victoria, Waterloo and London Bridge. Chapters 7 and 8
examine opportunities for increasing walking and cycling for onward journeys.
Figure 2.7 Bus mode share and number of onward journeys by station
Source: Central London Rail Termini Surveys 2010
Use of Underground for onward journeys
Underground was the most used mode for onward journeys at the central London termini, used
by 40 per cent of all rail passengers over the peak periods. This meant over 400,000 journeys on
the Underground were made by arriving or departing rail passengers at the termini. This has a
significant impact on the Underground operations both in terms of the lines themselves but also
the Underground stations adjacent to the termini.
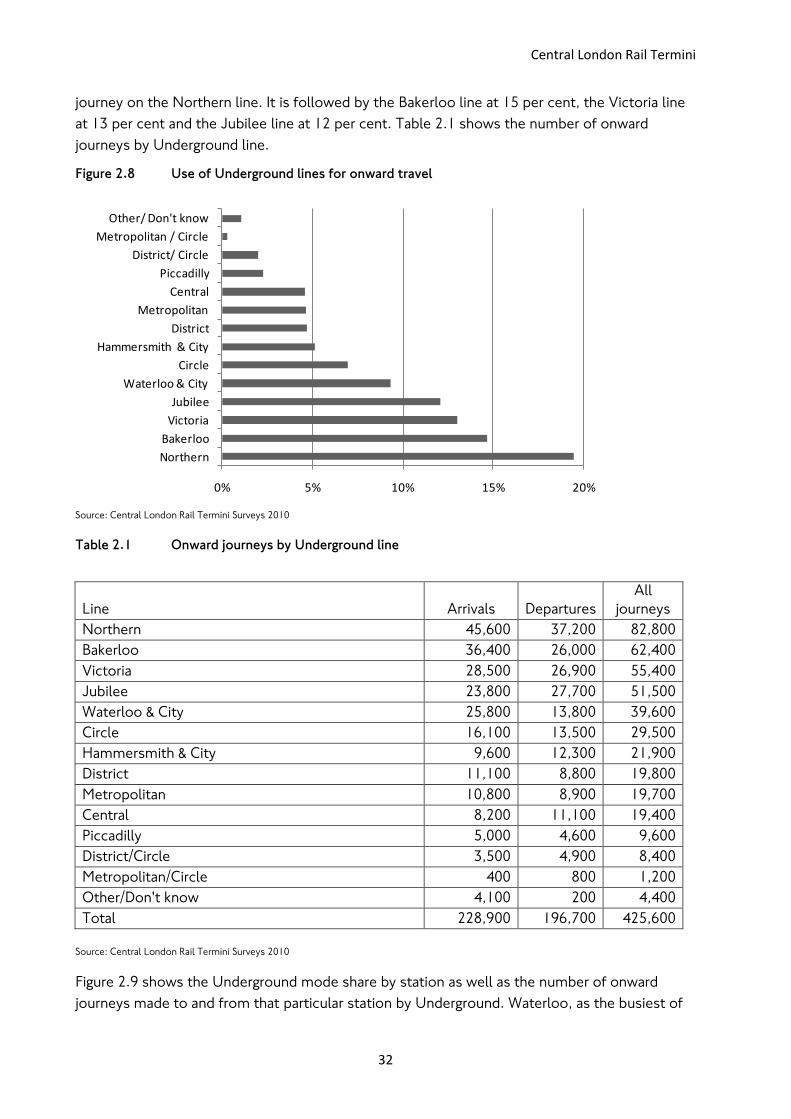
Figure 2.8 shows the use of different Underground lines in terms of share of onward travel at
the termini. The Northern line is the most used line with 19 per cent of rail passengers making a
17,800
23,000
16,600
7,100
13,400
2,300
3,800
5,500
3,300
4,400
3,500
3,300
400
0% 5% 10% 15%
Victoria
Waterloo
London Bridge
Charing Cross
Liverpool Street
Marylebone
Fenchurch Street
Euston
King's Cross
Paddington
St Pancras
Cannon Street
Moorgate
Central London Rail Termini
32
journey on the Northern line. It is followed by the Bakerloo line at 15 per cent, the Victoria line
at 13 per cent and the Jubilee line at 12 per cent. Table 2.1 shows the number of onward
journeys by Underground line.
Figure 2.8 Use of Underground lines for onward travel
Source: Central London Rail Termini Surveys 2010
Table 2.1 Onward journeys by Underground line
Line Arrivals Departures
All
journeys
Northern 45,600 37,200 82,800
Bakerloo 36,400 26,000 62,400
Victoria 28,500 26,900 55,400
Jubilee 23,800 27,700 51,500
Waterloo & City 25,800 13,800 39,600
Circle 16,100 13,500 29,500
Hammersmith & City 9,600 12,300 21,900
District 11,100 8,800 19,800
Metropolitan 10,800 8,900 19,700
Central 8,200 11,100 19,400
Piccadilly 5,000 4,600 9,600
District/Circle 3,500 4,900 8,400
Metropolitan/Circle 400 800 1,200
Other/Don't know 4,100 200 4,400
Total 228,900 196,700 425,600
Source: Central London Rail Termini Surveys 2010
Figure 2.9 shows the Underground mode share by station as well as the number of onward
journeys made to and from that particular station by Underground. Waterloo, as the busiest of
0% 5% 10% 15% 20%
Northern
Bakerloo
Victoria
Jubilee
Waterloo & City
Circle
Hammersmith & City
District
Metropolitan
Central
Piccadilly
District/ Circle
Metropolitan / Circle
Other/ Don't know
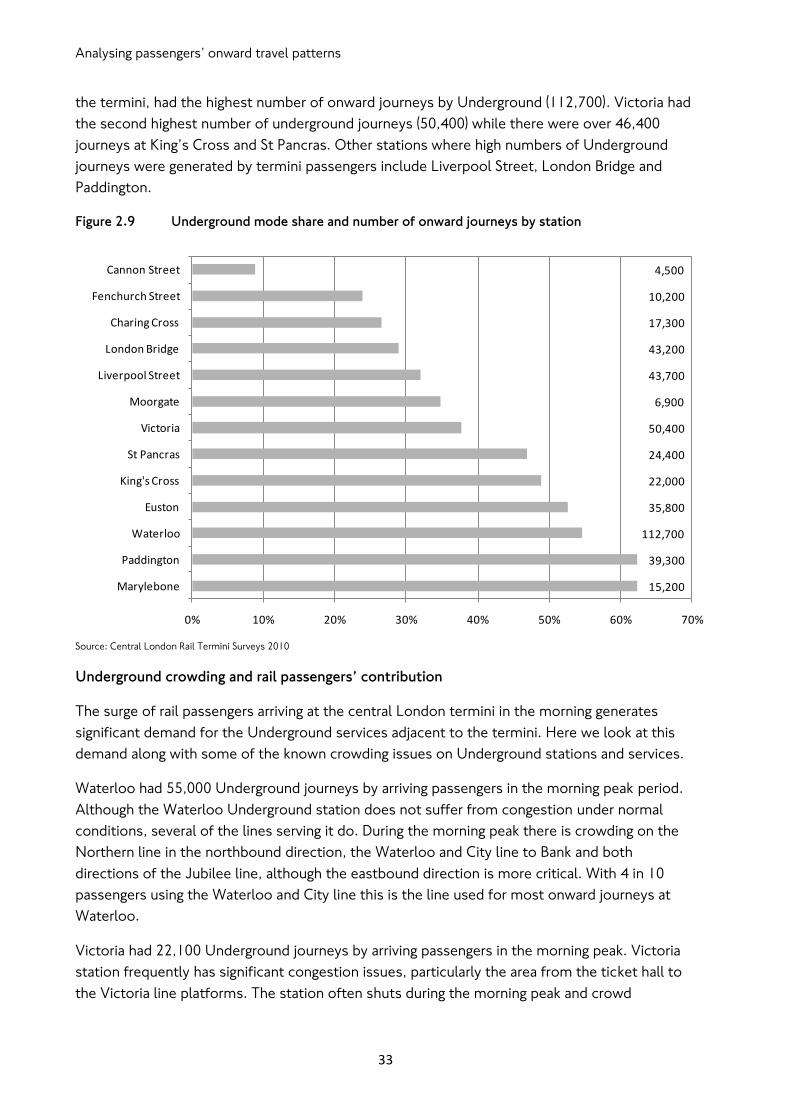
Analysing passengers‟ onward travel patterns
33
the termini, had the highest number of onward journeys by Underground (112,700). Victoria had
the second highest number of underground journeys (50,400) while there were over 46,400
journeys at King‟s Cross and St Pancras. Other stations where high numbers of Underground
journeys were generated by termini passengers include Liverpool Street, London Bridge and
Paddington.
Figure 2.9 Underground mode share and number of onward journeys by station
Source: Central London Rail Termini Surveys 2010
Underground crowding and rail passengers’ contribution
The surge of rail passengers arriving at the central London termini in the morning generates
significant demand for the Underground services adjacent to the termini. Here we look at this
demand along with some of the known crowding issues on Underground stations and services.
Waterloo had 55,000 Underground journeys by arriving passengers in the morning peak period.
Although the Waterloo Underground station does not suffer from congestion under normal
conditions, several of the lines serving it do. During the morning peak there is crowding on the
Northern line in the northbound direction, the Waterloo and City line to Bank and both
directions of the Jubilee line, although the eastbound direction is more critical. With 4 in 10
passengers using the Waterloo and City line this is the line used for most onward journeys at
Waterloo.
Victoria had 22,100 Underground journeys by arriving passengers in the morning peak. Victoria
station frequently has significant congestion issues, particularly the area from the ticket hall to
the Victoria line platforms. The station often shuts during the morning peak and crowd
15,200
39,300
112,700
35,800
22,000
24,400
50,400
6,900
43,700
43,200
17,300
10,200
4,500
0% 10% 20% 30% 40% 50% 60% 70%
Marylebone
Paddington
Waterloo
Euston
King's Cross
St Pancras
Victoria
Moorgate
Liverpool Street
London Bridge
Charing Cross
Fenchurch Street
Cannon Street
Central London Rail Termini
34
management is employed to regulate people entering the station. In terms of the lines serving
Victoria station there is crowding on the District line as well as severe crowding on the Victoria
line northbound. More than half of the rail passengers making an onward journey by
Underground used the Victoria line (52 per cent) while a further 36 per cent used the District
line.
At London Bridge there were 19,100 Underground journeys in the morning peak. The
Underground station at London Bridge does suffer from congestion and a one-way system for
passengers is often introduced for access to the Jubilee line. Both lines serving the station
suffer from crowding with severe crowding on the Northern line northbound to Bank and the
Jubilee line eastbound to Canary Wharf during the morning peak.
At Liverpool Street 16,400 arriving passengers stated they used the Underground for their
onward journey in the morning peak. Liverpool Street Underground station suffers from some
congestion but the most significant problem there is crowding on the Central line. During the
morning peak there is severe congestion on the westbound direction of the Central line. Thirty-
four per cent of rail passengers use the Central line for their onward journey. In future this
station will be served by Crossrail, which will change the distribution patterns of passengers.
There were 16,800 arriving passengers at either King‟s Cross or St Pancras rail stations in the
morning peak who made an onward journey by Underground. Some lines serving King‟s Cross/St
Pancras Underground station do suffer from crowding. During the morning peak there is severe
crowding on the southbound direction of both the Victoria and Piccadilly lines as well as the
eastbound direction of the Northern line. Two-thirds of passengers making an onward journey
by Underground use one of these three lines.
Paddington saw 13,400 arriving passengers making an onward journey by Underground in the
morning peak. There are no significant crowding issues at Paddington, with the eastbound
Hammersmith and City/Circle line the only line with crowding greater than three passengers per
square metre during the morning peak. However, 6 in 10 passengers travelling on the
Underground use the Bakerloo line at Paddington.
At Euston 12,700 arriving passengers made an onward journey by Underground in the morning
peak. Euston Underground station does suffer from crowding and during peak times there are
often queues of people wishing to access the station who pass through the ticket hall/gate line.
Euston Square station nearby does not have any capacity related issues. However, some of the
lines serving the station are crowded before reaching Euston. During the morning peak there is
severe crowding on the Victoria line southbound while there is also crowding on the City Branch
of the Northern line. Eight in ten passengers travelling on the Underground used one of the two
lines on the day of the survey.
At Charing Cross 7,600 arriving passengers stated they made an onward journey by
Underground dung the morning peak. Fourty-three per cent of these used the Northern line
which suffers from crowding in the northbound direction.
Analysing passengers‟ onward travel patterns
35
At Marylebone there were 6,400 onward journeys by Underground (at Marylebone and nearby
Baker Street stations) by arriving passengers in the morning peak, with one in two passengers
using the Bakerloo line which is crowded in the southbound direction.
At Fenchurch Street 5,400 arriving passengers made an onward journey by Underground in the
morning peak. There is some crowding on the District and Circle lines in the eastbound direction
through Tower Hill but this is less than three passengers per square metre.
Cannon Street saw 2,200 arriving passengers making an onward journey by Underground, the
majority of them using the District or Circle lines from the Underground station with 1 in 10
using the Central line (from Bank). The District and Circle lines do suffer from crowding but this
is less than three passengers per square metre.
Central London Rail Termini
36
Chapter 3 Have travel patterns changed over time?
This chapter compares the results from the central London termini survey 2010 programme
with the results from the rail survey in the LATS in 2001. It provides comparison of rail
passenger volumes, key traveller characteristics and onward distribution patterns in central
London.
The 2001 survey had been undertaken as part of a wider survey programme and has been the
key source of information for rail passengers‟ travel patterns in central London, and the 2010
survey programme provided a timely update of this dataset. The 2001 data was extracted from
the National Rail Travel Survey (NRTS) database, with journeys involving central London termini
identified based on origin/destination station. Travel during the peak periods was identified using
the First Train Departure/ Last Train Arrival times. The same dataset also contained journeys
that involved an interchange at one of the central London termini. However, it was not possible
to identify what time the interchange would have taken place and therefore it was necessary to
exclude these from the comparison. Accordingly, journeys from the central London rail termini
surveys 2010 dataset that involved an interchange with rail were excluded for the purposes of
this analysis.
The two surveys employed broadly comparable methodologies but the sample sizes between
them differ considerably, with the 2001 survey having a sample size 10 times larger than the
Key findings
The results of the central London termini surveys in 2010 are compared with the rail surveys of
the LATS 2001. Overall, 145,000 more rail passengers arrived or departed across the two peak
periods, an increase of 18 per cent.
St Pancras saw the greatest increase in passenger numbers between 2001 and 2010 while other
stations which saw significant growth include London Bridge, Euston and Waterloo.
Passenger numbers declined at Moorgate, Fenchurch Street, Charing Cross, Cannon Street and
Victoria between 2001 and 2010 particularly the number of departing passengers in the
evenining peak period.
Waterloo remained the busiest station among the central London termini.
The demographic profile of rail passengers is changing with an increase in the percentage of
women and a shift towards an older age profile.
The overall mode shares for onward journeys in central London have not changed significantly
with Underground and walk remaining the most popular modes. The greatest increase was
observed in the use of cycling with almost 400 per cent more journeys between 2001 and 2010
leading to an increase in the cycling mode share of 1.5 per cent.
Analysing passengers‟ onward travel patterns
37
2010 survey (460,000 people interviewed). However, the analysis presented here is confined at
an aggregate level which provides a reasonable degree of confidence in the data. For example,
for a characteristic shared by 50 per cent of the population (such as gender) the confidence
interval at the 95 per cent level with a sample size of 43,000 (the 2010 sample size) is +/-0.5 per
cent, while with a sample size of 460,000 (the 2001 sample size) is +/-0.1 per cent.
Passenger volumes and use of stations
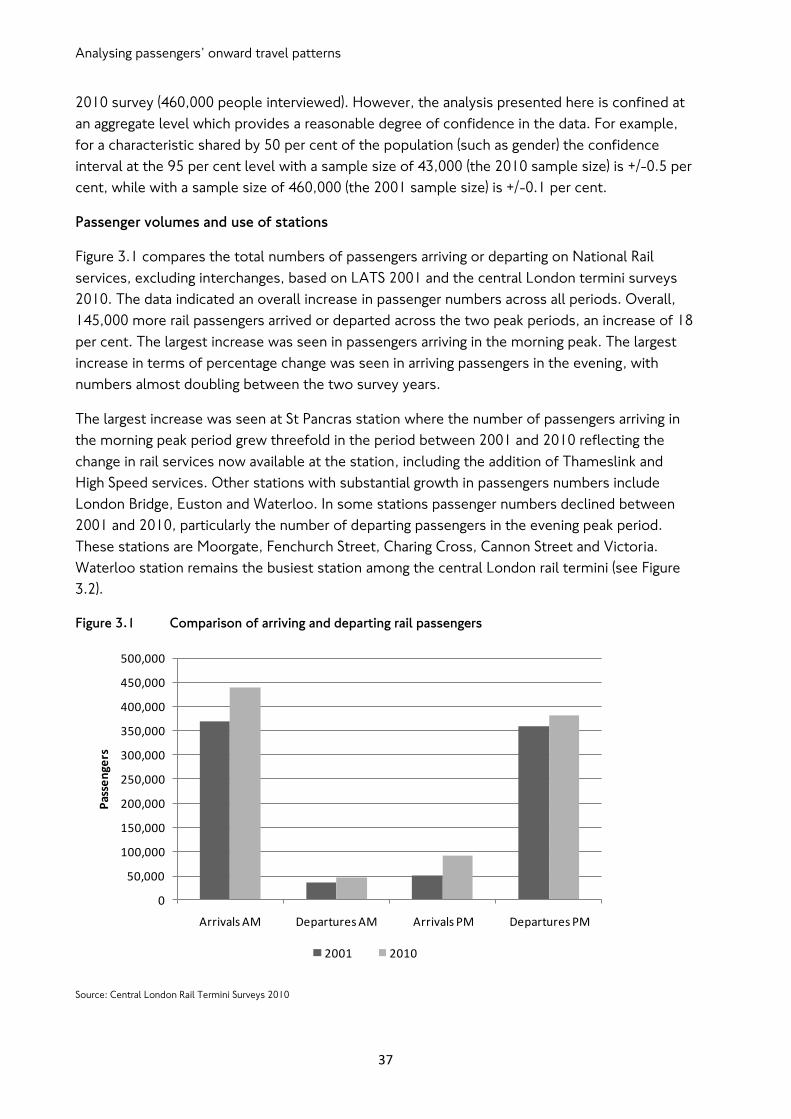
Figure 3.1 compares the total numbers of passengers arriving or departing on National Rail
services, excluding interchanges, based on LATS 2001 and the central London termini surveys
2010. The data indicated an overall increase in passenger numbers across all periods. Overall,
145,000 more rail passengers arrived or departed across the two peak periods, an increase of 18
per cent. The largest increase was seen in passengers arriving in the morning peak. The largest
increase in terms of percentage change was seen in arriving passengers in the evening, with
numbers almost doubling between the two survey years.
The largest increase was seen at St Pancras station where the number of passengers arriving in
the morning peak period grew threefold in the period between 2001 and 2010 reflecting the
change in rail services now available at the station, including the addition of Thameslink and
High Speed services. Other stations with substantial growth in passengers numbers include
London Bridge, Euston and Waterloo. In some stations passenger numbers declined between
2001 and 2010, particularly the number of departing passengers in the evening peak period.
These stations are Moorgate, Fenchurch Street, Charing Cross, Cannon Street and Victoria.
Waterloo station remains the busiest station among the central London rail termini (see Figure
3.2).
Figure 3.1 Comparison of arriving and departing rail passengers
Source: Central London Rail Termini Surveys 2010
0
50,000
100,000
150,000
200,000
250,000
300,000
350,000
400,000
450,000
500,000
Arrivals AM Departures AM Arrivals PM Departures PM
Pas
sen
gers
2001 2010
Central London Rail Termini
38
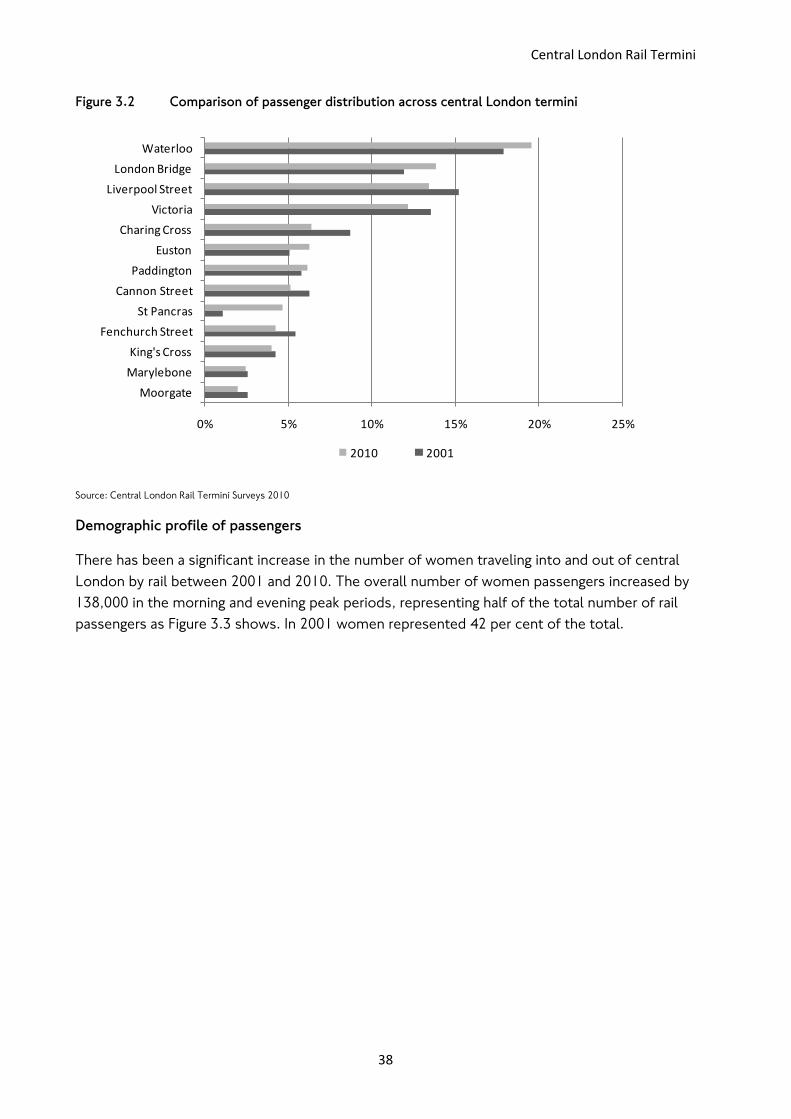
Figure 3.2 Comparison of passenger distribution across central London termini
Source: Central London Rail Termini Surveys 2010
Demographic profile of passengers
There has been a significant increase in the number of women traveling into and out of central
London by rail between 2001 and 2010. The overall number of women passengers increased by
138,000 in the morning and evening peak periods, representing half of the total number of rail
passengers as Figure 3.3 shows. In 2001 women represented 42 per cent of the total.
0% 5% 10% 15% 20% 25%
Moorgate
Marylebone
King's Cross
Fenchurch Street
St Pancras
Cannon Street
Paddington
Euston
Charing Cross
Victoria
Liverpool Street
London Bridge
Waterloo
2010 2001
Analysing passengers‟ onward travel patterns
39
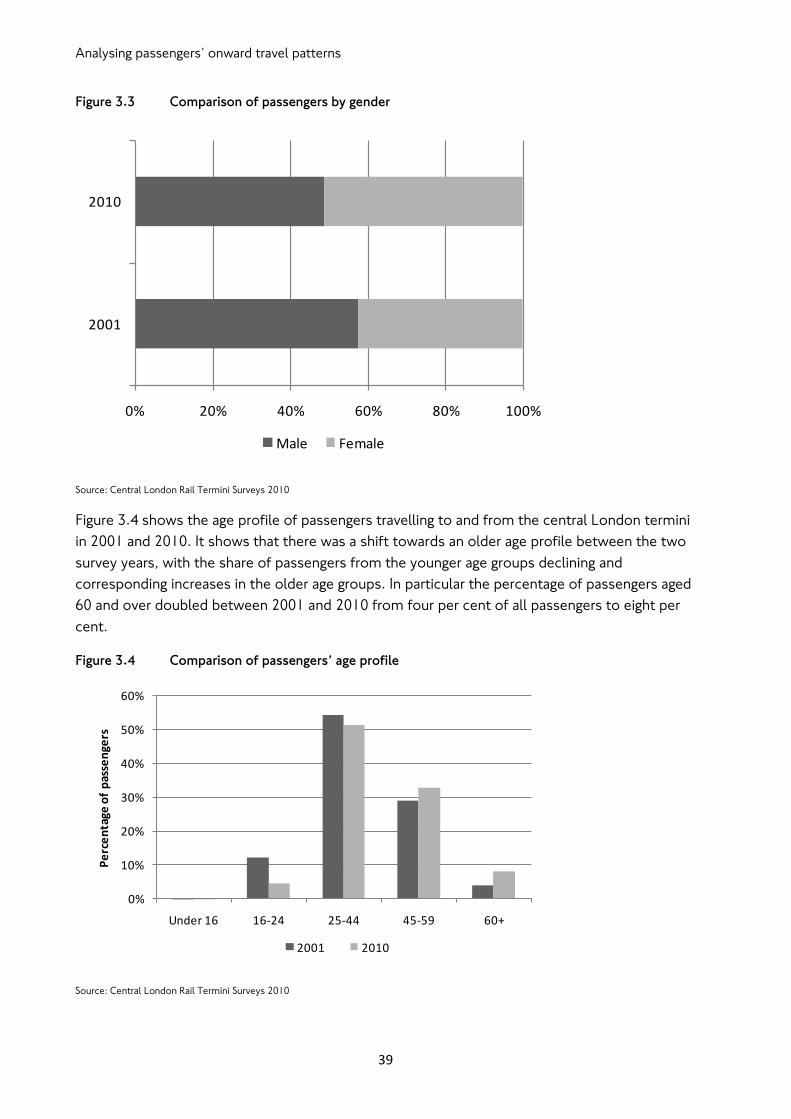
Figure 3.3 Comparison of passengers by gender
Source: Central London Rail Termini Surveys 2010
Figure 3.4 shows the age profile of passengers travelling to and from the central London termini
in 2001 and 2010. It shows that there was a shift towards an older age profile between the two
survey years, with the share of passengers from the younger age groups declining and
corresponding increases in the older age groups. In particular the percentage of passengers aged
60 and over doubled between 2001 and 2010 from four per cent of all passengers to eight per
cent.
Figure 3.4 Comparison of passengers’ age profile
Source: Central London Rail Termini Surveys 2010
0% 20% 40% 60% 80% 100%
2001
2010
Male Female
0%
10%
20%
30%
40%
50%
60%
Under 16 16-24 25-44 45-59 60+
Pe
rce
nta
ge o
f p
asse
nge
rs
2001 2010
Central London Rail Termini
40
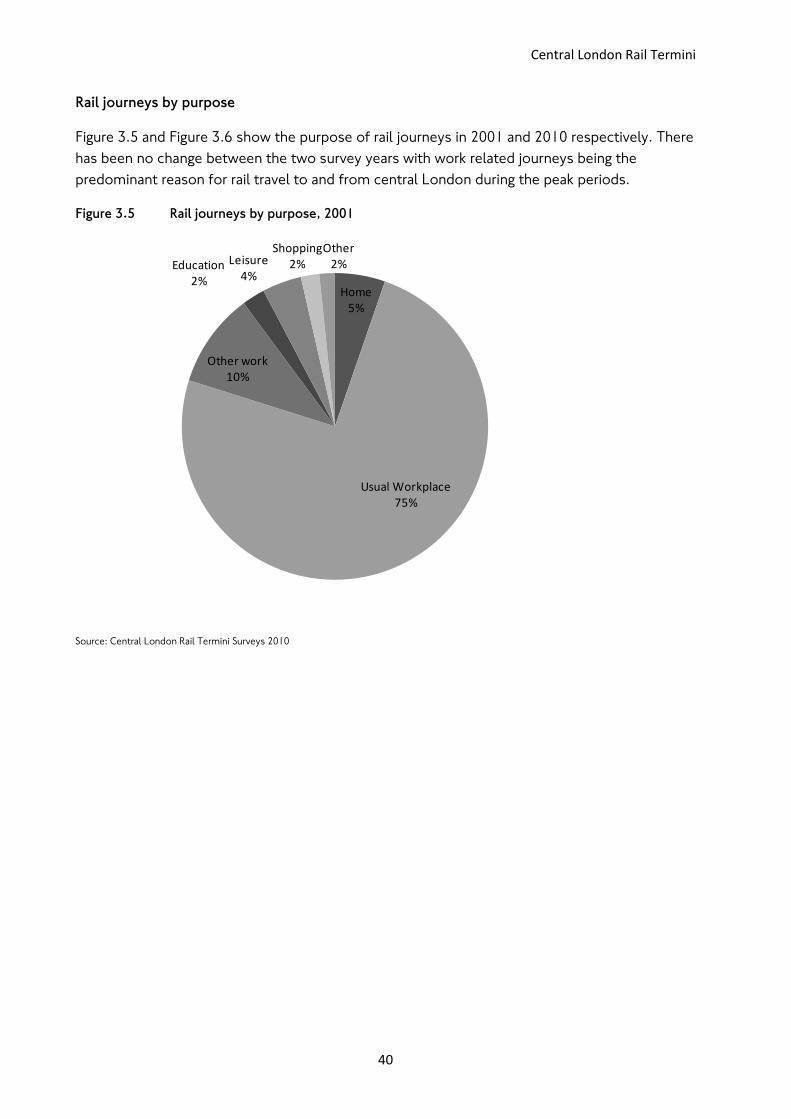
Rail journeys by purpose
Figure 3.5 and Figure 3.6 show the purpose of rail journeys in 2001 and 2010 respectively. There
has been no change between the two survey years with work related journeys being the
predominant reason for rail travel to and from central London during the peak periods.
Figure 3.5 Rail journeys by purpose, 2001
Source: Central London Rail Termini Surveys 2010
Home5%
Usual Workplace75%
Other work10%
Education2%
Leisure4%
Shopping2%
Other2%
Analysing passengers‟ onward travel patterns
41
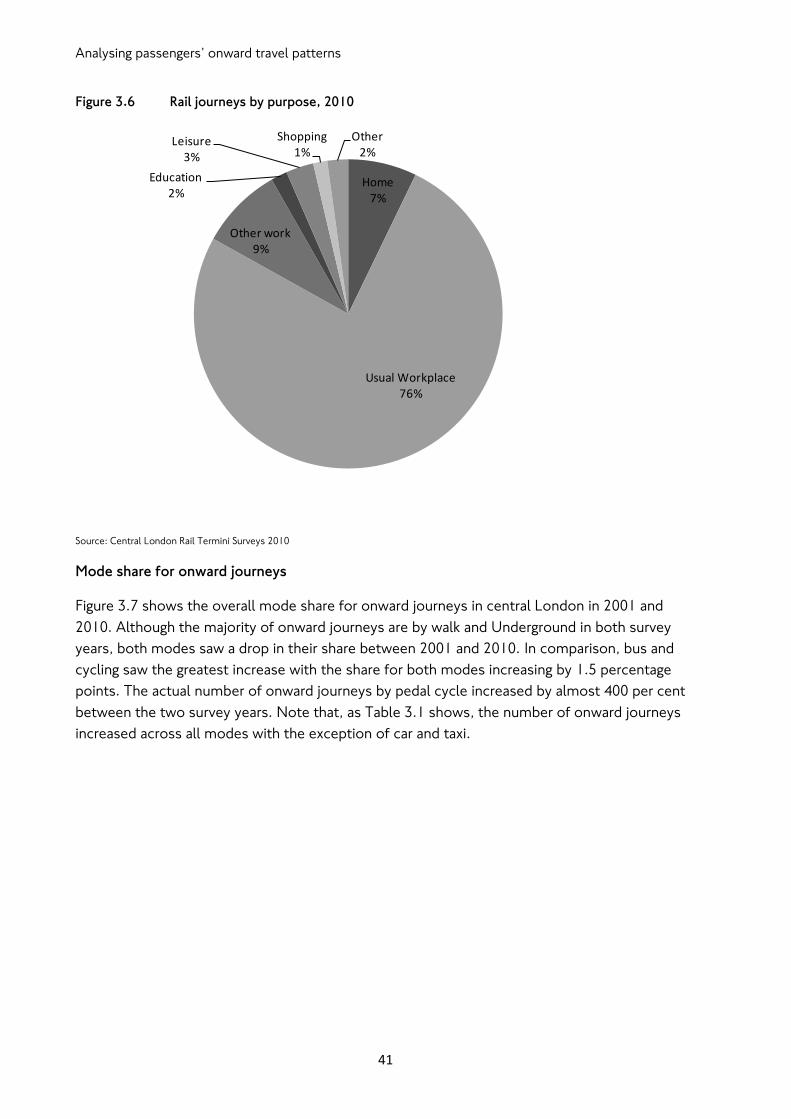
Figure 3.6 Rail journeys by purpose, 2010
Source: Central London Rail Termini Surveys 2010
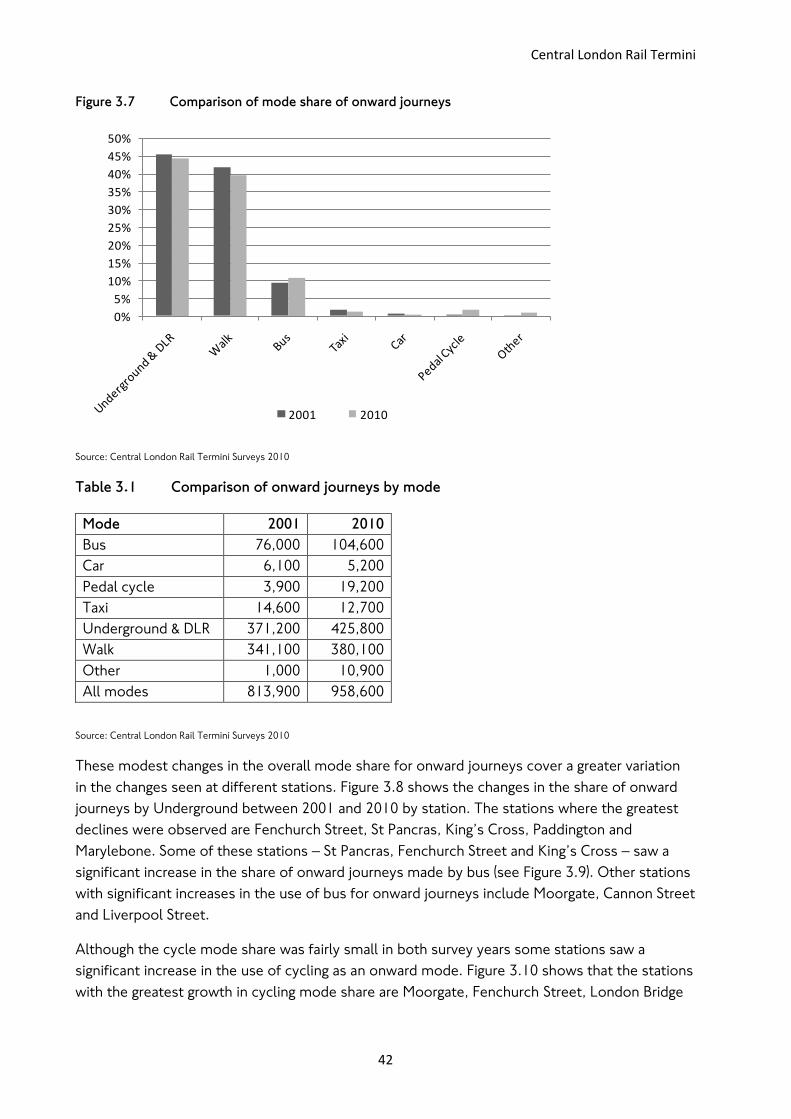
Mode share for onward journeys
Figure 3.7 shows the overall mode share for onward journeys in central London in 2001 and
2010. Although the majority of onward journeys are by walk and Underground in both survey
years, both modes saw a drop in their share between 2001 and 2010. In comparison, bus and
cycling saw the greatest increase with the share for both modes increasing by 1.5 percentage
points. The actual number of onward journeys by pedal cycle increased by almost 400 per cent
between the two survey years. Note that, as Table 3.1 shows, the number of onward journeys
increased across all modes with the exception of car and taxi.
Home7%
Usual Workplace76%
Other work9%
Education2%
Leisure3%
Shopping1%
Other2%
Central London Rail Termini
42
Figure 3.7 Comparison of mode share of onward journeys
Source: Central London Rail Termini Surveys 2010
Table 3.1 Comparison of onward journeys by mode
Mode 2001 2010
Bus 76,000 104,600
Car 6,100 5,200
Pedal cycle 3,900 19,200
Taxi 14,600 12,700
Underground & DLR 371,200 425,800
Walk 341,100 380,100
Other 1,000 10,900
All modes 813,900 958,600
Source: Central London Rail Termini Surveys 2010
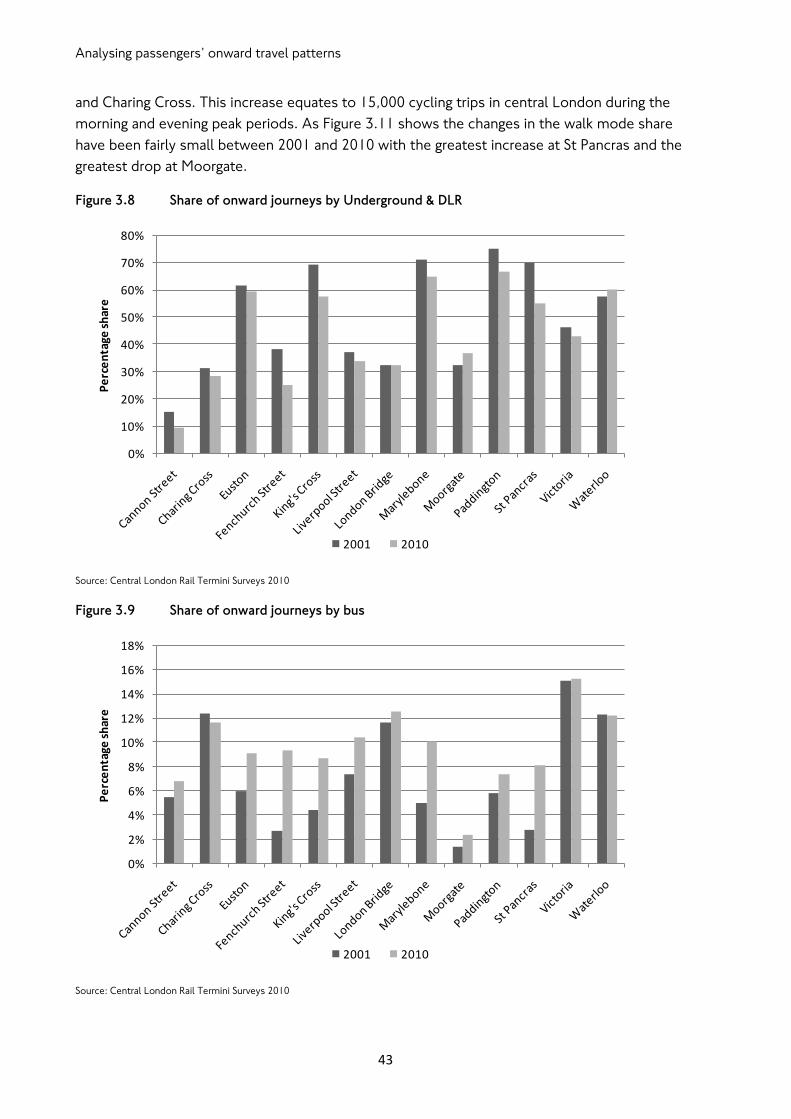
These modest changes in the overall mode share for onward journeys cover a greater variation
in the changes seen at different stations. Figure 3.8 shows the changes in the share of onward
journeys by Underground between 2001 and 2010 by station. The stations where the greatest
declines were observed are Fenchurch Street, St Pancras, King‟s Cross, Paddington and
Marylebone. Some of these stations – St Pancras, Fenchurch Street and King‟s Cross – saw a
significant increase in the share of onward journeys made by bus (see Figure 3.9). Other stations
with significant increases in the use of bus for onward journeys include Moorgate, Cannon Street
and Liverpool Street.
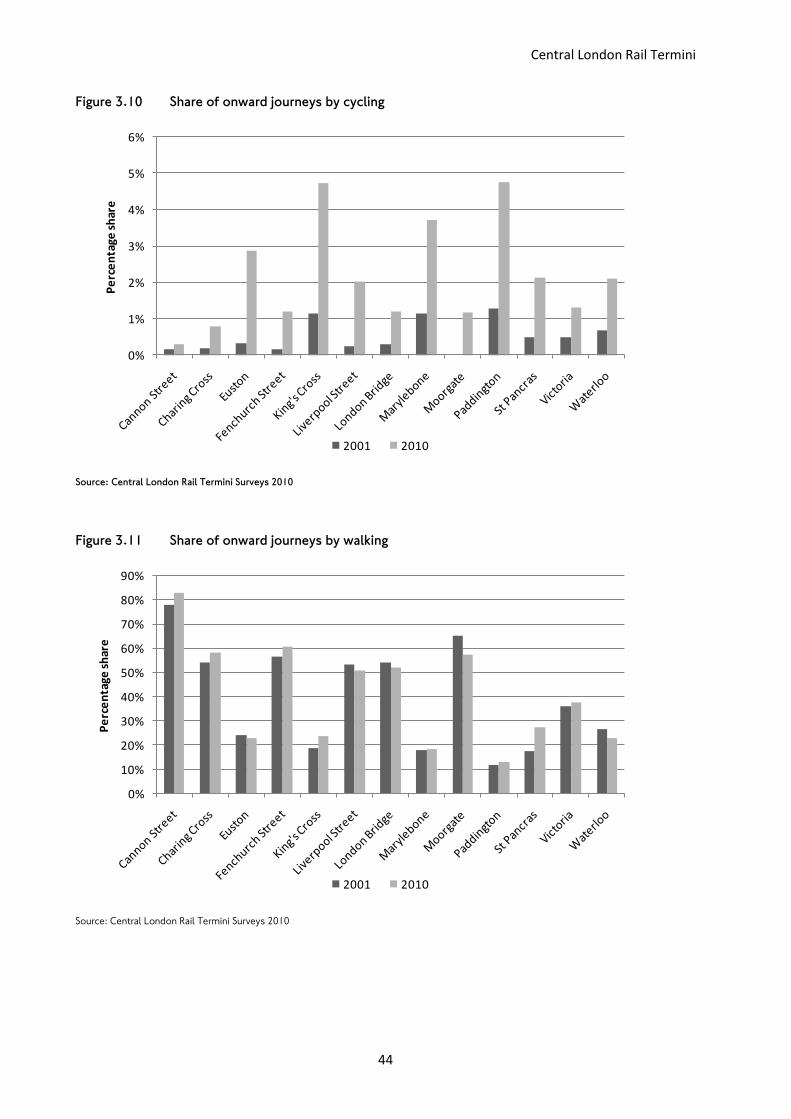
Although the cycle mode share was fairly small in both survey years some stations saw a
significant increase in the use of cycling as an onward mode. Figure 3.10 shows that the stations
with the greatest growth in cycling mode share are Moorgate, Fenchurch Street, London Bridge
0%
5%
10%
15%
20%
25%
30%
35%
40%
45%
50%
2001 2010
Analysing passengers‟ onward travel patterns
43
and Charing Cross. This increase equates to 15,000 cycling trips in central London during the
morning and evening peak periods. As Figure 3.11 shows the changes in the walk mode share
have been fairly small between 2001 and 2010 with the greatest increase at St Pancras and the
greatest drop at Moorgate.
Figure 3.8 Share of onward journeys by Underground & DLR
Source: Central London Rail Termini Surveys 2010
Figure 3.9 Share of onward journeys by bus
Source: Central London Rail Termini Surveys 2010
0%
10%
20%
30%
40%
50%
60%
70%
80%
Pe
rce
nta
ge s
har
e
2001 2010
0%
2%
4%
6%
8%
10%
12%
14%
16%
18%
Pe
rce
nta
ge s
har
e
2001 2010
Central London Rail Termini
44
Figure 3.10 Share of onward journeys by cycling
Source: Central London Rail Termini Surveys 2010
Figure 3.11 Share of onward journeys by walking
Source: Central London Rail Termini Surveys 2010
0%
1%
2%
3%
4%
5%
6%
Pe
rce
nta
ge s
har
e
2001 2010
0%
10%
20%
30%
40%
50%
60%
70%
80%
90%
Pe
rce
nta
ge s
har
e
2001 2010
Analysing passengers‟ onward travel patterns
45
Chapter 4 How do Londoners’ travel patterns differ from those of non-Londoners?
This chapter describes travel characteristics of passengers travelling between the central
London termini stations and locations outside the GLA boundary. It describes the
characteristics of rail journeys made and of the people making those journeys and explores any
key differences between Londoners – people starting or ending their journey inside Greater
London – and non-Londoners – people who travel between the central London termini and
stations outside the GLA boundary.
Overview of travel to or from outside Greater London
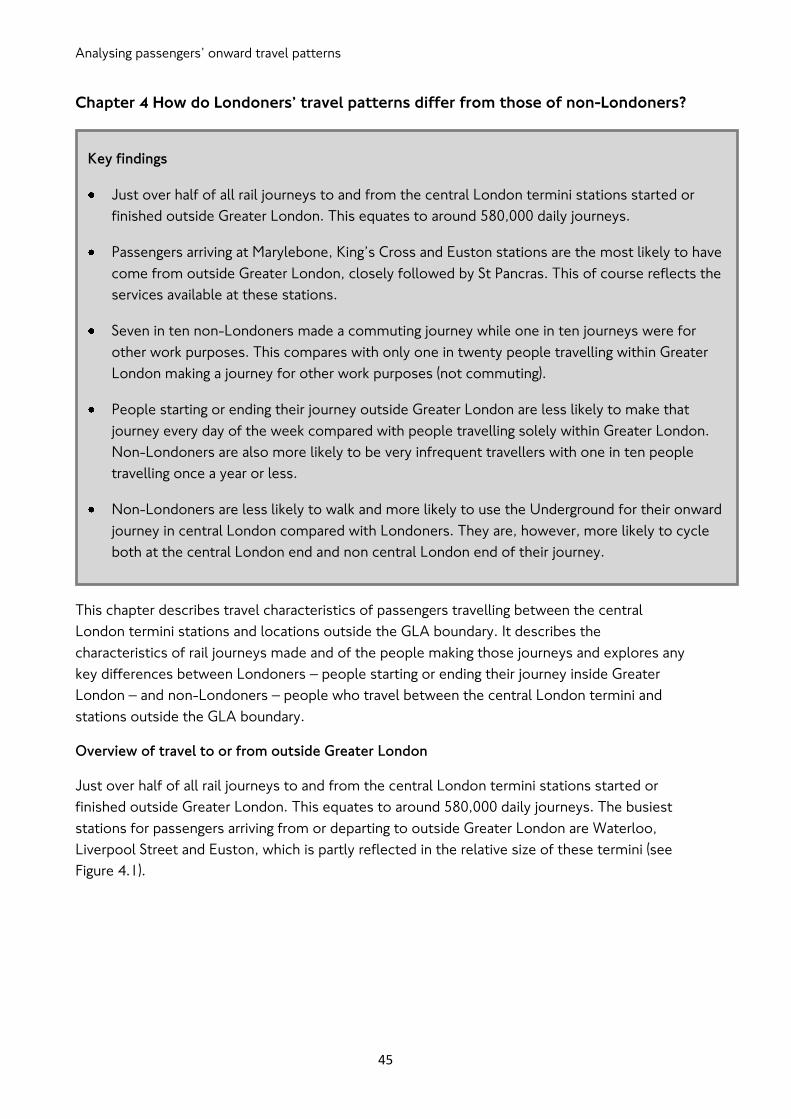
Just over half of all rail journeys to and from the central London termini stations started or
finished outside Greater London. This equates to around 580,000 daily journeys. The busiest
stations for passengers arriving from or departing to outside Greater London are Waterloo,
Liverpool Street and Euston, which is partly reflected in the relative size of these termini (see
Figure 4.1).
Key findings
Just over half of all rail journeys to and from the central London termini stations started or
finished outside Greater London. This equates to around 580,000 daily journeys.
Passengers arriving at Marylebone, King‟s Cross and Euston stations are the most likely to have
come from outside Greater London, closely followed by St Pancras. This of course reflects the
services available at these stations.
Seven in ten non-Londoners made a commuting journey while one in ten journeys were for
other work purposes. This compares with only one in twenty people travelling within Greater
London making a journey for other work purposes (not commuting).
People starting or ending their journey outside Greater London are less likely to make that
journey every day of the week compared with people travelling solely within Greater London.
Non-Londoners are also more likely to be very infrequent travellers with one in ten people
travelling once a year or less.
Non-Londoners are less likely to walk and more likely to use the Underground for their onward
journey in central London compared with Londoners. They are, however, more likely to cycle
both at the central London end and non central London end of their journey.
Central London Rail Termini
46
Figure 4.1 Passengers travelling between central London termini stations and stations outside
Greater London
Source: Central London Rail Termini Surveys 2010
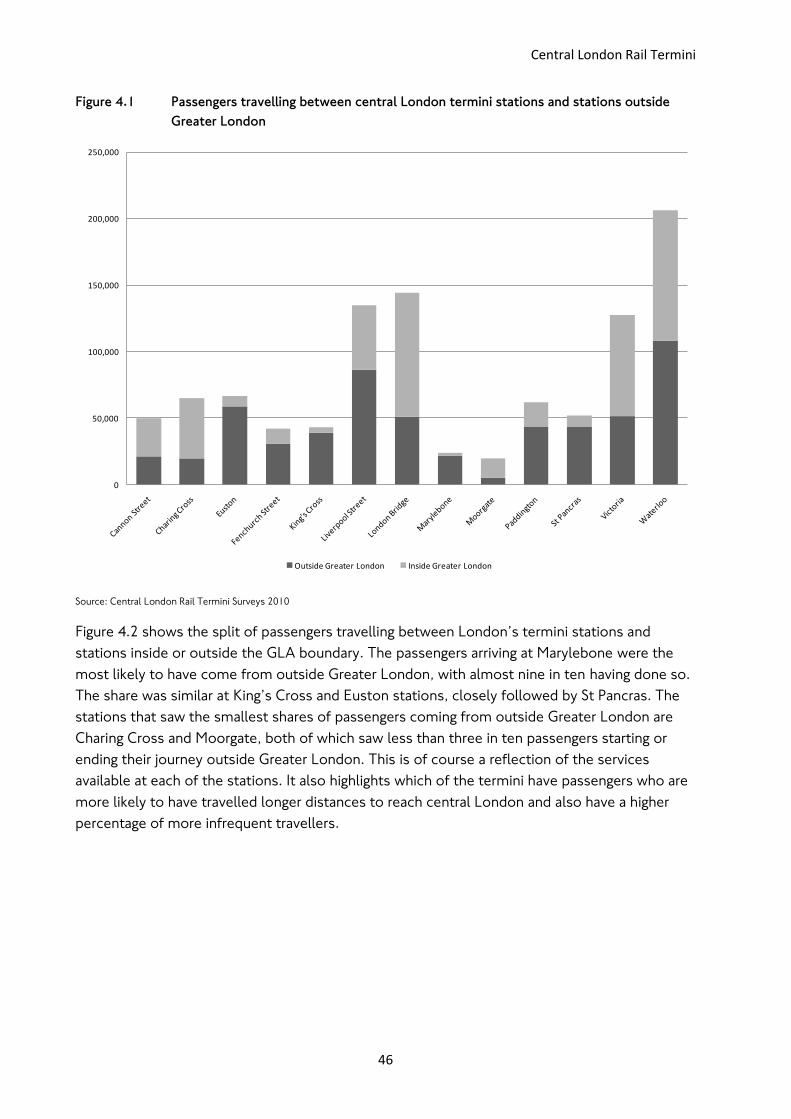
Figure 4.2 shows the split of passengers travelling between London‟s termini stations and
stations inside or outside the GLA boundary. The passengers arriving at Marylebone were the
most likely to have come from outside Greater London, with almost nine in ten having done so.
The share was similar at King‟s Cross and Euston stations, closely followed by St Pancras. The
stations that saw the smallest shares of passengers coming from outside Greater London are
Charing Cross and Moorgate, both of which saw less than three in ten passengers starting or
ending their journey outside Greater London. This is of course a reflection of the services
available at each of the stations. It also highlights which of the termini have passengers who are
more likely to have travelled longer distances to reach central London and also have a higher
percentage of more infrequent travellers.
0
50,000
100,000
150,000
200,000
250,000
Outside Greater London Inside Greater London
Analysing passengers‟ onward travel patterns
47
Figure 4.2 Passengers with origins or destinations inside or outside Greater London
Source: Central London Rail Termini Surveys 2010
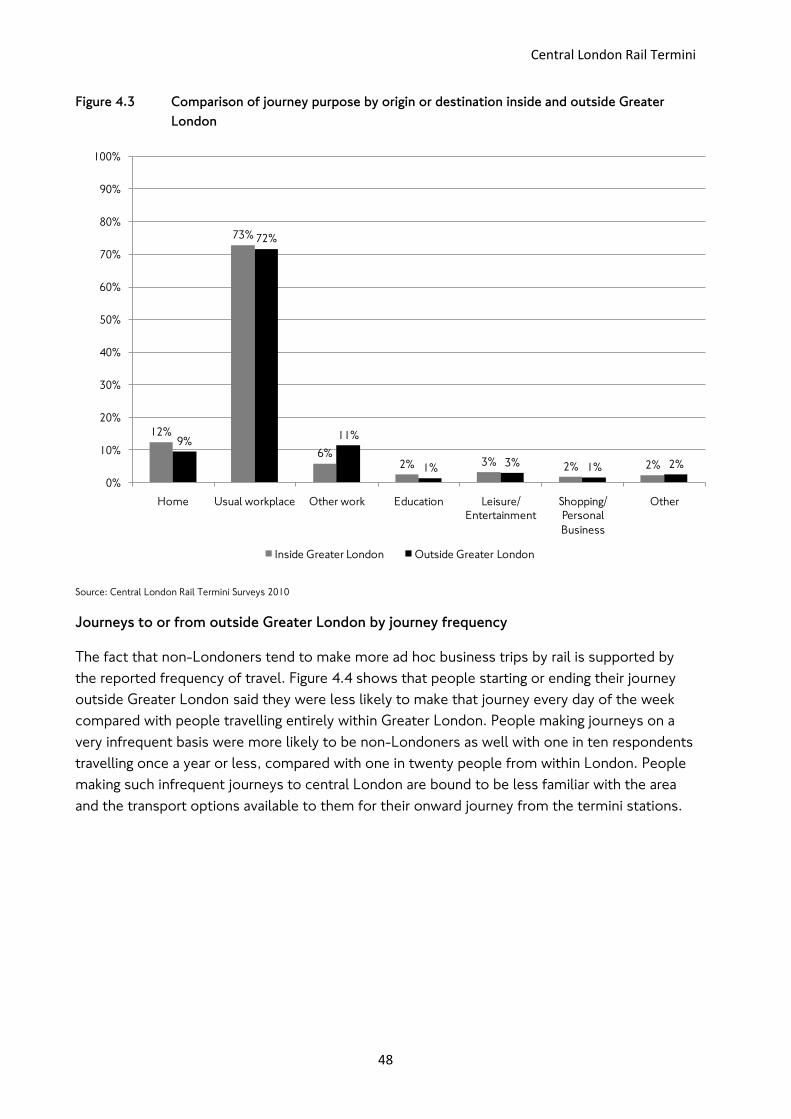
Journeys to or from outside Greater London by journey purpose
The majority of onward journeys made by non-Londoners, seven in ten, were for commuting
purposes while one in ten journeys were for other work. The latter was higher for non
Londoners compared with people travelling solely within Greater London, with only one in
twenty having made a journey for other work purposes. As Figure 4.3 shows there was very little
difference between people from inside or outside Greater London in relation to all other journey
purposes.
58%
70%
11%
28%
10%
35%
62%
10%
72%
29%
16%
57%
47%43%
42%
30%
87%
71%
87%
63%
34%
89%
27%
70%
84%
38%52%
55%
0%
10%
20%
30%
40%
50%
60%
70%
80%
90%
100%
Cannon
Street
Charing
Cross
Euston Fenchurch
Street
King's Cross Liverpool
Street
London
Bridge
Marylebone Moorgate Paddington St Pancras Victoria Waterloo All Stations
Inside Greater London Outside Greater London Unknown
Central London Rail Termini
48
Figure 4.3 Comparison of journey purpose by origin or destination inside and outside Greater
London
Source: Central London Rail Termini Surveys 2010
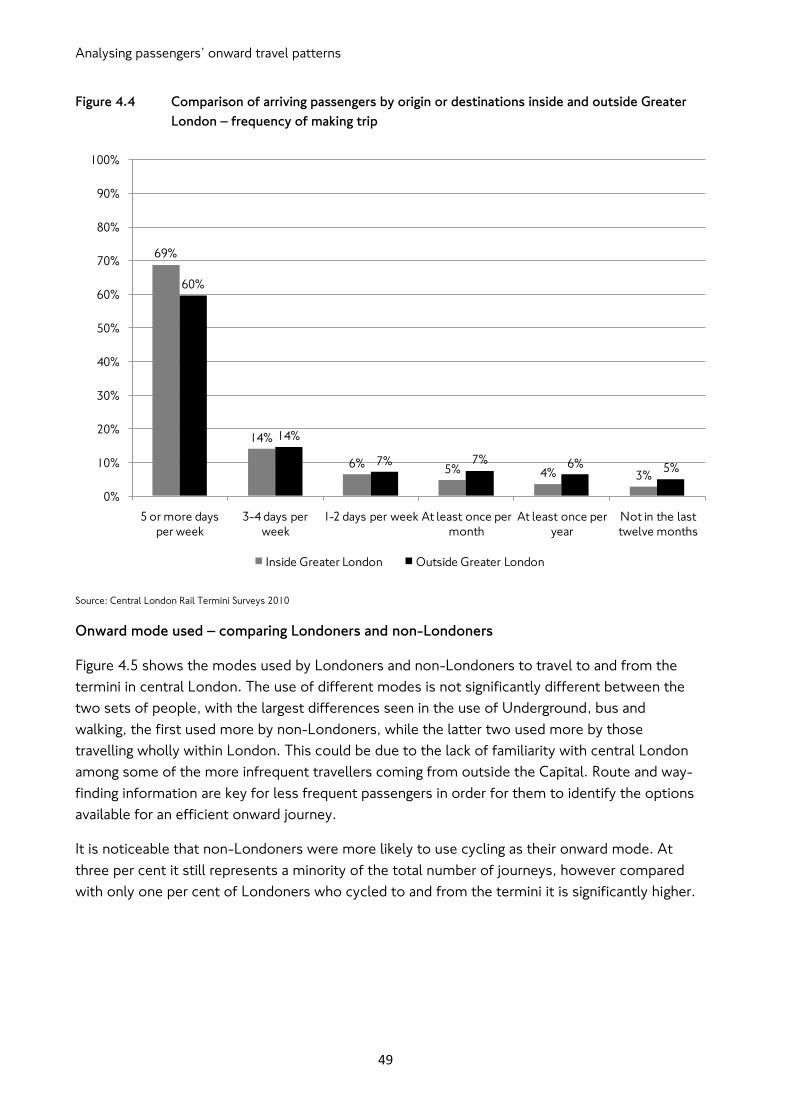
Journeys to or from outside Greater London by journey frequency
The fact that non-Londoners tend to make more ad hoc business trips by rail is supported by
the reported frequency of travel. Figure 4.4 shows that people starting or ending their journey
outside Greater London said they were less likely to make that journey every day of the week
compared with people travelling entirely within Greater London. People making journeys on a
very infrequent basis were more likely to be non-Londoners as well with one in ten respondents
travelling once a year or less, compared with one in twenty people from within London. People
making such infrequent journeys to central London are bound to be less familiar with the area
and the transport options available to them for their onward journey from the termini stations.
12%
73%
6%2% 3% 2% 2%
9%
72%
11%
1% 3% 1% 2%
0%
10%
20%
30%
40%
50%
60%
70%
80%
90%
100%
Home Usual workplace Other work Education Leisure/
Entertainment
Shopping/
Personal
Business
Other
Inside Greater London Outside Greater London
Analysing passengers‟ onward travel patterns
49
Figure 4.4 Comparison of arriving passengers by origin or destinations inside and outside Greater
London – frequency of making trip
Source: Central London Rail Termini Surveys 2010
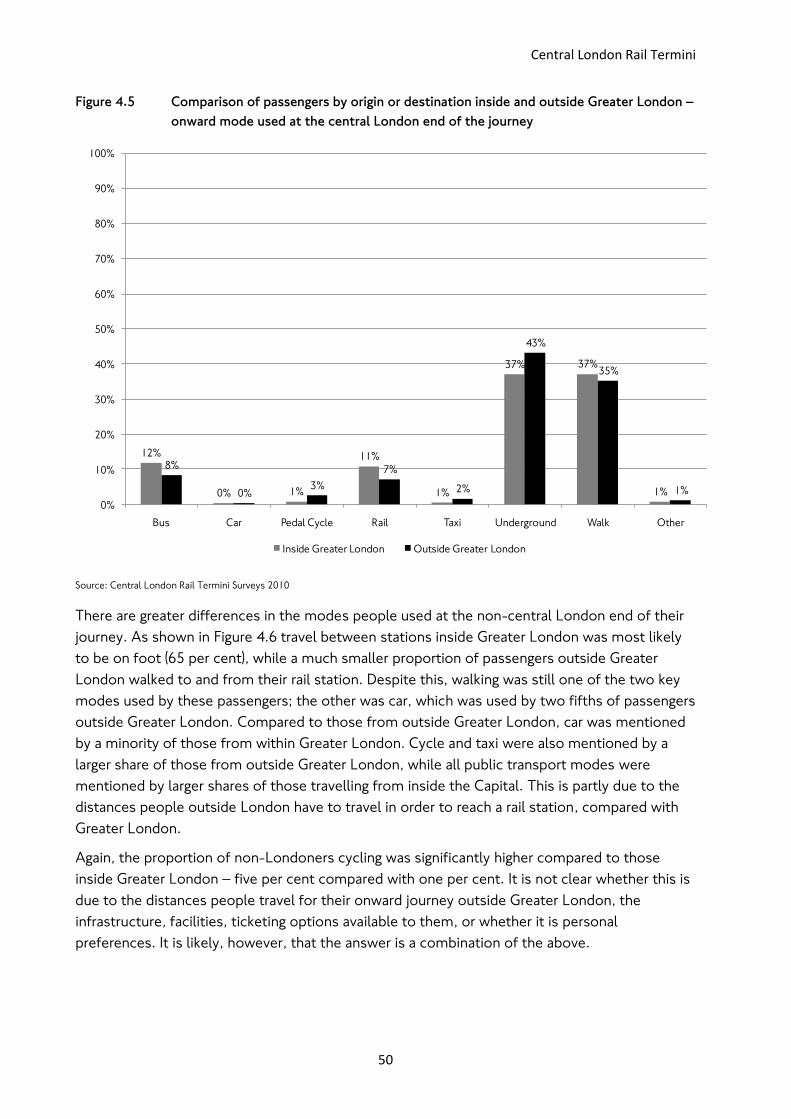
Onward mode used – comparing Londoners and non-Londoners
Figure 4.5 shows the modes used by Londoners and non-Londoners to travel to and from the
termini in central London. The use of different modes is not significantly different between the
two sets of people, with the largest differences seen in the use of Underground, bus and
walking, the first used more by non-Londoners, while the latter two used more by those
travelling wholly within London. This could be due to the lack of familiarity with central London
among some of the more infrequent travellers coming from outside the Capital. Route and way-
finding information are key for less frequent passengers in order for them to identify the options
available for an efficient onward journey.
It is noticeable that non-Londoners were more likely to use cycling as their onward mode. At
three per cent it still represents a minority of the total number of journeys, however compared
with only one per cent of Londoners who cycled to and from the termini it is significantly higher.
69%
14%
6% 5% 4% 3%
60%
14%
7% 7% 6% 5%
0%
10%
20%
30%
40%
50%
60%
70%
80%
90%
100%
5 or more days
per week
3-4 days per
week
1-2 days per week At least once per
month
At least once per
year
Not in the last
twelve months
Inside Greater London Outside Greater London
Central London Rail Termini
50
Figure 4.5 Comparison of passengers by origin or destination inside and outside Greater London –
onward mode used at the central London end of the journey
Source: Central London Rail Termini Surveys 2010
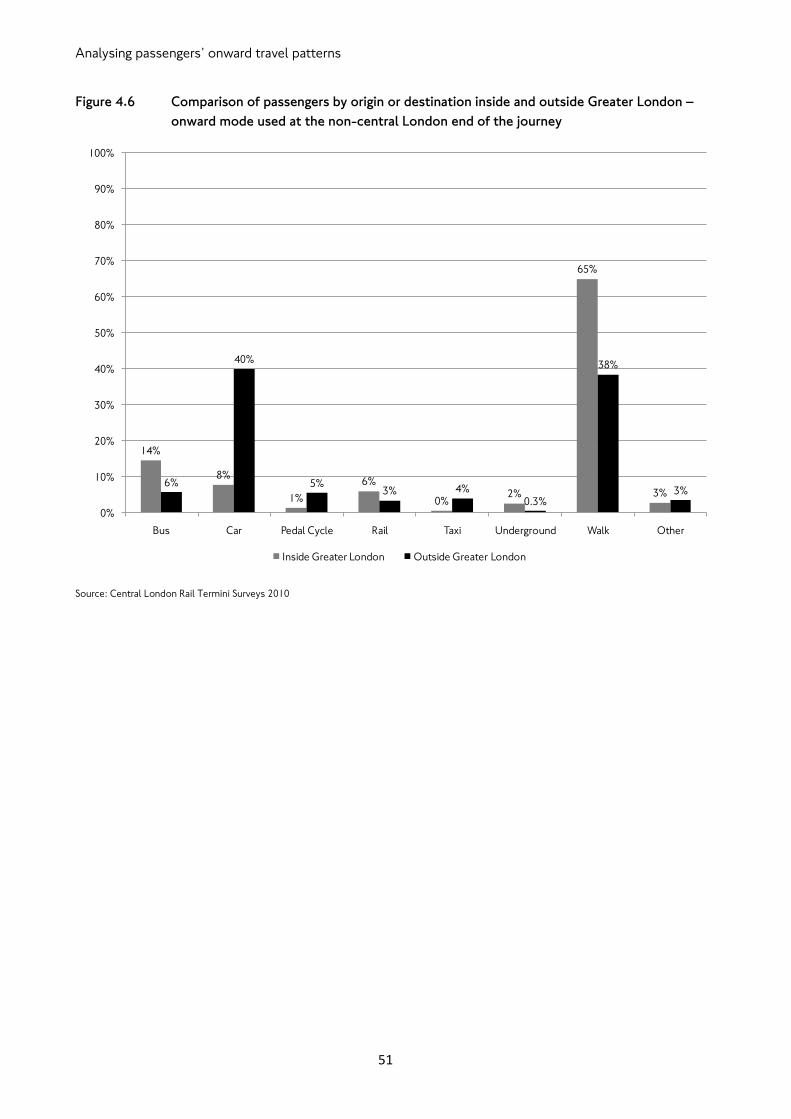
There are greater differences in the modes people used at the non-central London end of their
journey. As shown in Figure 4.6 travel between stations inside Greater London was most likely
to be on foot (65 per cent), while a much smaller proportion of passengers outside Greater
London walked to and from their rail station. Despite this, walking was still one of the two key
modes used by these passengers; the other was car, which was used by two fifths of passengers
outside Greater London. Compared to those from outside Greater London, car was mentioned
by a minority of those from within Greater London. Cycle and taxi were also mentioned by a
larger share of those from outside Greater London, while all public transport modes were
mentioned by larger shares of those travelling from inside the Capital. This is partly due to the
distances people outside London have to travel in order to reach a rail station, compared with
Greater London.
Again, the proportion of non-Londoners cycling was significantly higher compared to those
inside Greater London – five per cent compared with one per cent. It is not clear whether this is
due to the distances people travel for their onward journey outside Greater London, the
infrastructure, facilities, ticketing options available to them, or whether it is personal
preferences. It is likely, however, that the answer is a combination of the above.
12%
0% 1%
11%
1%
37% 37%
1%
8%
0%3%
7%
2%
43%
35%
1%
0%
10%
20%
30%
40%
50%
60%
70%
80%
90%
100%
Bus Car Pedal Cycle Rail Taxi Underground Walk Other
Inside Greater London Outside Greater London
Analysing passengers‟ onward travel patterns
51
Figure 4.6 Comparison of passengers by origin or destination inside and outside Greater London –
onward mode used at the non-central London end of the journey
Source: Central London Rail Termini Surveys 2010
14%
8%
1%
6%
0%2%
65%
3%6%
40%
5%3% 4%
0.3%
38%
3%
0%
10%
20%
30%
40%
50%
60%
70%
80%
90%
100%
Bus Car Pedal Cycle Rail Taxi Underground Walk Other
Inside Greater London Outside Greater London
Central London Rail Termini
52
Chapter 5 Travel patterns outside central London
This chapter describes travel patterns of passengers travelling through central London termini
stations at the non-central London end of their journey. The first section gives a general
overview of all journeys involving a non-central station within Greater London while the second
section provides key statistics for journeys involving each of the five busiest non-central
stations; East Croydon, Clapham Junction, Surbiton, Wimbledon and Putney. Note that these
are the busiest stations purely in terms of volumes of rail passengers travelling between these
stations and the central London Rail termini and exclude interchange between rail services.
Around 38 per cent of rail journeys to/from central London termini stations originate or
terminate at rail stations within the GLA boundary. This is over 400,000 rail journeys daily. In
total the busiest five stations handle around 57,000 National Rail passengers travelling to or
from the central London rail termini, equating to 14 per cent of total rail passengers within the
Greater London Area. The remainder are distributed across just over 290 rail stations
throughout London.
Key findings
Around 40 per cent (400,000) of the rail journeys to or from central London termini stations
during weekday peak periods have a start or end point within the GLA boundary.
Over 80 per cent of journeys are between home and work (usual workplace or other work) in
central London while one in ten journeys have work at the non central London end.
The most popular onward mode at the non-central London end of the journey is walk,
followed by bus. The mode share for car is nine per cent at the non central London end but is
negligible as an onward mode at the central London termini. Conversely Underground, which is
the most popular onward mode in central London, is used by just one per cent of people to
access the non central London rail station.
Walking and cycling are more popular at the non-central London end of the journey with
people more likely to have ever walked or cycled outside central London for their onward
journey. Those who ever walk or cycle are also more likely to do so more frequently outside
central London.
The five busiest non-central stations (based on the number of trips between these stations and
the central London termini) are East Croydon, Clapham Junction, Surbiton, Wimbledon and
Putney which handle 57,000 passengers travelling to or from central London rail termini. This is
for rail trips originating or ending at those stations and excludes interchange between rail
services.
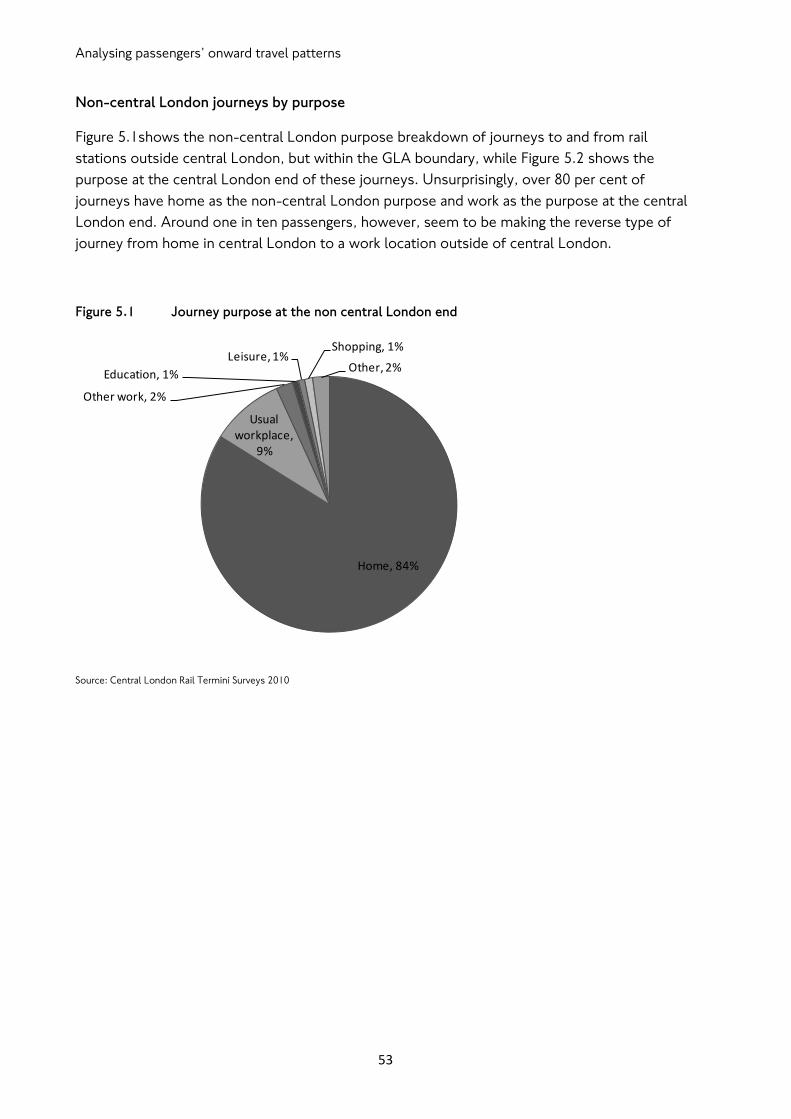
Analysing passengers‟ onward travel patterns
53
Non-central London journeys by purpose
Figure 5.1shows the non-central London purpose breakdown of journeys to and from rail
stations outside central London, but within the GLA boundary, while Figure 5.2 shows the
purpose at the central London end of these journeys. Unsurprisingly, over 80 per cent of
journeys have home as the non-central London purpose and work as the purpose at the central
London end. Around one in ten passengers, however, seem to be making the reverse type of
journey from home in central London to a work location outside of central London.
Figure 5.1 Journey purpose at the non central London end
Source: Central London Rail Termini Surveys 2010
Home, 84%
Usual workplace,
9%
Other work, 2%
Education, 1%
Leisure, 1%Shopping, 1%
Other, 2%

Central London Rail Termini
54
Figure 5.2 Journey purpose at the central London end
Source: Central London Rail Termini Surveys 2010
Onward mode at the non-central London end
Figure 5.3 shows the breakdown of mode used to access/egress all non-central London rail
stations within Greater London, compared with the modes used by the same people for their
onward journey at the central London termini.
The use of different modes varies significantly between the two ends. Around two thirds of
passengers walk at the non-central London end of their journey, compared with around 38 per
cent of those at the central London end. The proportions of people travelling by bus at either
end of the journey are similar. Nine per cent of people travel by car to access their non-central
London station while the use of car as an onward journey mode does not feature at all in central
London. Conversely the use of Underground at the non-central London end is negligible while
39 per cent of onward journeys are by Underground in central London.
Home, 9%
Usual workplace, 76%
Other work, 6%
Education, 2%
Leisure, 3%Shopping, 1%
Other, 2%
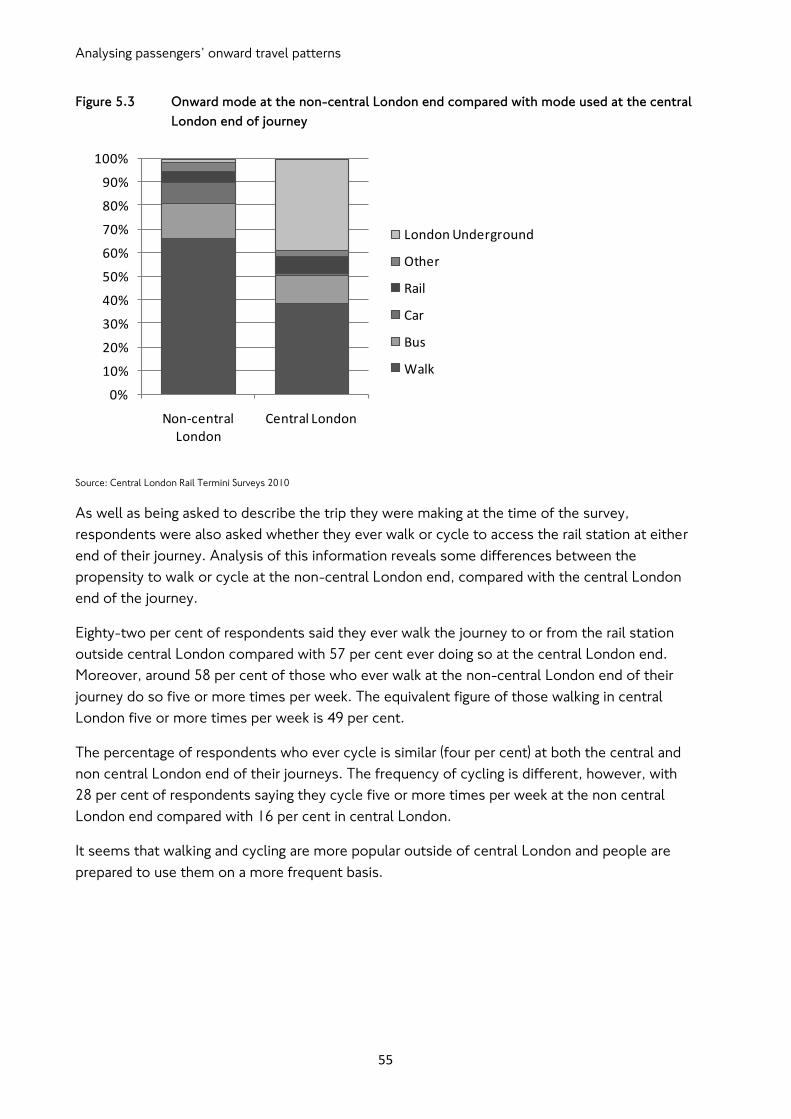
Analysing passengers‟ onward travel patterns
55
Figure 5.3 Onward mode at the non-central London end compared with mode used at the central
London end of journey
Source: Central London Rail Termini Surveys 2010
As well as being asked to describe the trip they were making at the time of the survey,
respondents were also asked whether they ever walk or cycle to access the rail station at either
end of their journey. Analysis of this information reveals some differences between the
propensity to walk or cycle at the non-central London end, compared with the central London
end of the journey.
Eighty-two per cent of respondents said they ever walk the journey to or from the rail station
outside central London compared with 57 per cent ever doing so at the central London end.
Moreover, around 58 per cent of those who ever walk at the non-central London end of their
journey do so five or more times per week. The equivalent figure of those walking in central
London five or more times per week is 49 per cent.
The percentage of respondents who ever cycle is similar (four per cent) at both the central and
non central London end of their journeys. The frequency of cycling is different, however, with
28 per cent of respondents saying they cycle five or more times per week at the non central
London end compared with 16 per cent in central London.
It seems that walking and cycling are more popular outside of central London and people are
prepared to use them on a more frequent basis.
0%
10%
20%
30%
40%
50%
60%
70%
80%
90%
100%
Non-central London
Central London
London Underground
Other
Rail
Car
Bus
Walk
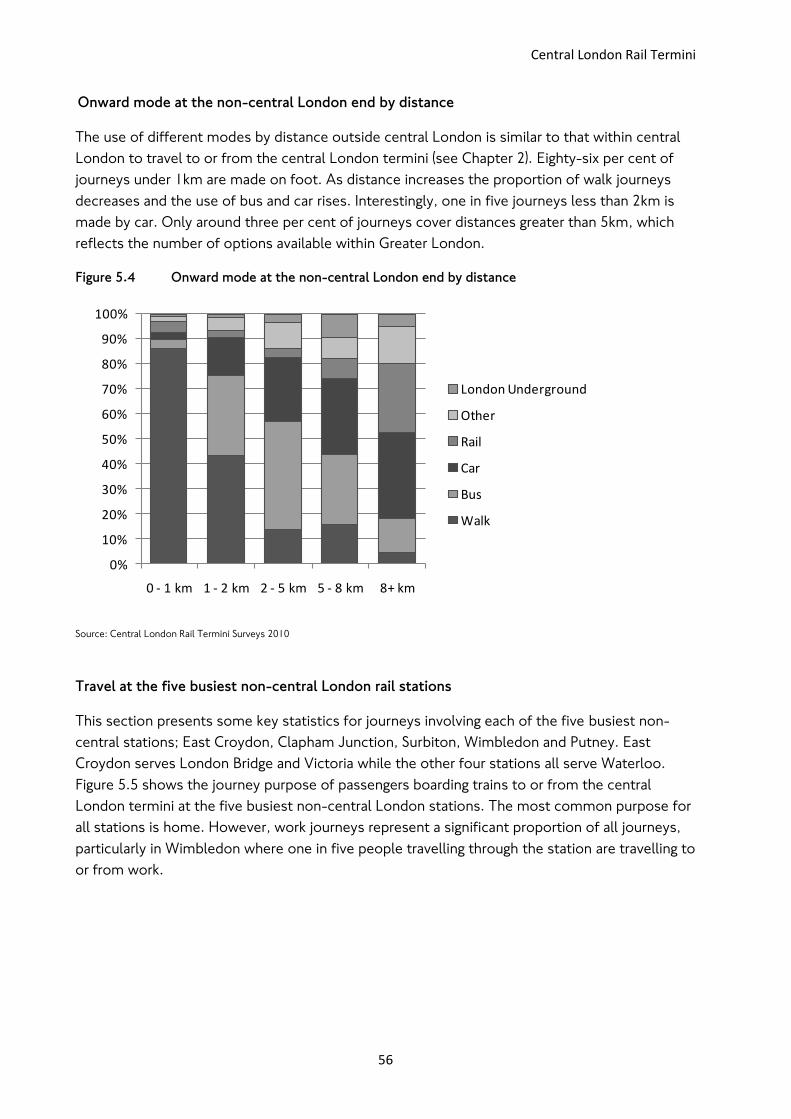
Central London Rail Termini
56
Onward mode at the non-central London end by distance
The use of different modes by distance outside central London is similar to that within central
London to travel to or from the central London termini (see Chapter 2). Eighty-six per cent of
journeys under 1km are made on foot. As distance increases the proportion of walk journeys
decreases and the use of bus and car rises. Interestingly, one in five journeys less than 2km is
made by car. Only around three per cent of journeys cover distances greater than 5km, which
reflects the number of options available within Greater London.
Figure 5.4 Onward mode at the non-central London end by distance
Source: Central London Rail Termini Surveys 2010
Travel at the five busiest non-central London rail stations
This section presents some key statistics for journeys involving each of the five busiest non-
central stations; East Croydon, Clapham Junction, Surbiton, Wimbledon and Putney. East
Croydon serves London Bridge and Victoria while the other four stations all serve Waterloo.
Figure 5.5 shows the journey purpose of passengers boarding trains to or from the central
London termini at the five busiest non-central London stations. The most common purpose for
all stations is home. However, work journeys represent a significant proportion of all journeys,
particularly in Wimbledon where one in five people travelling through the station are travelling to
or from work.
0%
10%
20%
30%
40%
50%
60%
70%
80%
90%
100%
0 - 1 km 1 - 2 km 2 - 5 km 5 - 8 km 8+ km
London Underground
Other
Rail
Car
Bus
Walk
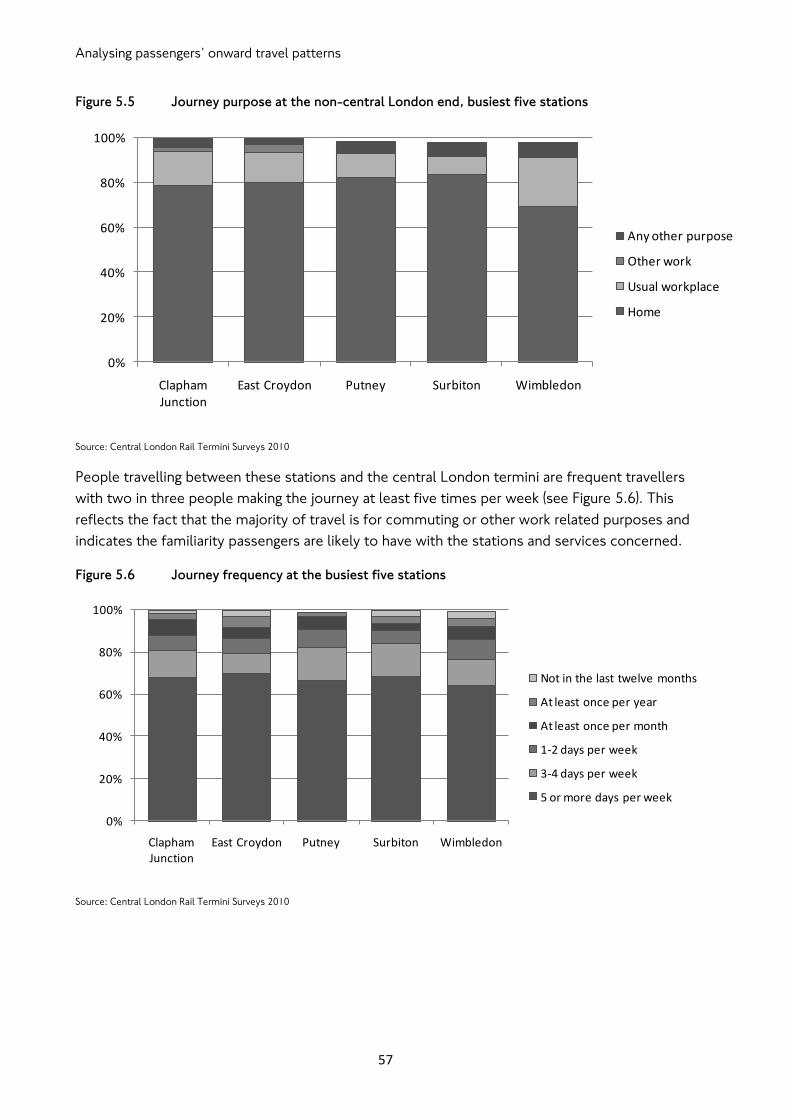
Analysing passengers‟ onward travel patterns
57
Figure 5.5 Journey purpose at the non-central London end, busiest five stations
Source: Central London Rail Termini Surveys 2010
People travelling between these stations and the central London termini are frequent travellers
with two in three people making the journey at least five times per week (see Figure 5.6). This
reflects the fact that the majority of travel is for commuting or other work related purposes and
indicates the familiarity passengers are likely to have with the stations and services concerned.
Figure 5.6 Journey frequency at the busiest five stations
Source: Central London Rail Termini Surveys 2010
0%
20%
40%
60%
80%
100%
Clapham Junction
East Croydon Putney Surbiton Wimbledon
Any other purpose
Other work
Usual workplace
Home
0%
20%
40%
60%
80%
100%
Clapham Junction
East Croydon Putney Surbiton Wimbledon
Not in the last twelve months
At least once per year
At least once per month
1-2 days per week
3-4 days per week
5 or more days per week
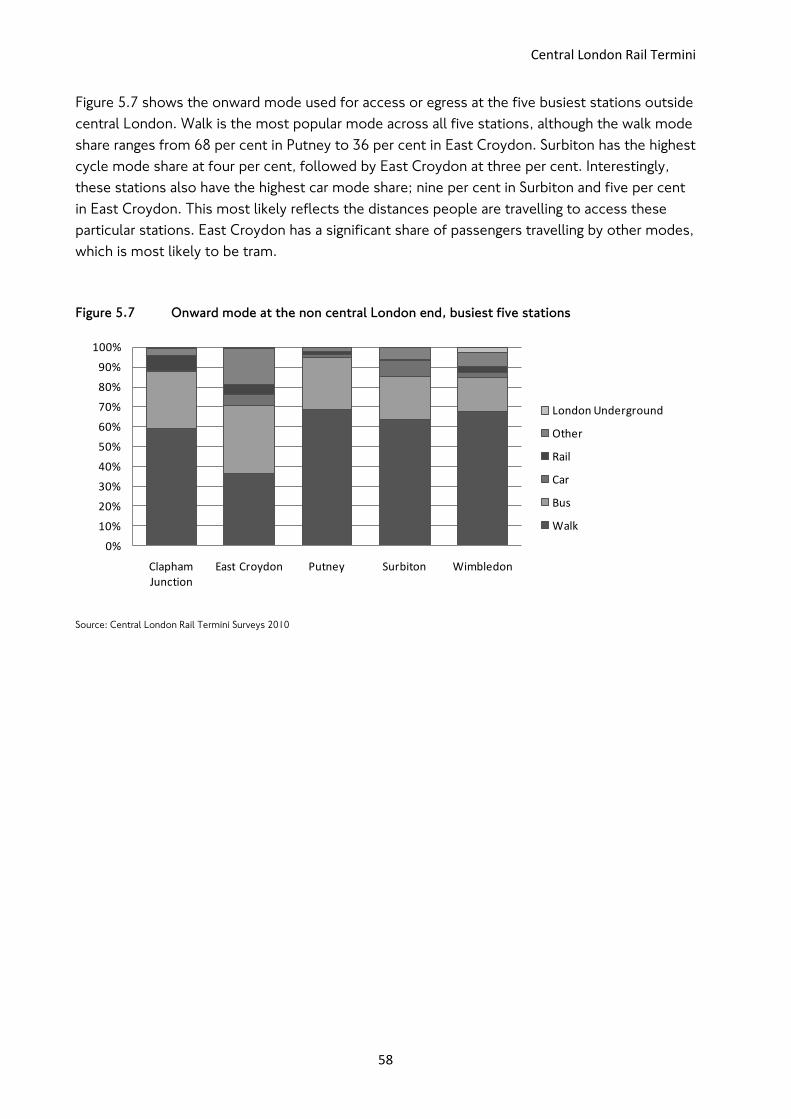
Central London Rail Termini
58
Figure 5.7 shows the onward mode used for access or egress at the five busiest stations outside
central London. Walk is the most popular mode across all five stations, although the walk mode
share ranges from 68 per cent in Putney to 36 per cent in East Croydon. Surbiton has the highest
cycle mode share at four per cent, followed by East Croydon at three per cent. Interestingly,
these stations also have the highest car mode share; nine per cent in Surbiton and five per cent
in East Croydon. This most likely reflects the distances people are travelling to access these
particular stations. East Croydon has a significant share of passengers travelling by other modes,
which is most likely to be tram.
Figure 5.7 Onward mode at the non central London end, busiest five stations
Source: Central London Rail Termini Surveys 2010
0%
10%
20%
30%
40%
50%
60%
70%
80%
90%
100%
Clapham Junction
East Croydon Putney Surbiton Wimbledon
London Underground
Other
Rail
Car
Bus
Walk

Analysing passengers‟ onward travel patterns
59
Chapter 6 Opportunities for walking
This chapter describes onward travel patterns to and from central London rail termini. It
describes the nature and extent of walk travel between rail stations and journey origins and
destinations, the characteristics of journeys made and of the people making them, and also
seeks to identify the potential for increasing walking for this purpose.
Key findings
At present, 36 per cent of journeys to and from central London rail termini are walked,
amounting to 380,000 walk journeys during the peak periods.
The walk mode share ranges from 80 per cent at Cannon Street to 12 per cent at St Pancras
and largely reflects the average distances travelled for onward journeys. Ninety-one per cent of
onward journeys shorter than 1km and 55 per cent of those between 1 and 2km are walked.
Ninety-five per cent of onward walk journeys are made for work purposes and just over half
those making an onward walk journey had travelled into central London from outside the GLA
area.
Half of the respondents said that they ever walk their onward journey; 72 per cent of those
who said they ever walk had walked on the survey day.
Analysis was carried out to identify journeys less than 2km that are currently made by a
mechanised mode but could potentially be walked. In total, 123,200 potentially walkable
journeys were identified; 12 per cent of journeys by all modes and 19 per cent of journeys by
mechanised modes. Fifty per cent of these journeys were between 1.5 and 2km, the upper
limit of what is considered potentially walkable.
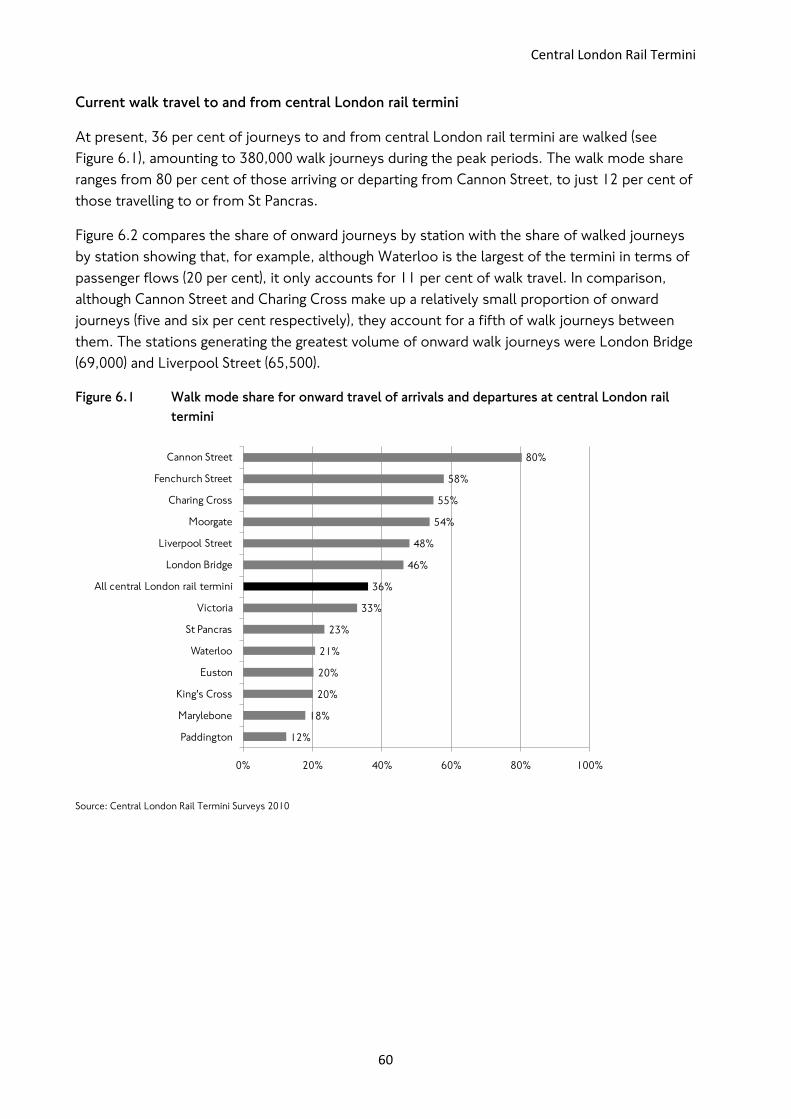
Central London Rail Termini
60
Current walk travel to and from central London rail termini
At present, 36 per cent of journeys to and from central London rail termini are walked (see
Figure 6.1), amounting to 380,000 walk journeys during the peak periods. The walk mode share
ranges from 80 per cent of those arriving or departing from Cannon Street, to just 12 per cent of
those travelling to or from St Pancras.
Figure 6.2 compares the share of onward journeys by station with the share of walked journeys
by station showing that, for example, although Waterloo is the largest of the termini in terms of
passenger flows (20 per cent), it only accounts for 11 per cent of walk travel. In comparison,
although Cannon Street and Charing Cross make up a relatively small proportion of onward
journeys (five and six per cent respectively), they account for a fifth of walk journeys between
them. The stations generating the greatest volume of onward walk journeys were London Bridge
(69,000) and Liverpool Street (65,500).
Figure 6.1 Walk mode share for onward travel of arrivals and departures at central London rail
termini
Source: Central London Rail Termini Surveys 2010
12%
18%
20%
20%
21%
23%
33%
36%
46%
48%
54%
55%
58%
80%
0% 20% 40% 60% 80% 100%
Paddington
Marylebone
King's Cross
Euston
Waterloo
St Pancras
Victoria
All central London rail termini
London Bridge
Liverpool Street
Moorgate
Charing Cross
Fenchurch Street
Cannon Street
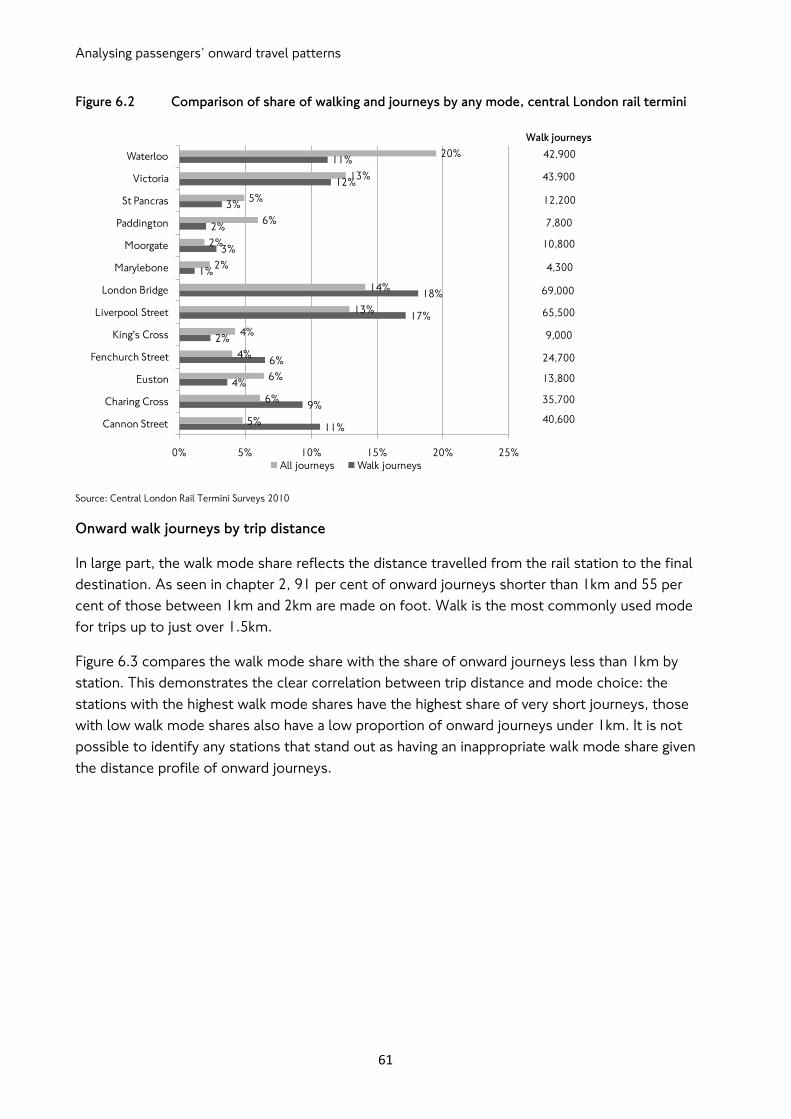
Analysing passengers‟ onward travel patterns
61
Figure 6.2 Comparison of share of walking and journeys by any mode, central London rail termini
Source: Central London Rail Termini Surveys 2010
Onward walk journeys by trip distance
In large part, the walk mode share reflects the distance travelled from the rail station to the final
destination. As seen in chapter 2, 91 per cent of onward journeys shorter than 1km and 55 per
cent of those between 1km and 2km are made on foot. Walk is the most commonly used mode
for trips up to just over 1.5km.
Figure 6.3 compares the walk mode share with the share of onward journeys less than 1km by
station. This demonstrates the clear correlation between trip distance and mode choice: the
stations with the highest walk mode shares have the highest share of very short journeys, those
with low walk mode shares also have a low proportion of onward journeys under 1km. It is not
possible to identify any stations that stand out as having an inappropriate walk mode share given
the distance profile of onward journeys.
11%
9%
4%
6%
2%
17%
18%
1%
3%
2%
3%
12%
11%
5%
6%
6%
4%
4%
13%
14%
2%
2%
6%
5%
13%
20%
0% 5% 10% 15% 20% 25%
Cannon Street
Charing Cross
Euston
Fenchurch Street
King's Cross
Liverpool Street
London Bridge
Marylebone
Moorgate
Paddington
St Pancras
Victoria
Waterloo
All journeys Walk journeys
Walk journeys
42,900
40,600
24,700
9,000
65,500
69,000
4,300
10,800
7,800
12,200
43.900
35,700
13,800
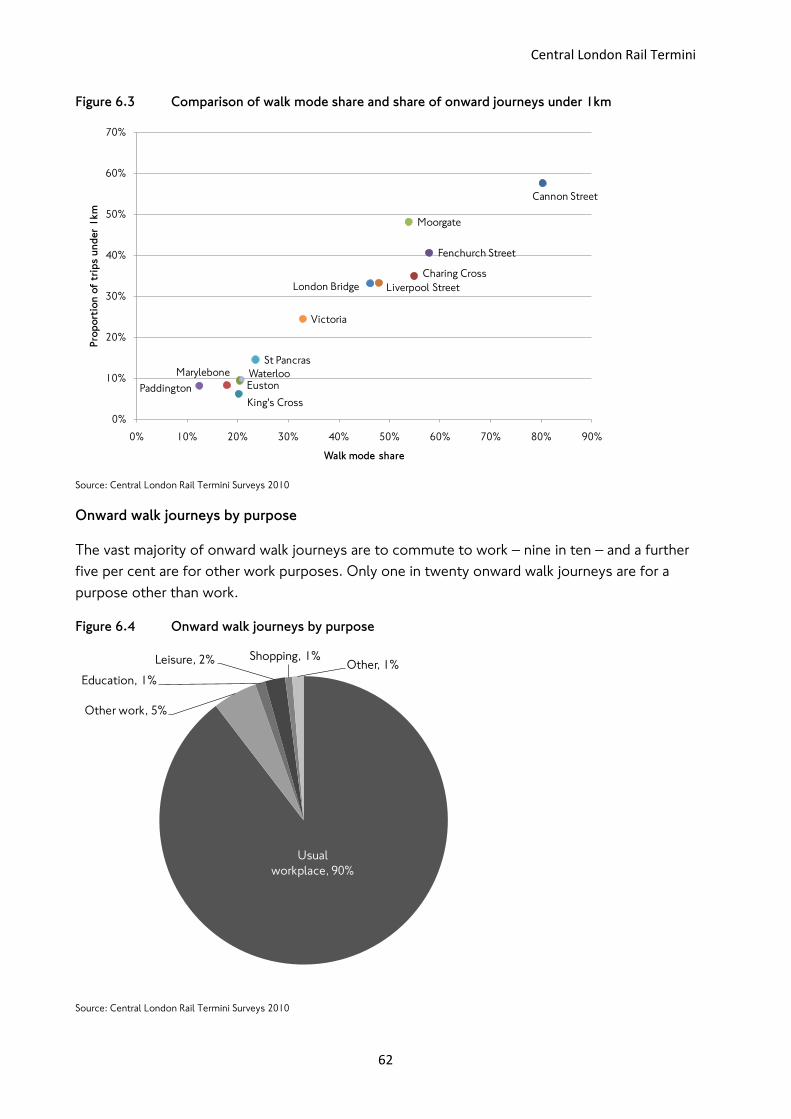
Central London Rail Termini
62
Figure 6.3 Comparison of walk mode share and share of onward journeys under 1km
Source: Central London Rail Termini Surveys 2010
Onward walk journeys by purpose
The vast majority of onward walk journeys are to commute to work – nine in ten – and a further
five per cent are for other work purposes. Only one in twenty onward walk journeys are for a
purpose other than work.
Figure 6.4 Onward walk journeys by purpose
Source: Central London Rail Termini Surveys 2010
Cannon Street
Charing Cross
Euston
Fenchurch Street
King's Cross
Liverpool StreetLondon Bridge
Marylebone
Moorgate
Paddington
St Pancras
Victoria
Waterloo
0%
10%
20%
30%
40%
50%
60%
70%
0% 10% 20% 30% 40% 50% 60% 70% 80% 90%
Pro
po
rtio
n o
f tr
ips
un
der
1km
Walk mode share
Usual
workplace, 90%
Other work, 5%
Education, 1%
Leisure, 2% Shopping, 1%Other, 1%
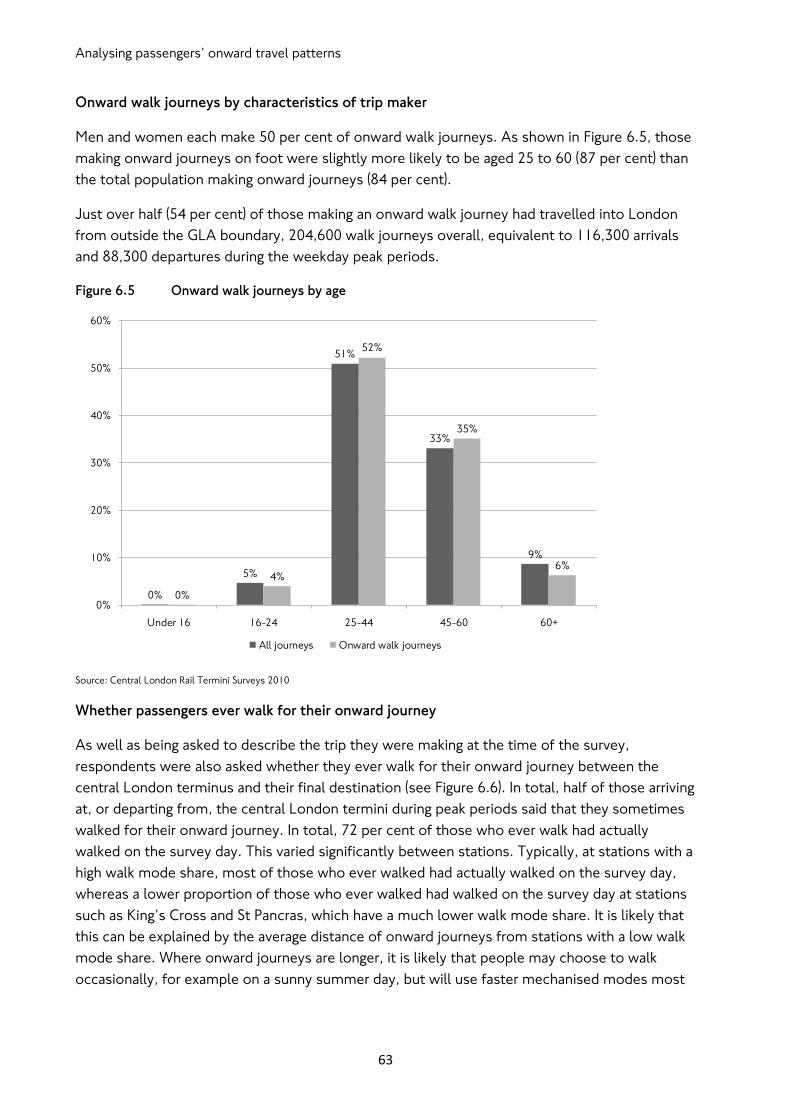
Analysing passengers‟ onward travel patterns
63
Onward walk journeys by characteristics of trip maker
Men and women each make 50 per cent of onward walk journeys. As shown in Figure 6.5, those
making onward journeys on foot were slightly more likely to be aged 25 to 60 (87 per cent) than
the total population making onward journeys (84 per cent).
Just over half (54 per cent) of those making an onward walk journey had travelled into London
from outside the GLA boundary, 204,600 walk journeys overall, equivalent to 116,300 arrivals
and 88,300 departures during the weekday peak periods.
Figure 6.5 Onward walk journeys by age
Source: Central London Rail Termini Surveys 2010
Whether passengers ever walk for their onward journey
As well as being asked to describe the trip they were making at the time of the survey,
respondents were also asked whether they ever walk for their onward journey between the
central London terminus and their final destination (see Figure 6.6). In total, half of those arriving
at, or departing from, the central London termini during peak periods said that they sometimes
walked for their onward journey. In total, 72 per cent of those who ever walk had actually
walked on the survey day. This varied significantly between stations. Typically, at stations with a
high walk mode share, most of those who ever walked had actually walked on the survey day,
whereas a lower proportion of those who ever walked had walked on the survey day at stations
such as King‟s Cross and St Pancras, which have a much lower walk mode share. It is likely that
this can be explained by the average distance of onward journeys from stations with a low walk
mode share. Where onward journeys are longer, it is likely that people may choose to walk
occasionally, for example on a sunny summer day, but will use faster mechanised modes most
0%
5%
51%
33%
9%
0%
4%
52%
35%
6%
0%
10%
20%
30%
40%
50%
60%
Under 16 16-24 25-44 45-60 60+
All journeys Onward walk journeys
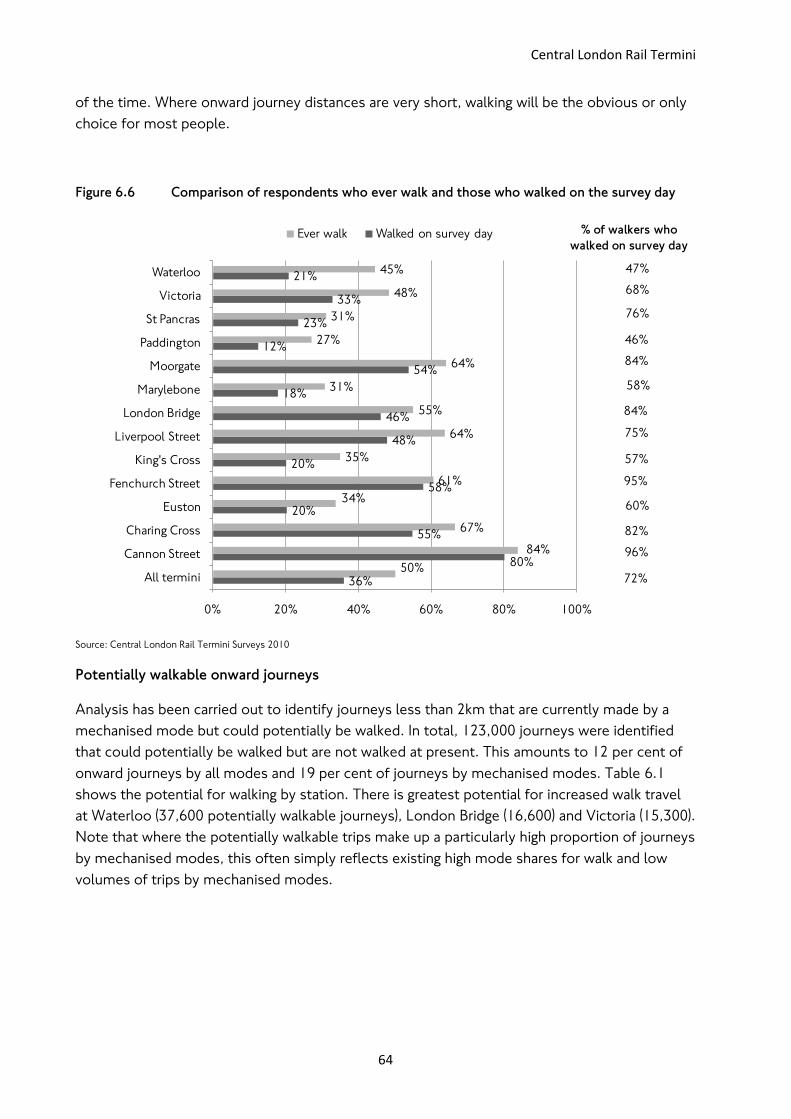
Central London Rail Termini
64
of the time. Where onward journey distances are very short, walking will be the obvious or only
choice for most people.
Figure 6.6 Comparison of respondents who ever walk and those who walked on the survey day
Source: Central London Rail Termini Surveys 2010
Potentially walkable onward journeys
Analysis has been carried out to identify journeys less than 2km that are currently made by a
mechanised mode but could potentially be walked. In total, 123,000 journeys were identified
that could potentially be walked but are not walked at present. This amounts to 12 per cent of
onward journeys by all modes and 19 per cent of journeys by mechanised modes. Table 6.1
shows the potential for walking by station. There is greatest potential for increased walk travel
at Waterloo (37,600 potentially walkable journeys), London Bridge (16,600) and Victoria (15,300).
Note that where the potentially walkable trips make up a particularly high proportion of journeys
by mechanised modes, this often simply reflects existing high mode shares for walk and low
volumes of trips by mechanised modes.
36%
80%
55%
20%
58%
20%
48%
46%
18%
54%
12%
23%
33%
21%
50%
84%
67%
34%
61%
35%
64%
55%
31%
64%
27%
31%
48%
45%
0% 20% 40% 60% 80% 100%
All termini
Cannon Street
Charing Cross
Euston
Fenchurch Street
King's Cross
Liverpool Street
London Bridge
Marylebone
Moorgate
Paddington
St Pancras
Victoria
Waterloo
Ever walk Walked on survey day % of walkers who
walked on survey day
47%
96%
95%
57%
75%
84%
58%
84%
46%
76%
68%
82%
60%
72%
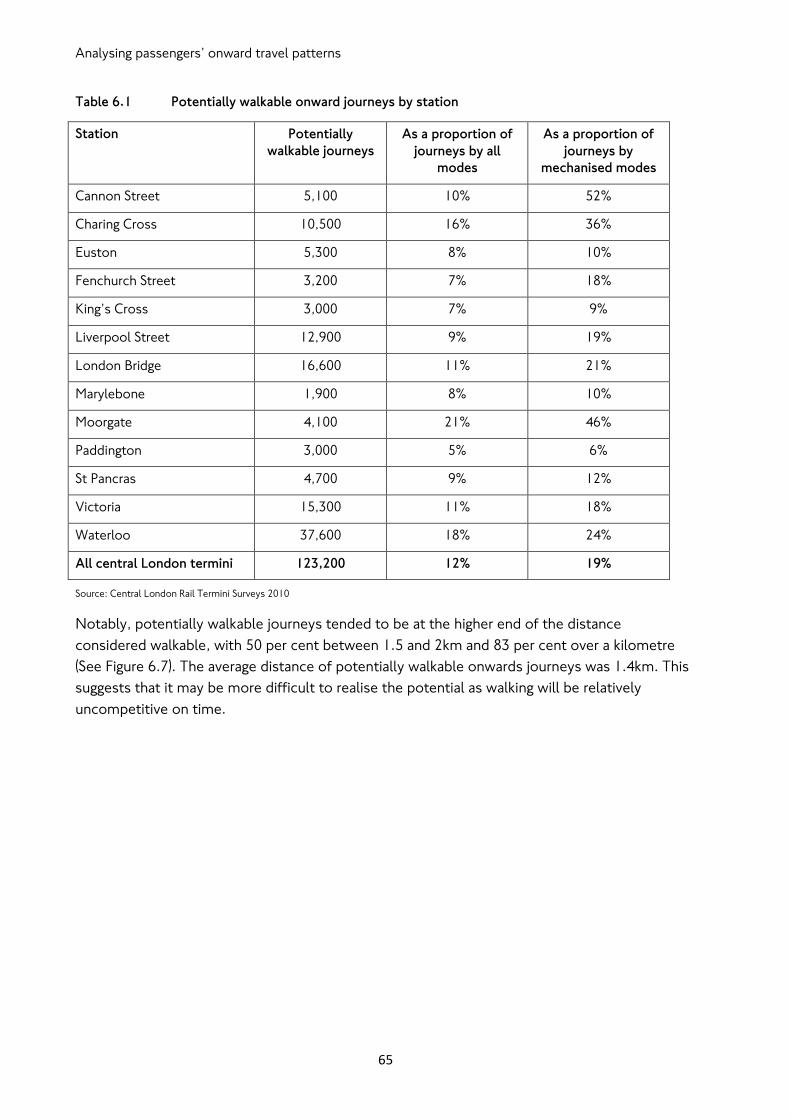
Analysing passengers‟ onward travel patterns
65
Table 6.1 Potentially walkable onward journeys by station
Station Potentially
walkable journeys
As a proportion of
journeys by all
modes
As a proportion of
journeys by
mechanised modes
Cannon Street 5,100 10% 52%
Charing Cross 10,500 16% 36%
Euston 5,300 8% 10%
Fenchurch Street 3,200 7% 18%
King‟s Cross 3,000 7% 9%
Liverpool Street 12,900 9% 19%
London Bridge 16,600 11% 21%
Marylebone 1,900 8% 10%
Moorgate 4,100 21% 46%
Paddington 3,000 5% 6%
St Pancras 4,700 9% 12%
Victoria 15,300 11% 18%
Waterloo 37,600 18% 24%
All central London termini 123,200 12% 19%
Source: Central London Rail Termini Surveys 2010
Notably, potentially walkable journeys tended to be at the higher end of the distance
considered walkable, with 50 per cent between 1.5 and 2km and 83 per cent over a kilometre
(See Figure 6.7). The average distance of potentially walkable onwards journeys was 1.4km. This
suggests that it may be more difficult to realise the potential as walking will be relatively
uncompetitive on time.
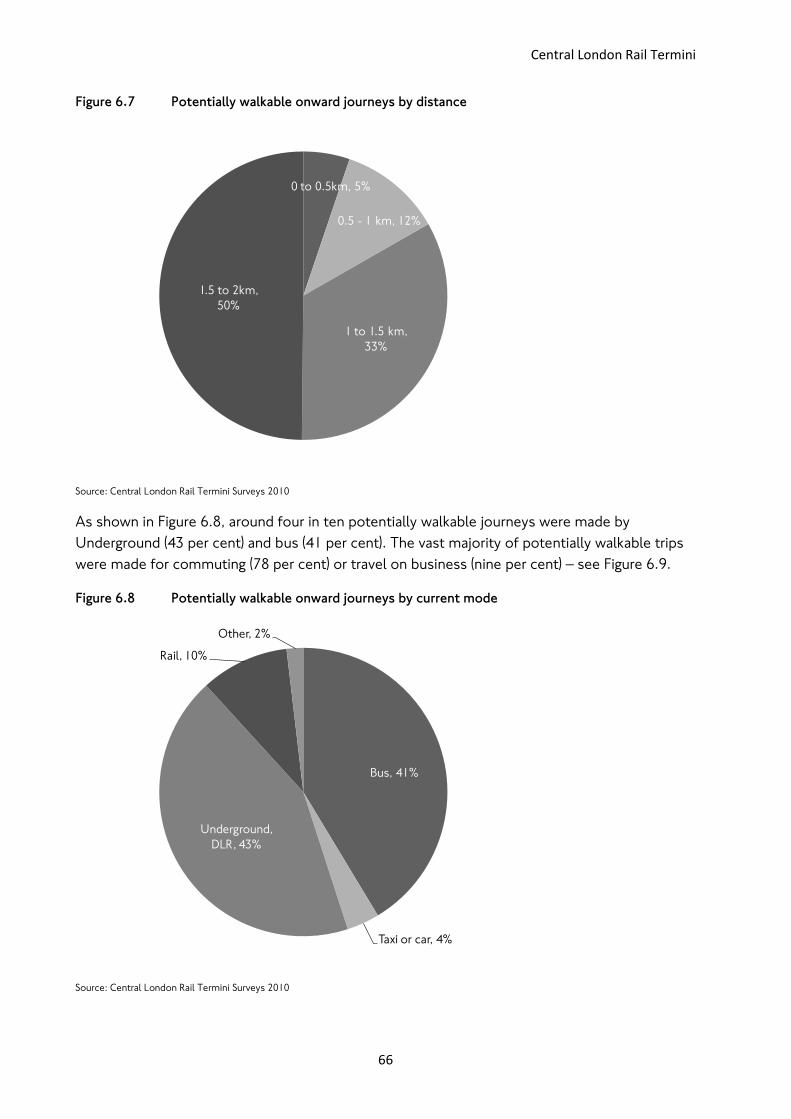
Central London Rail Termini
66
Figure 6.7 Potentially walkable onward journeys by distance
Source: Central London Rail Termini Surveys 2010
As shown in Figure 6.8, around four in ten potentially walkable journeys were made by
Underground (43 per cent) and bus (41 per cent). The vast majority of potentially walkable trips
were made for commuting (78 per cent) or travel on business (nine per cent) – see Figure 6.9.
Figure 6.8 Potentially walkable onward journeys by current mode
Source: Central London Rail Termini Surveys 2010
0 to 0.5km, 5%
0.5 - 1 km, 12%
1 to 1.5 km,
33%
1.5 to 2km,
50%
Bus, 41%
Taxi or car, 4%
Underground,
DLR, 43%
Rail, 10%
Other, 2%
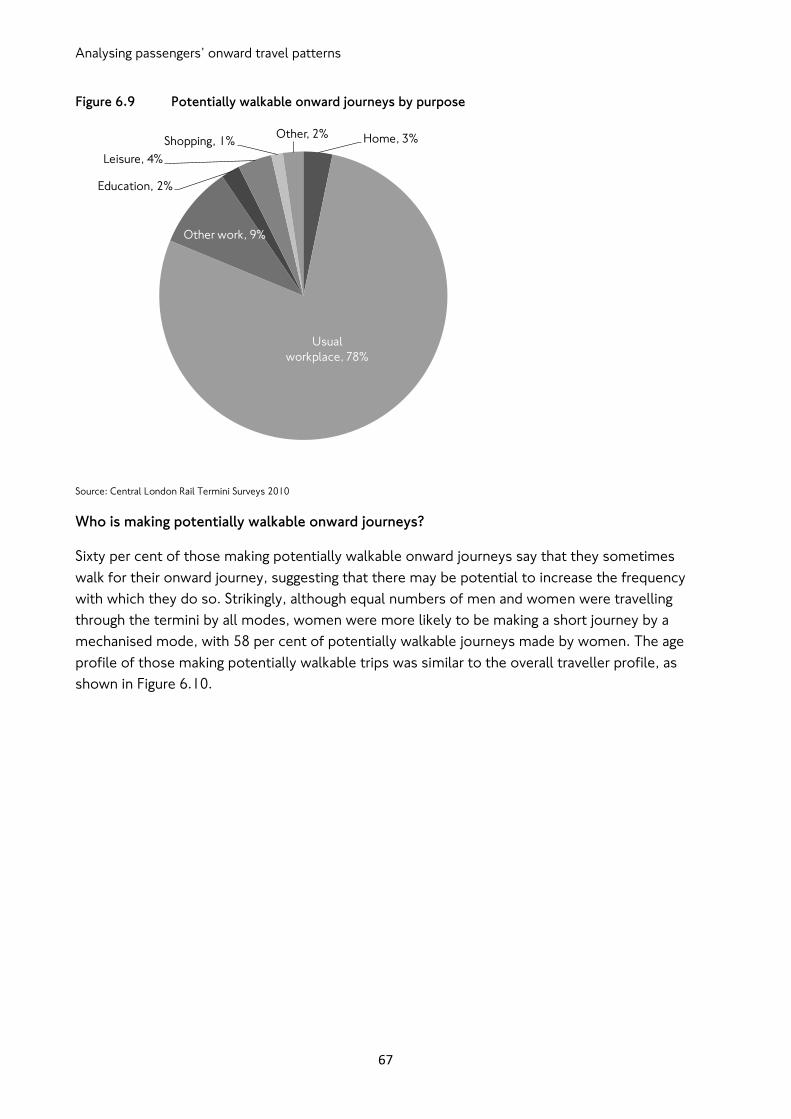
Analysing passengers‟ onward travel patterns
67
Figure 6.9 Potentially walkable onward journeys by purpose
Source: Central London Rail Termini Surveys 2010
Who is making potentially walkable onward journeys?
Sixty per cent of those making potentially walkable onward journeys say that they sometimes
walk for their onward journey, suggesting that there may be potential to increase the frequency
with which they do so. Strikingly, although equal numbers of men and women were travelling
through the termini by all modes, women were more likely to be making a short journey by a
mechanised mode, with 58 per cent of potentially walkable journeys made by women. The age
profile of those making potentially walkable trips was similar to the overall traveller profile, as
shown in Figure 6.10.
Home, 3%
Usual
workplace, 78%
Other work, 9%
Education, 2%
Leisure, 4%
Shopping, 1%Other, 2%
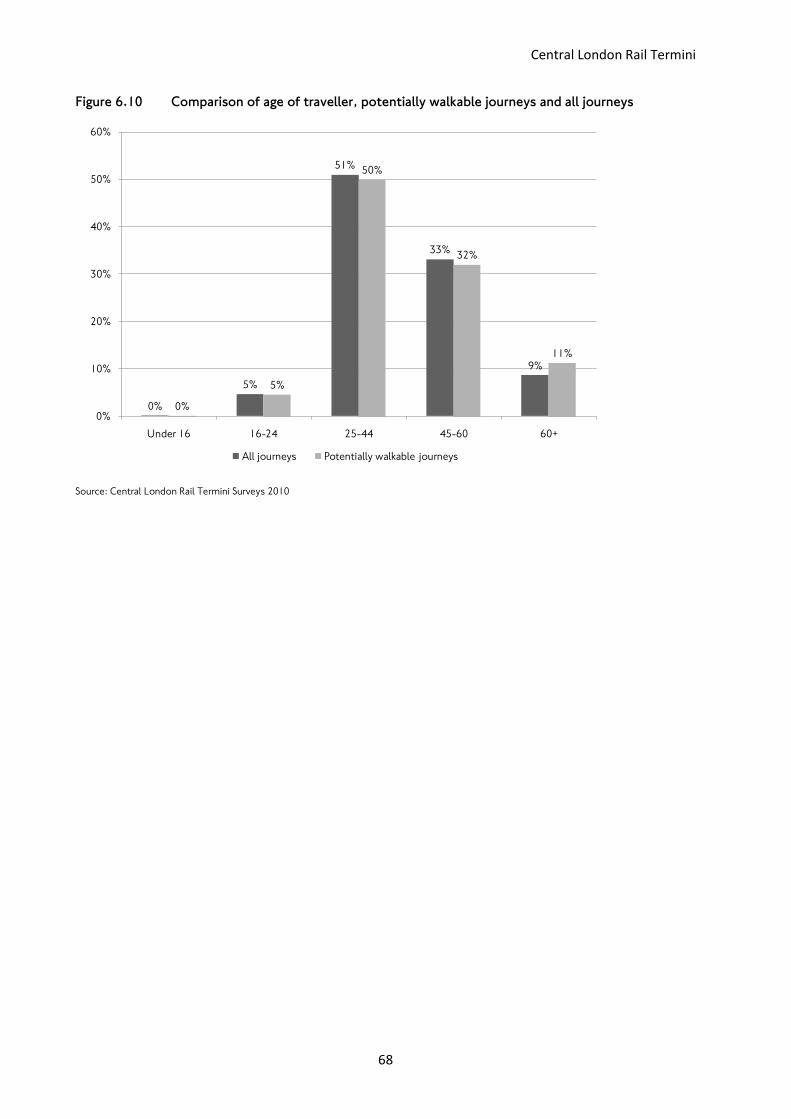
Central London Rail Termini
68
Figure 6.10 Comparison of age of traveller, potentially walkable journeys and all journeys
Source: Central London Rail Termini Surveys 2010
0%
5%
51%
33%
9%
0%
5%
50%
32%
11%
0%
10%
20%
30%
40%
50%
60%
Under 16 16-24 25-44 45-60 60+
All journeys Potentially walkable journeys
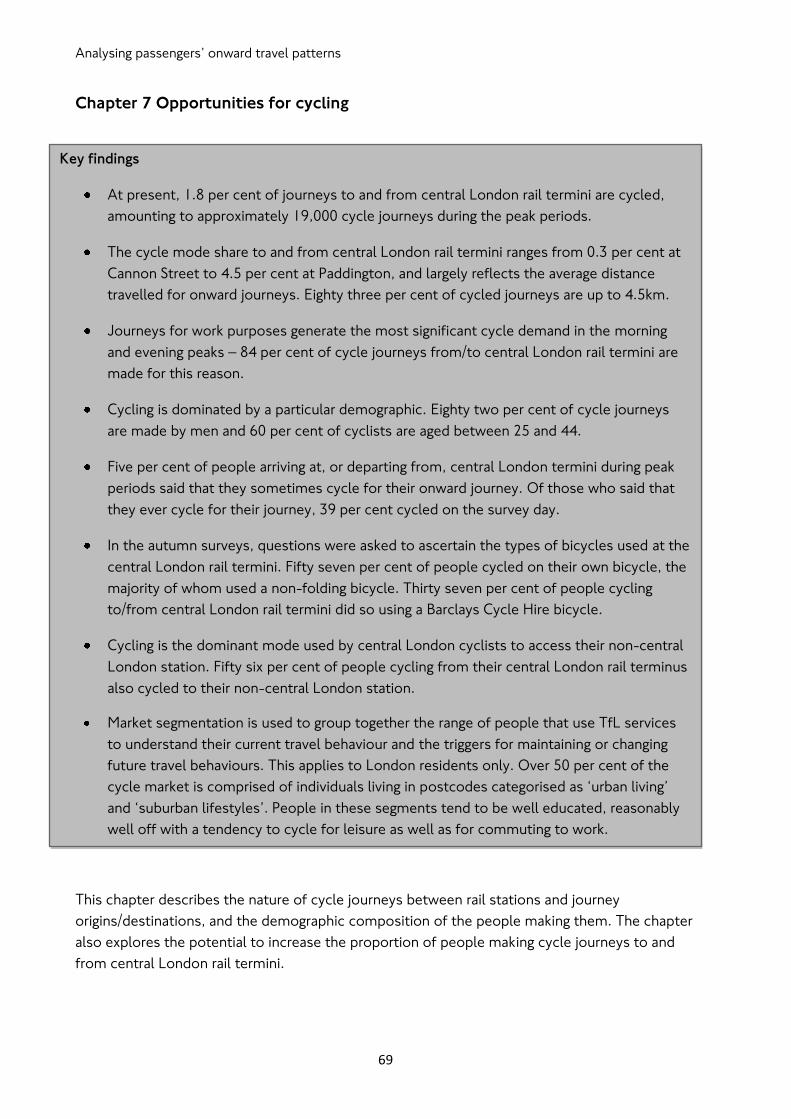
Analysing passengers‟ onward travel patterns
69
Chapter 7 Opportunities for cycling
This chapter describes the nature of cycle journeys between rail stations and journey
origins/destinations, and the demographic composition of the people making them. The chapter
also explores the potential to increase the proportion of people making cycle journeys to and
from central London rail termini.
Key findings
At present, 1.8 per cent of journeys to and from central London rail termini are cycled,
amounting to approximately 19,000 cycle journeys during the peak periods.
The cycle mode share to and from central London rail termini ranges from 0.3 per cent at
Cannon Street to 4.5 per cent at Paddington, and largely reflects the average distance
travelled for onward journeys. Eighty three per cent of cycled journeys are up to 4.5km.
Journeys for work purposes generate the most significant cycle demand in the morning
and evening peaks – 84 per cent of cycle journeys from/to central London rail termini are
made for this reason.
Cycling is dominated by a particular demographic. Eighty two per cent of cycle journeys
are made by men and 60 per cent of cyclists are aged between 25 and 44.
Five per cent of people arriving at, or departing from, central London termini during peak
periods said that they sometimes cycle for their onward journey. Of those who said that
they ever cycle for their journey, 39 per cent cycled on the survey day.
In the autumn surveys, questions were asked to ascertain the types of bicycles used at the
central London rail termini. Fifty seven per cent of people cycled on their own bicycle, the
majority of whom used a non-folding bicycle. Thirty seven per cent of people cycling
to/from central London rail termini did so using a Barclays Cycle Hire bicycle.
Cycling is the dominant mode used by central London cyclists to access their non-central
London station. Fifty six per cent of people cycling from their central London rail terminus
also cycled to their non-central London station.
Market segmentation is used to group together the range of people that use TfL services
to understand their current travel behaviour and the triggers for maintaining or changing
future travel behaviours. This applies to London residents only. Over 50 per cent of the
cycle market is comprised of individuals living in postcodes categorised as „urban living‟
and „suburban lifestyles‟. People in these segments tend to be well educated, reasonably
well off with a tendency to cycle for leisure as well as for commuting to work.
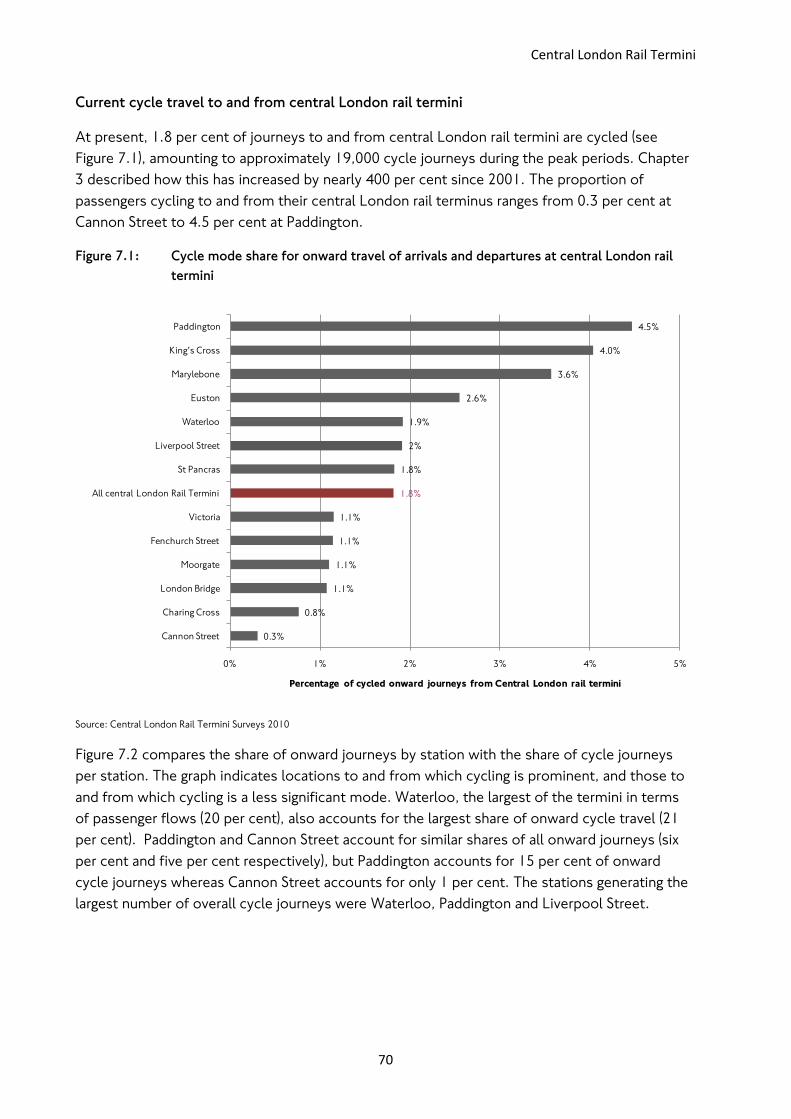
Central London Rail Termini
70
Current cycle travel to and from central London rail termini
At present, 1.8 per cent of journeys to and from central London rail termini are cycled (see
Figure 7.1), amounting to approximately 19,000 cycle journeys during the peak periods. Chapter
3 described how this has increased by nearly 400 per cent since 2001. The proportion of
passengers cycling to and from their central London rail terminus ranges from 0.3 per cent at
Cannon Street to 4.5 per cent at Paddington.
Figure 7.1: Cycle mode share for onward travel of arrivals and departures at central London rail
termini
Source: Central London Rail Termini Surveys 2010
Figure 7.2 compares the share of onward journeys by station with the share of cycle journeys
per station. The graph indicates locations to and from which cycling is prominent, and those to
and from which cycling is a less significant mode. Waterloo, the largest of the termini in terms
of passenger flows (20 per cent), also accounts for the largest share of onward cycle travel (21
per cent). Paddington and Cannon Street account for similar shares of all onward journeys (six
per cent and five per cent respectively), but Paddington accounts for 15 per cent of onward
cycle journeys whereas Cannon Street accounts for only 1 per cent. The stations generating the
largest number of overall cycle journeys were Waterloo, Paddington and Liverpool Street.
0.3%
0.8%
1.1%
1.1%
1.1%
1.1%
1.8%
1.8%
2%
1.9%
2.6%
3.6%
4.0%
4.5%
0% 1% 2% 3% 4% 5%
Cannon Street
Charing Cross
London Bridge
Moorgate
Fenchurch Street
Victoria
All central London Rail Termini
St Pancras
Liverpool Street
Waterloo
Euston
Marylebone
King's Cross
Paddington
Percentage of cycled onward journeys from Central London rail termini
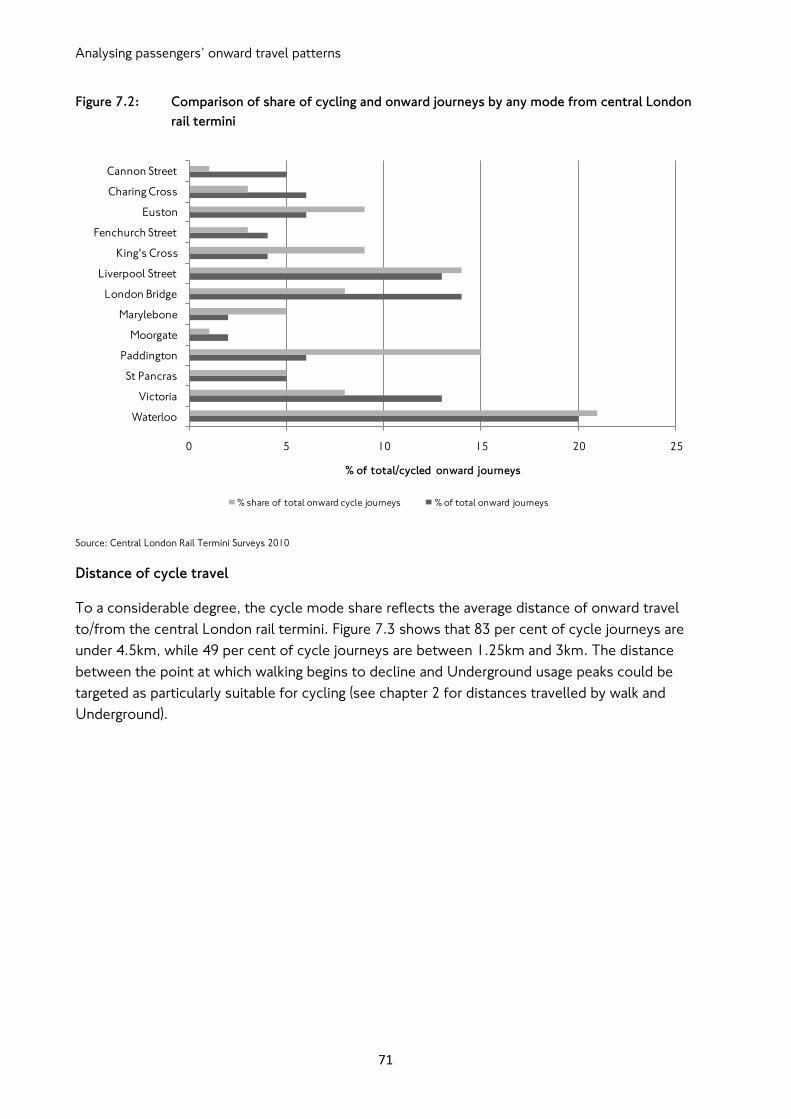
Analysing passengers‟ onward travel patterns
71
Figure 7.2: Comparison of share of cycling and onward journeys by any mode from central London
rail termini
Source: Central London Rail Termini Surveys 2010
Distance of cycle travel
To a considerable degree, the cycle mode share reflects the average distance of onward travel
to/from the central London rail termini. Figure 7.3 shows that 83 per cent of cycle journeys are
under 4.5km, while 49 per cent of cycle journeys are between 1.25km and 3km. The distance
between the point at which walking begins to decline and Underground usage peaks could be
targeted as particularly suitable for cycling (see chapter 2 for distances travelled by walk and
Underground).
0 5 10 15 20 25
Waterloo
Victoria
St Pancras
Paddington
Moorgate
Marylebone
London Bridge
Liverpool Street
King's Cross
Fenchurch Street
Euston
Charing Cross
Cannon Street
% of total/cycled onward journeys
% share of total onward cycle journeys % of total onward journeys
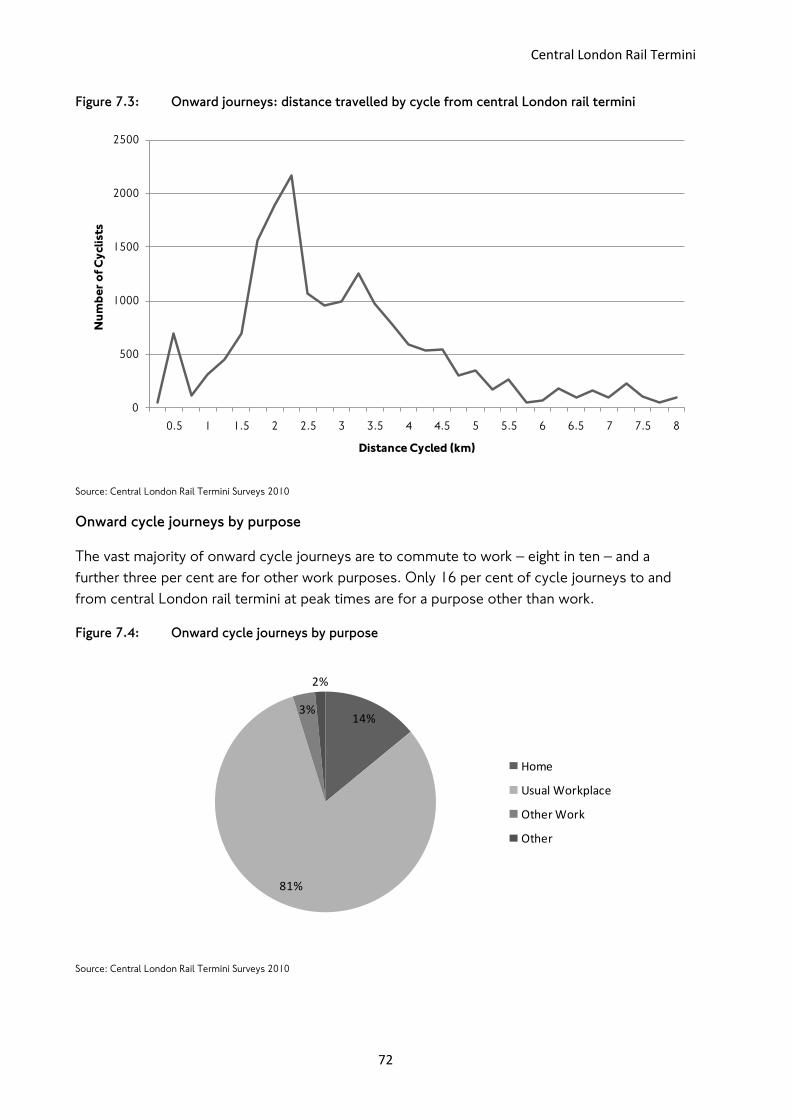
Central London Rail Termini
72
Figure 7.3: Onward journeys: distance travelled by cycle from central London rail termini
Source: Central London Rail Termini Surveys 2010
Onward cycle journeys by purpose
The vast majority of onward cycle journeys are to commute to work – eight in ten – and a
further three per cent are for other work purposes. Only 16 per cent of cycle journeys to and
from central London rail termini at peak times are for a purpose other than work.
Figure 7.4: Onward cycle journeys by purpose
Source: Central London Rail Termini Surveys 2010
0
500
1000
1500
2000
2500
0.5 1 1.5 2 2.5 3 3.5 4 4.5 5 5.5 6 6.5 7 7.5 8
Nu
mb
er
of C
yclists
Distance Cycled (km)
14%
81%
3%
2%
Home
Usual Workplace
Other Work
Other
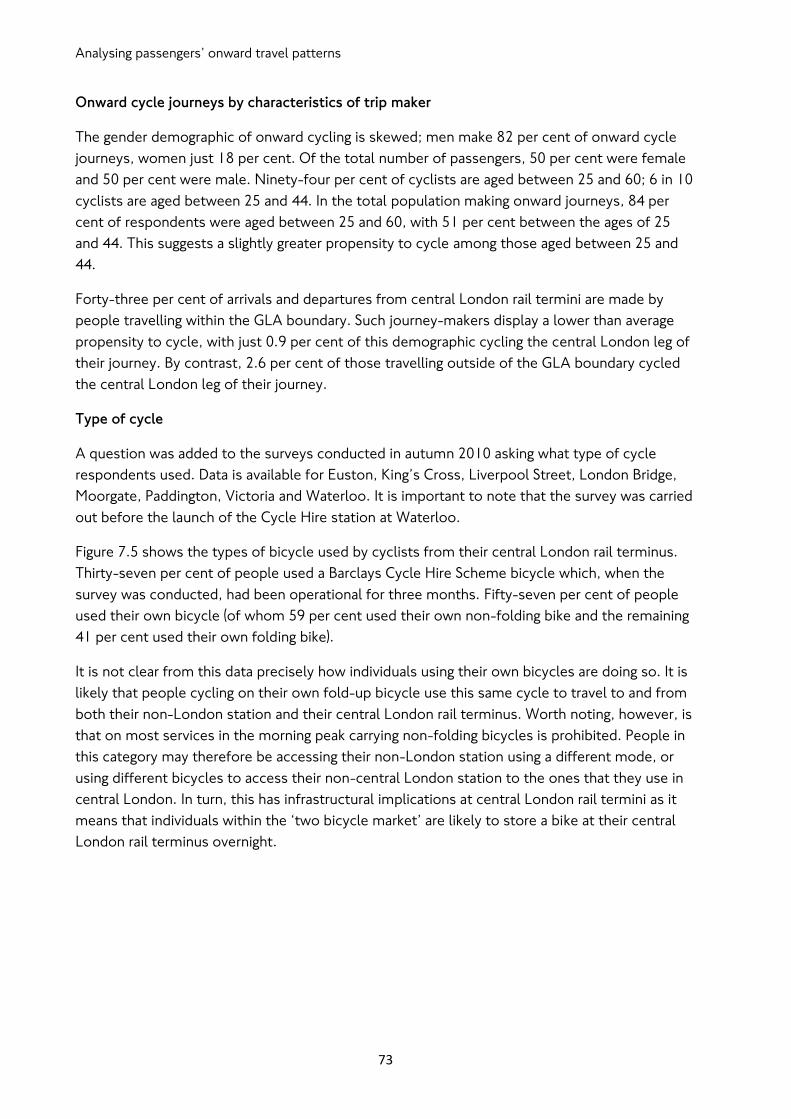
Analysing passengers‟ onward travel patterns
73
Onward cycle journeys by characteristics of trip maker
The gender demographic of onward cycling is skewed; men make 82 per cent of onward cycle
journeys, women just 18 per cent. Of the total number of passengers, 50 per cent were female
and 50 per cent were male. Ninety-four per cent of cyclists are aged between 25 and 60; 6 in 10
cyclists are aged between 25 and 44. In the total population making onward journeys, 84 per
cent of respondents were aged between 25 and 60, with 51 per cent between the ages of 25
and 44. This suggests a slightly greater propensity to cycle among those aged between 25 and
44.
Forty-three per cent of arrivals and departures from central London rail termini are made by
people travelling within the GLA boundary. Such journey-makers display a lower than average
propensity to cycle, with just 0.9 per cent of this demographic cycling the central London leg of
their journey. By contrast, 2.6 per cent of those travelling outside of the GLA boundary cycled
the central London leg of their journey.
Type of cycle
A question was added to the surveys conducted in autumn 2010 asking what type of cycle
respondents used. Data is available for Euston, King‟s Cross, Liverpool Street, London Bridge,
Moorgate, Paddington, Victoria and Waterloo. It is important to note that the survey was carried
out before the launch of the Cycle Hire station at Waterloo.
Figure 7.5 shows the types of bicycle used by cyclists from their central London rail terminus.
Thirty-seven per cent of people used a Barclays Cycle Hire Scheme bicycle which, when the
survey was conducted, had been operational for three months. Fifty-seven per cent of people
used their own bicycle (of whom 59 per cent used their own non-folding bike and the remaining
41 per cent used their own folding bike).
It is not clear from this data precisely how individuals using their own bicycles are doing so. It is
likely that people cycling on their own fold-up bicycle use this same cycle to travel to and from
both their non-London station and their central London rail terminus. Worth noting, however, is
that on most services in the morning peak carrying non-folding bicycles is prohibited. People in
this category may therefore be accessing their non-London station using a different mode, or
using different bicycles to access their non-central London station to the ones that they use in
central London. In turn, this has infrastructural implications at central London rail termini as it
means that individuals within the „two bicycle market‟ are likely to store a bike at their central
London rail terminus overnight.
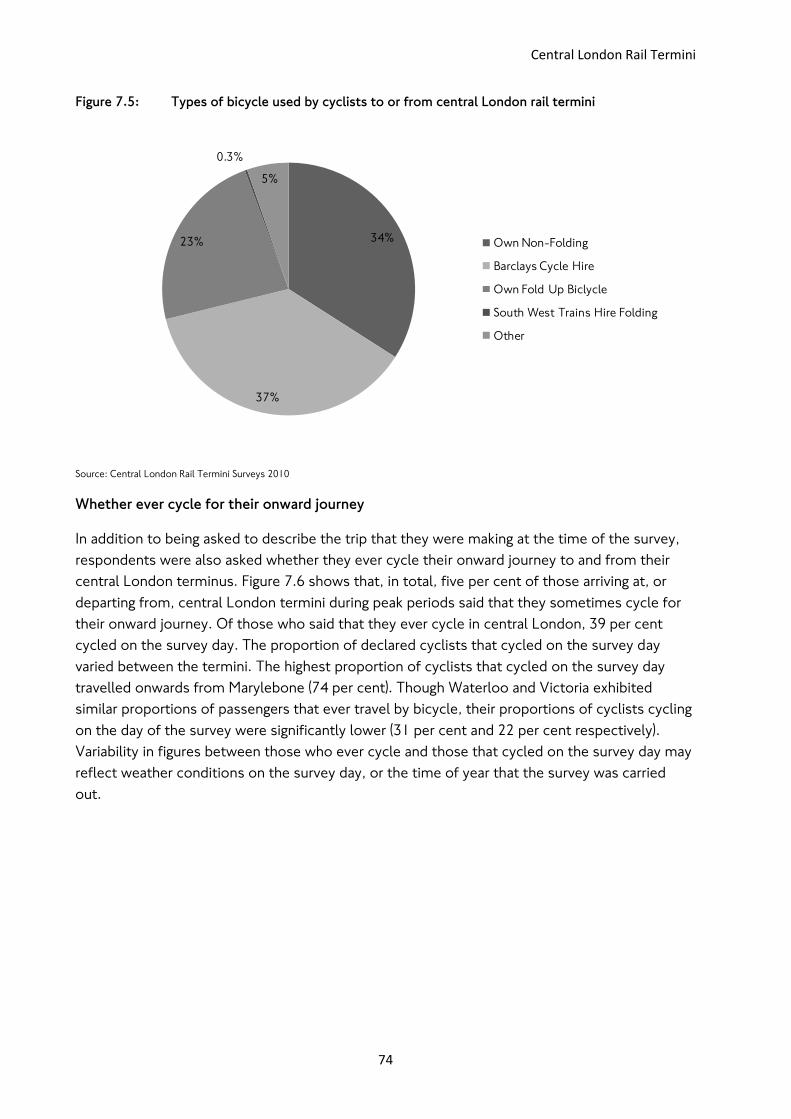
Central London Rail Termini
74
Figure 7.5: Types of bicycle used by cyclists to or from central London rail termini
Source: Central London Rail Termini Surveys 2010
Whether ever cycle for their onward journey
In addition to being asked to describe the trip that they were making at the time of the survey,
respondents were also asked whether they ever cycle their onward journey to and from their
central London terminus. Figure 7.6 shows that, in total, five per cent of those arriving at, or
departing from, central London termini during peak periods said that they sometimes cycle for
their onward journey. Of those who said that they ever cycle in central London, 39 per cent
cycled on the survey day. The proportion of declared cyclists that cycled on the survey day
varied between the termini. The highest proportion of cyclists that cycled on the survey day
travelled onwards from Marylebone (74 per cent). Though Waterloo and Victoria exhibited
similar proportions of passengers that ever travel by bicycle, their proportions of cyclists cycling
on the day of the survey were significantly lower (31 per cent and 22 per cent respectively).
Variability in figures between those who ever cycle and those that cycled on the survey day may
reflect weather conditions on the survey day, or the time of year that the survey was carried
out.
34%
37%
23%
0.3%
5%
Own Non-Folding
Barclays Cycle Hire
Own Fold Up Biclycle
South West Trains Hire Folding
Other
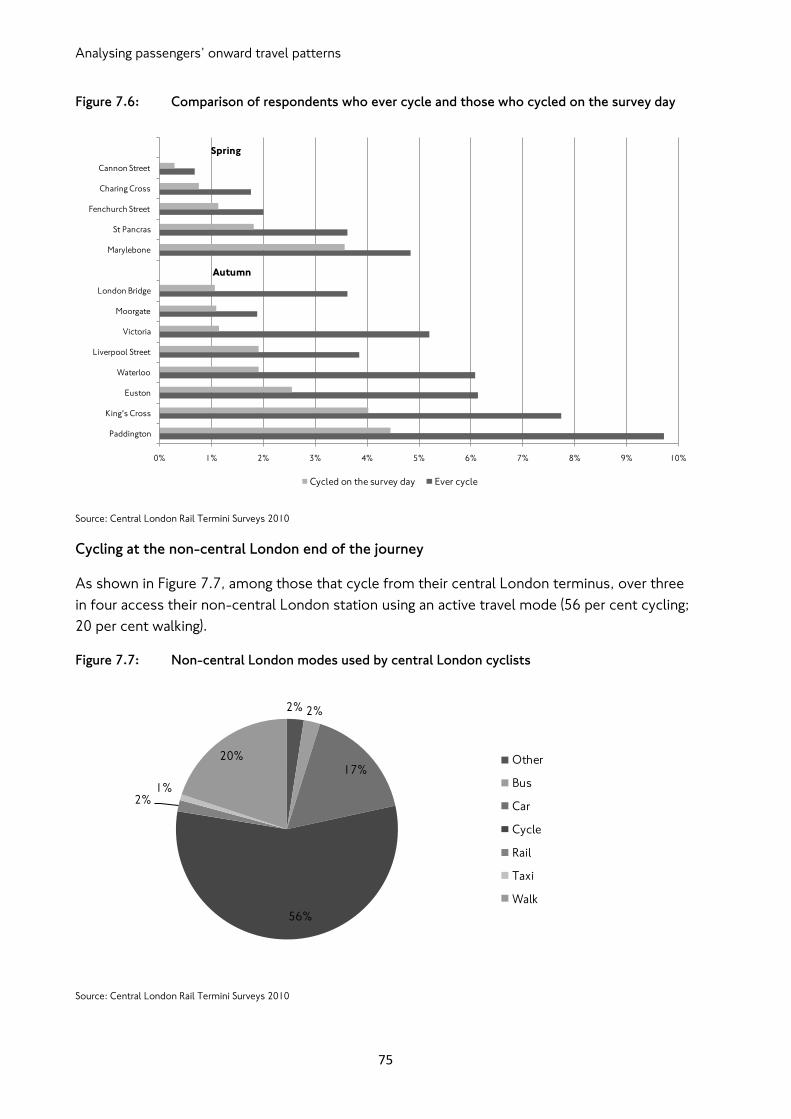
Analysing passengers‟ onward travel patterns
75
Figure 7.6: Comparison of respondents who ever cycle and those who cycled on the survey day
Source: Central London Rail Termini Surveys 2010
Cycling at the non-central London end of the journey
As shown in Figure 7.7, among those that cycle from their central London terminus, over three
in four access their non-central London station using an active travel mode (56 per cent cycling;
20 per cent walking).
Figure 7.7: Non-central London modes used by central London cyclists
Source: Central London Rail Termini Surveys 2010
0% 1% 2% 3% 4% 5% 6% 7% 8% 9% 10%
Paddington
King's Cross
Euston
Waterloo
Liverpool Street
Victoria
Moorgate
London Bridge
Marylebone
St Pancras
Fenchurch Street
Charing Cross
Cannon Street
Cycled on the survey day Ever cycle
Autumn
Spring
2% 2%
17%
56%
2%1%
20% Other
Bus
Car
Cycle
Rail
Taxi
Walk
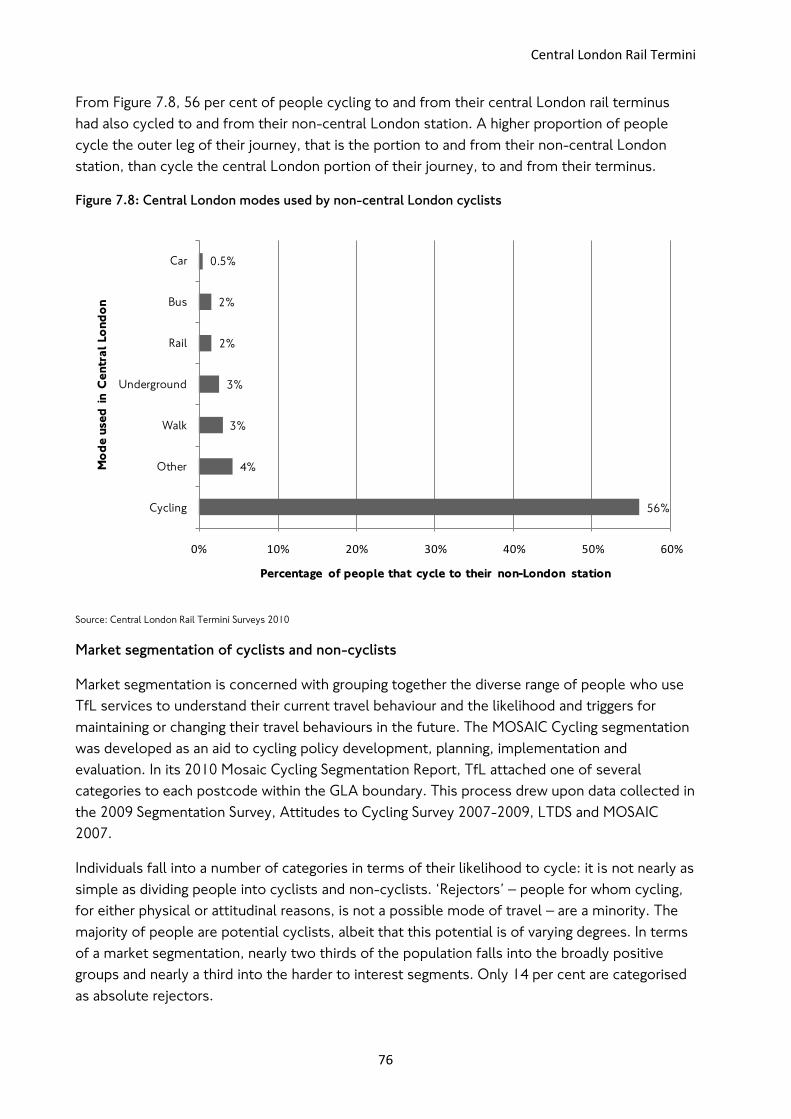
Central London Rail Termini
76
From Figure 7.8, 56 per cent of people cycling to and from their central London rail terminus
had also cycled to and from their non-central London station. A higher proportion of people
cycle the outer leg of their journey, that is the portion to and from their non-central London
station, than cycle the central London portion of their journey, to and from their terminus.
Figure 7.8: Central London modes used by non-central London cyclists
Source: Central London Rail Termini Surveys 2010
Market segmentation of cyclists and non-cyclists
Market segmentation is concerned with grouping together the diverse range of people who use
TfL services to understand their current travel behaviour and the likelihood and triggers for
maintaining or changing their travel behaviours in the future. The MOSAIC Cycling segmentation
was developed as an aid to cycling policy development, planning, implementation and
evaluation. In its 2010 Mosaic Cycling Segmentation Report, TfL attached one of several
categories to each postcode within the GLA boundary. This process drew upon data collected in
the 2009 Segmentation Survey, Attitudes to Cycling Survey 2007-2009, LTDS and MOSAIC
2007.
Individuals fall into a number of categories in terms of their likelihood to cycle: it is not nearly as
simple as dividing people into cyclists and non-cyclists. „Rejectors‟ – people for whom cycling,
for either physical or attitudinal reasons, is not a possible mode of travel – are a minority. The
majority of people are potential cyclists, albeit that this potential is of varying degrees. In terms
of a market segmentation, nearly two thirds of the population falls into the broadly positive
groups and nearly a third into the harder to interest segments. Only 14 per cent are categorised
as absolute rejectors.
56%
4%
3%
3%
2%
2%
0.5%
0% 10% 20% 30% 40% 50% 60%
Cycling
Other
Walk
Underground
Rail
Bus
Car
Percentage of people that cycle to their non-London station
Mo
de u
sed
in C
entr
al
Lo
nd
on
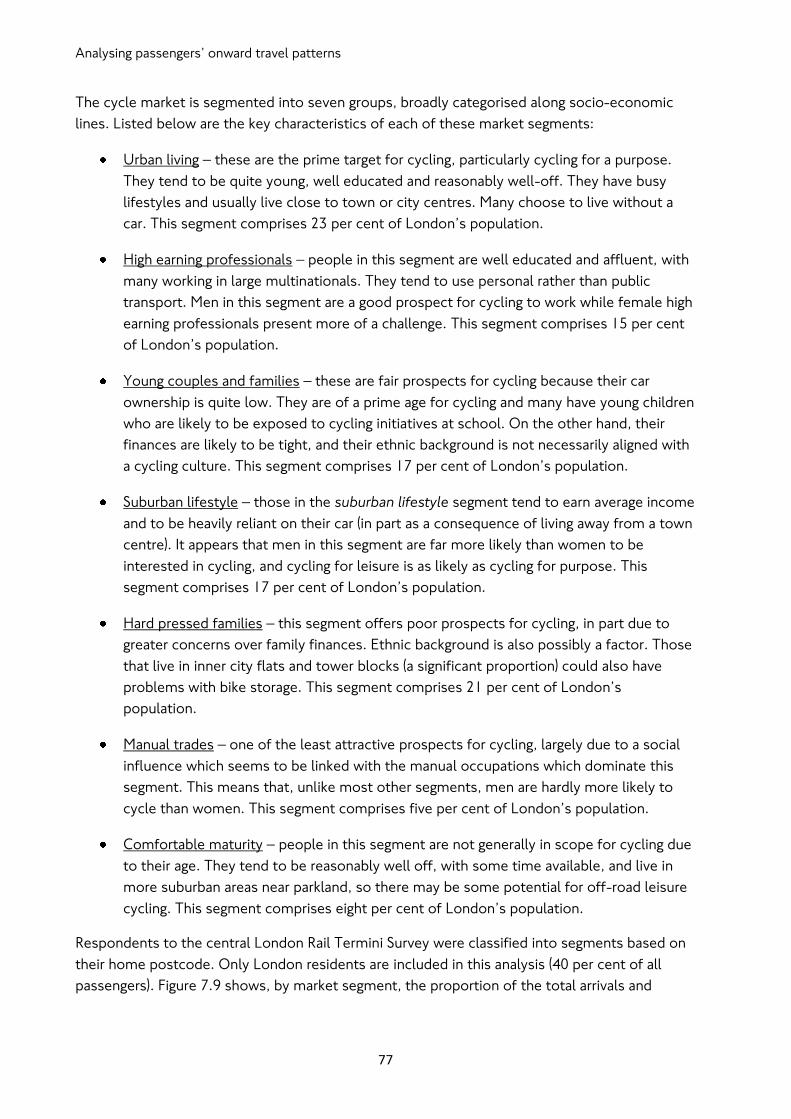
Analysing passengers‟ onward travel patterns
77
The cycle market is segmented into seven groups, broadly categorised along socio-economic
lines. Listed below are the key characteristics of each of these market segments:
Urban living – these are the prime target for cycling, particularly cycling for a purpose.
They tend to be quite young, well educated and reasonably well-off. They have busy
lifestyles and usually live close to town or city centres. Many choose to live without a
car. This segment comprises 23 per cent of London‟s population.
High earning professionals – people in this segment are well educated and affluent, with
many working in large multinationals. They tend to use personal rather than public
transport. Men in this segment are a good prospect for cycling to work while female high
earning professionals present more of a challenge. This segment comprises 15 per cent
of London‟s population.
Young couples and families – these are fair prospects for cycling because their car
ownership is quite low. They are of a prime age for cycling and many have young children
who are likely to be exposed to cycling initiatives at school. On the other hand, their
finances are likely to be tight, and their ethnic background is not necessarily aligned with
a cycling culture. This segment comprises 17 per cent of London‟s population.
Suburban lifestyle – those in the suburban lifestyle segment tend to earn average income
and to be heavily reliant on their car (in part as a consequence of living away from a town
centre). It appears that men in this segment are far more likely than women to be
interested in cycling, and cycling for leisure is as likely as cycling for purpose. This
segment comprises 17 per cent of London‟s population.
Hard pressed families – this segment offers poor prospects for cycling, in part due to
greater concerns over family finances. Ethnic background is also possibly a factor. Those
that live in inner city flats and tower blocks (a significant proportion) could also have
problems with bike storage. This segment comprises 21 per cent of London‟s
population.
Manual trades – one of the least attractive prospects for cycling, largely due to a social
influence which seems to be linked with the manual occupations which dominate this
segment. This means that, unlike most other segments, men are hardly more likely to
cycle than women. This segment comprises five per cent of London‟s population.
Comfortable maturity – people in this segment are not generally in scope for cycling due
to their age. They tend to be reasonably well off, with some time available, and live in
more suburban areas near parkland, so there may be some potential for off-road leisure
cycling. This segment comprises eight per cent of London‟s population.
Respondents to the central London Rail Termini Survey were classified into segments based on
their home postcode. Only London residents are included in this analysis (40 per cent of all
passengers). Figure 7.9 shows, by market segment, the proportion of the total arrivals and
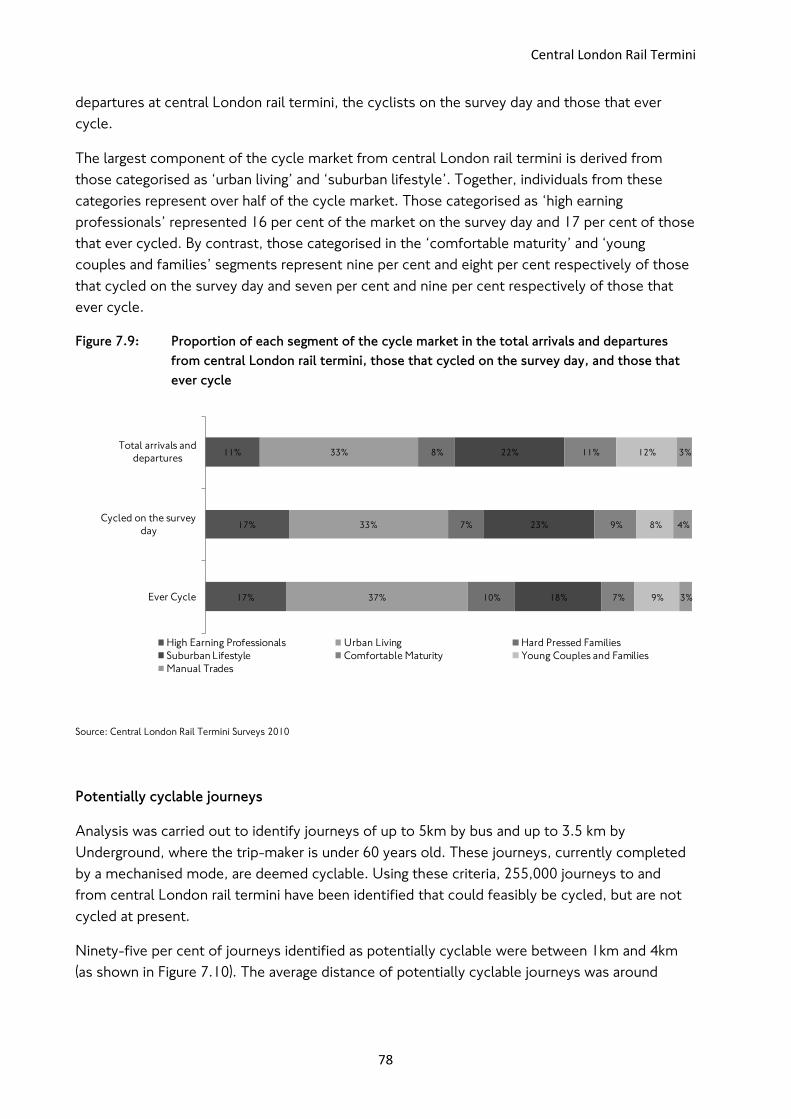
Central London Rail Termini
78
departures at central London rail termini, the cyclists on the survey day and those that ever
cycle.
The largest component of the cycle market from central London rail termini is derived from
those categorised as „urban living‟ and „suburban lifestyle‟. Together, individuals from these
categories represent over half of the cycle market. Those categorised as „high earning
professionals‟ represented 16 per cent of the market on the survey day and 17 per cent of those
that ever cycled. By contrast, those categorised in the „comfortable maturity‟ and „young
couples and families‟ segments represent nine per cent and eight per cent respectively of those
that cycled on the survey day and seven per cent and nine per cent respectively of those that
ever cycle.
Figure 7.9: Proportion of each segment of the cycle market in the total arrivals and departures
from central London rail termini, those that cycled on the survey day, and those that
ever cycle
Source: Central London Rail Termini Surveys 2010
Potentially cyclable journeys
Analysis was carried out to identify journeys of up to 5km by bus and up to 3.5 km by
Underground, where the trip-maker is under 60 years old. These journeys, currently completed
by a mechanised mode, are deemed cyclable. Using these criteria, 255,000 journeys to and
from central London rail termini have been identified that could feasibly be cycled, but are not
cycled at present.
Ninety-five per cent of journeys identified as potentially cyclable were between 1km and 4km
(as shown in Figure 7.10). The average distance of potentially cyclable journeys was around
11%
17%
17%
33%
33%
37%
8%
7%
10%
22%
23%
18%
11%
9%
7%
12%
8%
9%
3%
4%
3%
Total arrivals and
departures
Cycled on the survey
day
Ever Cycle
High Earning Professionals Urban Living Hard Pressed Families
Suburban Lifestyle Comfortable Maturity Young Couples and Families
Manual Trades
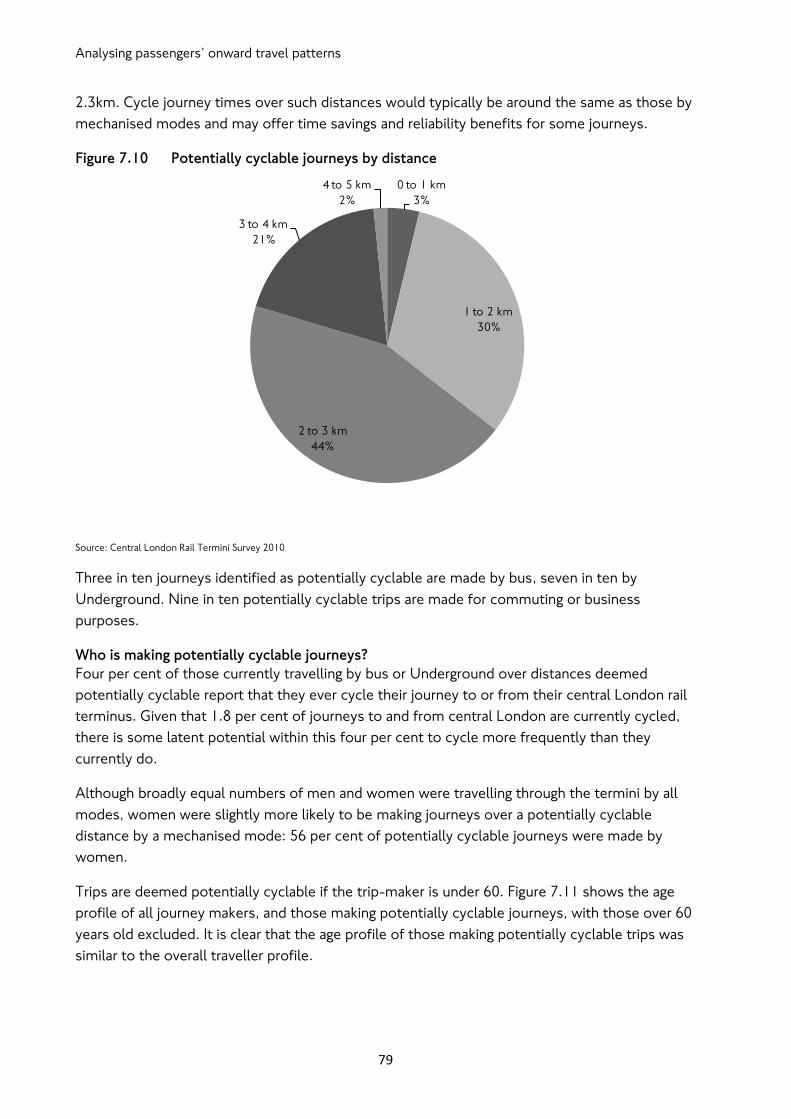
Analysing passengers‟ onward travel patterns
79
2.3km. Cycle journey times over such distances would typically be around the same as those by
mechanised modes and may offer time savings and reliability benefits for some journeys.
Figure 7.10 Potentially cyclable journeys by distance
Source: Central London Rail Termini Survey 2010
Three in ten journeys identified as potentially cyclable are made by bus, seven in ten by
Underground. Nine in ten potentially cyclable trips are made for commuting or business
purposes.
Who is making potentially cyclable journeys?
Four per cent of those currently travelling by bus or Underground over distances deemed
potentially cyclable report that they ever cycle their journey to or from their central London rail
terminus. Given that 1.8 per cent of journeys to and from central London are currently cycled,
there is some latent potential within this four per cent to cycle more frequently than they
currently do.
Although broadly equal numbers of men and women were travelling through the termini by all
modes, women were slightly more likely to be making journeys over a potentially cyclable
distance by a mechanised mode: 56 per cent of potentially cyclable journeys were made by
women.
Trips are deemed potentially cyclable if the trip-maker is under 60. Figure 7.11 shows the age
profile of all journey makers, and those making potentially cyclable journeys, with those over 60
years old excluded. It is clear that the age profile of those making potentially cyclable trips was
similar to the overall traveller profile.
0 to 1 km
3%
1 to 2 km
30%
2 to 3 km
44%
3 to 4 km
21%
4 to 5 km
2%
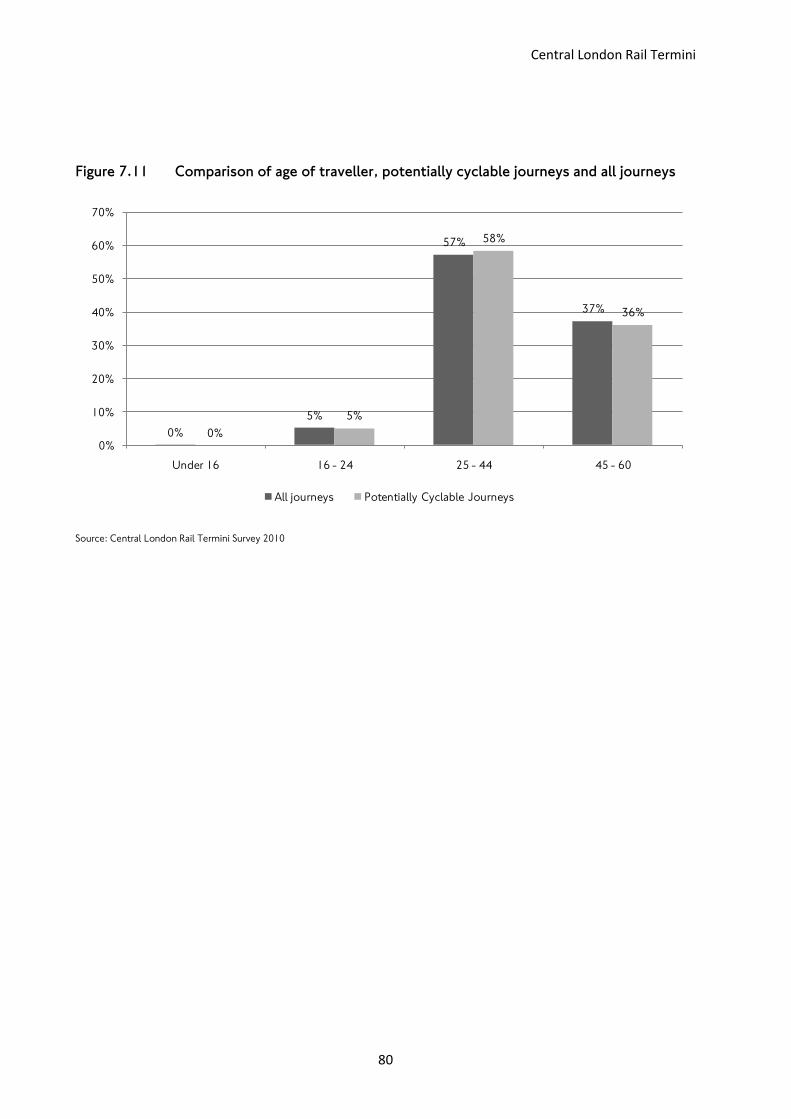
Central London Rail Termini
80
Figure 7.11 Comparison of age of traveller, potentially cyclable journeys and all journeys
Source: Central London Rail Termini Survey 2010
0%
5%
57%
37%
0%
5%
58%
36%
0%
10%
20%
30%
40%
50%
60%
70%
Under 16 16 - 24 25 - 44 45 - 60
All journeys Potentially Cyclable Journeys

Analysing passengers‟ onward travel patterns
81

Central London Rail Termini
82
Part Two
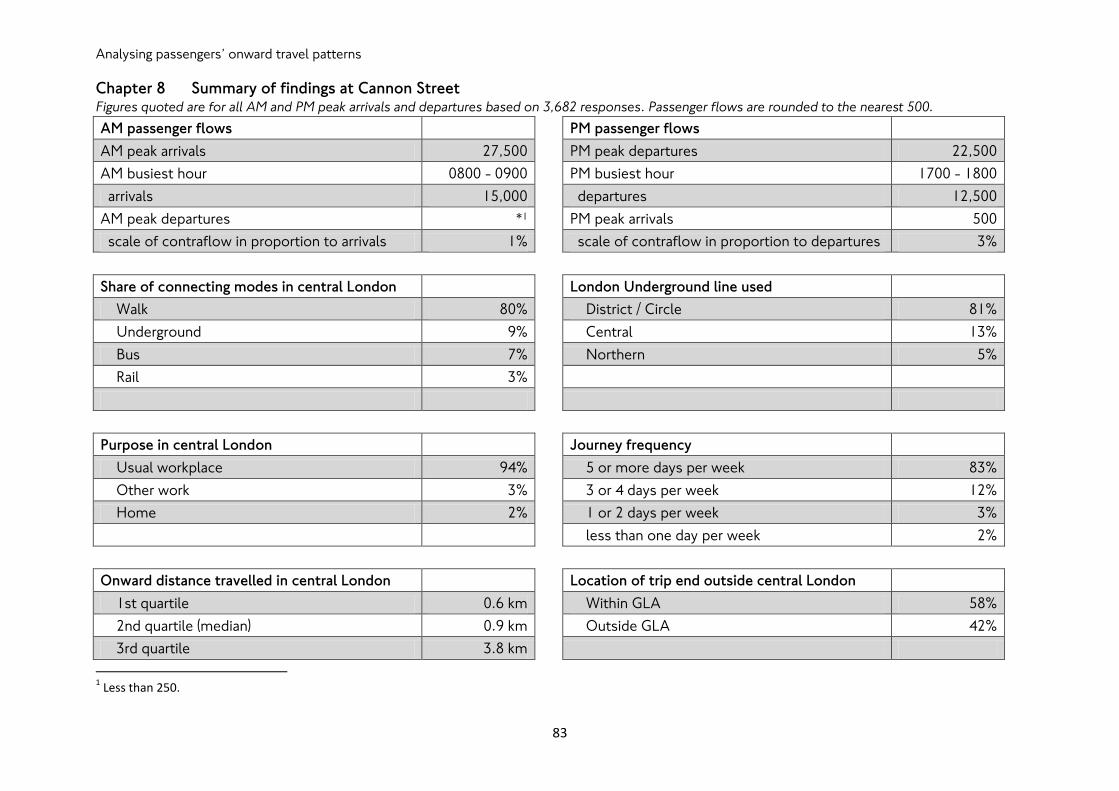
Analysing passengers‟ onward travel patterns
83
Chapter 8 Summary of findings at Cannon Street Figures quoted are for all AM and PM peak arrivals and departures based on 3,682 responses. Passenger flows are rounded to the nearest 500.
AM passenger flows
PM passenger flows
AM peak arrivals 27,500
PM peak departures 22,500
AM busiest hour 0800 - 0900
PM busiest hour 1700 - 1800
arrivals 15,000
departures 12,500
AM peak departures *1
PM peak arrivals 500
scale of contraflow in proportion to arrivals 1%
scale of contraflow in proportion to departures 3%
Share of connecting modes in central London
London Underground line used
Walk 80%
District / Circle 81%
Underground 9%
Central 13%
Bus 7%
Northern 5%
Rail 3%
Purpose in central London
Journey frequency
Usual workplace 94%
5 or more days per week 83%
Other work 3%
3 or 4 days per week 12%
Home 2%
1 or 2 days per week 3%
less than one day per week 2%
Onward distance travelled in central London
Location of trip end outside central London
1st quartile 0.6 km
Within GLA 58%
2nd quartile (median) 0.9 km
Outside GLA 42%
3rd quartile 3.8 km
1 Less than 250.
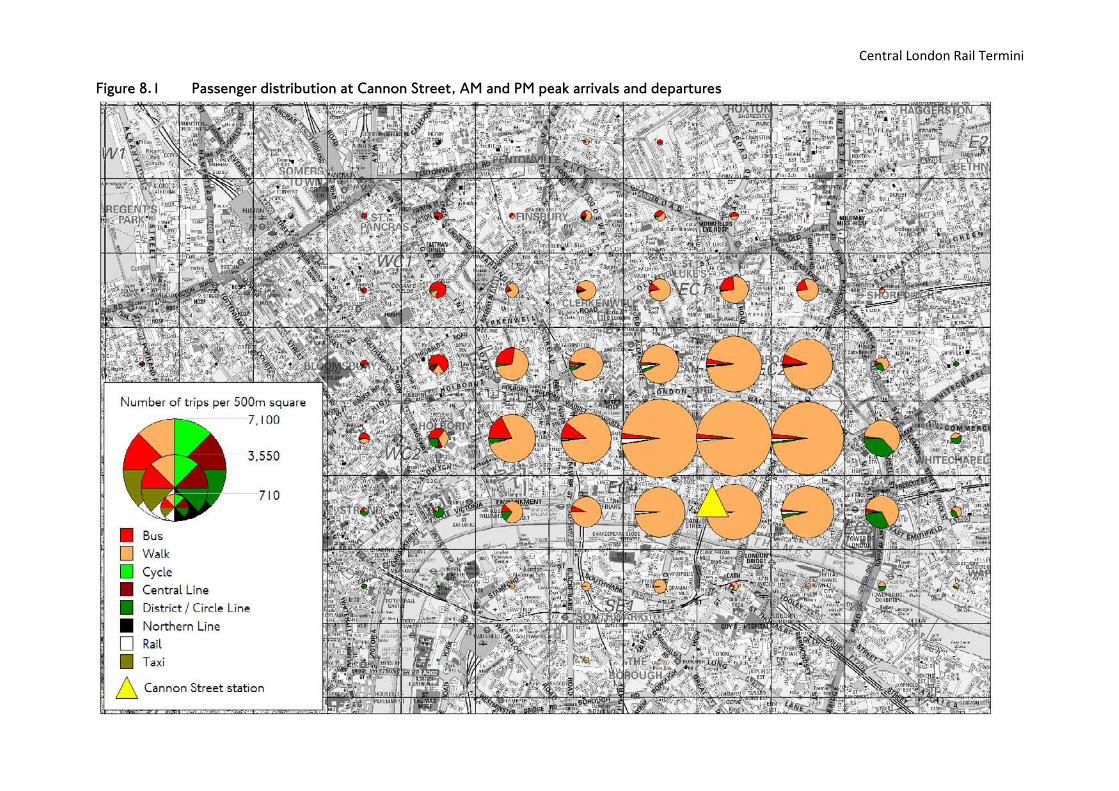
Central London Rail Termini
84
Figure 8.1 Passenger distribution at Cannon Street, AM and PM peak arrivals and departures
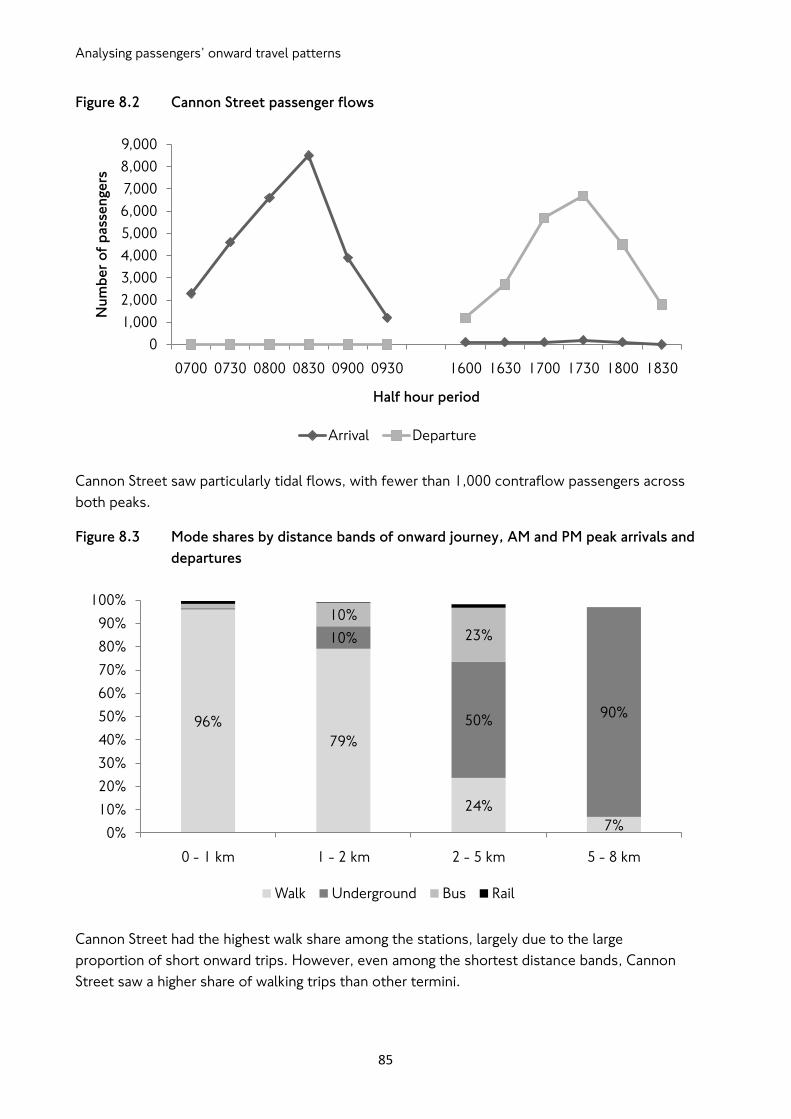
Analysing passengers‟ onward travel patterns
85
Figure 8.2 Cannon Street passenger flows
Cannon Street saw particularly tidal flows, with fewer than 1,000 contraflow passengers across
both peaks.
Figure 8.3 Mode shares by distance bands of onward journey, AM and PM peak arrivals and
departures
Cannon Street had the highest walk share among the stations, largely due to the large
proportion of short onward trips. However, even among the shortest distance bands, Cannon
Street saw a higher share of walking trips than other termini.
0
1,000
2,000
3,000
4,000
5,000
6,000
7,000
8,000
9,000
0700 0730 0800 0830 0900 0930 1600 1630 1700 1730 1800 1830
Nu
mb
er
of
pass
en
ge
rs
Half hour period
Arrival Departure
96%
79%
24%
7%
10%
50%90%
10%
23%
0%
10%
20%
30%
40%
50%
60%
70%
80%
90%
100%
0 - 1 km 1 - 2 km 2 - 5 km 5 - 8 km
Walk Underground Bus Rail
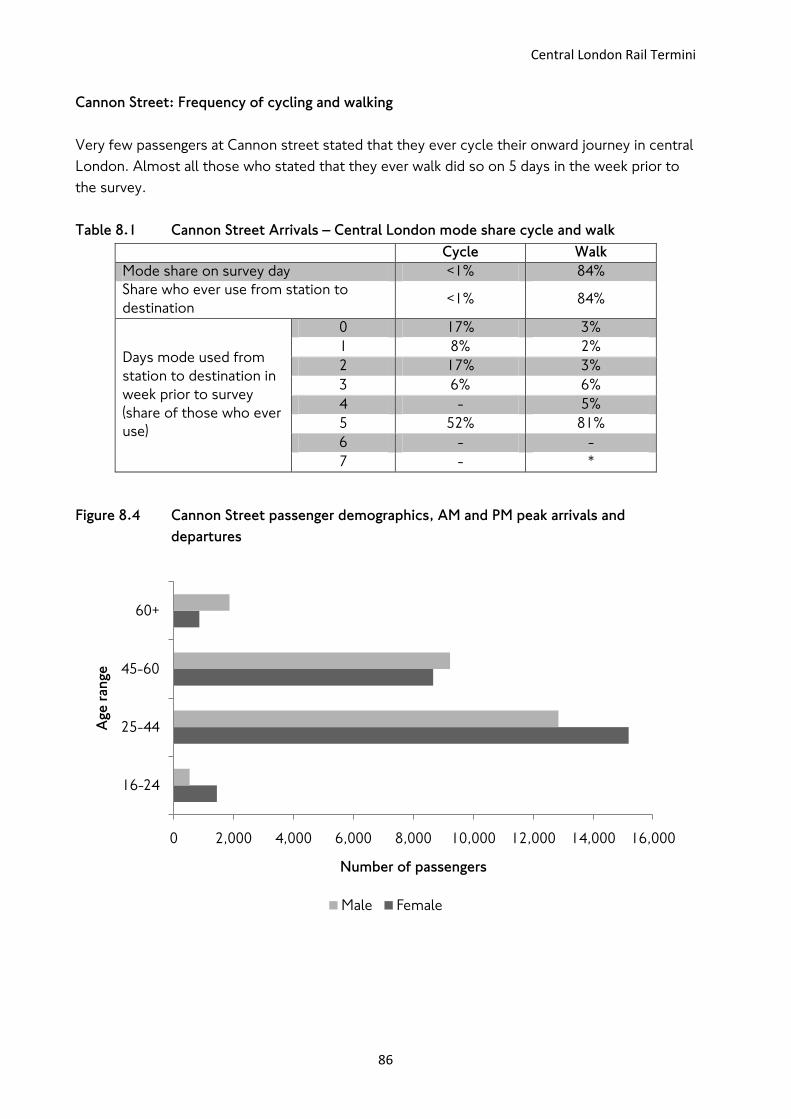
Central London Rail Termini
86
Cannon Street: Frequency of cycling and walking
Very few passengers at Cannon street stated that they ever cycle their onward journey in central
London. Almost all those who stated that they ever walk did so on 5 days in the week prior to
the survey.
Table 8.1 Cannon Street Arrivals – Central London mode share cycle and walk
Cycle Walk
Mode share on survey day <1% 84%
Share who ever use from station to
destination <1% 84%
Days mode used from
station to destination in
week prior to survey
(share of those who ever
use)
0 17% 3%
1 8% 2%
2 17% 3%
3 6% 6%
4 - 5%
5 52% 81%
6 - -
7 - *
Figure 8.4 Cannon Street passenger demographics, AM and PM peak arrivals and
departures
0 2,000 4,000 6,000 8,000 10,000 12,000 14,000 16,000
16-24
25-44
45-60
60+
Number of passengers
Age
ran
ge
Male Female
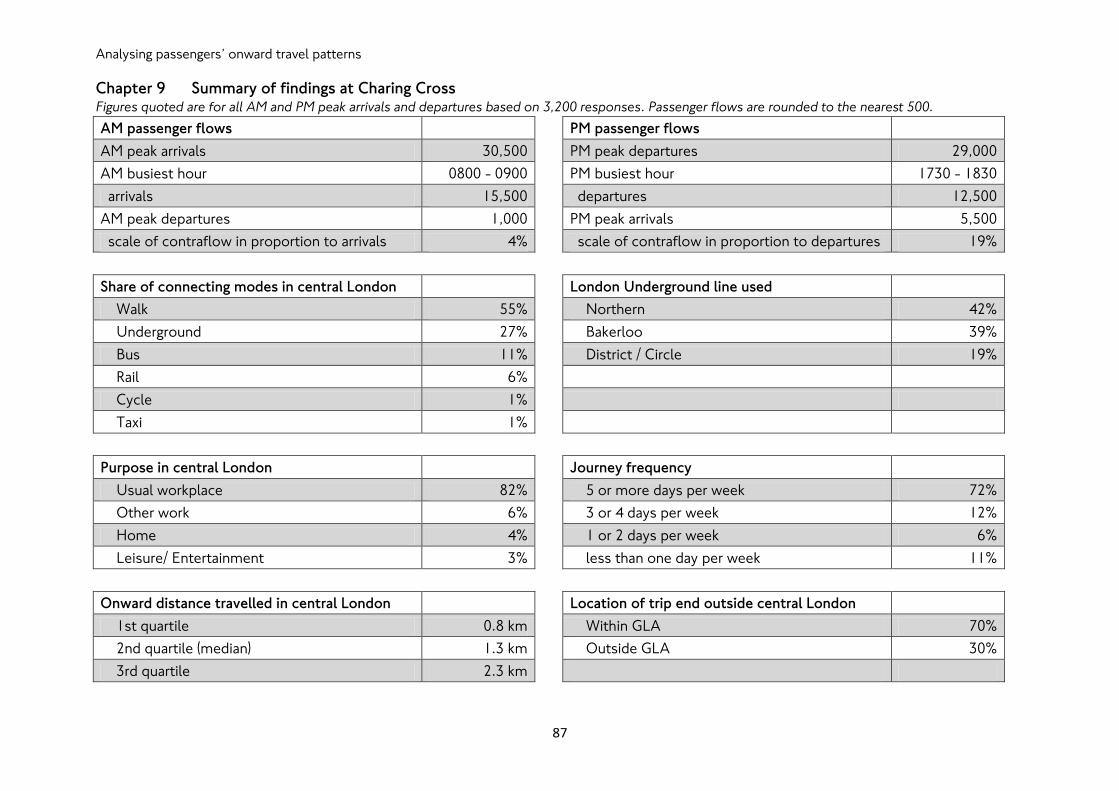
Analysing passengers‟ onward travel patterns
87
Chapter 9 Summary of findings at Charing Cross Figures quoted are for all AM and PM peak arrivals and departures based on 3,200 responses. Passenger flows are rounded to the nearest 500.
AM passenger flows
PM passenger flows
AM peak arrivals 30,500
PM peak departures 29,000
AM busiest hour 0800 - 0900
PM busiest hour 1730 - 1830
arrivals 15,500
departures 12,500
AM peak departures 1,000
PM peak arrivals 5,500
scale of contraflow in proportion to arrivals 4%
scale of contraflow in proportion to departures 19%
Share of connecting modes in central London
London Underground line used
Walk 55%
Northern 42%
Underground 27%
Bakerloo 39%
Bus 11%
District / Circle 19%
Rail 6%
Cycle 1%
Taxi 1%
Purpose in central London
Journey frequency
Usual workplace 82%
5 or more days per week 72%
Other work 6%
3 or 4 days per week 12%
Home 4%
1 or 2 days per week 6%
Leisure/ Entertainment 3%
less than one day per week 11%
Onward distance travelled in central London
Location of trip end outside central London
1st quartile 0.8 km
Within GLA 70%
2nd quartile (median) 1.3 km
Outside GLA 30%
3rd quartile 2.3 km
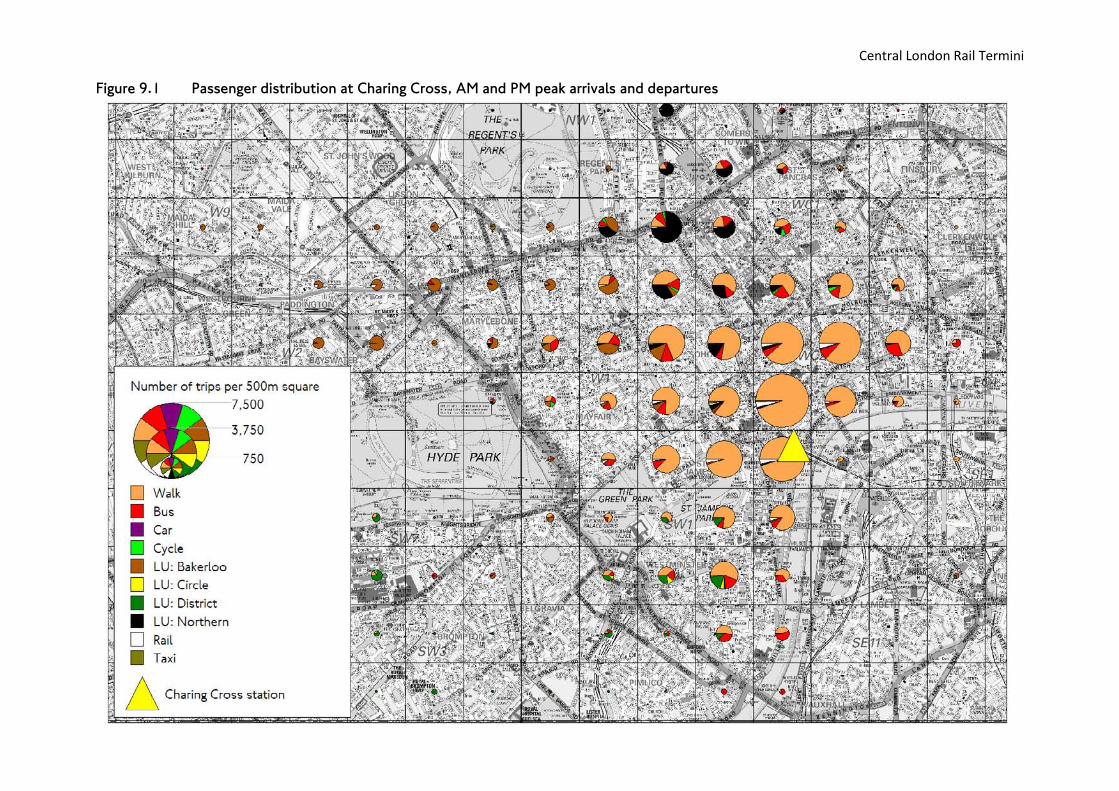
Central London Rail Termini
88
Figure 9.1 Passenger distribution at Charing Cross, AM and PM peak arrivals and departures
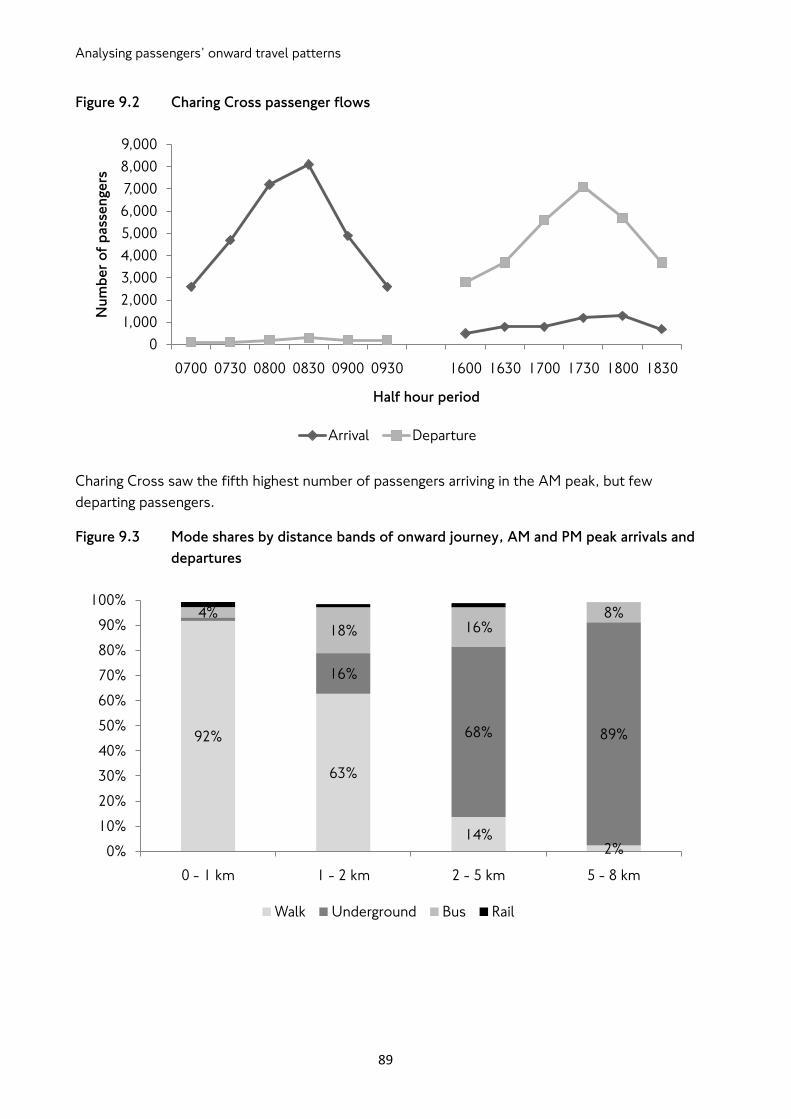
Analysing passengers‟ onward travel patterns
89
Figure 9.2 Charing Cross passenger flows
Charing Cross saw the fifth highest number of passengers arriving in the AM peak, but few
departing passengers.
Figure 9.3 Mode shares by distance bands of onward journey, AM and PM peak arrivals and
departures
0
1,000
2,000
3,000
4,000
5,000
6,000
7,000
8,000
9,000
0700 0730 0800 0830 0900 0930 1600 1630 1700 1730 1800 1830
Nu
mb
er
of
pass
en
ge
rs
Half hour period
Arrival Departure
92%
63%
14%2%
16%
68% 89%
4%
18% 16%8%
0%
10%
20%
30%
40%
50%
60%
70%
80%
90%
100%
0 - 1 km 1 - 2 km 2 - 5 km 5 - 8 km
Walk Underground Bus Rail
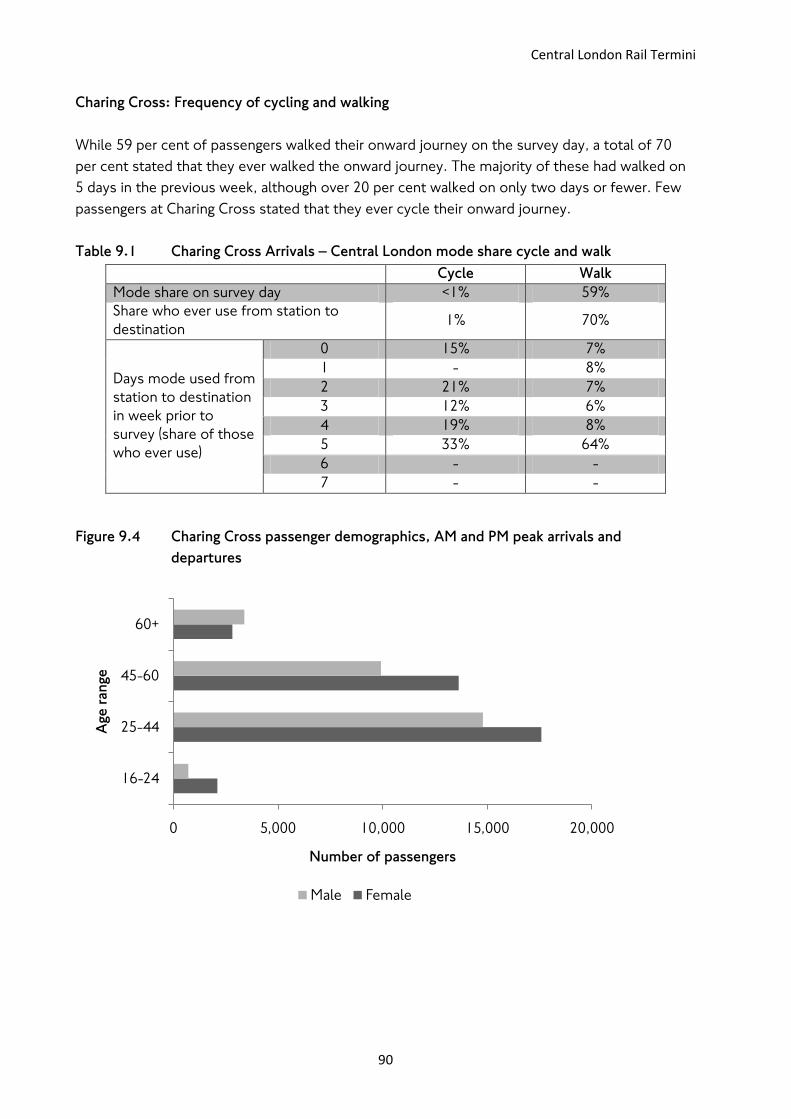
Central London Rail Termini
90
Charing Cross: Frequency of cycling and walking
While 59 per cent of passengers walked their onward journey on the survey day, a total of 70
per cent stated that they ever walked the onward journey. The majority of these had walked on
5 days in the previous week, although over 20 per cent walked on only two days or fewer. Few
passengers at Charing Cross stated that they ever cycle their onward journey.
Table 9.1 Charing Cross Arrivals – Central London mode share cycle and walk
Cycle Walk
Mode share on survey day <1% 59%
Share who ever use from station to
destination 1% 70%
Days mode used from
station to destination
in week prior to
survey (share of those
who ever use)
0 15% 7%
1 - 8%
2 21% 7%
3 12% 6%
4 19% 8%
5 33% 64%
6 - -
7 - -
Figure 9.4 Charing Cross passenger demographics, AM and PM peak arrivals and
departures
0 5,000 10,000 15,000 20,000
16-24
25-44
45-60
60+
Number of passengers
Age
ran
ge
Male Female

Analysing passengers‟ onward travel patterns
91
Chapter 10 Summary of findings at Euston Figures quoted are for all AM and PM peak arrivals and departures based on 3,479 responses. Passenger flows are rounded to the nearest 500.
AM passenger flows
PM passenger flows
AM peak arrivals 23,500
PM peak departures 23,500
AM busiest hour 0800 - 0900
PM busiest hour 1730 - 1830
arrivals 11,500
departures 9,500
AM peak departures 8,000
PM peak arrivals 13,000
scale of contraflow in proportion to arrivals 35%
scale of contraflow in proportion to departures 55%
Share of connecting modes in central London
London Underground line used
Underground 53%
Northern 46%
Walk 20%
Victoria 37%
Rail 12%
Metropolitan 8%
Bus 8%
Hammersmith & City 5%
Taxi 3%
Circle 4%
Cycle 3%
Purpose in central London
Journey frequency
Usual workplace 50%
5 or more days per week 40%
Home 21%
3 or 4 days per week 14%
Other work 19%
1 or 2 days per week 12%
Leisure/ Entertainment 3%
less than one day per week 33%
Onward distance travelled in central London
Location of trip end outside central London
1st quartile 2.1 km
Within GLA 11%
2nd quartile (median) 3.6 km
Outside GLA 87%
3rd quartile 8.6 km
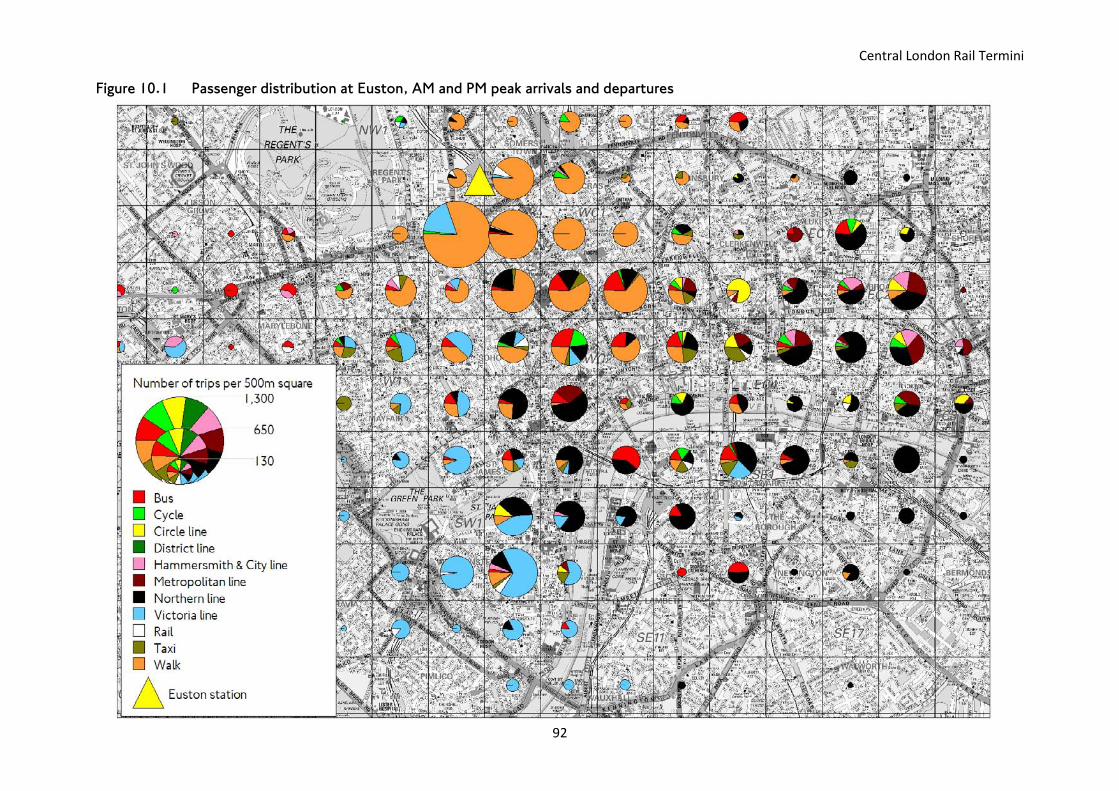
Central London Rail Termini
92
Figure 10.1 Passenger distribution at Euston, AM and PM peak arrivals and departures
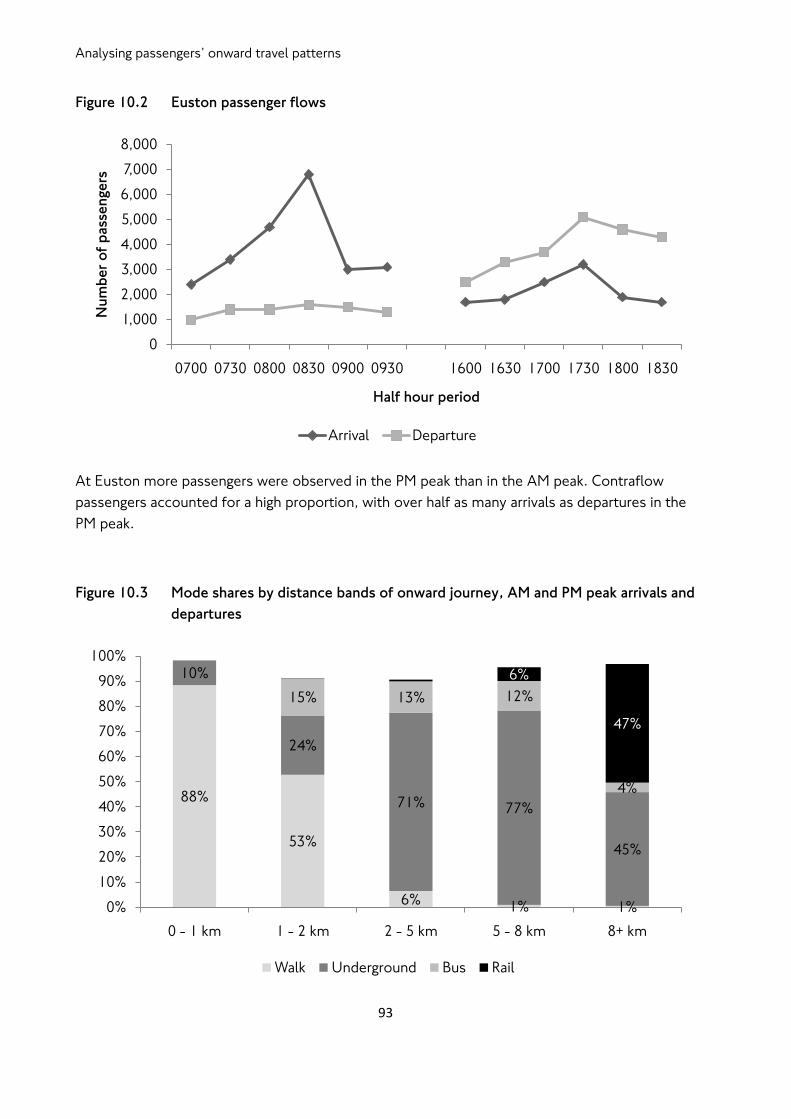
Analysing passengers‟ onward travel patterns
93
Figure 10.2 Euston passenger flows
At Euston more passengers were observed in the PM peak than in the AM peak. Contraflow
passengers accounted for a high proportion, with over half as many arrivals as departures in the
PM peak.
Figure 10.3 Mode shares by distance bands of onward journey, AM and PM peak arrivals and
departures
0
1,000
2,000
3,000
4,000
5,000
6,000
7,000
8,000
0700 0730 0800 0830 0900 0930 1600 1630 1700 1730 1800 1830
Nu
mb
er
of
pass
en
ge
rs
Half hour period
Arrival Departure
88%
53%
6%1% 1%
10%
24%
71% 77%
45%
15% 13% 12%
4%
6%
47%
0%
10%
20%
30%
40%
50%
60%
70%
80%
90%
100%
0 - 1 km 1 - 2 km 2 - 5 km 5 - 8 km 8+ km
Walk Underground Bus Rail
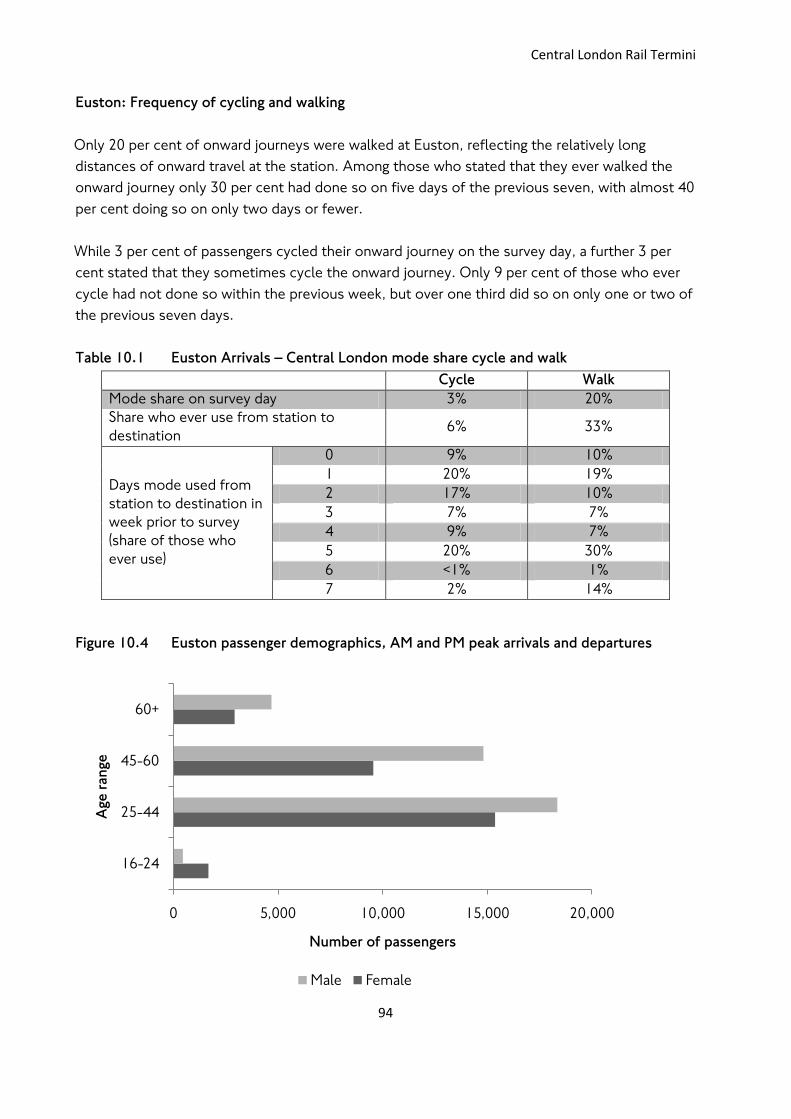
Central London Rail Termini
94
Euston: Frequency of cycling and walking
Only 20 per cent of onward journeys were walked at Euston, reflecting the relatively long
distances of onward travel at the station. Among those who stated that they ever walked the
onward journey only 30 per cent had done so on five days of the previous seven, with almost 40
per cent doing so on only two days or fewer.
While 3 per cent of passengers cycled their onward journey on the survey day, a further 3 per
cent stated that they sometimes cycle the onward journey. Only 9 per cent of those who ever
cycle had not done so within the previous week, but over one third did so on only one or two of
the previous seven days.
Table 10.1 Euston Arrivals – Central London mode share cycle and walk
Cycle Walk
Mode share on survey day 3% 20%
Share who ever use from station to
destination 6% 33%
Days mode used from
station to destination in
week prior to survey
(share of those who
ever use)
0 9% 10%
1 20% 19%
2 17% 10%
3 7% 7%
4 9% 7%
5 20% 30%
6 <1% 1%
7 2% 14%
Figure 10.4 Euston passenger demographics, AM and PM peak arrivals and departures
0 5,000 10,000 15,000 20,000
16-24
25-44
45-60
60+
Number of passengers
Age
ran
ge
Male Female

Analysing passengers‟ onward travel patterns
95
Chapter 11 Summary of findings at Fenchurch Street Figures quoted are for all AM and PM peak arrivals and departures based on 1,116 responses. Passenger flows are rounded to the nearest 500.
AM passenger flows
PM passenger flows
AM peak arrivals 22,500
PM peak departures 19,000
AM busiest hour 0800 - 0900
PM busiest hour 1700 - 1800
arrivals 11,500
departures 9,500
AM peak departures 500
PM peak arrivals 1,000
scale of contraflow in proportion to arrivals 2%
scale of contraflow in proportion to departures 6%
Share of connecting modes in central London
London Underground line used
Underground 58%
District / Circle 87%
Walk 24%
Metropolitan 12%
Bus 9%
Rail 5%
Cycle 1%
Taxi 1%
Purpose in central London
Journey frequency
Usual workplace 89%
5 or more days per week 79%
Other work 5%
3 or 4 days per week 13%
Home 3%
1 or 2 days per week 3%
Leisure/ Entertainment 1%
less than one day per week 5%
Onward distance travelled in central London
Location of trip end outside central London
1st quartile 0.6 km
Within GLA 28%
2nd quartile (median) 1.4 km
Outside GLA 71%
3rd quartile 4 km
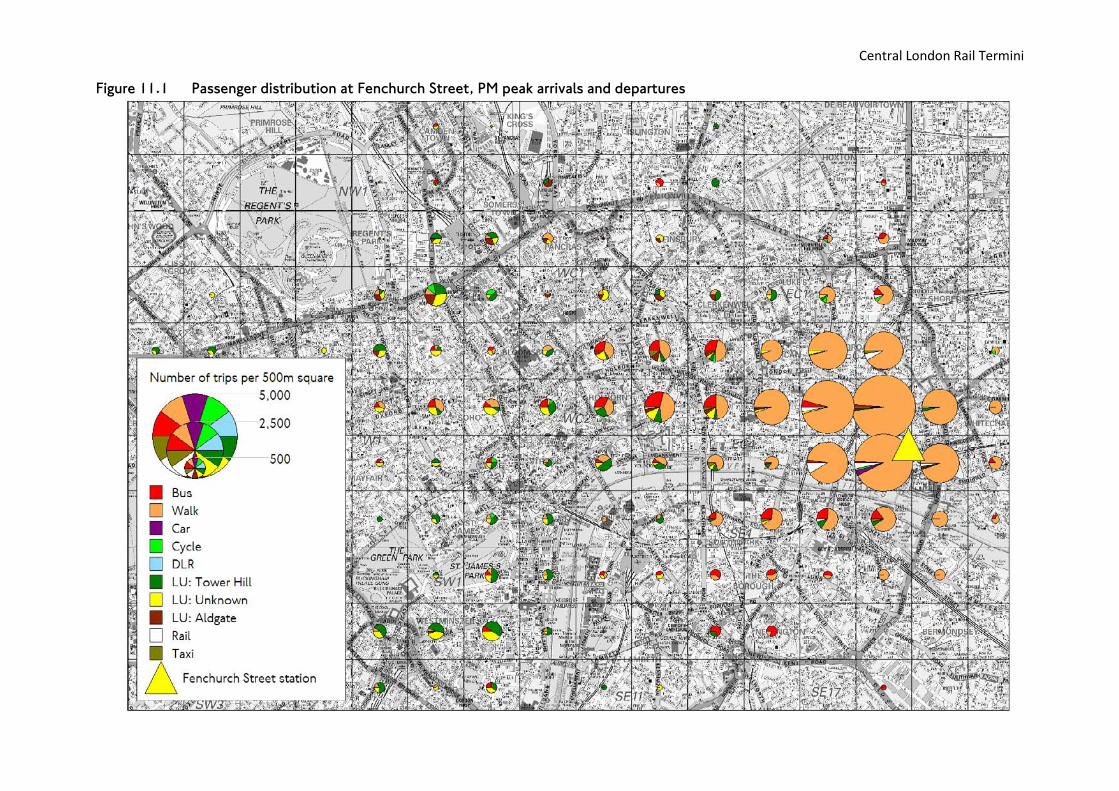
Central London Rail Termini
96
Figure 11.1 Passenger distribution at Fenchurch Street, PM peak arrivals and departures
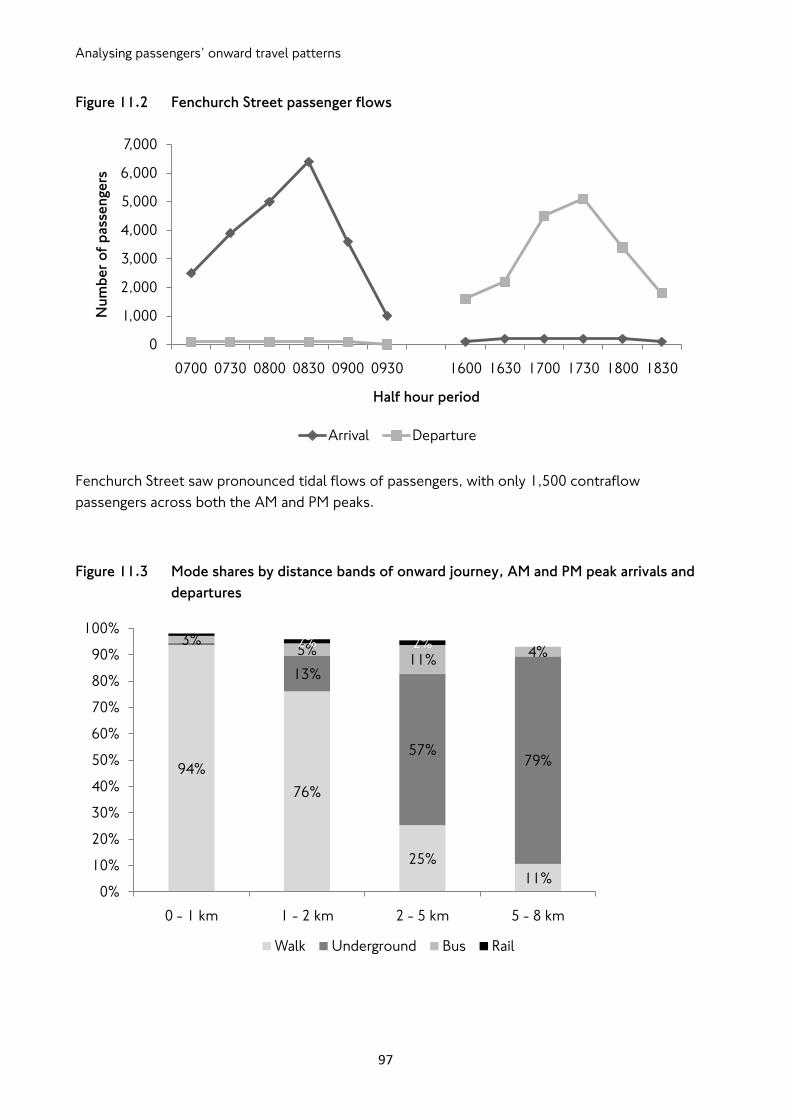
Analysing passengers‟ onward travel patterns
97
Figure 11.2 Fenchurch Street passenger flows
Fenchurch Street saw pronounced tidal flows of passengers, with only 1,500 contraflow
passengers across both the AM and PM peaks.
Figure 11.3 Mode shares by distance bands of onward journey, AM and PM peak arrivals and
departures
0
1,000
2,000
3,000
4,000
5,000
6,000
7,000
0700 0730 0800 0830 0900 0930 1600 1630 1700 1730 1800 1830
Nu
mb
er
of
pass
en
ge
rs
Half hour period
Arrival Departure
94%
76%
25%
11%
13%
57%79%
3%5%
11%4%
2% 2%
0%
10%
20%
30%
40%
50%
60%
70%
80%
90%
100%
0 - 1 km 1 - 2 km 2 - 5 km 5 - 8 km
Walk Underground Bus Rail
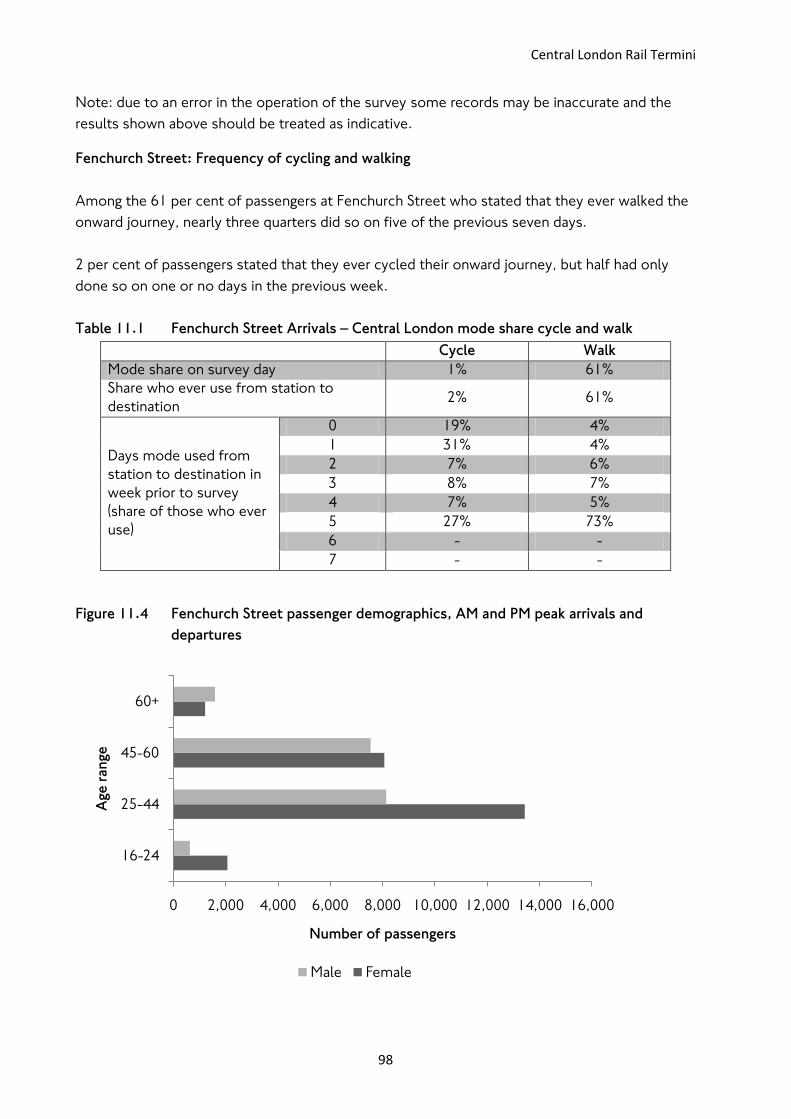
Central London Rail Termini
98
Note: due to an error in the operation of the survey some records may be inaccurate and the
results shown above should be treated as indicative.
Fenchurch Street: Frequency of cycling and walking
Among the 61 per cent of passengers at Fenchurch Street who stated that they ever walked the
onward journey, nearly three quarters did so on five of the previous seven days.
2 per cent of passengers stated that they ever cycled their onward journey, but half had only
done so on one or no days in the previous week.
Table 11.1 Fenchurch Street Arrivals – Central London mode share cycle and walk
Cycle Walk
Mode share on survey day 1% 61%
Share who ever use from station to
destination 2% 61%
Days mode used from
station to destination in
week prior to survey
(share of those who ever
use)
0 19% 4%
1 31% 4%
2 7% 6%
3 8% 7%
4 7% 5%
5 27% 73%
6 - -
7 - -
Figure 11.4 Fenchurch Street passenger demographics, AM and PM peak arrivals and
departures
0 2,000 4,000 6,000 8,000 10,000 12,000 14,000 16,000
16-24
25-44
45-60
60+
Number of passengers
Age
ran
ge
Male Female
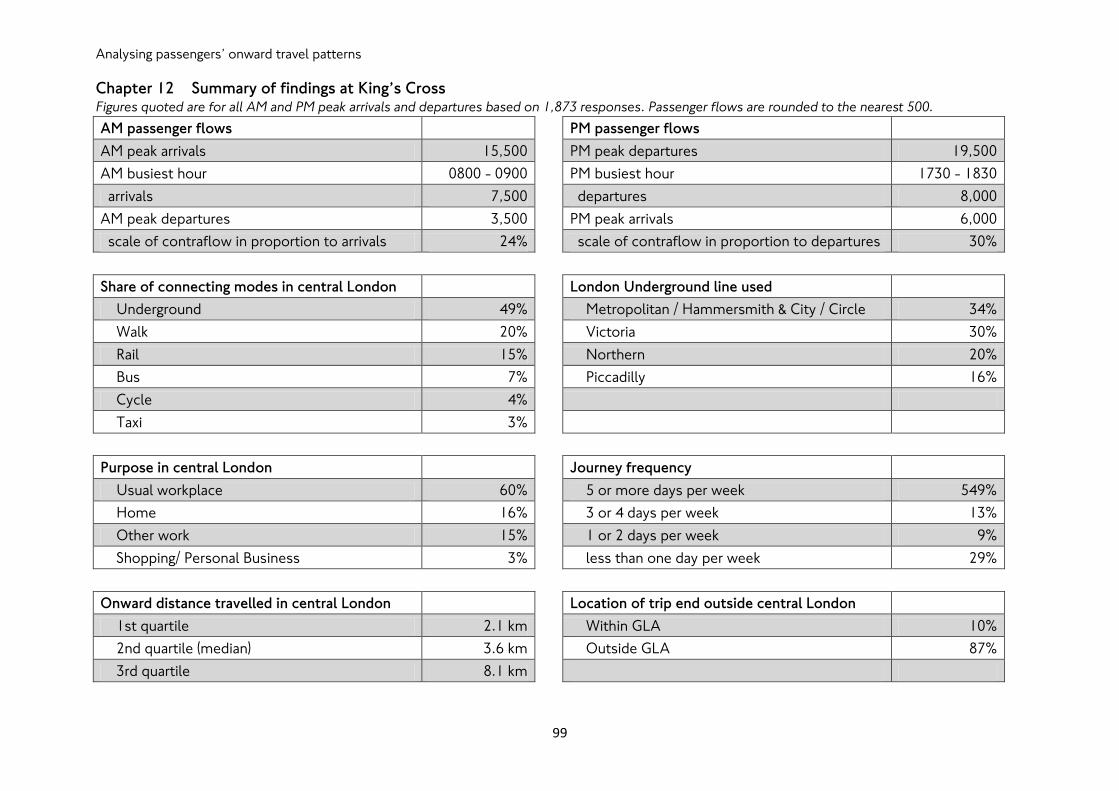
Analysing passengers‟ onward travel patterns
99
Chapter 12 Summary of findings at King’s Cross Figures quoted are for all AM and PM peak arrivals and departures based on 1,873 responses. Passenger flows are rounded to the nearest 500.
AM passenger flows
PM passenger flows
AM peak arrivals 15,500
PM peak departures 19,500
AM busiest hour 0800 - 0900
PM busiest hour 1730 - 1830
arrivals 7,500
departures 8,000
AM peak departures 3,500
PM peak arrivals 6,000
scale of contraflow in proportion to arrivals 24%
scale of contraflow in proportion to departures 30%
Share of connecting modes in central London
London Underground line used
Underground 49%
Metropolitan / Hammersmith & City / Circle 34%
Walk 20%
Victoria 30%
Rail 15%
Northern 20%
Bus 7%
Piccadilly 16%
Cycle 4%
Taxi 3%
Purpose in central London
Journey frequency
Usual workplace 60%
5 or more days per week 549%
Home 16%
3 or 4 days per week 13%
Other work 15%
1 or 2 days per week 9%
Shopping/ Personal Business 3%
less than one day per week 29%
Onward distance travelled in central London
Location of trip end outside central London
1st quartile 2.1 km
Within GLA 10%
2nd quartile (median) 3.6 km
Outside GLA 87%
3rd quartile 8.1 km
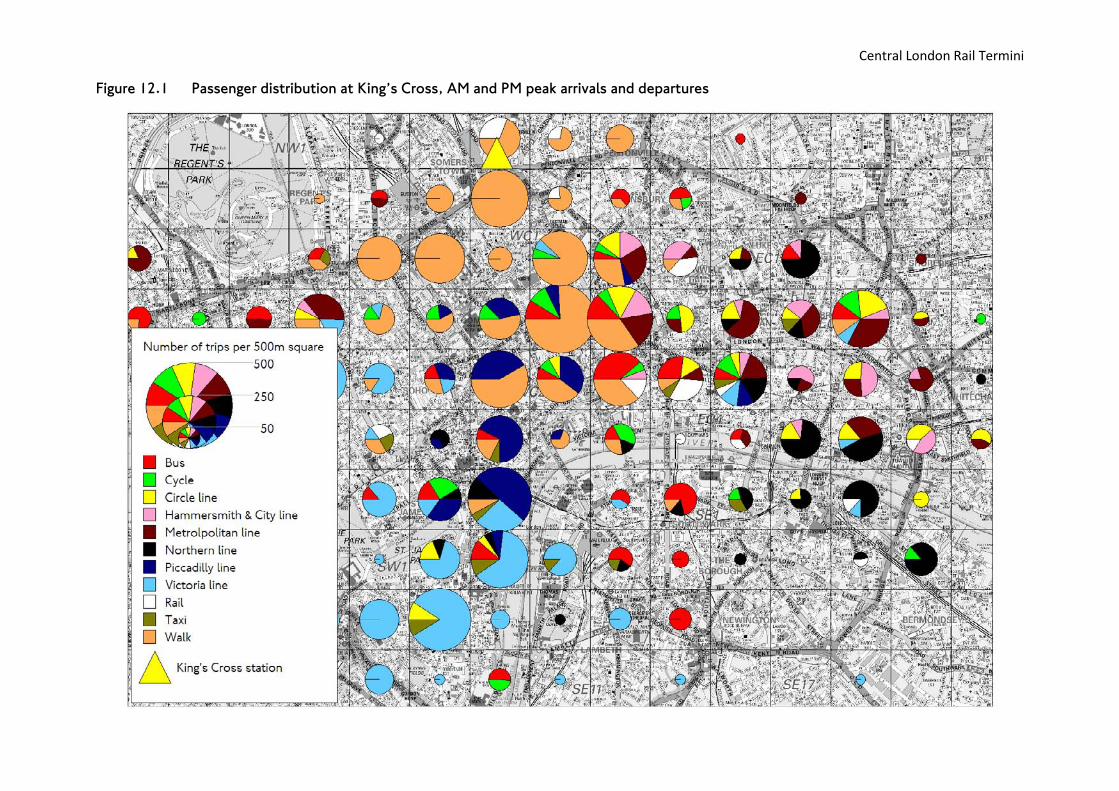
Central London Rail Termini
100
Figure 12.1 Passenger distribution at King’s Cross, AM and PM peak arrivals and departures

Analysing passengers‟ onward travel patterns
101
Figure 12.2 King’s Cross passenger flows
King‟s Cross saw a greater number of passengers in the PM peak than in the AM peak. Many of
these passengers were travelling against the peak flow, with contraflow passengers accounting
for around one quarter of all passengers in the PM peak.
Figure 12.3 Mode shares by distance bands of onward journey, AM and PM peak arrivals and
departures
King‟s Cross saw relatively high cycle mode shares for onward trips between 1km and 8km. 6
per cent of onward journeys between 2km and 5km were made by bicycle.
0
500
1,000
1,500
2,000
2,500
3,000
3,500
4,000
4,500
5,000
0700 0730 0800 0830 0900 0930 1600 1630 1700 1730 1800 1830
Nu
mb
er
of
pass
en
ge
rs
Half hour period
Arrival Departure
87%
64%
11% 10%1%
16%
64%74%
47%
12%13%
3%
6% 4% 6%
40%
2% 4% 6% 3%1% 1% 5% 7%
0%
10%
20%
30%
40%
50%
60%
70%
80%
90%
100%
0 - 1 km 1 - 2 km 2 - 5 km 5 - 8 km 8+ km
Walk Underground Bus Rail Pedal Cycle Taxi
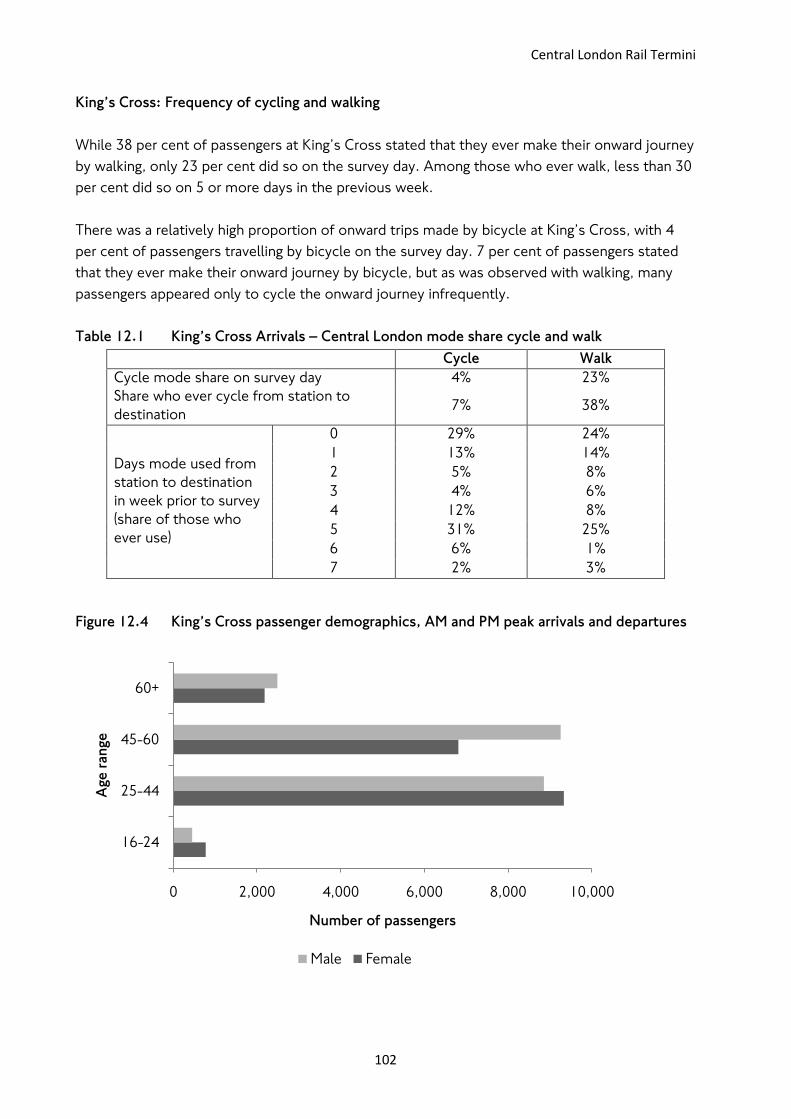
Central London Rail Termini
102
King’s Cross: Frequency of cycling and walking
While 38 per cent of passengers at King‟s Cross stated that they ever make their onward journey
by walking, only 23 per cent did so on the survey day. Among those who ever walk, less than 30
per cent did so on 5 or more days in the previous week.
There was a relatively high proportion of onward trips made by bicycle at King‟s Cross, with 4
per cent of passengers travelling by bicycle on the survey day. 7 per cent of passengers stated
that they ever make their onward journey by bicycle, but as was observed with walking, many
passengers appeared only to cycle the onward journey infrequently.
Table 12.1 King’s Cross Arrivals – Central London mode share cycle and walk
Cycle Walk
Cycle mode share on survey day 4% 23%
Share who ever cycle from station to
destination 7% 38%
Days mode used from
station to destination
in week prior to survey
(share of those who
ever use)
0 29% 24%
1 13% 14%
2 5% 8%
3 4% 6%
4 12% 8%
5 31% 25%
6 6% 1%
7 2% 3%
Figure 12.4 King’s Cross passenger demographics, AM and PM peak arrivals and departures
0 2,000 4,000 6,000 8,000 10,000
16-24
25-44
45-60
60+
Number of passengers
Age
ran
ge
Male Female
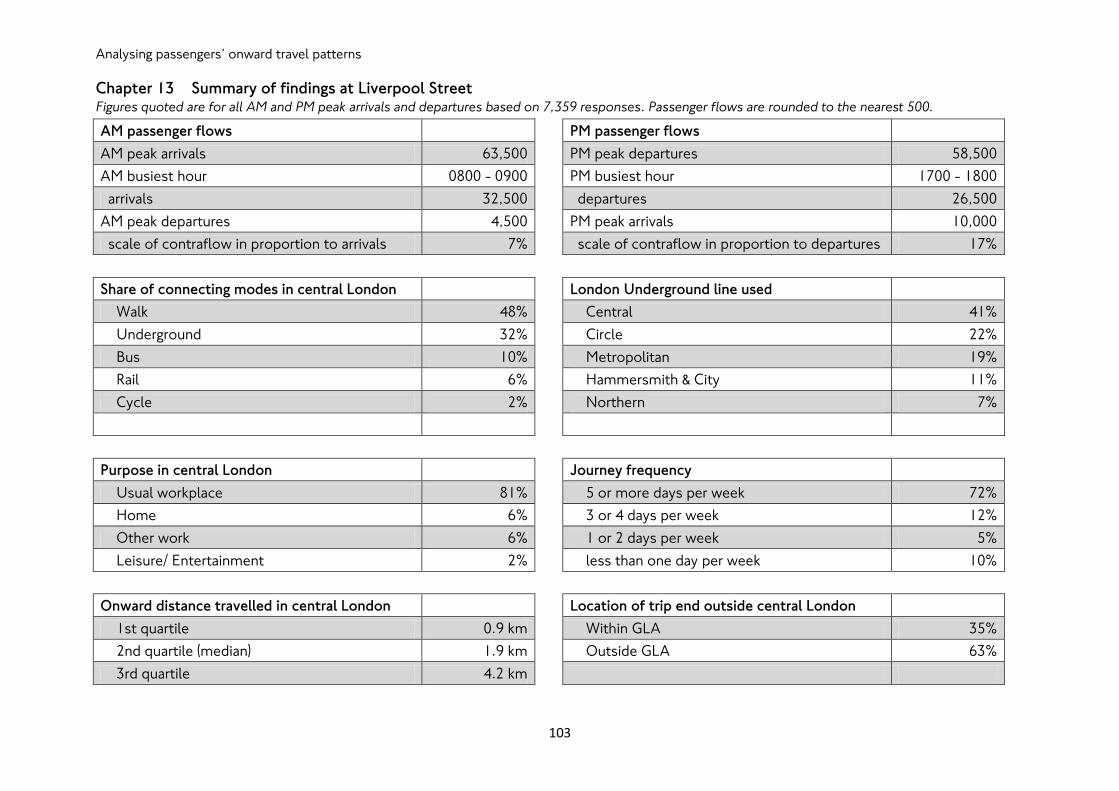
Analysing passengers‟ onward travel patterns
103
Chapter 13 Summary of findings at Liverpool Street Figures quoted are for all AM and PM peak arrivals and departures based on 7,359 responses. Passenger flows are rounded to the nearest 500.
AM passenger flows
PM passenger flows
AM peak arrivals 63,500
PM peak departures 58,500
AM busiest hour 0800 - 0900
PM busiest hour 1700 - 1800
arrivals 32,500
departures 26,500
AM peak departures 4,500
PM peak arrivals 10,000
scale of contraflow in proportion to arrivals 7%
scale of contraflow in proportion to departures 17%
Share of connecting modes in central London
London Underground line used
Walk 48%
Central 41%
Underground 32%
Circle 22%
Bus 10%
Metropolitan 19%
Rail 6%
Hammersmith & City 11%
Cycle 2%
Northern 7%
Purpose in central London
Journey frequency
Usual workplace 81%
5 or more days per week 72%
Home 6%
3 or 4 days per week 12%
Other work 6%
1 or 2 days per week 5%
Leisure/ Entertainment 2%
less than one day per week 10%
Onward distance travelled in central London
Location of trip end outside central London
1st quartile 0.9 km
Within GLA 35%
2nd quartile (median) 1.9 km
Outside GLA 63%
3rd quartile 4.2 km
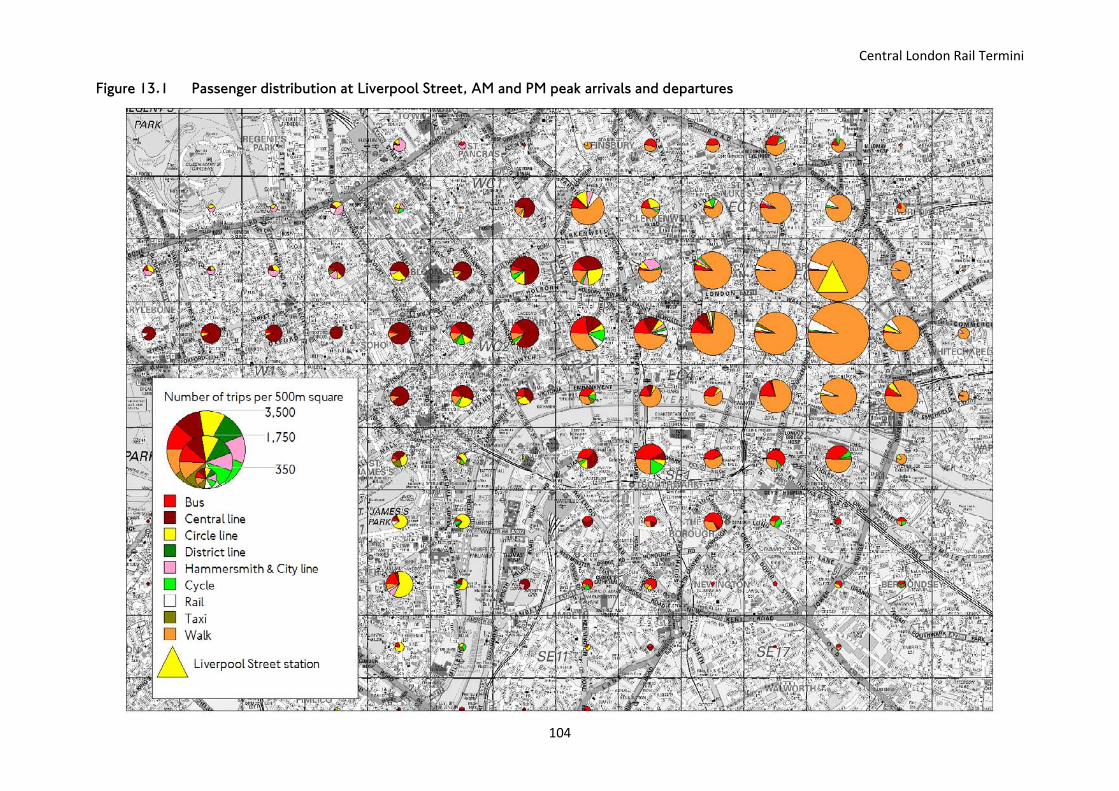
Central London Rail Termini
104
Figure 13.1 Passenger distribution at Liverpool Street, AM and PM peak arrivals and departures
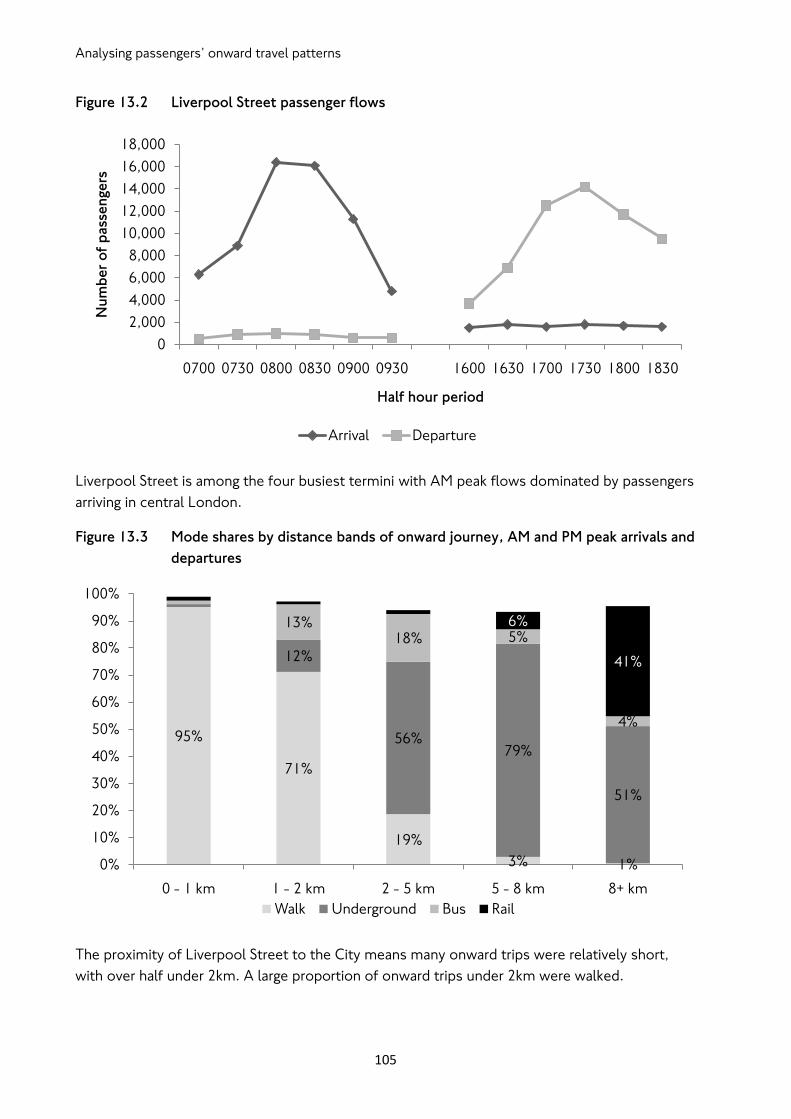
Analysing passengers‟ onward travel patterns
105
Figure 13.2 Liverpool Street passenger flows
Liverpool Street is among the four busiest termini with AM peak flows dominated by passengers
arriving in central London.
Figure 13.3 Mode shares by distance bands of onward journey, AM and PM peak arrivals and
departures
The proximity of Liverpool Street to the City means many onward trips were relatively short,
with over half under 2km. A large proportion of onward trips under 2km were walked.
0
2,000
4,000
6,000
8,000
10,000
12,000
14,000
16,000
18,000
0700 0730 0800 0830 0900 0930 1600 1630 1700 1730 1800 1830
Nu
mb
er
of
pass
en
ge
rs
Half hour period
Arrival Departure
95%
71%
19%
3% 1%
12%
56%79%
51%
13%18% 5%
4%
6%
41%
0%
10%
20%
30%
40%
50%
60%
70%
80%
90%
100%
0 - 1 km 1 - 2 km 2 - 5 km 5 - 8 km 8+ km
Walk Underground Bus Rail
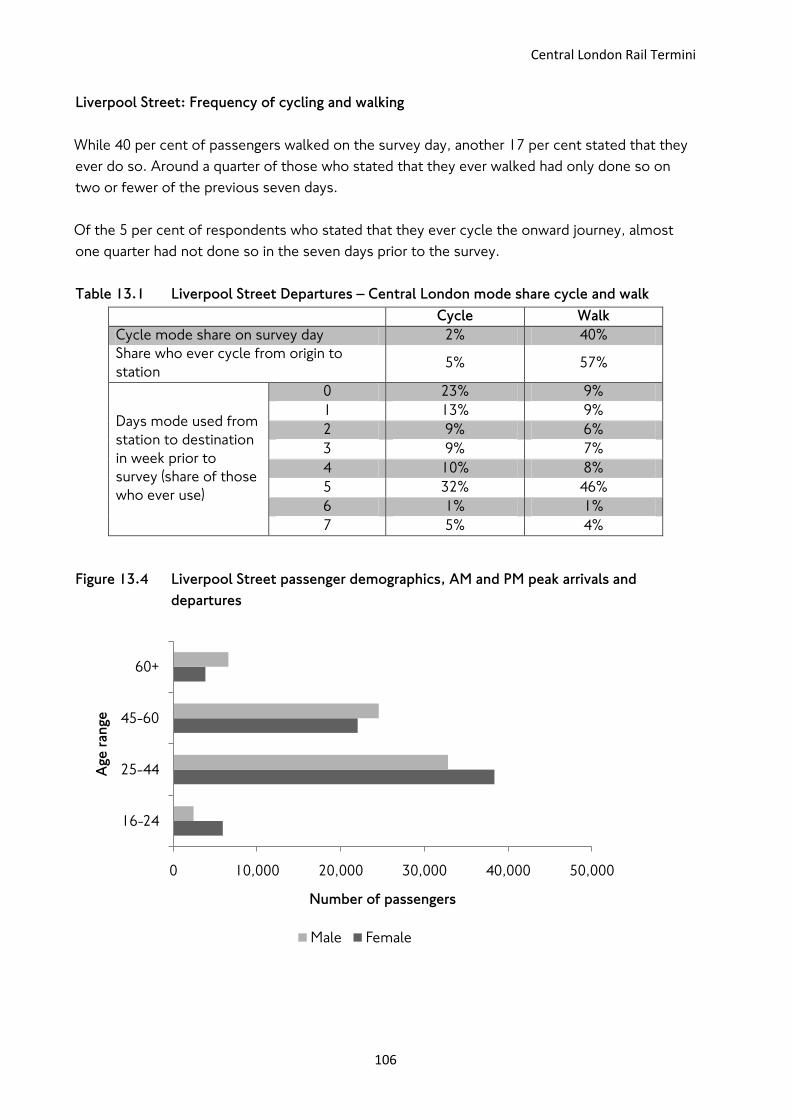
Central London Rail Termini
106
Liverpool Street: Frequency of cycling and walking
While 40 per cent of passengers walked on the survey day, another 17 per cent stated that they
ever do so. Around a quarter of those who stated that they ever walked had only done so on
two or fewer of the previous seven days.
Of the 5 per cent of respondents who stated that they ever cycle the onward journey, almost
one quarter had not done so in the seven days prior to the survey.
Table 13.1 Liverpool Street Departures – Central London mode share cycle and walk
Cycle Walk
Cycle mode share on survey day 2% 40%
Share who ever cycle from origin to
station 5% 57%
Days mode used from
station to destination
in week prior to
survey (share of those
who ever use)
0 23% 9%
1 13% 9%
2 9% 6%
3 9% 7%
4 10% 8%
5 32% 46%
6 1% 1%
7 5% 4%
Figure 13.4 Liverpool Street passenger demographics, AM and PM peak arrivals and
departures
0 10,000 20,000 30,000 40,000 50,000
16-24
25-44
45-60
60+
Number of passengers
Age
ran
ge
Male Female
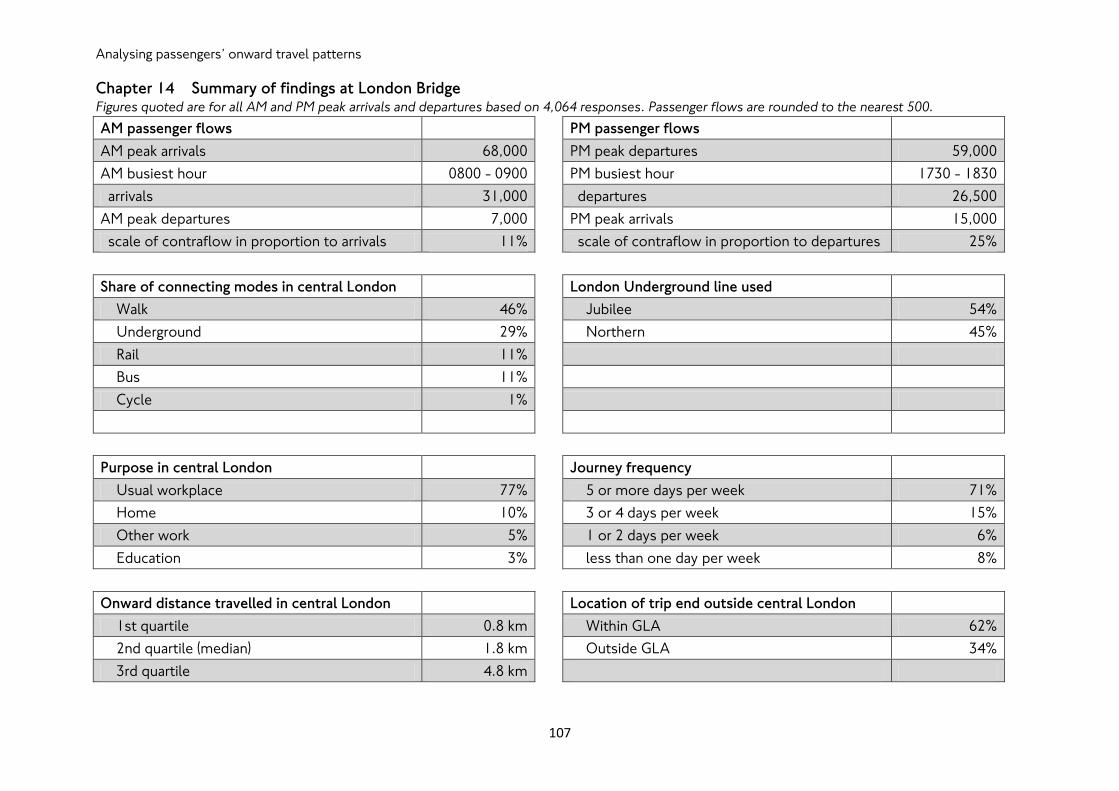
Analysing passengers‟ onward travel patterns
107
Chapter 14 Summary of findings at London Bridge Figures quoted are for all AM and PM peak arrivals and departures based on 4,064 responses. Passenger flows are rounded to the nearest 500.
AM passenger flows
PM passenger flows
AM peak arrivals 68,000
PM peak departures 59,000
AM busiest hour 0800 - 0900
PM busiest hour 1730 - 1830
arrivals 31,000
departures 26,500
AM peak departures 7,000
PM peak arrivals 15,000
scale of contraflow in proportion to arrivals 11%
scale of contraflow in proportion to departures 25%
Share of connecting modes in central London
London Underground line used
Walk 46%
Jubilee 54%
Underground 29%
Northern 45%
Rail 11%
Bus 11%
Cycle 1%
Purpose in central London
Journey frequency
Usual workplace 77%
5 or more days per week 71%
Home 10%
3 or 4 days per week 15%
Other work 5%
1 or 2 days per week 6%
Education 3%
less than one day per week 8%
Onward distance travelled in central London
Location of trip end outside central London
1st quartile 0.8 km
Within GLA 62%
2nd quartile (median) 1.8 km
Outside GLA 34%
3rd quartile 4.8 km

Central London Rail Termini
108
Figure 14.1 Passenger distribution at London Bridge, AM and PM peak arrivals and departures
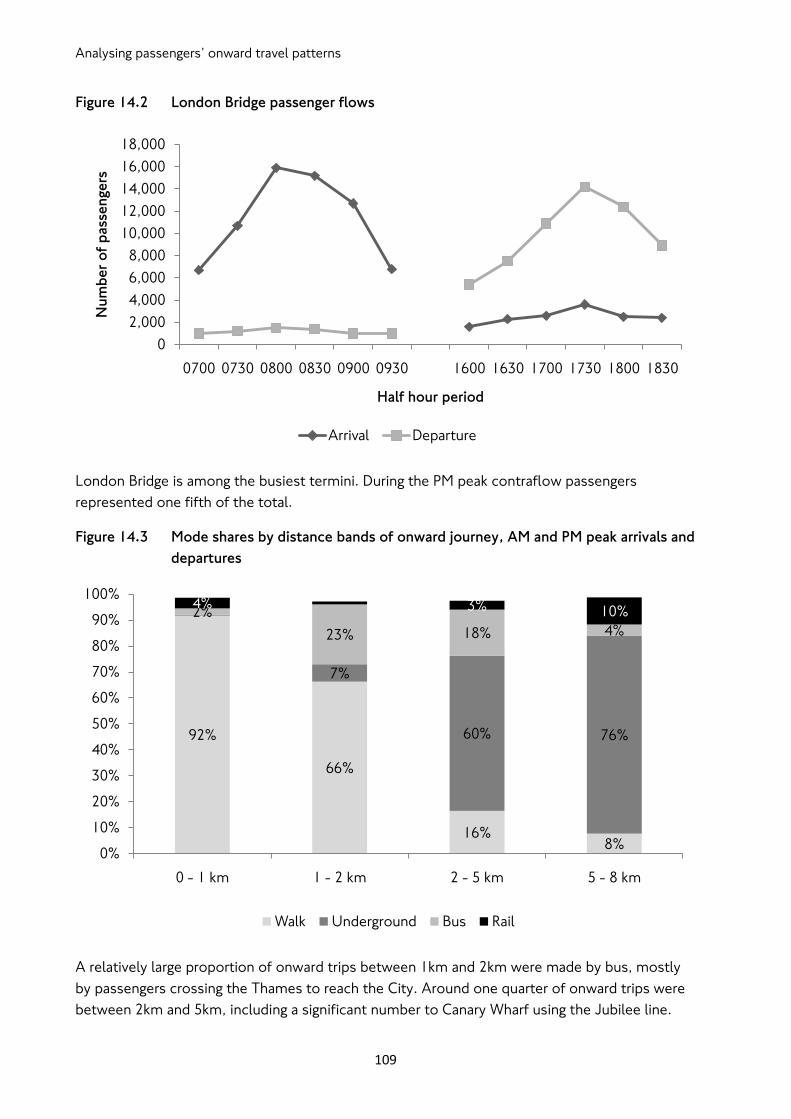
Analysing passengers‟ onward travel patterns
109
Figure 14.2 London Bridge passenger flows
London Bridge is among the busiest termini. During the PM peak contraflow passengers
represented one fifth of the total.
Figure 14.3 Mode shares by distance bands of onward journey, AM and PM peak arrivals and
departures
A relatively large proportion of onward trips between 1km and 2km were made by bus, mostly
by passengers crossing the Thames to reach the City. Around one quarter of onward trips were
between 2km and 5km, including a significant number to Canary Wharf using the Jubilee line.
0
2,000
4,000
6,000
8,000
10,000
12,000
14,000
16,000
18,000
0700 0730 0800 0830 0900 0930 1600 1630 1700 1730 1800 1830
Nu
mb
er
of
pass
en
ge
rs
Half hour period
Arrival Departure
92%
66%
16%8%
7%
60% 76%
2%
23% 18% 4%
4% 3% 10%
0%
10%
20%
30%
40%
50%
60%
70%
80%
90%
100%
0 - 1 km 1 - 2 km 2 - 5 km 5 - 8 km
Walk Underground Bus Rail
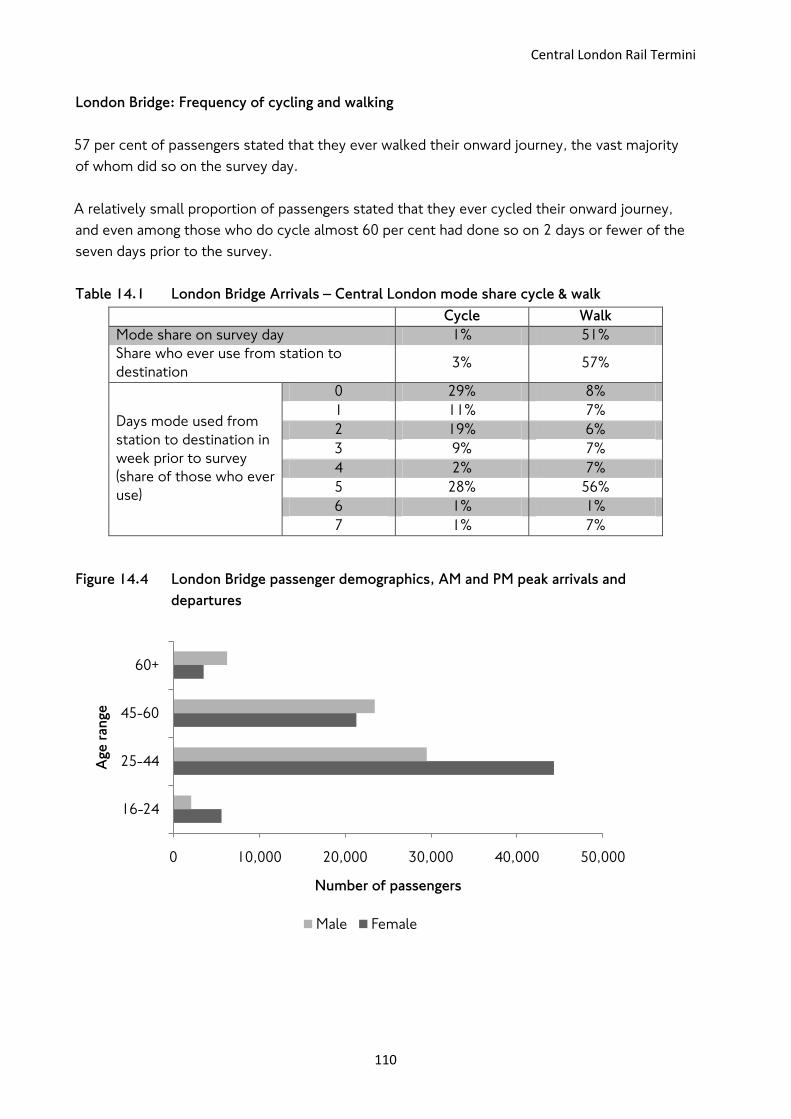
Central London Rail Termini
110
London Bridge: Frequency of cycling and walking
57 per cent of passengers stated that they ever walked their onward journey, the vast majority
of whom did so on the survey day.
A relatively small proportion of passengers stated that they ever cycled their onward journey,
and even among those who do cycle almost 60 per cent had done so on 2 days or fewer of the
seven days prior to the survey.
Table 14.1 London Bridge Arrivals – Central London mode share cycle & walk
Cycle Walk
Mode share on survey day 1% 51%
Share who ever use from station to
destination 3% 57%
Days mode used from
station to destination in
week prior to survey
(share of those who ever
use)
0 29% 8%
1 11% 7%
2 19% 6%
3 9% 7%
4 2% 7%
5 28% 56%
6 1% 1%
7 1% 7%
Figure 14.4 London Bridge passenger demographics, AM and PM peak arrivals and
departures
0 10,000 20,000 30,000 40,000 50,000
16-24
25-44
45-60
60+
Number of passengers
Age
ran
ge
Male Female
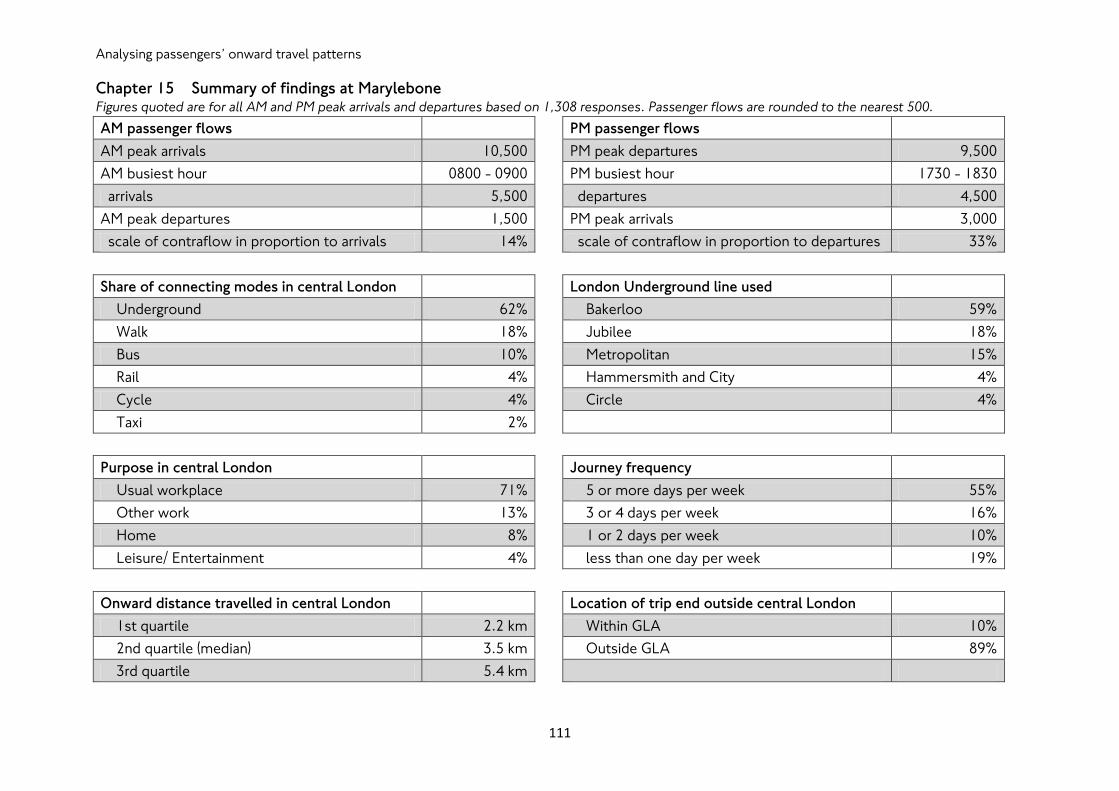
Analysing passengers‟ onward travel patterns
111
Chapter 15 Summary of findings at Marylebone Figures quoted are for all AM and PM peak arrivals and departures based on 1,308 responses. Passenger flows are rounded to the nearest 500.
AM passenger flows
PM passenger flows
AM peak arrivals 10,500
PM peak departures 9,500
AM busiest hour 0800 - 0900
PM busiest hour 1730 - 1830
arrivals 5,500
departures 4,500
AM peak departures 1,500
PM peak arrivals 3,000
scale of contraflow in proportion to arrivals 14%
scale of contraflow in proportion to departures 33%
Share of connecting modes in central London
London Underground line used
Underground 62%
Bakerloo 59%
Walk 18%
Jubilee 18%
Bus 10%
Metropolitan 15%
Rail 4%
Hammersmith and City 4%
Cycle 4%
Circle 4%
Taxi 2%
Purpose in central London
Journey frequency
Usual workplace 71%
5 or more days per week 55%
Other work 13%
3 or 4 days per week 16%
Home 8%
1 or 2 days per week 10%
Leisure/ Entertainment 4%
less than one day per week 19%
Onward distance travelled in central London
Location of trip end outside central London
1st quartile 2.2 km
Within GLA 10%
2nd quartile (median) 3.5 km
Outside GLA 89%
3rd quartile 5.4 km
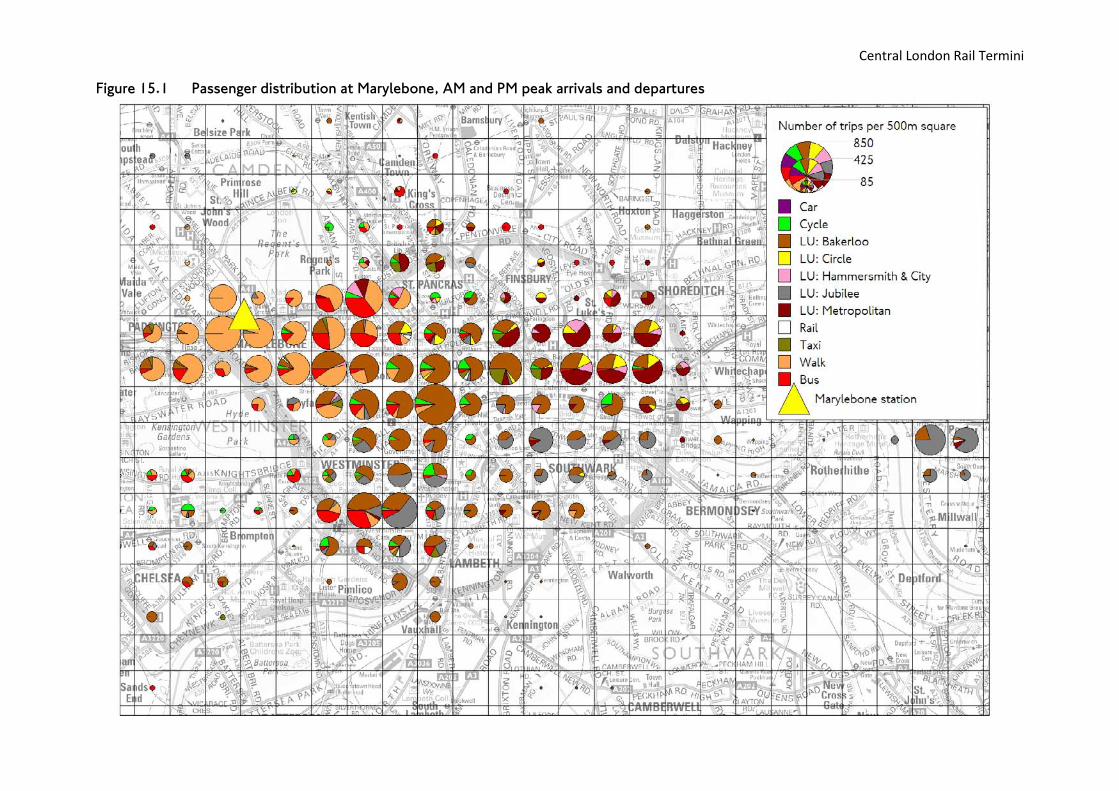
Central London Rail Termini
112
Figure 15.1 Passenger distribution at Marylebone, AM and PM peak arrivals and departures
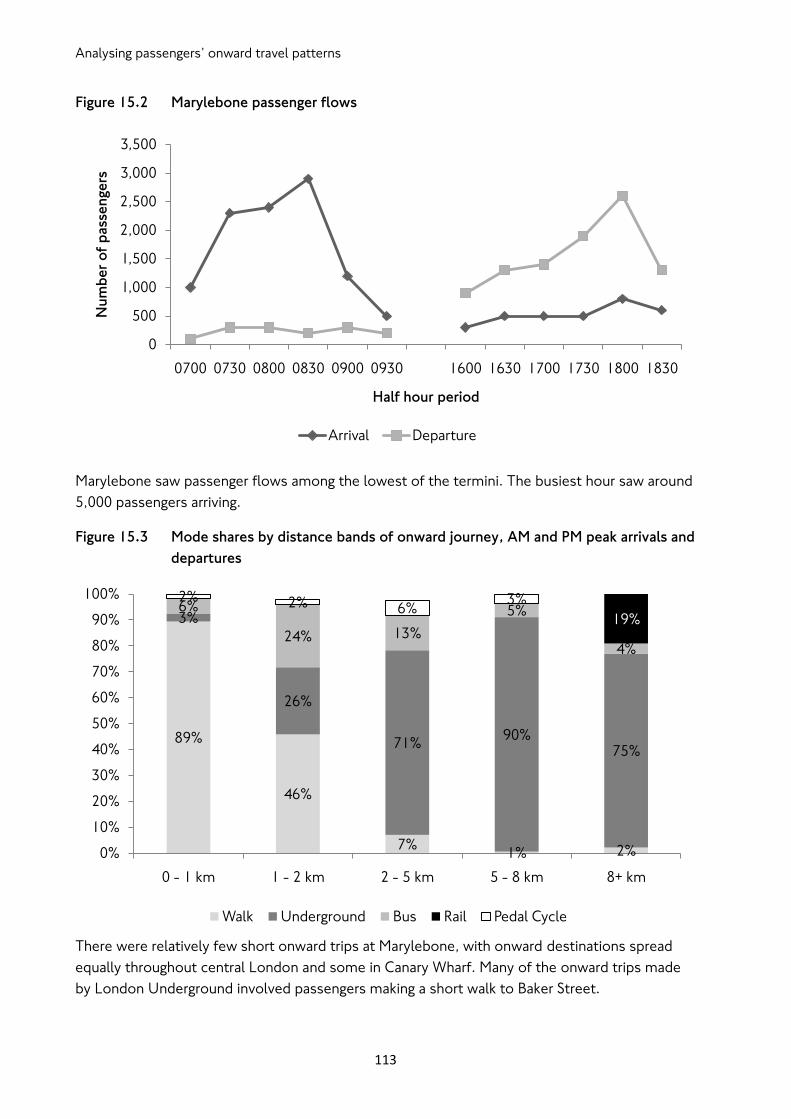
Analysing passengers‟ onward travel patterns
113
Figure 15.2 Marylebone passenger flows
Marylebone saw passenger flows among the lowest of the termini. The busiest hour saw around
5,000 passengers arriving.
Figure 15.3 Mode shares by distance bands of onward journey, AM and PM peak arrivals and
departures
There were relatively few short onward trips at Marylebone, with onward destinations spread
equally throughout central London and some in Canary Wharf. Many of the onward trips made
by London Underground involved passengers making a short walk to Baker Street.
0
500
1,000
1,500
2,000
2,500
3,000
3,500
0700 0730 0800 0830 0900 0930 1600 1630 1700 1730 1800 1830
Nu
mb
er
of
pass
en
ge
rs
Half hour period
Arrival Departure
89%
46%
7%1% 2%
3%
26%
71%90%
75%
6%
24% 13%
5%
4%
19%
2% 2% 6%3%
0%
10%
20%
30%
40%
50%
60%
70%
80%
90%
100%
0 - 1 km 1 - 2 km 2 - 5 km 5 - 8 km 8+ km
Walk Underground Bus Rail Pedal Cycle
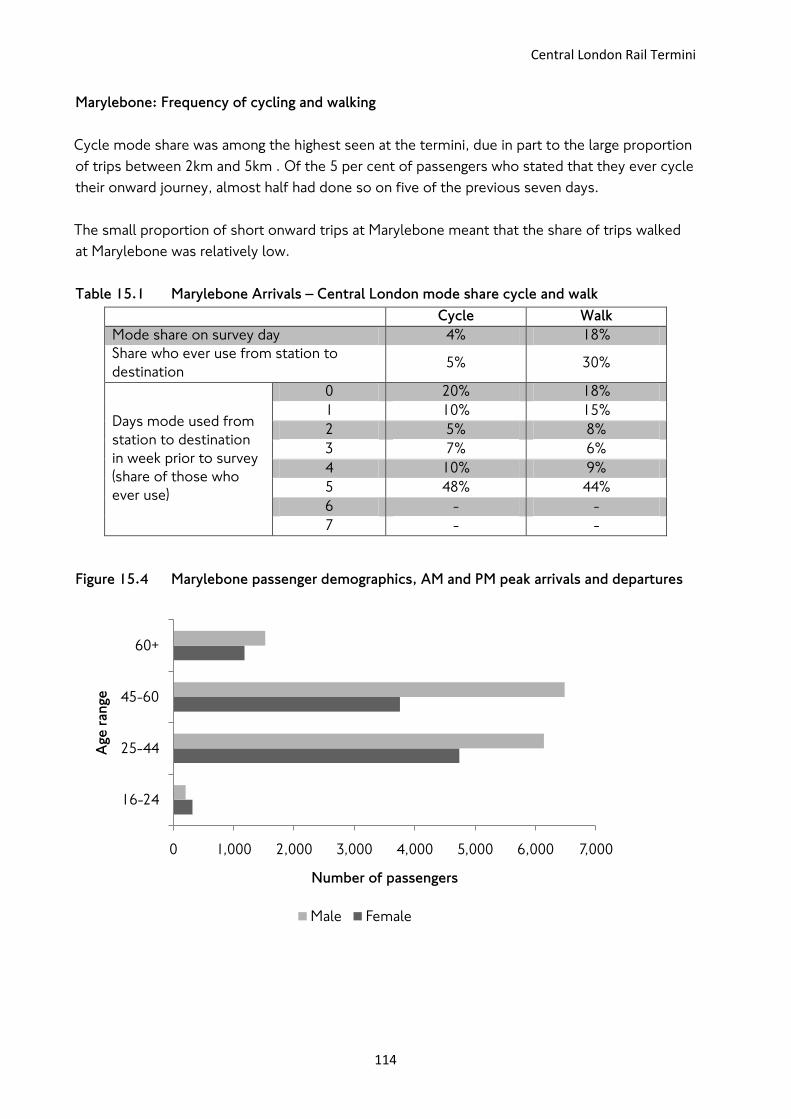
Central London Rail Termini
114
Marylebone: Frequency of cycling and walking
Cycle mode share was among the highest seen at the termini, due in part to the large proportion
of trips between 2km and 5km . Of the 5 per cent of passengers who stated that they ever cycle
their onward journey, almost half had done so on five of the previous seven days.
The small proportion of short onward trips at Marylebone meant that the share of trips walked
at Marylebone was relatively low.
Table 15.1 Marylebone Arrivals – Central London mode share cycle and walk
Cycle Walk
Mode share on survey day 4% 18%
Share who ever use from station to
destination 5% 30%
Days mode used from
station to destination
in week prior to survey
(share of those who
ever use)
0 20% 18%
1 10% 15%
2 5% 8%
3 7% 6%
4 10% 9%
5 48% 44%
6 - -
7 - -
Figure 15.4 Marylebone passenger demographics, AM and PM peak arrivals and departures
0 1,000 2,000 3,000 4,000 5,000 6,000 7,000
16-24
25-44
45-60
60+
Number of passengers
Age
ran
ge
Male Female
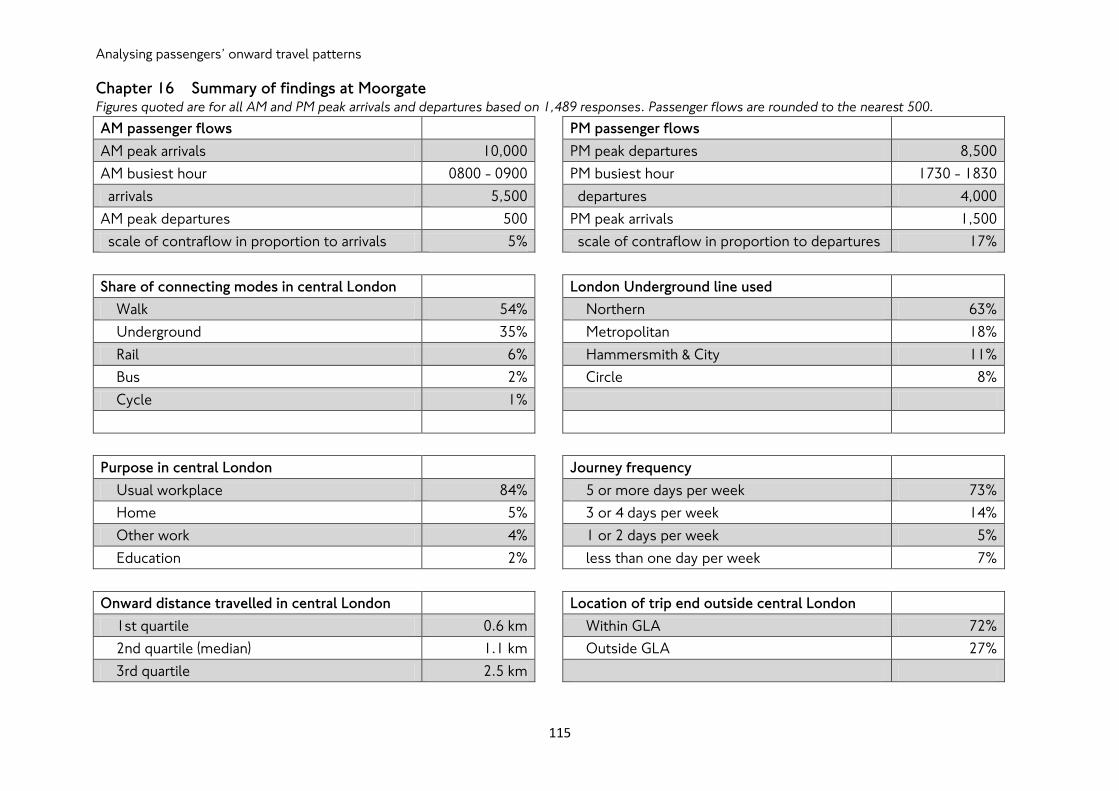
Analysing passengers‟ onward travel patterns
115
Chapter 16 Summary of findings at Moorgate Figures quoted are for all AM and PM peak arrivals and departures based on 1,489 responses. Passenger flows are rounded to the nearest 500.
AM passenger flows
PM passenger flows
AM peak arrivals 10,000
PM peak departures 8,500
AM busiest hour 0800 - 0900
PM busiest hour 1730 - 1830
arrivals 5,500
departures 4,000
AM peak departures 500
PM peak arrivals 1,500
scale of contraflow in proportion to arrivals 5%
scale of contraflow in proportion to departures 17%
Share of connecting modes in central London
London Underground line used
Walk 54%
Northern 63%
Underground 35%
Metropolitan 18%
Rail 6%
Hammersmith & City 11%
Bus 2%
Circle 8%
Cycle 1%
Purpose in central London
Journey frequency
Usual workplace 84%
5 or more days per week 73%
Home 5%
3 or 4 days per week 14%
Other work 4%
1 or 2 days per week 5%
Education 2%
less than one day per week 7%
Onward distance travelled in central London
Location of trip end outside central London
1st quartile 0.6 km
Within GLA 72%
2nd quartile (median) 1.1 km
Outside GLA 27%
3rd quartile 2.5 km
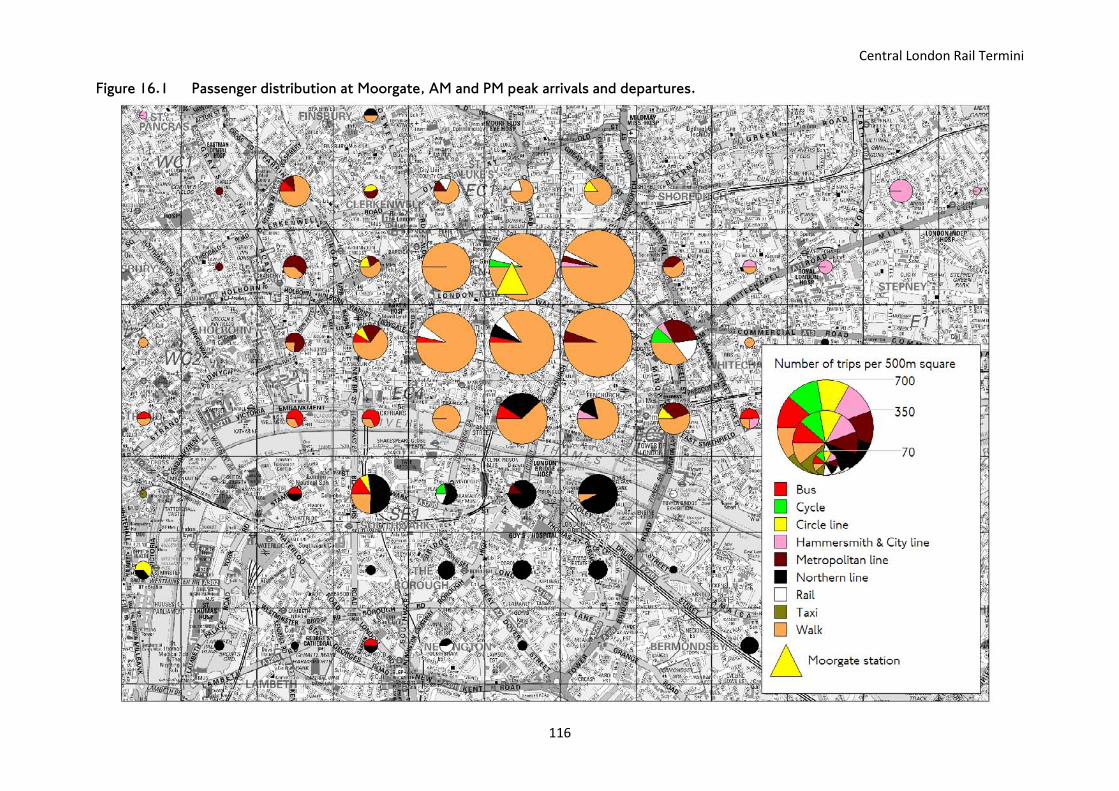
Central London Rail Termini
116
Figure 16.1 Passenger distribution at Moorgate, AM and PM peak arrivals and departures.
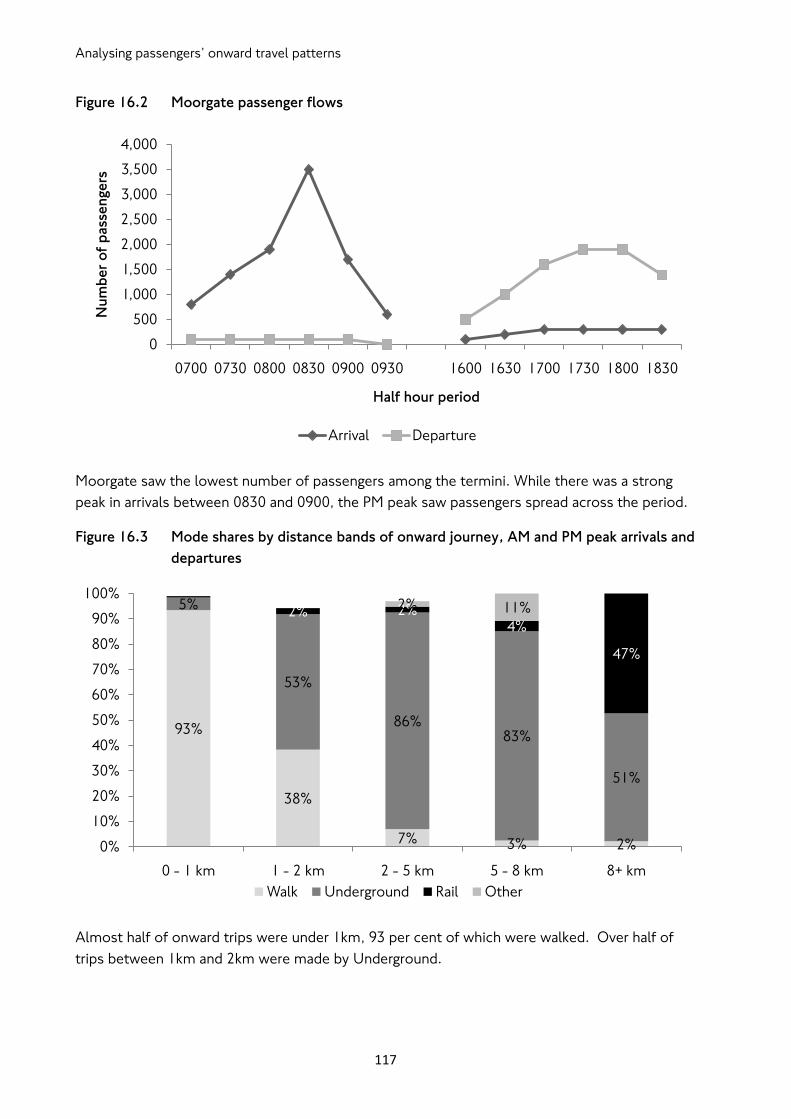
Analysing passengers‟ onward travel patterns
117
Figure 16.2 Moorgate passenger flows
Moorgate saw the lowest number of passengers among the termini. While there was a strong
peak in arrivals between 0830 and 0900, the PM peak saw passengers spread across the period.
Figure 16.3 Mode shares by distance bands of onward journey, AM and PM peak arrivals and
departures
Almost half of onward trips were under 1km, 93 per cent of which were walked. Over half of
trips between 1km and 2km were made by Underground.
0
500
1,000
1,500
2,000
2,500
3,000
3,500
4,000
0700 0730 0800 0830 0900 0930 1600 1630 1700 1730 1800 1830
Nu
mb
er
of
pass
en
ge
rs
Half hour period
Arrival Departure
93%
38%
7% 3% 2%
5%
53%
86%83%
51%
2% 2%4%
47%
2% 11%
0%
10%
20%
30%
40%
50%
60%
70%
80%
90%
100%
0 - 1 km 1 - 2 km 2 - 5 km 5 - 8 km 8+ km
Walk Underground Rail Other
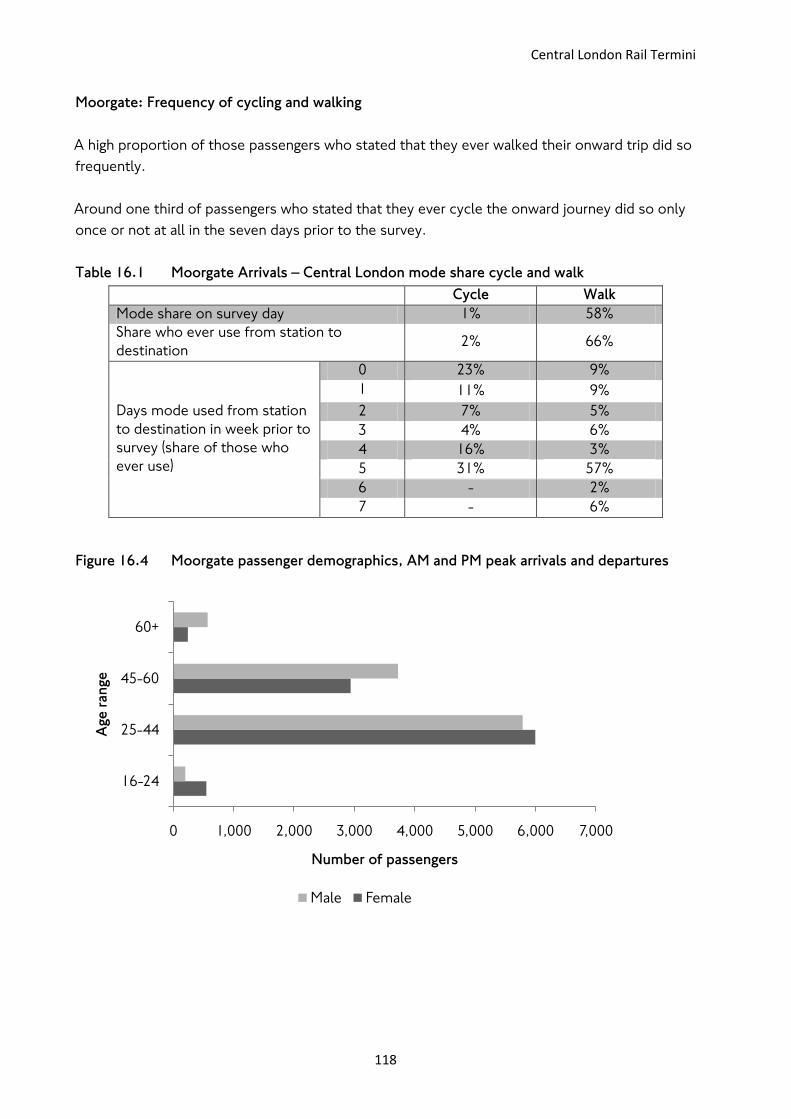
Central London Rail Termini
118
Moorgate: Frequency of cycling and walking
A high proportion of those passengers who stated that they ever walked their onward trip did so
frequently.
Around one third of passengers who stated that they ever cycle the onward journey did so only
once or not at all in the seven days prior to the survey.
Table 16.1 Moorgate Arrivals – Central London mode share cycle and walk
Cycle Walk
Mode share on survey day 1% 58%
Share who ever use from station to
destination 2% 66%
Days mode used from station
to destination in week prior to
survey (share of those who
ever use)
0 23% 9%
1 11% 9%
2 7% 5%
3 4% 6%
4 16% 3%
5 31% 57%
6 - 2%
7 - 6%
Figure 16.4 Moorgate passenger demographics, AM and PM peak arrivals and departures
0 1,000 2,000 3,000 4,000 5,000 6,000 7,000
16-24
25-44
45-60
60+
Number of passengers
Age
ran
ge
Male Female
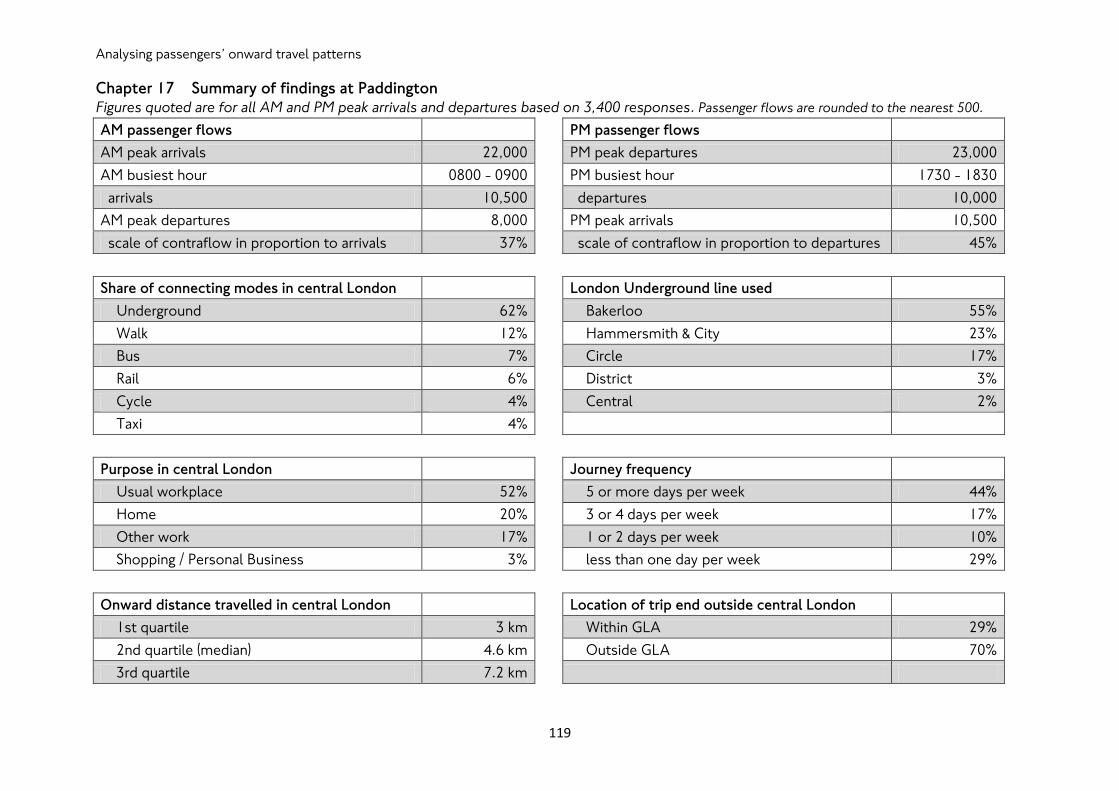
Analysing passengers‟ onward travel patterns
119
Chapter 17 Summary of findings at Paddington Figures quoted are for all AM and PM peak arrivals and departures based on 3,400 responses. Passenger flows are rounded to the nearest 500.
AM passenger flows
PM passenger flows
AM peak arrivals 22,000
PM peak departures 23,000
AM busiest hour 0800 - 0900
PM busiest hour 1730 - 1830
arrivals 10,500
departures 10,000
AM peak departures 8,000
PM peak arrivals 10,500
scale of contraflow in proportion to arrivals 37%
scale of contraflow in proportion to departures 45%
Share of connecting modes in central London
London Underground line used
Underground 62%
Bakerloo 55%
Walk 12%
Hammersmith & City 23%
Bus 7%
Circle 17%
Rail 6%
District 3%
Cycle 4%
Central 2%
Taxi 4%
Purpose in central London
Journey frequency
Usual workplace 52%
5 or more days per week 44%
Home 20%
3 or 4 days per week 17%
Other work 17%
1 or 2 days per week 10%
Shopping / Personal Business 3%
less than one day per week 29%
Onward distance travelled in central London
Location of trip end outside central London
1st quartile 3 km
Within GLA 29%
2nd quartile (median) 4.6 km
Outside GLA 70%
3rd quartile 7.2 km
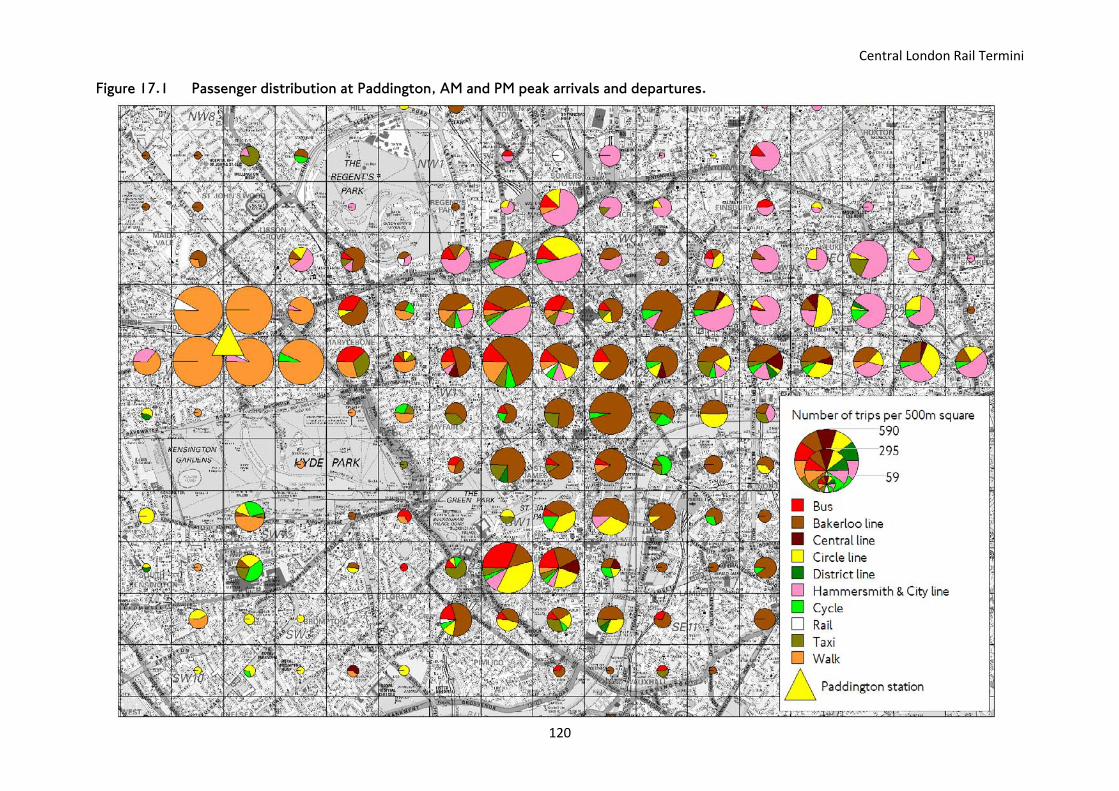
Central London Rail Termini
120
Figure 17.1 Passenger distribution at Paddington, AM and PM peak arrivals and departures.
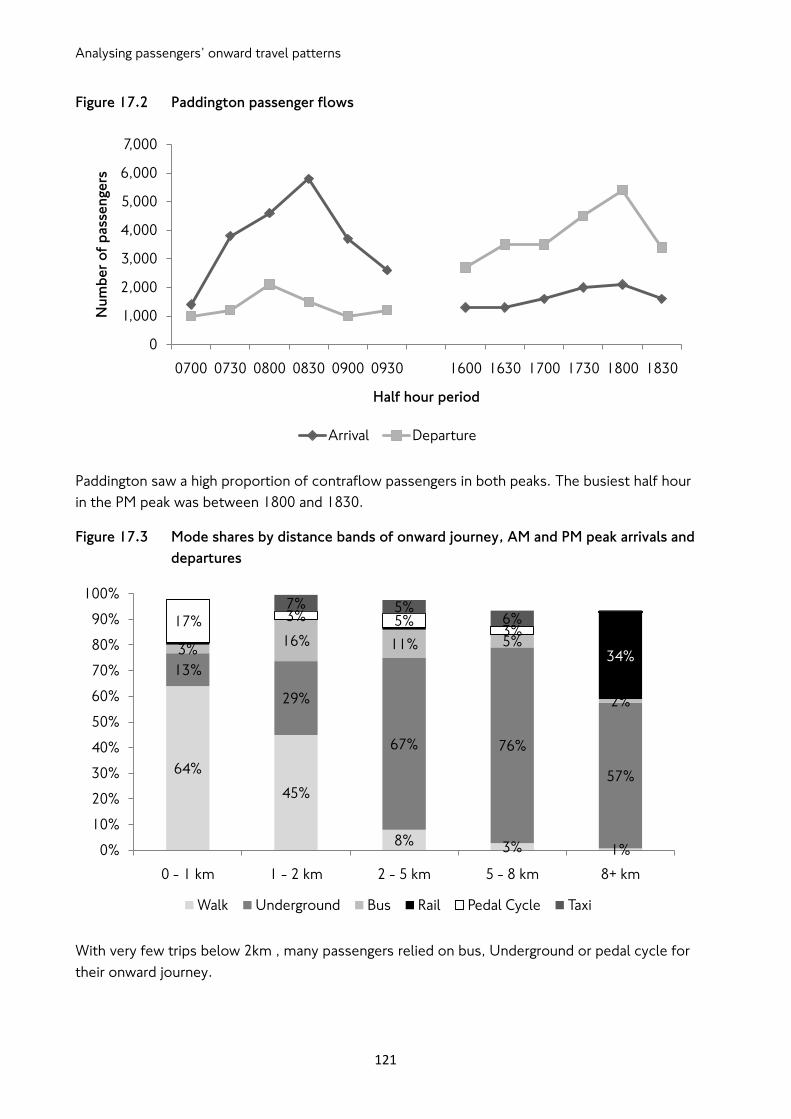
Analysing passengers‟ onward travel patterns
121
Figure 17.2 Paddington passenger flows
Paddington saw a high proportion of contraflow passengers in both peaks. The busiest half hour
in the PM peak was between 1800 and 1830.
Figure 17.3 Mode shares by distance bands of onward journey, AM and PM peak arrivals and
departures
With very few trips below 2km , many passengers relied on bus, Underground or pedal cycle for
their onward journey.
0
1,000
2,000
3,000
4,000
5,000
6,000
7,000
0700 0730 0800 0830 0900 0930 1600 1630 1700 1730 1800 1830
Nu
mb
er
of
pass
en
ge
rs
Half hour period
Arrival Departure
64%
45%
8% 3% 1%
13%
29%
67% 76%
57%
3%16% 11% 5%
2%
34%
17% 3% 5%3%
7% 5%6%
0%
10%
20%
30%
40%
50%
60%
70%
80%
90%
100%
0 - 1 km 1 - 2 km 2 - 5 km 5 - 8 km 8+ km
Walk Underground Bus Rail Pedal Cycle Taxi
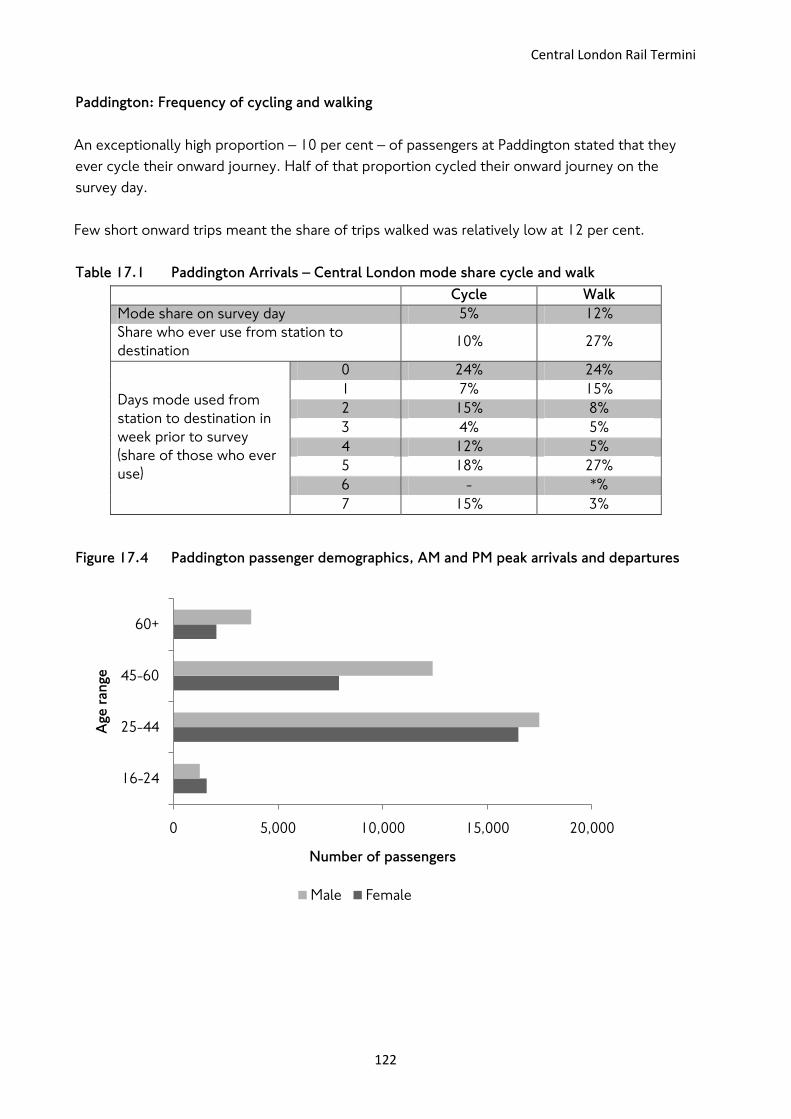
Central London Rail Termini
122
Paddington: Frequency of cycling and walking
An exceptionally high proportion – 10 per cent – of passengers at Paddington stated that they
ever cycle their onward journey. Half of that proportion cycled their onward journey on the
survey day.
Few short onward trips meant the share of trips walked was relatively low at 12 per cent.
Table 17.1 Paddington Arrivals – Central London mode share cycle and walk
Cycle Walk
Mode share on survey day 5% 12%
Share who ever use from station to
destination 10% 27%
Days mode used from
station to destination in
week prior to survey
(share of those who ever
use)
0 24% 24%
1 7% 15%
2 15% 8%
3 4% 5%
4 12% 5%
5 18% 27%
6 - *%
7 15% 3%
Figure 17.4 Paddington passenger demographics, AM and PM peak arrivals and departures
0 5,000 10,000 15,000 20,000
16-24
25-44
45-60
60+
Number of passengers
Age
ran
ge
Male Female
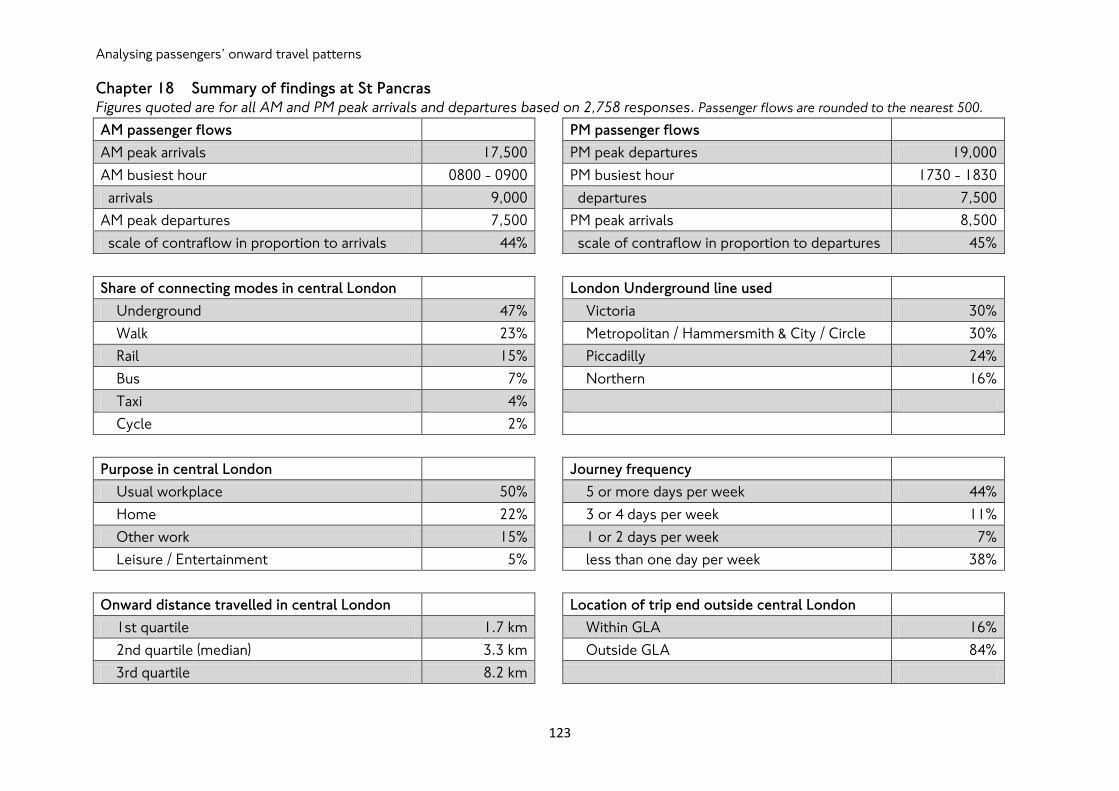
Analysing passengers‟ onward travel patterns
123
Chapter 18 Summary of findings at St Pancras Figures quoted are for all AM and PM peak arrivals and departures based on 2,758 responses. Passenger flows are rounded to the nearest 500.
AM passenger flows
PM passenger flows
AM peak arrivals 17,500
PM peak departures 19,000
AM busiest hour 0800 - 0900
PM busiest hour 1730 - 1830
arrivals 9,000
departures 7,500
AM peak departures 7,500
PM peak arrivals 8,500
scale of contraflow in proportion to arrivals 44%
scale of contraflow in proportion to departures 45%
Share of connecting modes in central London
London Underground line used
Underground 47%
Victoria 30%
Walk 23%
Metropolitan / Hammersmith & City / Circle 30%
Rail 15%
Piccadilly 24%
Bus 7%
Northern 16%
Taxi 4%
Cycle 2%
Purpose in central London
Journey frequency
Usual workplace 50%
5 or more days per week 44%
Home 22%
3 or 4 days per week 11%
Other work 15%
1 or 2 days per week 7%
Leisure / Entertainment 5%
less than one day per week 38%
Onward distance travelled in central London
Location of trip end outside central London
1st quartile 1.7 km
Within GLA 16%
2nd quartile (median) 3.3 km
Outside GLA 84%
3rd quartile 8.2 km
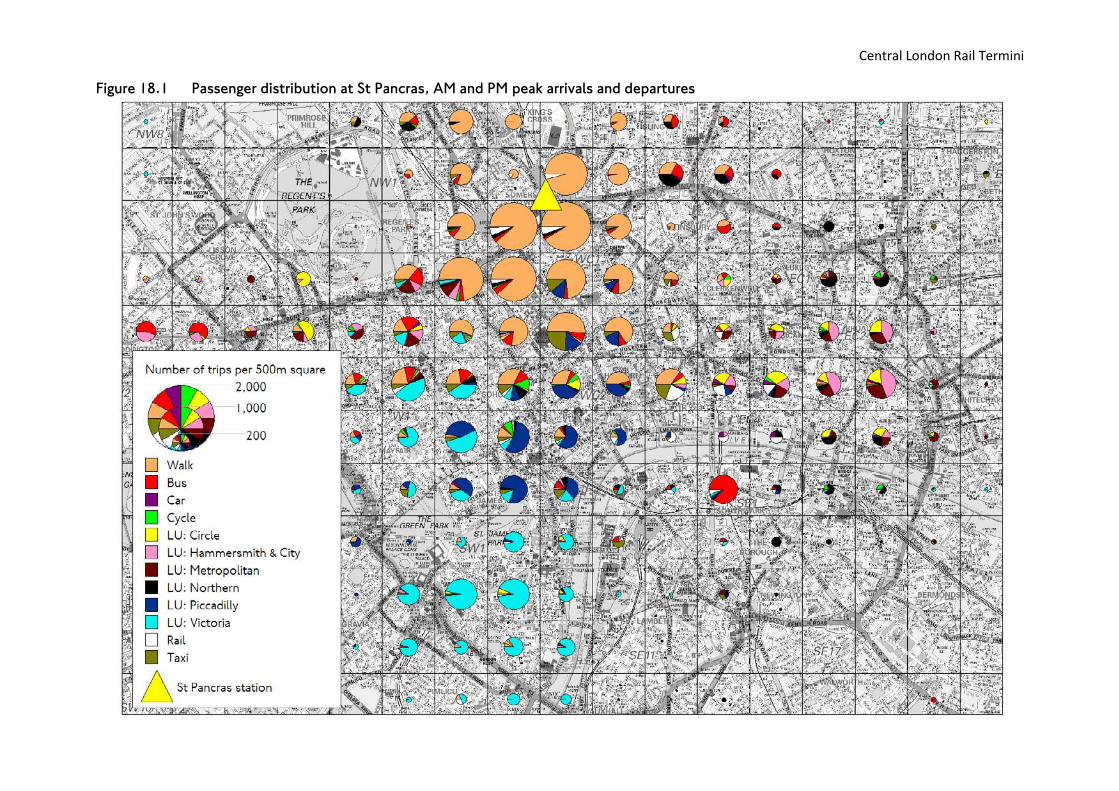
Central London Rail Termini
124
Figure 18.1 Passenger distribution at St Pancras, AM and PM peak arrivals and departures
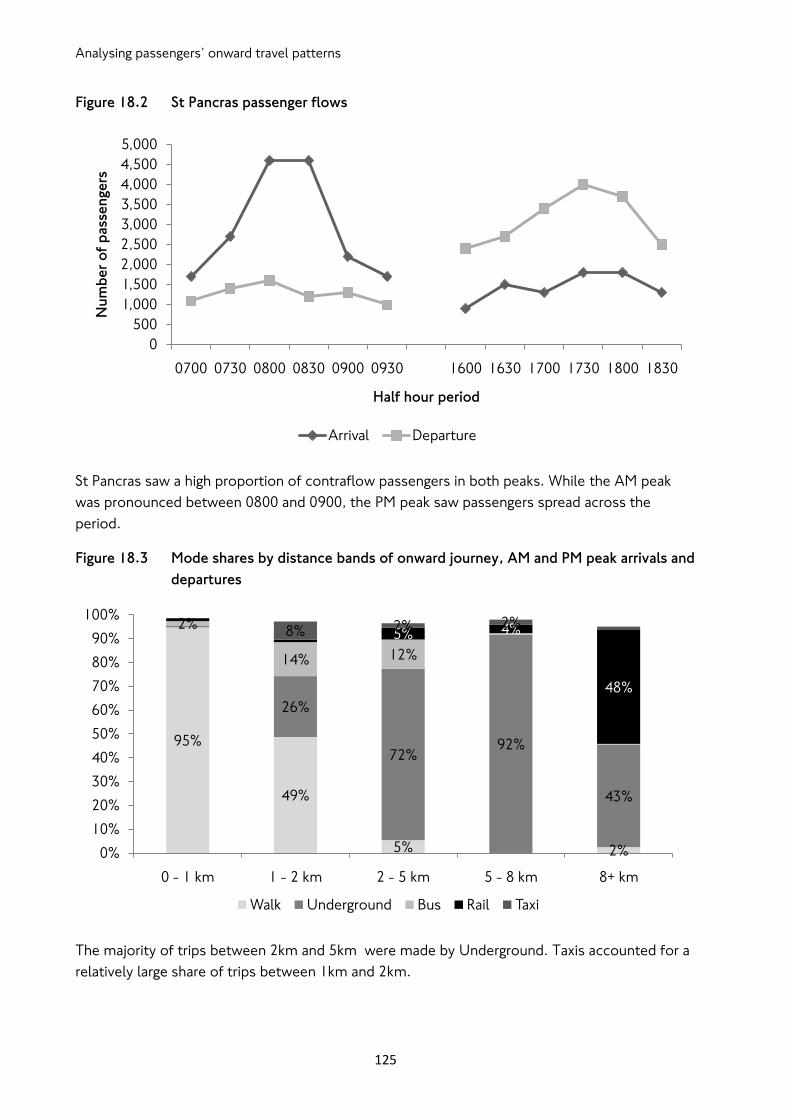
Analysing passengers‟ onward travel patterns
125
Figure 18.2 St Pancras passenger flows
St Pancras saw a high proportion of contraflow passengers in both peaks. While the AM peak
was pronounced between 0800 and 0900, the PM peak saw passengers spread across the
period.
Figure 18.3 Mode shares by distance bands of onward journey, AM and PM peak arrivals and
departures
The majority of trips between 2km and 5km were made by Underground. Taxis accounted for a
relatively large share of trips between 1km and 2km.
0
500
1,000
1,500
2,000
2,500
3,000
3,500
4,000
4,500
5,000
0700 0730 0800 0830 0900 0930 1600 1630 1700 1730 1800 1830
Nu
mb
er
of
pass
en
ge
rs
Half hour period
Arrival Departure
95%
49%
5% 2%
26%
72%92%
43%
2%
14% 12%
5% 4%
48%
8% 2% 2%
0%
10%
20%
30%
40%
50%
60%
70%
80%
90%
100%
0 - 1 km 1 - 2 km 2 - 5 km 5 - 8 km 8+ km
Walk Underground Bus Rail Taxi
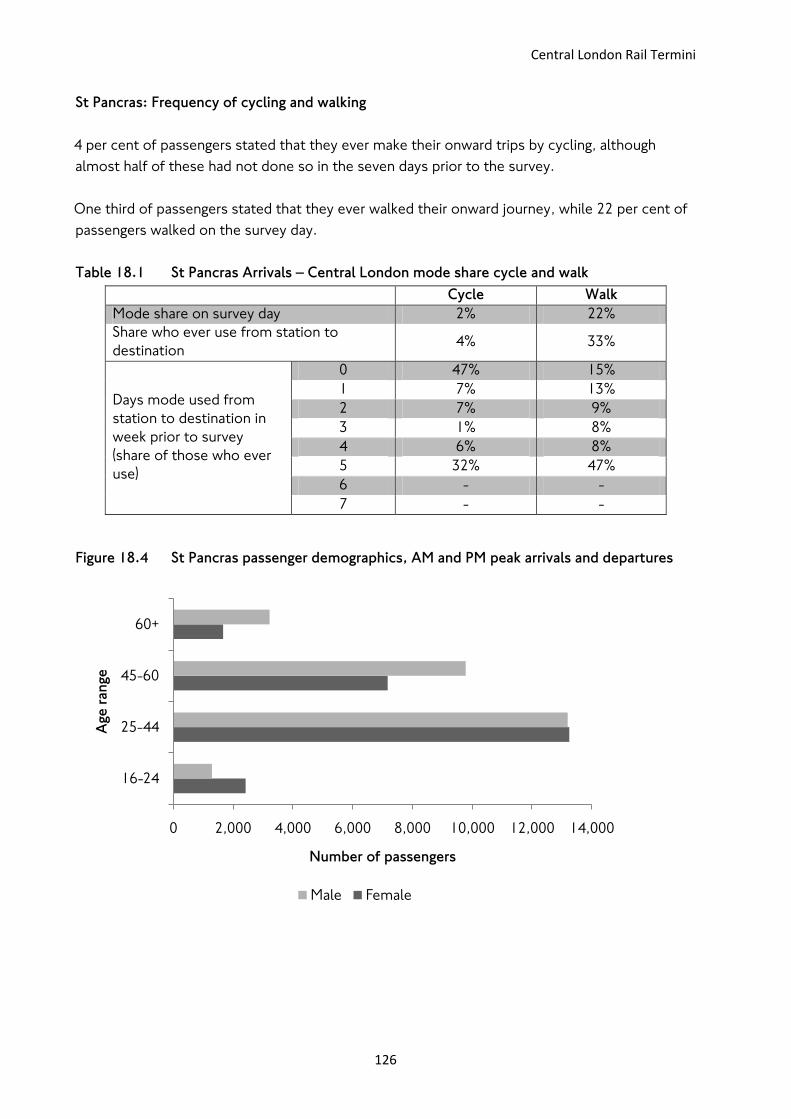
Central London Rail Termini
126
St Pancras: Frequency of cycling and walking
4 per cent of passengers stated that they ever make their onward trips by cycling, although
almost half of these had not done so in the seven days prior to the survey.
One third of passengers stated that they ever walked their onward journey, while 22 per cent of
passengers walked on the survey day.
Table 18.1 St Pancras Arrivals – Central London mode share cycle and walk
Cycle Walk
Mode share on survey day 2% 22%
Share who ever use from station to
destination 4% 33%
Days mode used from
station to destination in
week prior to survey
(share of those who ever
use)
0 47% 15%
1 7% 13%
2 7% 9%
3 1% 8%
4 6% 8%
5 32% 47%
6 - -
7 - -
Figure 18.4 St Pancras passenger demographics, AM and PM peak arrivals and departures
0 2,000 4,000 6,000 8,000 10,000 12,000 14,000
16-24
25-44
45-60
60+
Number of passengers
Age
ran
ge
Male Female
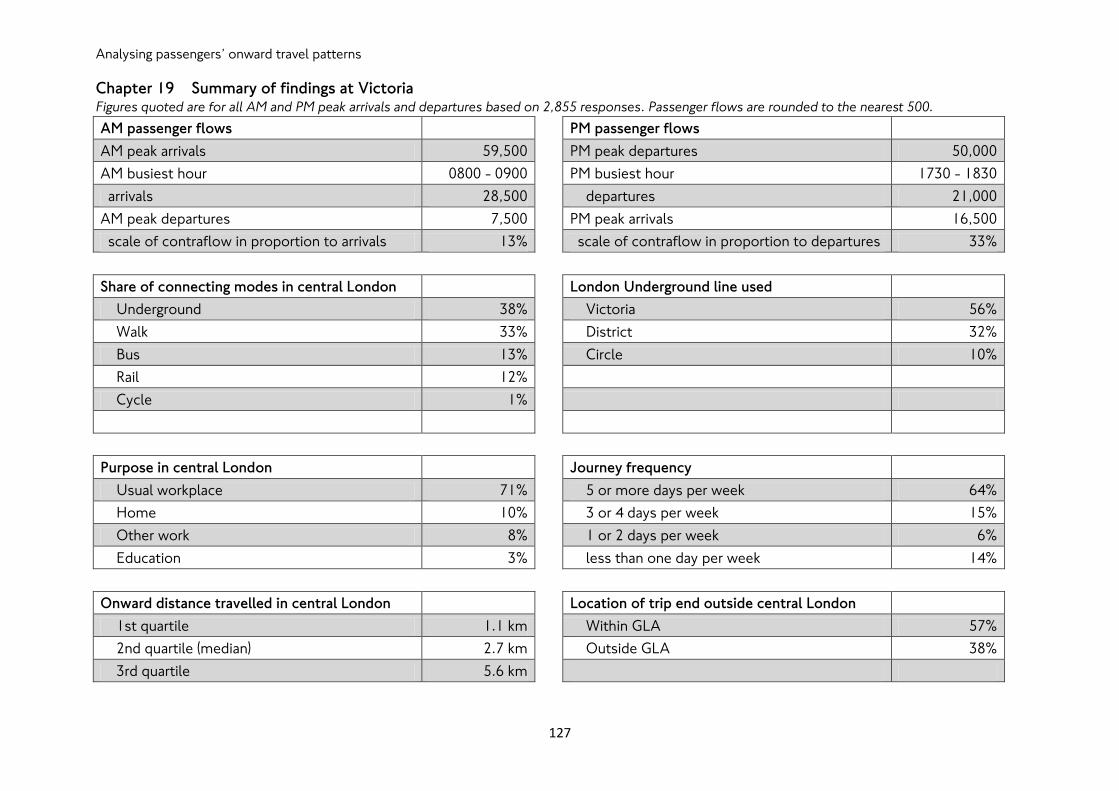
Analysing passengers‟ onward travel patterns
127
Chapter 19 Summary of findings at Victoria Figures quoted are for all AM and PM peak arrivals and departures based on 2,855 responses. Passenger flows are rounded to the nearest 500.
AM passenger flows
PM passenger flows
AM peak arrivals 59,500
PM peak departures 50,000
AM busiest hour 0800 - 0900
PM busiest hour 1730 - 1830
arrivals 28,500
departures 21,000
AM peak departures 7,500
PM peak arrivals 16,500
scale of contraflow in proportion to arrivals 13%
scale of contraflow in proportion to departures 33%
Share of connecting modes in central London
London Underground line used
Underground 38%
Victoria 56%
Walk 33%
District 32%
Bus 13%
Circle 10%
Rail 12%
Cycle 1%
Purpose in central London
Journey frequency
Usual workplace 71%
5 or more days per week 64%
Home 10%
3 or 4 days per week 15%
Other work 8%
1 or 2 days per week 6%
Education 3%
less than one day per week 14%
Onward distance travelled in central London
Location of trip end outside central London
1st quartile 1.1 km
Within GLA 57%
2nd quartile (median) 2.7 km
Outside GLA 38%
3rd quartile 5.6 km
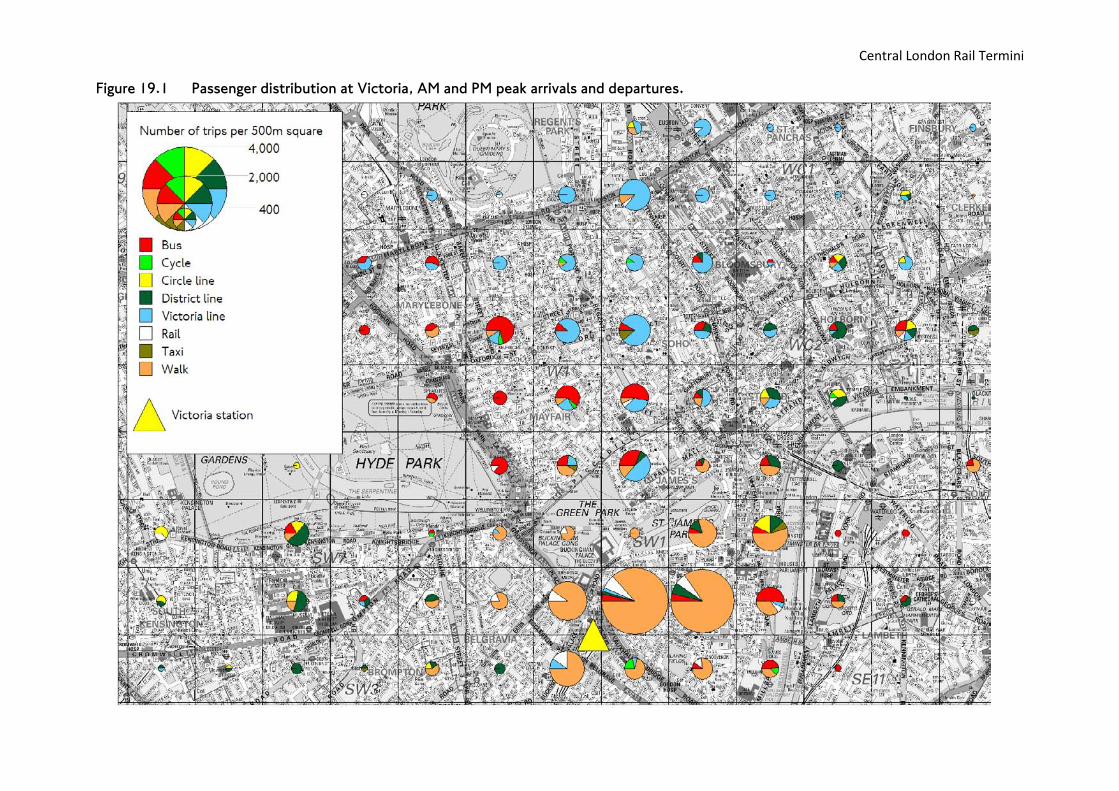
Central London Rail Termini
128
Figure 19.1 Passenger distribution at Victoria, AM and PM peak arrivals and departures.
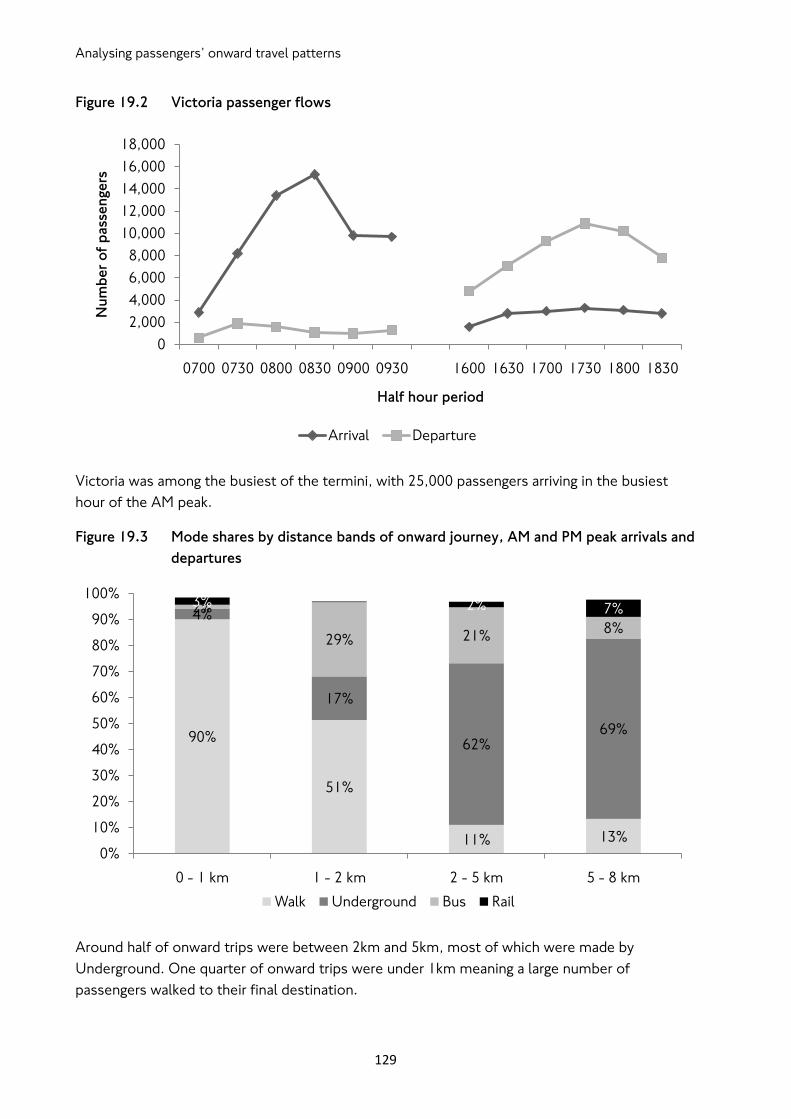
Analysing passengers‟ onward travel patterns
129
Figure 19.2 Victoria passenger flows
Victoria was among the busiest of the termini, with 25,000 passengers arriving in the busiest
hour of the AM peak.
Figure 19.3 Mode shares by distance bands of onward journey, AM and PM peak arrivals and
departures
Around half of onward trips were between 2km and 5km, most of which were made by
Underground. One quarter of onward trips were under 1km meaning a large number of
passengers walked to their final destination.
0
2,000
4,000
6,000
8,000
10,000
12,000
14,000
16,000
18,000
0700 0730 0800 0830 0900 0930 1600 1630 1700 1730 1800 1830
Nu
mb
er
of
pass
en
ge
rs
Half hour period
Arrival Departure
90%
51%
11% 13%
4%
17%
62%69%
2%
29% 21%8%
3% 2% 7%
0%
10%
20%
30%
40%
50%
60%
70%
80%
90%
100%
0 - 1 km 1 - 2 km 2 - 5 km 5 - 8 km
Walk Underground Bus Rail
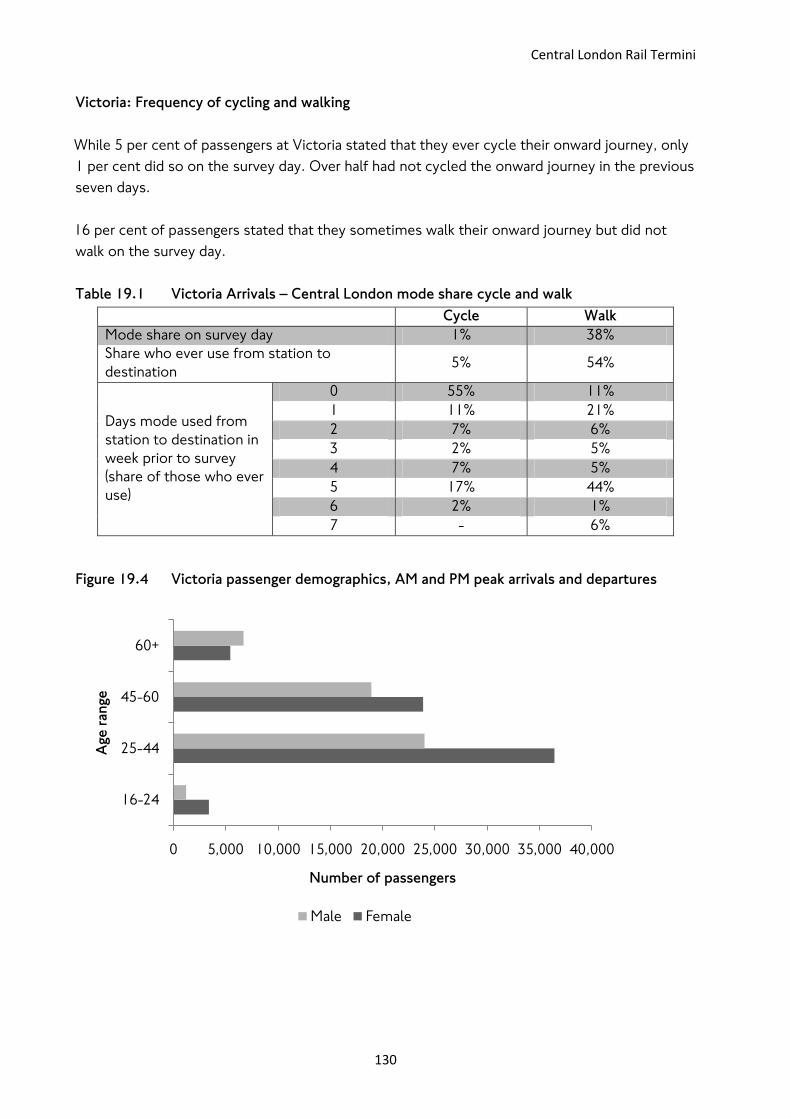
Central London Rail Termini
130
Victoria: Frequency of cycling and walking
While 5 per cent of passengers at Victoria stated that they ever cycle their onward journey, only
1 per cent did so on the survey day. Over half had not cycled the onward journey in the previous
seven days.
16 per cent of passengers stated that they sometimes walk their onward journey but did not
walk on the survey day.
Table 19.1 Victoria Arrivals – Central London mode share cycle and walk
Cycle Walk
Mode share on survey day 1% 38%
Share who ever use from station to
destination 5% 54%
Days mode used from
station to destination in
week prior to survey
(share of those who ever
use)
0 55% 11%
1 11% 21%
2 7% 6%
3 2% 5%
4 7% 5%
5 17% 44%
6 2% 1%
7 - 6%
Figure 19.4 Victoria passenger demographics, AM and PM peak arrivals and departures
0 5,000 10,000 15,000 20,000 25,000 30,000 35,000 40,000
16-24
25-44
45-60
60+
Number of passengers
Age
ran
ge
Male Female
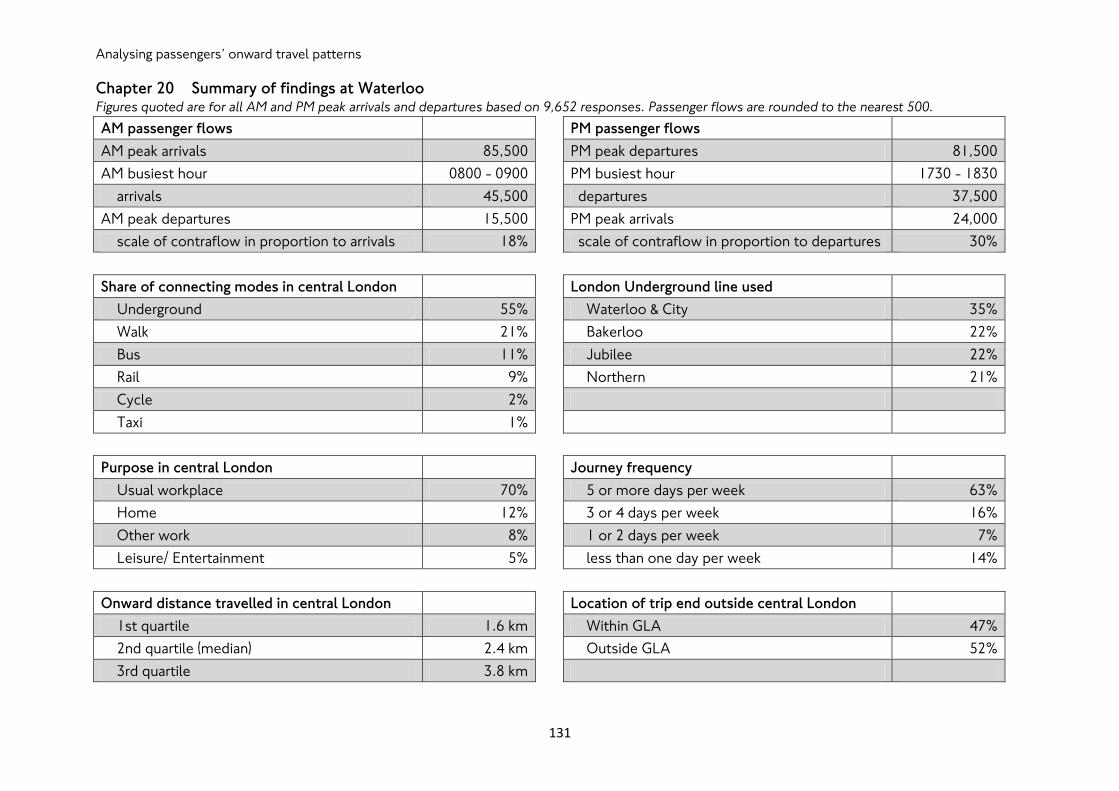
Analysing passengers‟ onward travel patterns
131
Chapter 20 Summary of findings at Waterloo Figures quoted are for all AM and PM peak arrivals and departures based on 9,652 responses. Passenger flows are rounded to the nearest 500.
AM passenger flows
PM passenger flows
AM peak arrivals 85,500
PM peak departures 81,500
AM busiest hour 0800 - 0900
PM busiest hour 1730 - 1830
arrivals 45,500
departures 37,500
AM peak departures 15,500
PM peak arrivals 24,000
scale of contraflow in proportion to arrivals 18%
scale of contraflow in proportion to departures 30%
Share of connecting modes in central London
London Underground line used
Underground 55%
Waterloo & City 35%
Walk 21%
Bakerloo 22%
Bus 11%
Jubilee 22%
Rail 9%
Northern 21%
Cycle 2%
Taxi 1%
Purpose in central London
Journey frequency
Usual workplace 70%
5 or more days per week 63%
Home 12%
3 or 4 days per week 16%
Other work 8%
1 or 2 days per week 7%
Leisure/ Entertainment 5%
less than one day per week 14%
Onward distance travelled in central London
Location of trip end outside central London
1st quartile 1.6 km
Within GLA 47%
2nd quartile (median) 2.4 km
Outside GLA 52%
3rd quartile 3.8 km
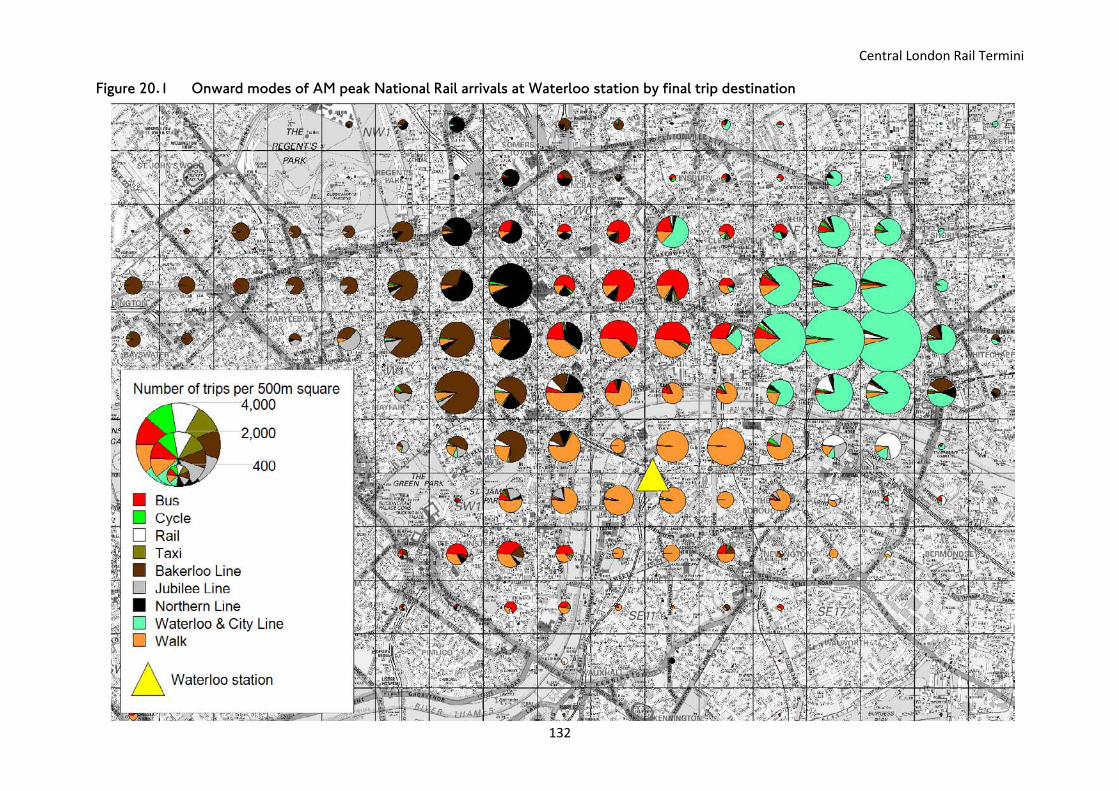
Central London Rail Termini
132
Figure 20.1 Onward modes of AM peak National Rail arrivals at Waterloo station by final trip destination

Analysing passengers‟ onward travel patterns
133
Figure 20.2 Waterloo passenger flows
Waterloo is the busiest of the central London termini. Between 0830 and 0930, 24,000 passengers
were counted arriving at Waterloo – more passengers than were observed over the entire AM peak
at most of the termini.
Figure 20.3 Mode shares for trips made within distance bands among arriving passengers
A high proportion of onward trips were between 2km and 5km and the majority of these were
made by Underground, with the Waterloo & City line carrying many passengers directly to the City.
Around one quarter of trips between 1km and 2km were made by bus. Many of these involved
crossing the Thames to reach areas around Holborn.
0
5,000
10,000
15,000
20,000
25,000
30,000
0700 0730 0800 0830 0900 0930 1600 1630 1700 1730 1800 1830
Nu
mb
er
of
pass
en
ge
rs
Half hour period
Arrival Departure
89%
32%
4% 2%
7%
37%82% 90%
45%
23%
8% 2%
2%
4% 3% 6%
46%
0%
10%
20%
30%
40%
50%
60%
70%
80%
90%
100%
0 - 1 km 1 - 2 km 2 - 5 km 5 - 8 km 8+ km
Walk Underground Bus Rail
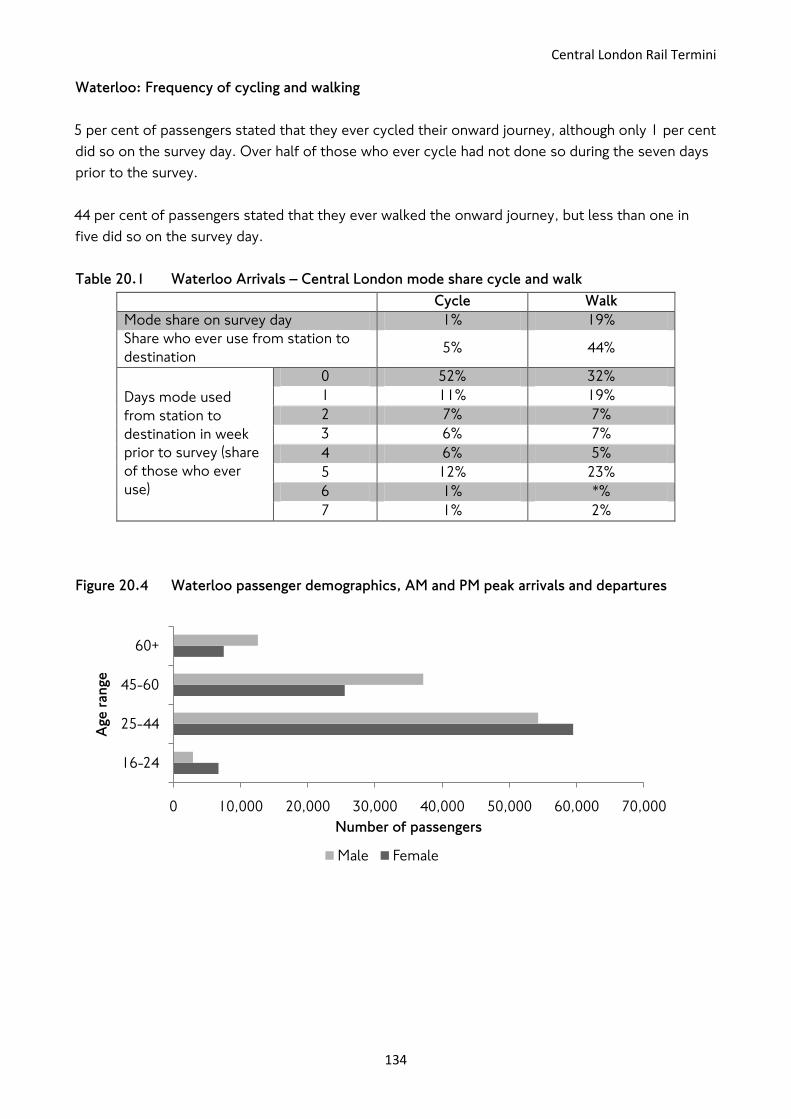
Central London Rail Termini
134
Waterloo: Frequency of cycling and walking
5 per cent of passengers stated that they ever cycled their onward journey, although only 1 per cent
did so on the survey day. Over half of those who ever cycle had not done so during the seven days
prior to the survey.
44 per cent of passengers stated that they ever walked the onward journey, but less than one in
five did so on the survey day.
Table 20.1 Waterloo Arrivals – Central London mode share cycle and walk
Cycle Walk
Mode share on survey day 1% 19%
Share who ever use from station to
destination 5% 44%
Days mode used
from station to
destination in week
prior to survey (share
of those who ever
use)
0 52% 32%
1 11% 19%
2 7% 7%
3 6% 7%
4 6% 5%
5 12% 23%
6 1% *%
7 1% 2%
Figure 20.4 Waterloo passenger demographics, AM and PM peak arrivals and departures
0 10,000 20,000 30,000 40,000 50,000 60,000 70,000
16-24
25-44
45-60
60+
Number of passengers
Age
ran
ge
Male Female

Analysing passengers‟ onward travel patterns
135

Central London Rail Termini
136
Appendix
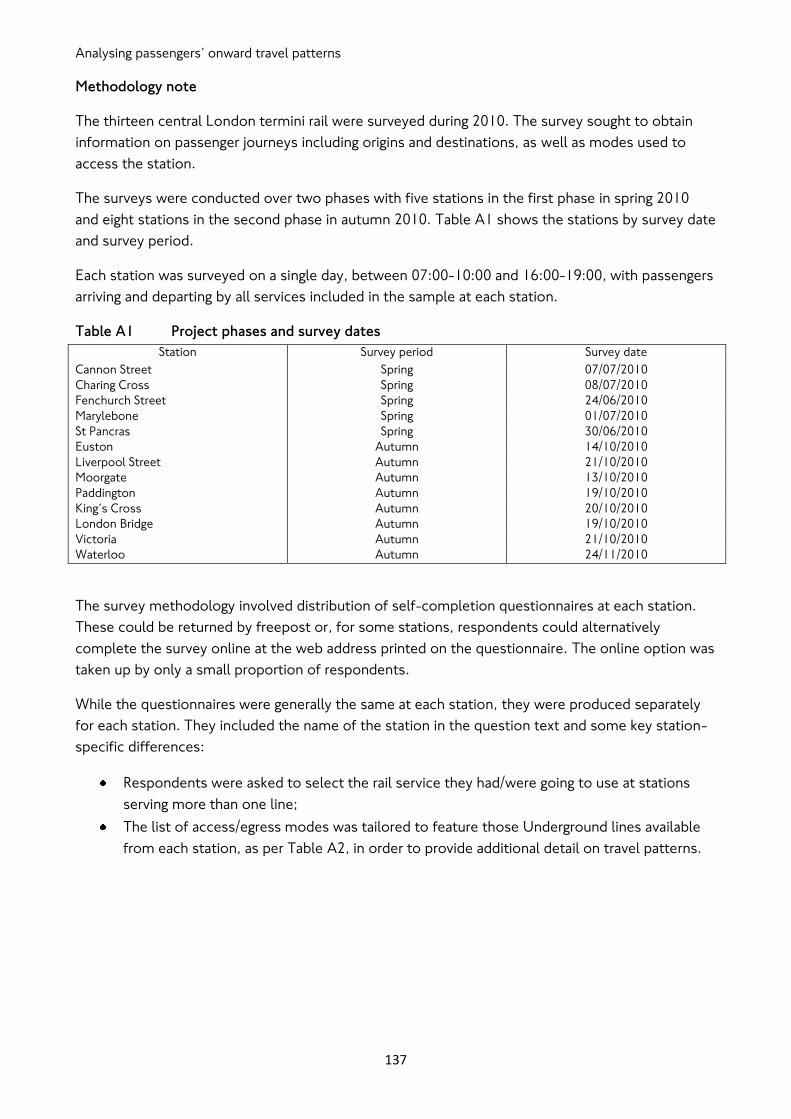
Analysing passengers‟ onward travel patterns
137
Methodology note
The thirteen central London termini rail were surveyed during 2010. The survey sought to obtain
information on passenger journeys including origins and destinations, as well as modes used to
access the station.
The surveys were conducted over two phases with five stations in the first phase in spring 2010
and eight stations in the second phase in autumn 2010. Table A1 shows the stations by survey date
and survey period.
Each station was surveyed on a single day, between 07:00-10:00 and 16:00-19:00, with passengers
arriving and departing by all services included in the sample at each station.
Table A1 Project phases and survey dates
Station Survey period Survey date
Cannon Street Spring 07/07/2010
Charing Cross Spring 08/07/2010
Fenchurch Street Spring 24/06/2010
Marylebone Spring 01/07/2010
St Pancras Spring 30/06/2010
Euston Autumn 14/10/2010
Liverpool Street Autumn 21/10/2010
Moorgate Autumn 13/10/2010
Paddington Autumn 19/10/2010
King‟s Cross Autumn 20/10/2010
London Bridge Autumn 19/10/2010
Victoria Autumn 21/10/2010
Waterloo Autumn 24/11/2010
The survey methodology involved distribution of self-completion questionnaires at each station.
These could be returned by freepost or, for some stations, respondents could alternatively
complete the survey online at the web address printed on the questionnaire. The online option was
taken up by only a small proportion of respondents.
While the questionnaires were generally the same at each station, they were produced separately
for each station. They included the name of the station in the question text and some key station-
specific differences:
Respondents were asked to select the rail service they had/were going to use at stations
serving more than one line;
The list of access/egress modes was tailored to feature those Underground lines available
from each station, as per Table A2, in order to provide additional detail on travel patterns.
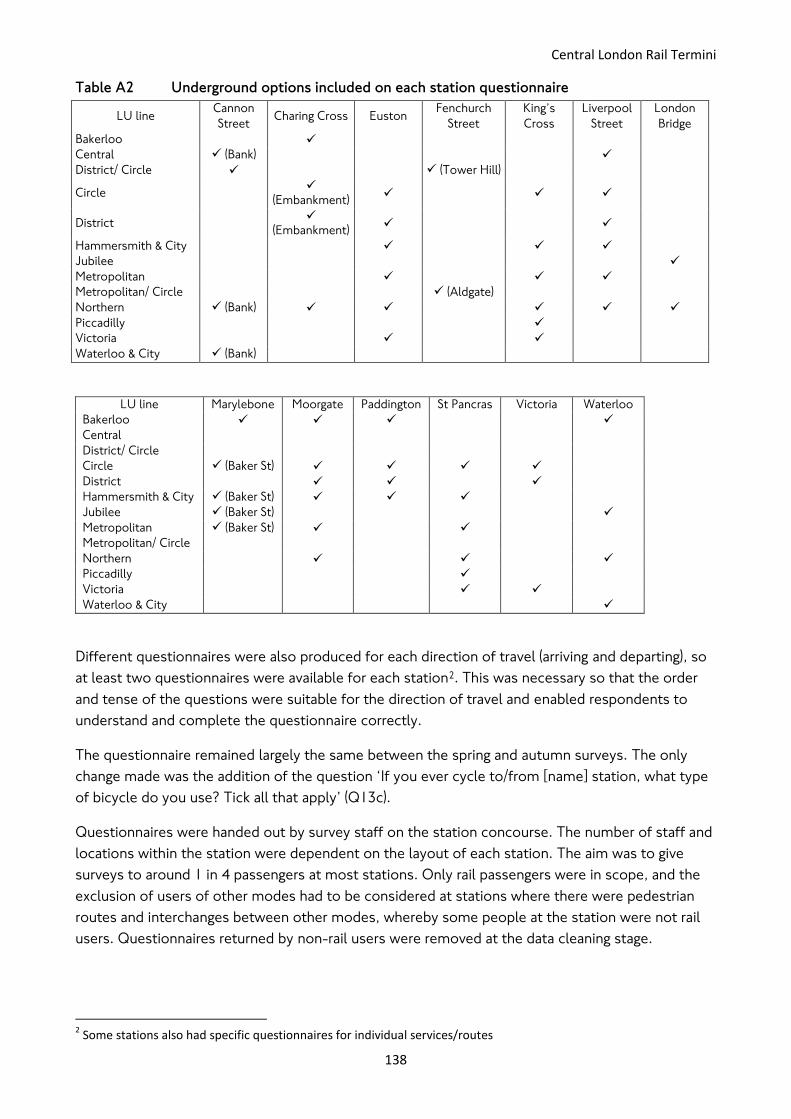
Central London Rail Termini
138
Table A2 Underground options included on each station questionnaire
LU line Cannon
Street Charing Cross Euston
Fenchurch
Street
King‟s
Cross
Liverpool
Street
London
Bridge
Bakerloo
Central (Bank)
District/ Circle (Tower Hill)
Circle
(Embankment)
District
(Embankment)
Hammersmith & City
Jubilee
Metropolitan
Metropolitan/ Circle (Aldgate)
Northern (Bank)
Piccadilly
Victoria
Waterloo & City (Bank)
LU line Marylebone Moorgate Paddington St Pancras Victoria Waterloo
Bakerloo
Central
District/ Circle
Circle (Baker St)
District
Hammersmith & City (Baker St)
Jubilee (Baker St)
Metropolitan (Baker St)
Metropolitan/ Circle
Northern
Piccadilly
Victoria
Waterloo & City
Different questionnaires were also produced for each direction of travel (arriving and departing), so
at least two questionnaires were available for each station2. This was necessary so that the order
and tense of the questions were suitable for the direction of travel and enabled respondents to
understand and complete the questionnaire correctly.
The questionnaire remained largely the same between the spring and autumn surveys. The only
change made was the addition of the question „If you ever cycle to/from [name] station, what type
of bicycle do you use? Tick all that apply‟ (Q13c).
Questionnaires were handed out by survey staff on the station concourse. The number of staff and
locations within the station were dependent on the layout of each station. The aim was to give
surveys to around 1 in 4 passengers at most stations. Only rail passengers were in scope, and the
exclusion of users of other modes had to be considered at stations where there were pedestrian
routes and interchanges between other modes, whereby some people at the station were not rail
users. Questionnaires returned by non-rail users were removed at the data cleaning stage.
2 Some stations also had specific questionnaires for individual services/routes
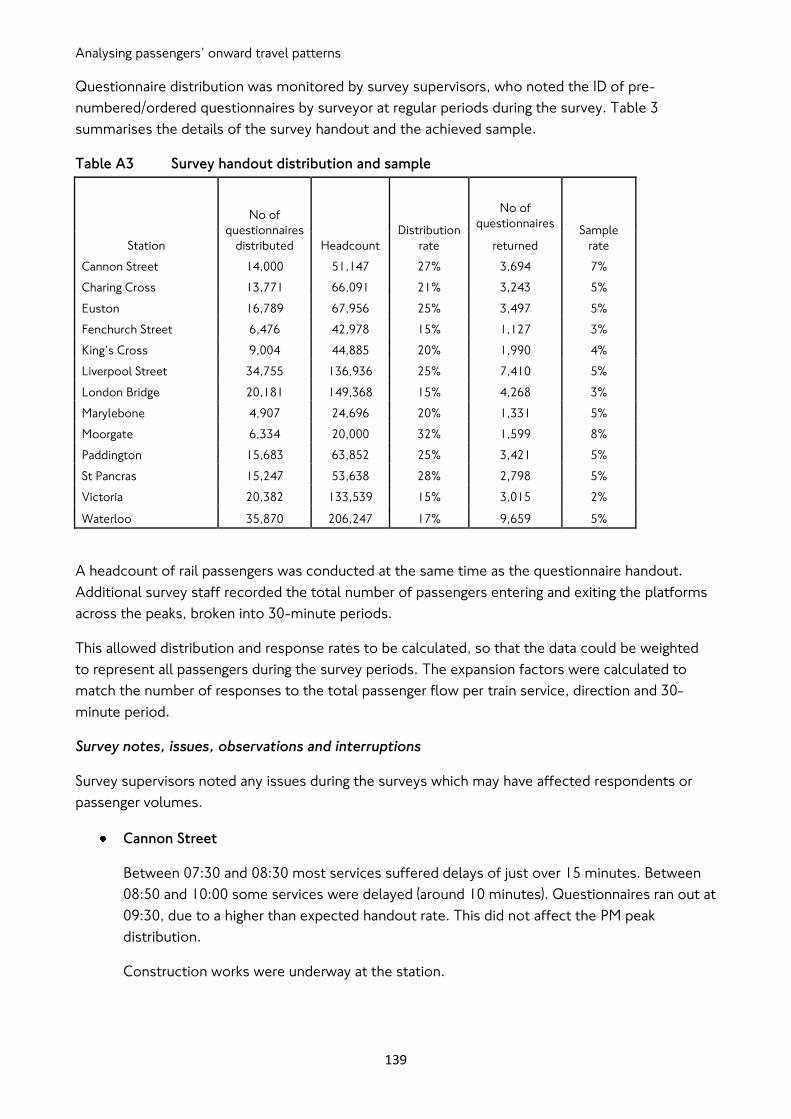
Analysing passengers‟ onward travel patterns
139
Questionnaire distribution was monitored by survey supervisors, who noted the ID of pre-
numbered/ordered questionnaires by surveyor at regular periods during the survey. Table 3
summarises the details of the survey handout and the achieved sample.
Table A3 Survey handout distribution and sample
Station
No of
questionnaires
distributed Headcount
Distribution
rate
No of
questionnaires Sample
rate returned
Cannon Street 14,000 51,147 27% 3,694 7%
Charing Cross 13,771 66,091 21% 3,243 5%
Euston 16,789 67,956 25% 3,497 5%
Fenchurch Street 6,476 42,978 15% 1,127 3%
King‟s Cross 9,004 44,885 20% 1,990 4%
Liverpool Street 34,755 136,936 25% 7,410 5%
London Bridge 20,181 149,368 15% 4,268 3%
Marylebone 4,907 24,696 20% 1,331 5%
Moorgate 6,334 20,000 32% 1,599 8%
Paddington 15,683 63,852 25% 3,421 5%
St Pancras 15,247 53,638 28% 2,798 5%
Victoria 20,382 133,539 15% 3,015 2%
Waterloo 35,870 206,247 17% 9,659 5%
A headcount of rail passengers was conducted at the same time as the questionnaire handout.
Additional survey staff recorded the total number of passengers entering and exiting the platforms
across the peaks, broken into 30-minute periods.
This allowed distribution and response rates to be calculated, so that the data could be weighted
to represent all passengers during the survey periods. The expansion factors were calculated to
match the number of responses to the total passenger flow per train service, direction and 30-
minute period.
Survey notes, issues, observations and interruptions
Survey supervisors noted any issues during the surveys which may have affected respondents or
passenger volumes.
Cannon Street
Between 07:30 and 08:30 most services suffered delays of just over 15 minutes. Between
08:50 and 10:00 some services were delayed (around 10 minutes). Questionnaires ran out at
09:30, due to a higher than expected handout rate. This did not affect the PM peak
distribution.
Construction works were underway at the station.

Central London Rail Termini
140
Charing Cross
There were no delays in either period. Delays occurred on the District and Circle lines at
around 08:30.
Euston
There were no delays to rail services.
Minor delays to Victoria line occurred during AM peak.
There was a part suspension to the Metropolitan line and delays to the Central, Circle and
Hammersmith & City lines during PM peak.
Fenchurch Street
There were no delays in either period.
An error occurred in the distribution of the AM surveys, meaning that surveys were
distributed the wrong way round; this was corrected at the data cleaning stage.
King’s Cross
There were no disruptions to services.
Construction works were underway at the station.
Liverpool Street
There were no delays to rail services.
The Jubilee line was part suspended and the Piccadilly line had severe delays in the AM
peak.
There were severe delays during the PM peak on the Jubilee line, and delays on the
Piccadilly and Metropolitan lines.
London Bridge
There were no disruptions to services.
There was a police presence in the PM peak due to football fans using the station. The
survey had to be suspended at 18:50.
Construction works were underway at the station.
Marylebone
There were no delays in the AM peak period.
Two arrivals were delayed in the PM peak (less than 15 minutes).
Analysing passengers‟ onward travel patterns
141
Moorgate
Due to the layout of the station, rail passengers merged with Underground passengers. A
number of questionnaires were given to Underground (non-rail) passengers. These were
removed at the data cleaning stage.
There were no delays to rail services.
Metropolitan line delays occurred during the PM peak.
Paddington
A small number of respondents used the Central line from nearby Lancaster Gate station.
This was not included on the questionnaire but was entered manually by some. This was
dealt with during data cleaning.
There was an error on the survey form. Q12 of the arrivals questionnaire referred to
„Liverpool Street‟ rather than Paddington. There did not appear to be any impact on
respondents.
The 07:15 service to Cardiff was delayed (around 15 minutes).
Delays to the Circle and District lines throughout the AM peak. Minor delays were also
recorded on the Hammersmith & City and Metropolitan lines. Part suspensions occurred on
the Northern and Victoria lines after 09:30.
Delays occurred to the Bakerloo and Metropolitan lines during the PM peak.
St Pancras
The survey covered passengers using all services at St Pancras including Eurostar.
There were small delays on the Thameslink service (mostly less than 15 minutes), and one
Bedford service was cancelled during the AM peak.
Some small delays occurred on Eurostar arrivals during the AM peak (less than 10 minutes).
Severe delays and suspensions occurred on the Circle and Hammersmith & City lines during
AM peak.
Victoria
There were delays to sign in processing so counts and survey distribution started slightly
late in AM peak.
Waterloo
There were no major delays. In the PM peak at around 18:30 a number of arriving services
were slightly delayed.

Central London Rail Termini
142
In the AM peak (at around 08:30), the Underground station was overcrowded and access
was limited while the station was cleared. This caused delays on the Jubilee line and the
queuing of passengers on the main station concourse.
It took longer than anticipated to get staff signed in on the morning of the survey; as a result
the counts and survey distribution did not start until 07:15.

![High Speed Rail (London - West Midlands) Bill · High Speed Rail (London - West Midlands) Bill ... [VOLUME I] CONTENTS Works 1 Power to construct and maintain works for Phase One](https://img.pdfslide.net/doc/110x75/5ae1b2587f8b9a90138b6e66/high-speed-rail-london-west-midlands-bill-speed-rail-london-west-midlands.jpg)