Embed Size (px)
Citation preview
Central Pattana Plc. Property Development and Investment
Opportunity Day 3Q17 24 November 2017
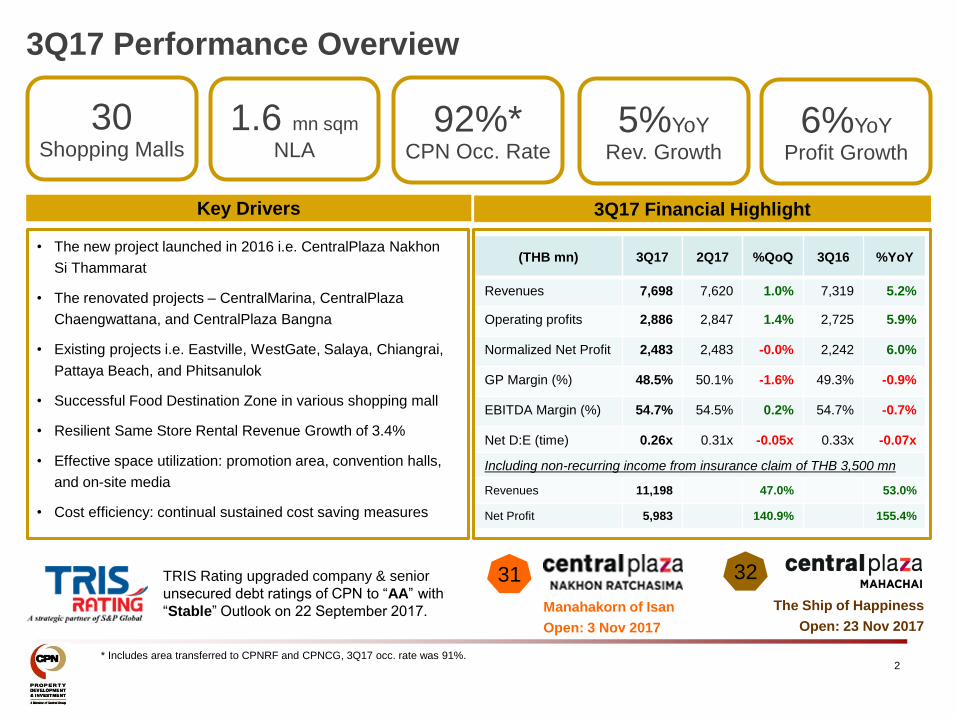
• The new project launched in 2016 i.e. CentralPlaza Nakhon
Si Thammarat
• The renovated projects – CentralMarina, CentralPlaza
Chaengwattana, and CentralPlaza Bangna
• Existing projects i.e. Eastville, WestGate, Salaya, Chiangrai,
Pattaya Beach, and Phitsanulok
• Successful Food Destination Zone in various shopping mall
• Resilient Same Store Rental Revenue Growth of 3.4%
• Effective space utilization: promotion area, convention halls,
and on-site media
• Cost efficiency: continual sustained cost saving measures
(THB mn) 3Q17 2Q17 %QoQ 3Q16 %YoY
Revenues 7,698 7,620 1.0% 7,319 5.2%
Operating profits 2,886 2,847 1.4% 2,725 5.9%
Normalized Net Profit 2,483 2,483 -0.0% 2,242 6.0%
GP Margin (%) 48.5% 50.1% -1.6% 49.3% -0.9%
EBITDA Margin (%) 54.7% 54.5% 0.2% 54.7% -0.7%
Net D:E (time) 0.26x 0.31x -0.05x 0.33x -0.07x
Including non-recurring income from insurance claim of THB 3,500 mn
Revenues 11,198 47.0% 53.0%
Net Profit 5,983 140.9% 155.4%
3Q17 Performance Overview
2
Key Drivers 3Q17 Financial Highlight
30 Shopping Malls
1.6 mn sqm
NLA 92%*
CPN Occ. Rate 5%YoY
Rev. Growth 6%YoY
Profit Growth
* Includes area transferred to CPNRF and CPNCG, 3Q17 occ. rate was 91%.
TRIS Rating upgraded company & senior
unsecured debt ratings of CPN to “AA” with
“Stable” Outlook on 22 September 2017. Manahakorn of Isan
Open: 3 Nov 2017
The Ship of Happiness
Open: 23 Nov 2017
31 32
3
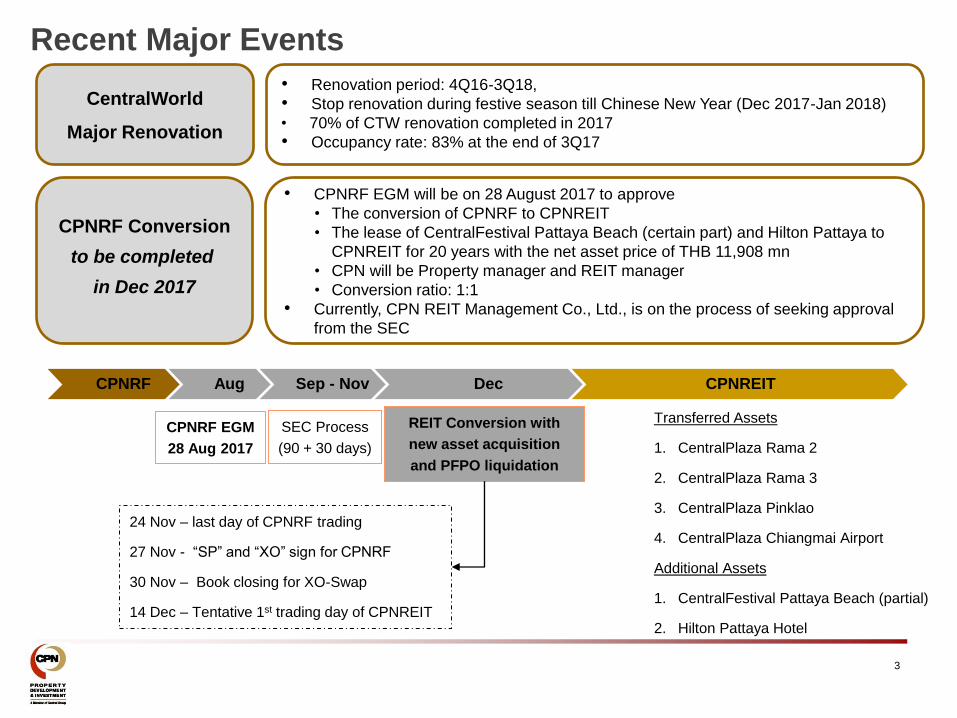
CentralWorld
Major Renovation
• Renovation period: 4Q16-3Q18,
• Stop renovation during festive season till Chinese New Year (Dec 2017-Jan 2018)
• 70% of CTW renovation completed in 2017
• Occupancy rate: 83% at the end of 3Q17
CPNRF Conversion
to be completed
in Dec 2017
• CPNRF EGM will be on 28 August 2017 to approve
• The conversion of CPNRF to CPNREIT
• The lease of CentralFestival Pattaya Beach (certain part) and Hilton Pattaya to
CPNREIT for 20 years with the net asset price of THB 11,908 mn
• CPN will be Property manager and REIT manager
• Conversion ratio: 1:1
• Currently, CPN REIT Management Co., Ltd., is on the process of seeking approval
from the SEC
Recent Major Events
CPNRF Aug Sep - Nov Dec CPNREIT
CPNRF EGM
28 Aug 2017
SEC Process
(90 + 30 days)
REIT Conversion with
new asset acquisition
and PFPO liquidation
Transferred Assets
1. CentralPlaza Rama 2
2. CentralPlaza Rama 3
3. CentralPlaza Pinklao
4. CentralPlaza Chiangmai Airport
Additional Assets
1. CentralFestival Pattaya Beach (partial)
2. Hilton Pattaya Hotel
24 Nov – last day of CPNRF trading
27 Nov - “SP” and “XO” sign for CPNRF
30 Nov – Book closing for XO-Swap
14 Dec – Tentative 1st trading day of CPNREIT
New Mall Expansion
4
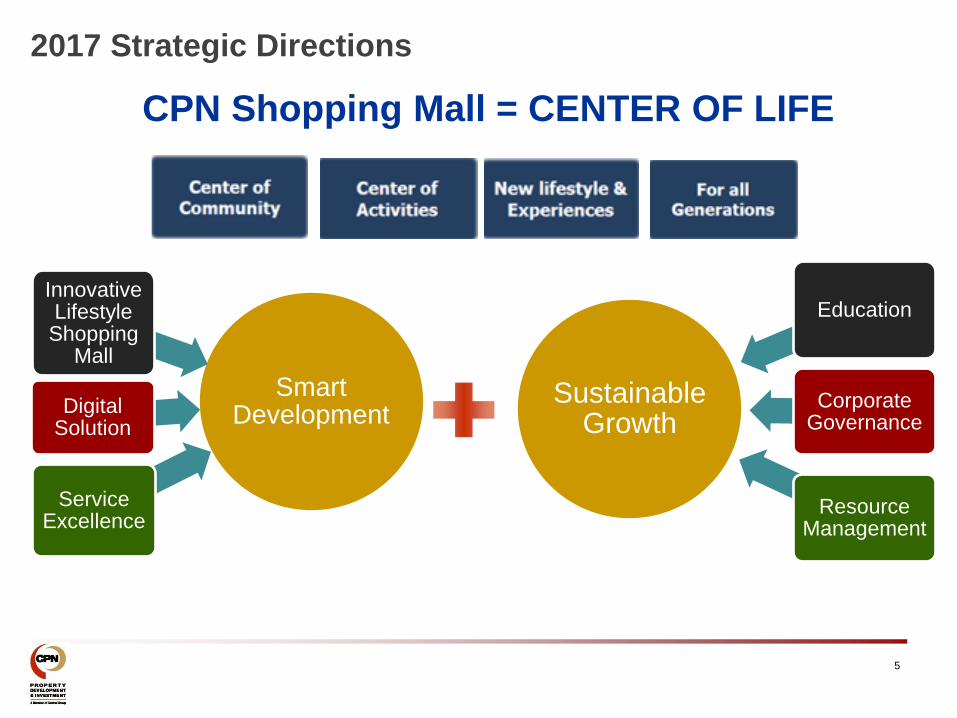
2017 Strategic Directions
5
CPN Shopping Mall = CENTER OF LIFE
Smart Development
Innovative Lifestyle
Shopping Mall
Digital Solution
Service Excellence
Sustainable Growth
Education
Corporate Governance
Resource Management

6 6
2017
Investment cost (1) : THB 6.65 bn
NLA (2) : 63,000 sqm
Joint developer (3) : -
Land Size : 22 acres (57 rais) (Leasehold)
Parking : 3,000 cars
Leasing Progress: TBA
CentralPhuket
Investment cost (1) : THB 5.00 bn
NLA (2) : 56,000 sqm
Joint developer (3) : Central Department Store
Land Size : 26 acres (65 rais) (Freehold)
Parking : 3,600 cars
Occupancy rate : 80% at opening
CentralPlaza Nakhon Ratchasima
Domestic expansion continues
2021
Investment cost (1) : THB 3.20 bn
NLA (2) : 28,850 sqm
Joint developer (3) : Robinson Department Store
Land Size : 40 acres (100 rais) (Freehold)
Parking : 1,500 cars
Occupancy rate: 85% at opening
CentralPlaza Mahachai
11 additional projects ′18-′21
(BKK:Provinces = 50:50)
3 Nov -17 1H18
Note 1: Includes land and construction cost of shopping center and parking building. Excludes Central Department Store or Robinson Department Store, and BUs’ area. Note 2: Excludes Central Department Store or Robinson Department Store, BUs’ area Note 3: Area will be developed and owned by the joint developer. However, the store will serve as a magnet to draw traffic into CPN’s plaza area.
23 Nov-17
MAHACHAI
2018
BANGKOK
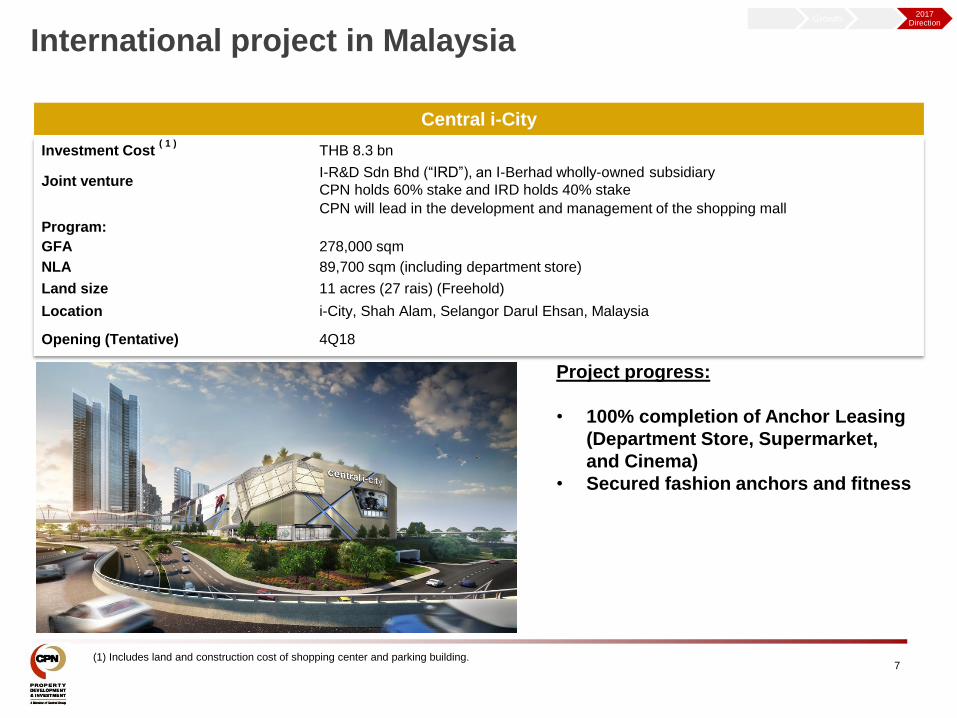
International project in Malaysia
Investment Cost ( 1 )
THB 8.3 bn
Joint venture I-R&D Sdn Bhd (“IRD”), an I-Berhad wholly-owned subsidiary
CPN holds 60% stake and IRD holds 40% stake
CPN will lead in the development and management of the shopping mall
Program:
GFA 278,000 sqm
NLA 89,700 sqm (including department store)
Land size 11 acres (27 rais) (Freehold)
Location i-City, Shah Alam, Selangor Darul Ehsan, Malaysia
Opening (Tentative) 4Q18
(1) Includes land and construction cost of shopping center and parking building.
Central i-City
Project progress:
• 100% completion of Anchor Leasing
(Department Store, Supermarket,
and Cinema)
• Secured fashion anchors and fitness
7
Growth 2017
Direction
Asset Enhancement
8

9
2016 2017
4 Projects in 2016
• CentralPlaza Bangna
• CentralMarina
• CentralFestival Phuket
• CentralPlaza Chaengwattana
Asset enhancement projects
Modernize malls to enhance asset value and draw traffic
5 Projects in 2017
RAMA 3
RAMA 2 CHIANGMAI AIRPORT
10
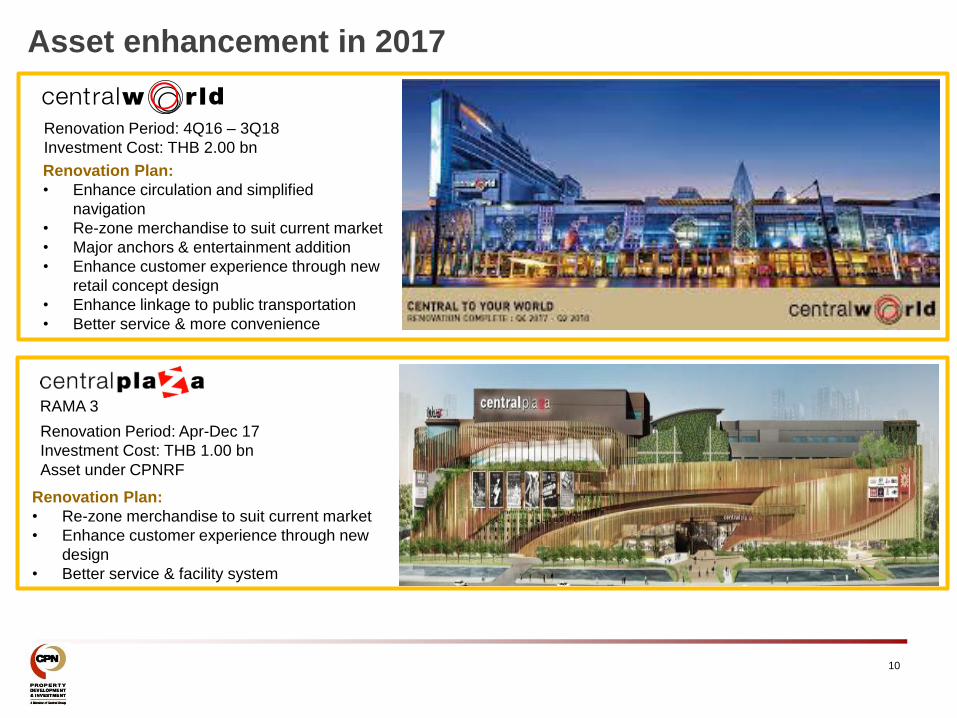
Renovation Period: 4Q16 – 3Q18
Investment Cost: THB 2.00 bn
Renovation Plan:
• Enhance circulation and simplified
navigation
• Re-zone merchandise to suit current market
• Major anchors & entertainment addition
• Enhance customer experience through new
retail concept design
• Enhance linkage to public transportation
• Better service & more convenience
Asset enhancement in 2017
RAMA 3
Renovation Period: Apr-Dec 17
Investment Cost: THB 1.00 bn
Asset under CPNRF
Renovation Plan:
• Re-zone merchandise to suit current market
• Enhance customer experience through new
design
• Better service & facility system
11
Mixed Use Development
12
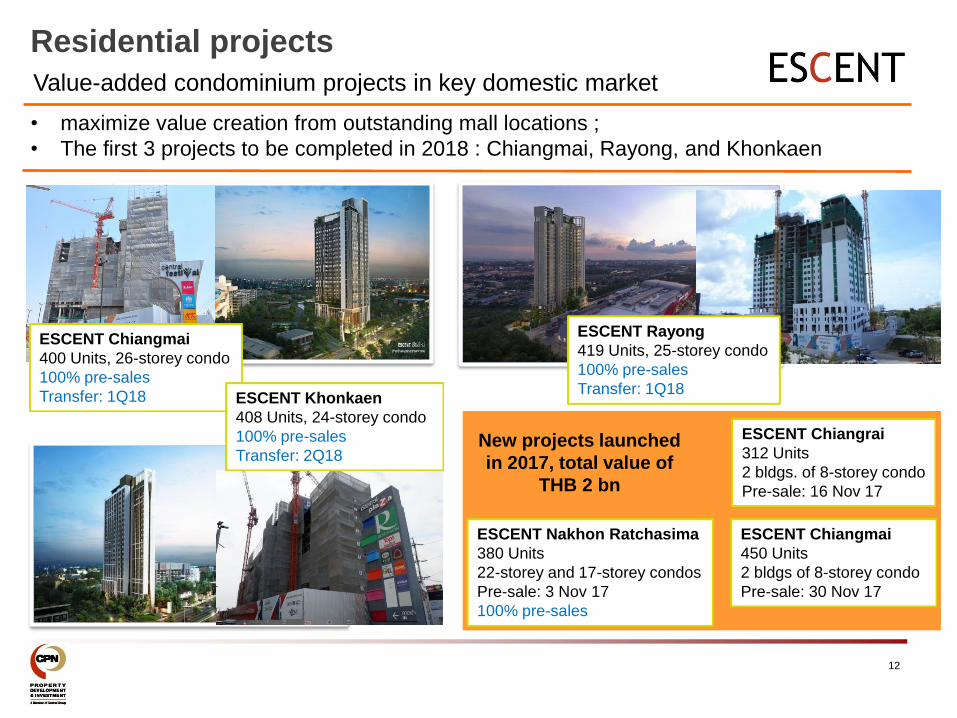
• maximize value creation from outstanding mall locations ;
• The first 3 projects to be completed in 2018 : Chiangmai, Rayong, and Khonkaen
Value-added condominium projects in key domestic market
Residential projects
ESCENT Chiangmai
400 Units, 26-storey condo
100% pre-sales
Transfer: 1Q18 ESCENT Khonkaen
408 Units, 24-storey condo
100% pre-sales
Transfer: 2Q18
ESCENT Rayong
419 Units, 25-storey condo
100% pre-sales
Transfer: 1Q18
ESCENT Chiangmai
450 Units
2 bldgs of 8-storey condo
Pre-sale: 30 Nov 17
ESCENT Chiangrai
312 Units
2 bldgs. of 8-storey condo
Pre-sale: 16 Nov 17
ESCENT Nakhon Ratchasima
380 Units
22-storey and 17-storey condos
Pre-sale: 3 Nov 17
100% pre-sales
New projects launched
in 2017, total value of
THB 2 bn
13
Financial Performance
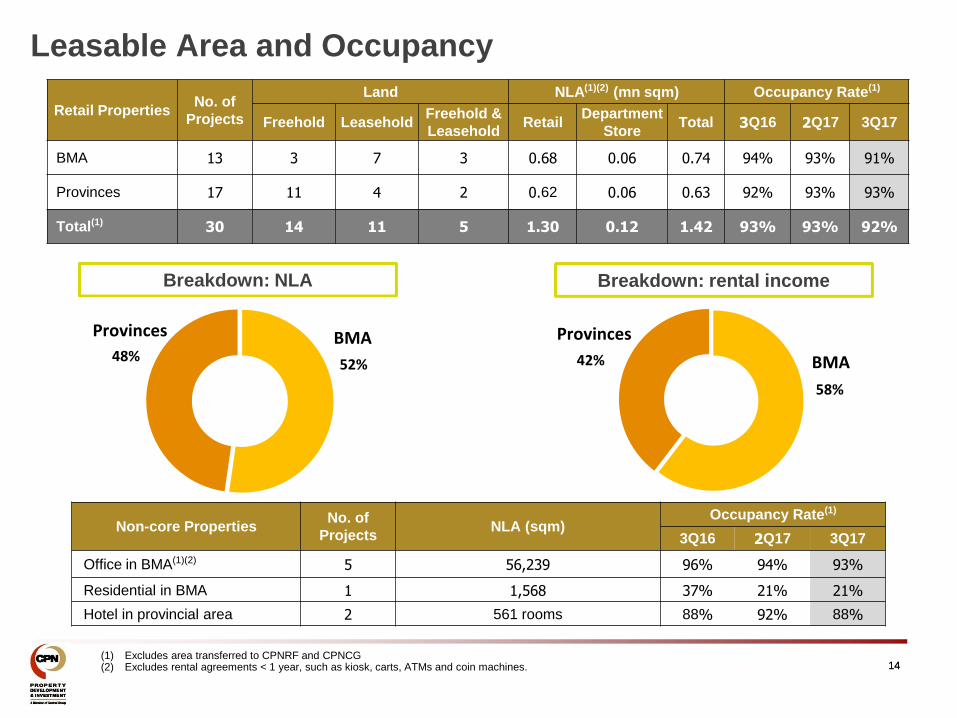
14 14 (1) Excludes area transferred to CPNRF and CPNCG (2) Excludes rental agreements < 1 year, such as kiosk, carts, ATMs and coin machines.
Breakdown: NLA Breakdown: rental income
58%
42% BMA
Provinces
Leasable Area and Occupancy
52% 48%
BMA Provinces
Retail Properties No. of
Projects
Land NLA(1)(2) (mn sqm) Occupancy Rate(1)
Freehold Leasehold Freehold &
Leasehold Retail
Department
Store Total 3Q16 2Q17 3Q17
BMA 13 3 7 3 0.68 0.06 0.74 94% 93% 91%
Provinces 17 11 4 2 0.62 0.06 0.63 92% 93% 93%
Total(1) 30 14 11 5 1.30 0.12 1.42 93% 93% 92%
Non-core Properties No. of
Projects NLA (sqm)
Occupancy Rate(1)
3Q16 2Q17 3Q17
Office in BMA(1)(2) 5 56,239 96% 94% 93%
Residential in BMA 1 1,568 37% 21% 21%
Hotel in provincial area 2 561 rooms 88% 92% 88%
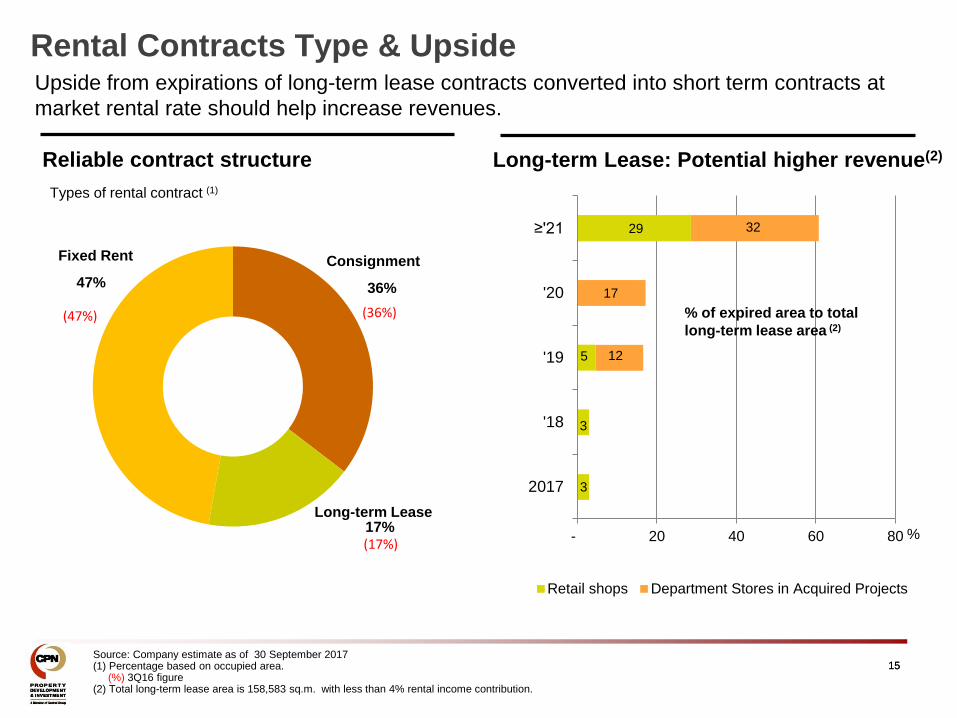
3
3
5
29
12
17
32
- 20 40 60 80
2017
'18
'19
'20
≥'21
Retail shops Department Stores in Acquired Projects
%
Rental Contracts Type & Upside
15 15
Upside from expirations of long-term lease contracts converted into short term contracts at
market rental rate should help increase revenues.
PKO
Types of rental contract (1)
Long-term Lease: Potential higher revenue(2) Reliable contract structure
Source: Company estimate as of 30 September 2017 (1) Percentage based on occupied area. (%) 3Q16 figure (2) Total long-term lease area is 158,583 sq.m. with less than 4% rental income contribution.
47% 36%
17% Long-term Lease
Fixed Rent Consignment
(47%) (36%)
(17%)
% of expired area to total
long-term lease area (2)
5,991
7,231 7,746
9,244
7,025 7,742
6,293
7,307 7,880
9,244
7,025
11,242
0
2,000
4,000
6,000
8,000
10,000
12,000
2013 2014 2015 2016 9M16 9M17
Normalized Net profit Net profit
(THB mn)
7,345
8,447 9,074
10,814
8,292 8,949
2,000
3,000
4,000
5,000
6,000
7,000
8,000
9,000
10,000
11,000
12,000
2013 2014 2015 2016 9M16 9M17
Operating profit
(THB mn)
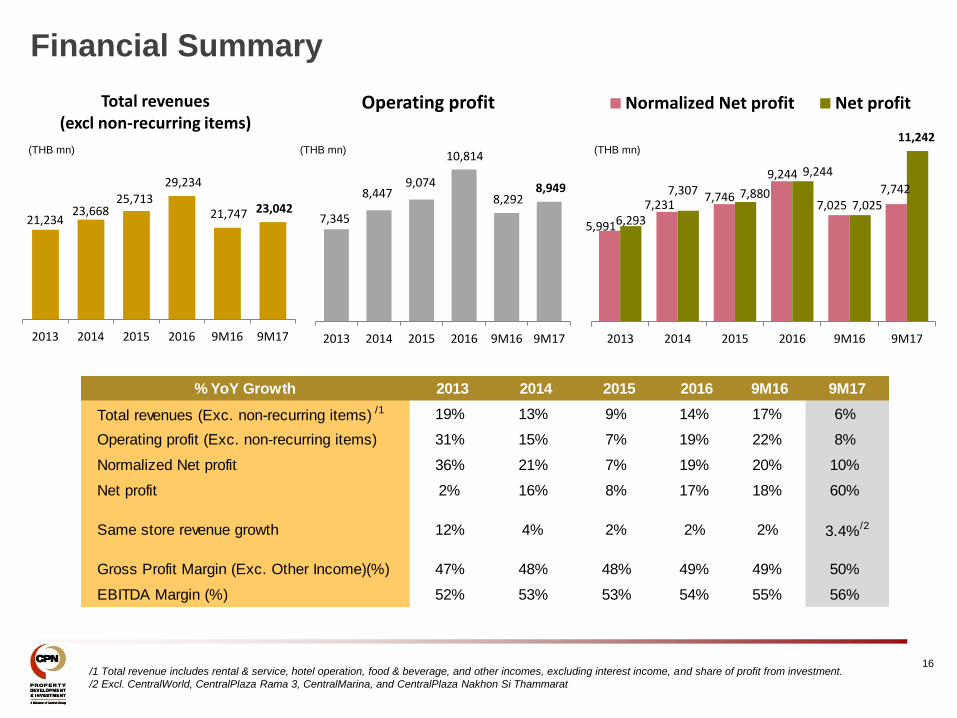
16 /1 Total revenue includes rental & service, hotel operation, food & beverage, and other incomes, excluding interest income, and share of profit from investment.
/2 Excl. CentralWorld, CentralPlaza Rama 3, CentralMarina, and CentralPlaza Nakhon Si Thammarat
Financial Summary
21,234 23,668
25,713
29,234
21,747 23,042
02,0004,0006,0008,000
10,00012,00014,00016,00018,00020,00022,00024,00026,00028,00030,00032,00034,00036,00038,00040,000
2013 2014 2015 2016 9M16 9M17
Total revenues (excl non-recurring items)
(THB mn)
% YoY Growth 2013 2014 2015 2016 9M16 9M17
Total revenues (Exc. non-recurring items) /1 19% 13% 9% 14% 17% 6%
Operating profit (Exc. non-recurring items) 31% 15% 7% 19% 22% 8%
Normalized Net profit 36% 21% 7% 19% 20% 10%
Net profit 2% 16% 8% 17% 18% 60%
Same store revenue growth 12% 4% 2% 2% 2% 3.4%/2
Gross Profit Margin (Exc. Other Income)(%) 47% 48% 48% 49% 49% 50%
EBITDA Margin (%) 52% 53% 53% 54% 55% 56%
21,234 23,668
25,713
29,234
7,319 7,620 7,698
0
5,000
10,000
15,000
20,000
25,000
30,000
35,000
0
5,000
10,000
15,000
20,000
25,000
30,000
35,000
2013 2014 2015 2016 3Q16 2Q17 3Q17
THB mn
Revenue Breakdown
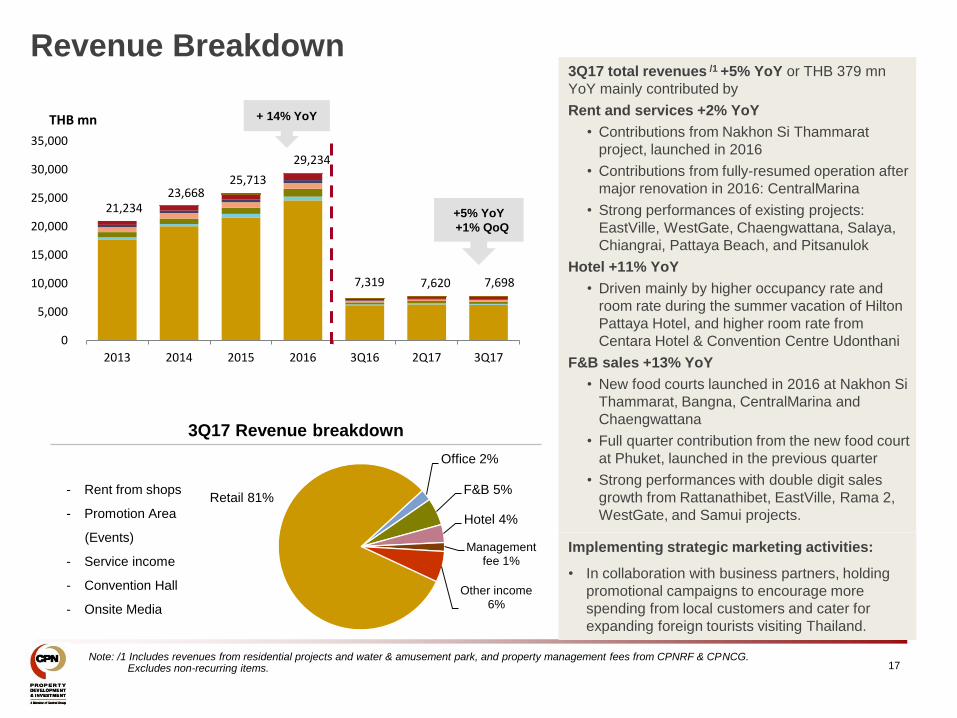
17 Note: /1 Includes revenues from residential projects and water & amusement park, and property management fees from CPNRF & CPNCG. Excludes non-recurring items.
3Q17 Revenue breakdown
3Q17 total revenues /1 +5% YoY or THB 379 mn
YoY mainly contributed by
Rent and services +2% YoY
• Contributions from Nakhon Si Thammarat
project, launched in 2016
• Contributions from fully-resumed operation after
major renovation in 2016: CentralMarina
• Strong performances of existing projects:
EastVille, WestGate, Chaengwattana, Salaya,
Chiangrai, Pattaya Beach, and Pitsanulok
Hotel +11% YoY
• Driven mainly by higher occupancy rate and
room rate during the summer vacation of Hilton
Pattaya Hotel, and higher room rate from
Centara Hotel & Convention Centre Udonthani
F&B sales +13% YoY
• New food courts launched in 2016 at Nakhon Si
Thammarat, Bangna, CentralMarina and
Chaengwattana
• Full quarter contribution from the new food court
at Phuket, launched in the previous quarter
• Strong performances with double digit sales
growth from Rattanathibet, EastVille, Rama 2,
WestGate, and Samui projects.
- Rent from shops
- Promotion Area
(Events)
- Service income
- Convention Hall
- Onsite Media
+ 14% YoY
+5% YoY
+1% QoQ
Implementing strategic marketing activities:
• In collaboration with business partners, holding
promotional campaigns to encourage more
spending from local customers and cater for
expanding foreign tourists visiting Thailand.
Retail 81%
Office 2%
F&B 5%
Hotel 4%
Management fee 1%
Other income 6%
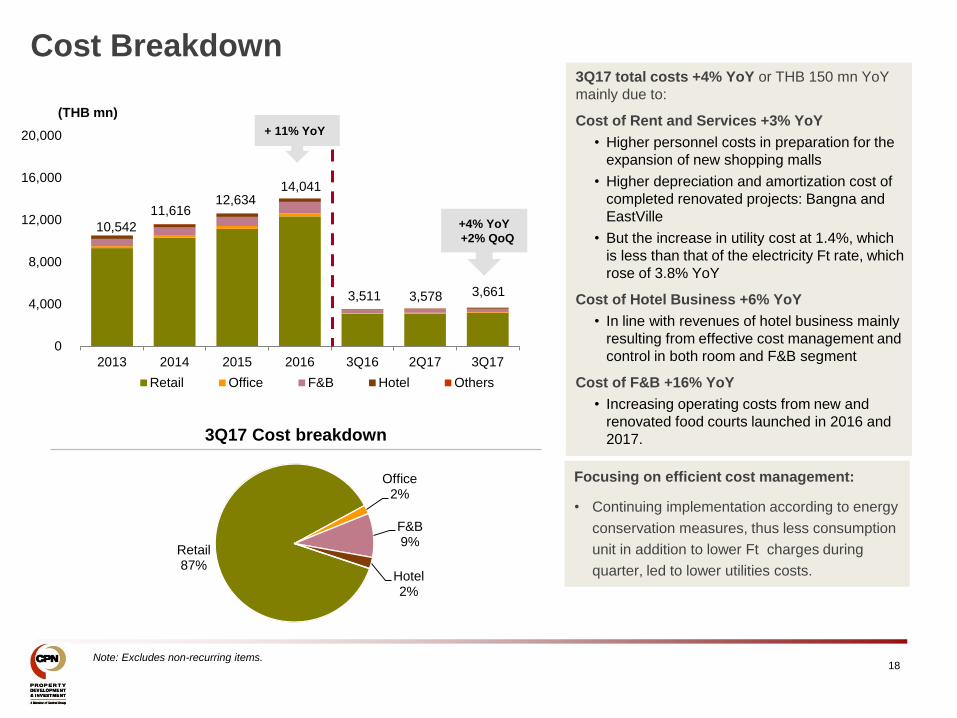
Cost Breakdown
10,542
11,616 12,634
14,041
3,511 3,578 3,661
0
4,000
8,000
12,000
16,000
20,000
2013 2014 2015 2016 3Q16 2Q17 3Q17
(THB mn)
Retail Office F&B Hotel Others
18 Note: Excludes non-recurring items.
3Q17 Cost breakdown
3Q17 total costs +4% YoY or THB 150 mn YoY
mainly due to:
Cost of Rent and Services +3% YoY
• Higher personnel costs in preparation for the
expansion of new shopping malls
• Higher depreciation and amortization cost of
completed renovated projects: Bangna and
EastVille
• But the increase in utility cost at 1.4%, which
is less than that of the electricity Ft rate, which
rose of 3.8% YoY
Cost of Hotel Business +6% YoY
• In line with revenues of hotel business mainly
resulting from effective cost management and
control in both room and F&B segment
Cost of F&B +16% YoY
• Increasing operating costs from new and
renovated food courts launched in 2016 and
2017.
+4% YoY
+2% QoQ
+ 11% YoY
Focusing on efficient cost management:
• Continuing implementation according to energy
conservation measures, thus less consumption
unit in addition to lower Ft charges during
quarter, led to lower utilities costs.
Retail 87%
Office 2%
F&B 9%
Hotel 2%
3,446 3,667 4,030
4,406
1,091 1,197 1,160
0
500
1,000
1,500
2,000
2,500
3,000
3,500
4,000
4,500
2013 2014 2015 2016 3Q16 2Q17 3Q17
(THB mn)
Personnel Advertising & promotion Depreciation Others
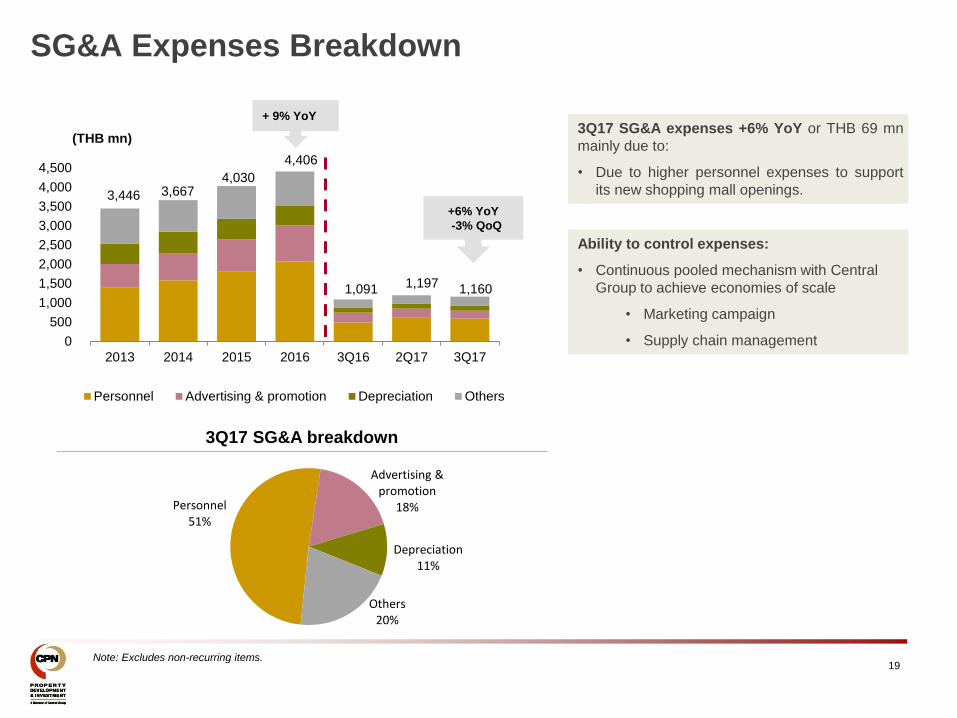
3Q17 SG&A breakdown
19
3Q17 SG&A expenses +6% YoY or THB 69 mn
mainly due to:
• Due to higher personnel expenses to support
its new shopping mall openings.
Note: Excludes non-recurring items.
+6% YoY
-3% QoQ
Ability to control expenses:
• Continuous pooled mechanism with Central
Group to achieve economies of scale
• Marketing campaign
• Supply chain management
+ 9% YoY
SG&A Expenses Breakdown
Personnel 51%
Advertising & promotion
18%
Depreciation 11%
Others 20%
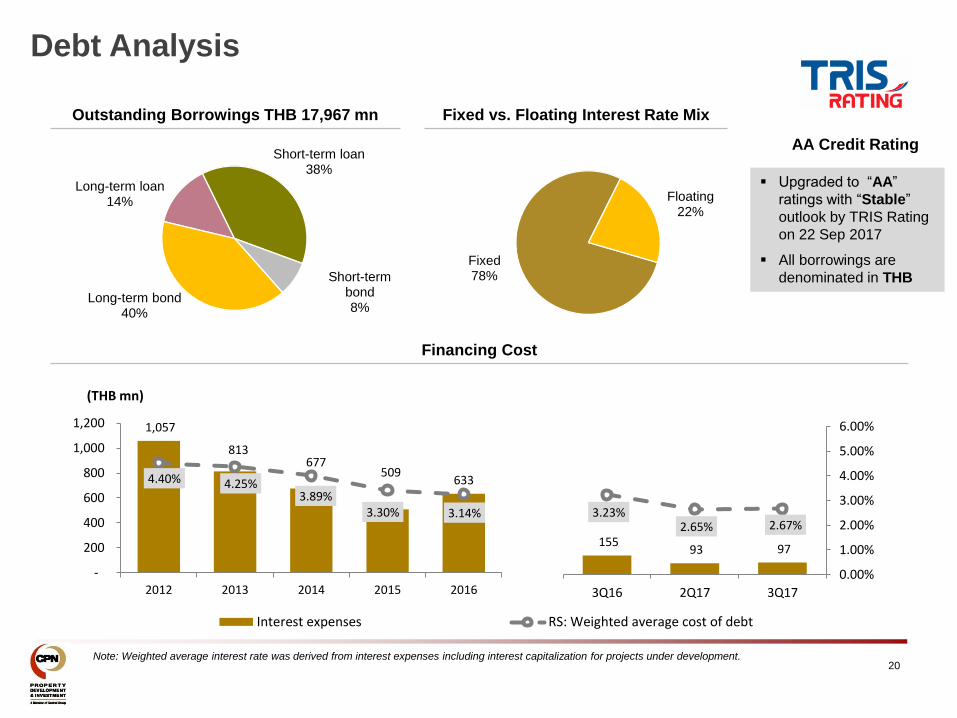
20 Note: Weighted average interest rate was derived from interest expenses including interest capitalization for projects under development.
Outstanding Borrowings THB 17,967 mn Fixed vs. Floating Interest Rate Mix
Financing Cost
AA Credit Rating
Upgraded to “AA”
ratings with “Stable”
outlook by TRIS Rating
on 22 Sep 2017
All borrowings are
denominated in THB
Debt Analysis
1,057
813 677
509 633 4.40% 4.25%
3.89% 3.30% 3.14%
0%
1%
2%
3%
4%
5%
6%
-
200
400
600
800
1,000
1,200
2012 2013 2014 2015 2016
Interest expenses RS: Weighted average cost of debt
(THB mn)
155 93 97
3.23% 2.65% 2.67%
0.00%
1.00%
2.00%
3.00%
4.00%
5.00%
6.00%
-
200
400
600
800
1,000
1,200
3Q16 2Q17 3Q17
Long-term loan 14%
Short-term loan 38%
Short-term bond 8%
Long-term bond 40%
Fixed 78%
Floating 22%

21
CPN’s net D/E stood at 0.26 times, against its debt covenant of 1.75 times.
Capital Structure
945 4,207
1,869 3,773 4,326 3,204 3,328 2,205 1,975
25,245 25,568
19,842 16,019
22,623 17,904
14,959 19,311 17,967 20,448
25,900
36,824 41,748
46,801
53,005 55,807 54,660
60,741
1.19
0.82
0.49
0.29
0.39 0.28
0.21 0.31 0.26
0.00
0.20
0.40
0.60
0.80
1.00
1.20
1.40
0
10,000
20,000
30,000
40,000
50,000
60,000
70,000
2011 2012 2013 2014 2015 2016 1Q17 2Q17 3Q17
Cash & current investment Interest bearing debts Equity RS: Net D/E
(THB mn) (Times)
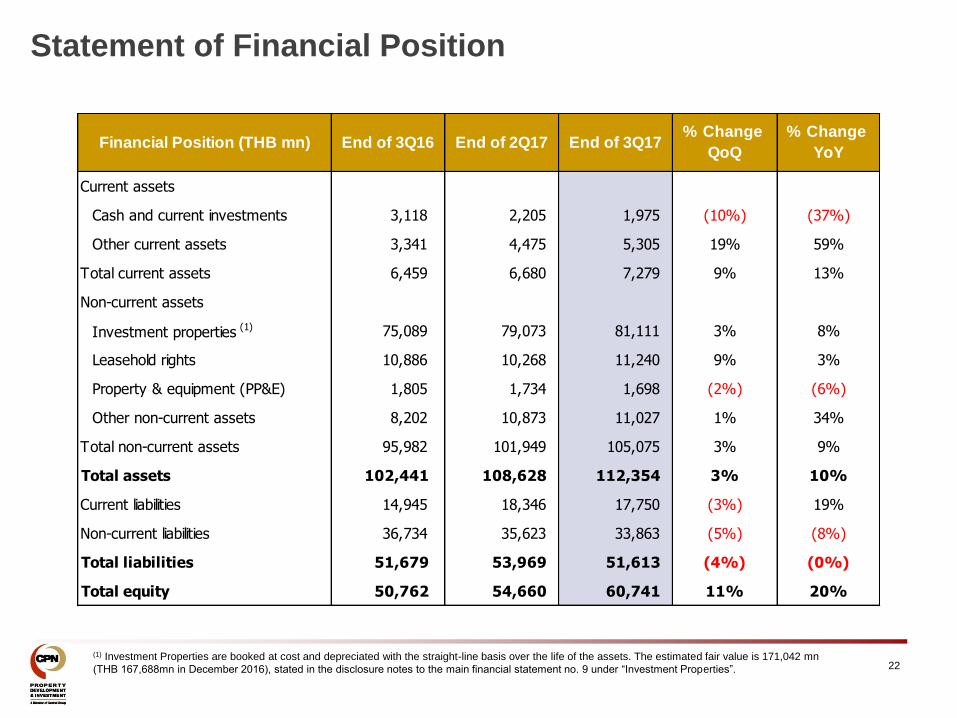
22 (1) Investment Properties are booked at cost and depreciated with the straight-line basis over the life of the assets. The estimated fair value is 171,042 mn
(THB 167,688mn in December 2016), stated in the disclosure notes to the main financial statement no. 9 under “Investment Properties”.
Statement of Financial Position
Current assets
Cash and current investments 3,118 2,205 1,975 (10%) (37%)
Other current assets 3,341 4,475 5,305 19% 59%
Total current assets 6,459 6,680 7,279 9% 13%
Non-current assets
Investment properties (1) 75,089 79,073 81,111 3% 8%
Leasehold rights 10,886 10,268 11,240 9% 3%
Property & equipment (PP&E) 1,805 1,734 1,698 (2%) (6%)
Other non-current assets 8,202 10,873 11,027 1% 34%
Total non-current assets 95,982 101,949 105,075 3% 9%
Total assets 102,441 108,628 112,354 3% 10%
Current liabilities 14,945 18,346 17,750 (3%) 19%
Non-current liabilities 36,734 35,623 33,863 (5%) (8%)
Total liabilities 51,679 53,969 51,613 (4%) (0%)
Total equity 50,762 54,660 60,741 11% 20%
Financial Position (THB mn) End of 3Q16% Change
QoQEnd of 2Q17
% Change
YoYEnd of 3Q17
23
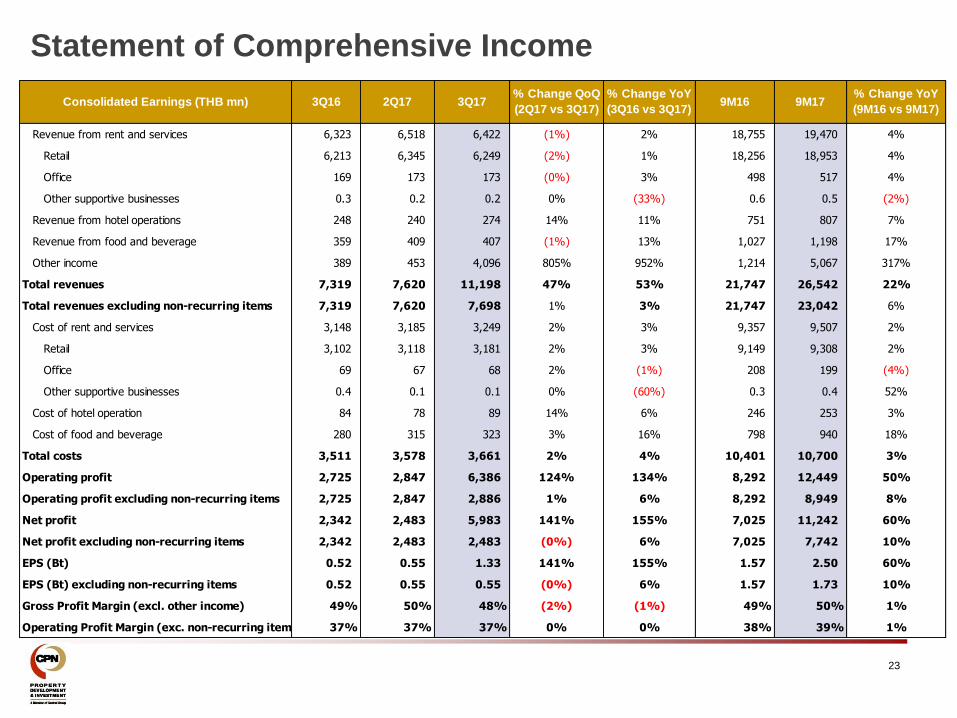
Statement of Comprehensive Income
Revenue from rent and services 6,323 6,518 6,422 (1%) 2% 18,755 19,470 4%
Retail 6,213 6,345 6,249 (2%) 1% 18,256 18,953 4%
Office 169 173 173 (0%) 3% 498 517 4%
Other supportive businesses 0.3 0.2 0.2 0% (33%) 0.6 0.5 (2%)
Revenue from hotel operations 248 240 274 14% 11% 751 807 7%
Revenue from food and beverage 359 409 407 (1%) 13% 1,027 1,198 17%
Other income 389 453 4,096 805% 952% 1,214 5,067 317%
Total revenues 7,319 7,620 11,198 47% 53% 21,747 26,542 22%
Total revenues excluding non-recurring items 7,319 7,620 7,698 1% 3% 21,747 23,042 6%
Cost of rent and services 3,148 3,185 3,249 2% 3% 9,357 9,507 2%
Retail 3,102 3,118 3,181 2% 3% 9,149 9,308 2%
Office 69 67 68 2% (1%) 208 199 (4%)
Other supportive businesses 0.4 0.1 0.1 0% (60%) 0.3 0.4 52%
Cost of hotel operation 84 78 89 14% 6% 246 253 3%
Cost of food and beverage 280 315 323 3% 16% 798 940 18%
Total costs 3,511 3,578 3,661 2% 4% 10,401 10,700 3%
Operating profit 2,725 2,847 6,386 124% 134% 8,292 12,449 50%
Operating profit excluding non-recurring items 2,725 2,847 2,886 1% 6% 8,292 8,949 8%
Net profit 2,342 2,483 5,983 141% 155% 7,025 11,242 60%
Net profit excluding non-recurring items 2,342 2,483 2,483 (0%) 6% 7,025 7,742 10%
EPS (Bt) 0.52 0.55 1.33 141% 155% 1.57 2.50 60%
EPS (Bt) excluding non-recurring items 0.52 0.55 0.55 (0%) 6% 1.57 1.73 10%
Gross Profit Margin (excl. other income) 49% 50% 48% (2%) (1%) 49% 50% 1%
Operating Profit Margin (exc. non-recurring item) 37% 37% 37% 0% 0% 38% 39% 1%
9M17% Change YoY
(9M16 vs 9M17)
% Change YoY
(3Q16 vs 3Q17)
% Change QoQ
(2Q17 vs 3Q17)9M163Q17Consolidated Earnings (THB mn) 3Q16 2Q17
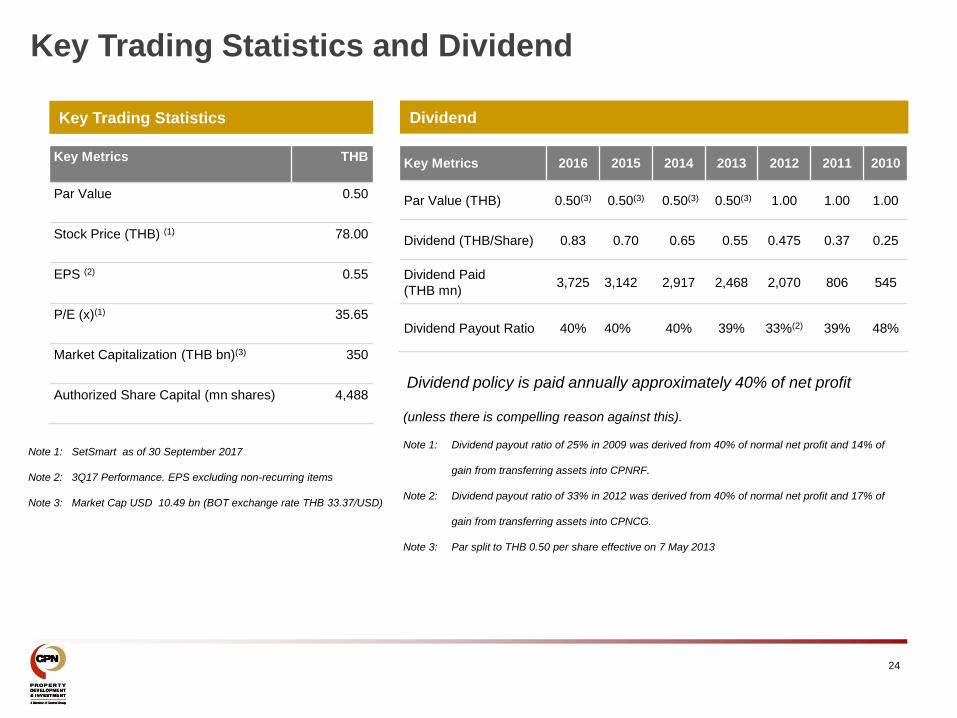
Note 1: SetSmart as of 30 September 2017
Note 2: 3Q17 Performance. EPS excluding non-recurring items
Note 3: Market Cap USD 10.49 bn (BOT exchange rate THB 33.37/USD)
24
Dividend
Dividend policy is paid annually approximately 40% of net profit
(unless there is compelling reason against this).
Note 1: Dividend payout ratio of 25% in 2009 was derived from 40% of normal net profit and 14% of
gain from transferring assets into CPNRF.
Note 2: Dividend payout ratio of 33% in 2012 was derived from 40% of normal net profit and 17% of
gain from transferring assets into CPNCG.
Note 3: Par split to THB 0.50 per share effective on 7 May 2013
Key Trading Statistics
Key Metrics THB
Par Value 0.50
Stock Price (THB) (1) 78.00
EPS (2) 0.55
P/E (x)(1) 35.65
Market Capitalization (THB bn)(3) 350
Authorized Share Capital (mn shares) 4,488
Key Metrics 2016 2015 2014 2013 2012 2011 2010
Par Value (THB) 0.50(3) 0.50(3) 0.50(3) 0.50(3) 1.00 1.00 1.00
Dividend (THB/Share) 0.83 0.70 0.65 0.55 0.475 0.37 0.25
Dividend Paid
(THB mn) 3,725 3,142 2,917 2,468 2,070 806 545
Dividend Payout Ratio 40% 40% 40% 39% 33%(2) 39% 48%
Key Trading Statistics and Dividend
25 Note 1: Includes rental agreements < 1 year such as kiosk, carts, ATMs and coin machines and CPN acts as the property manager. Note 2: Percentage based on leasable area.
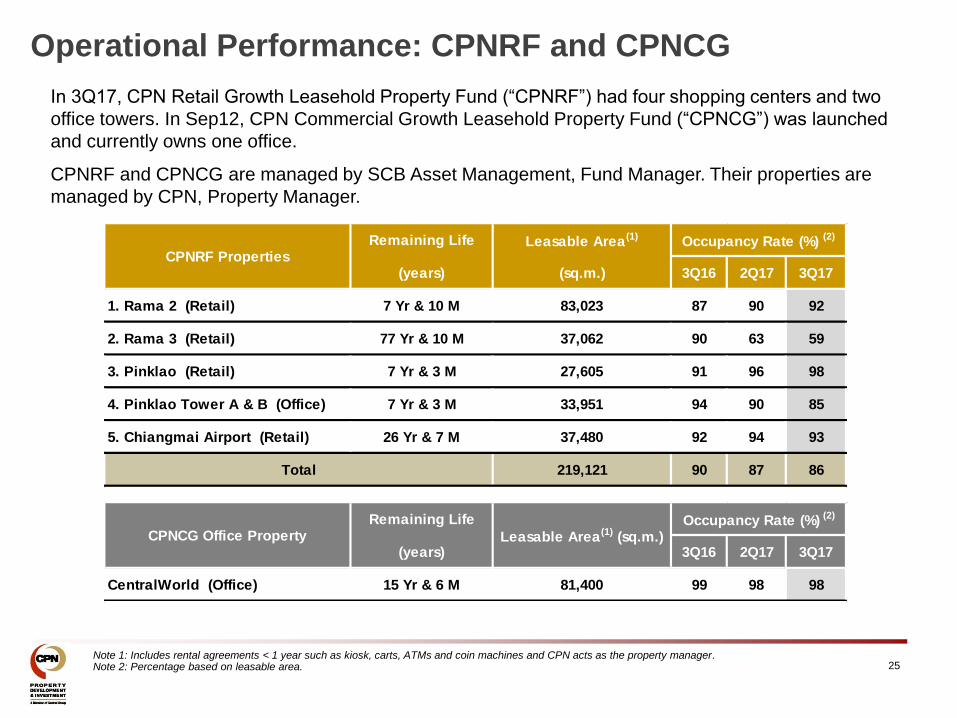
In 3Q17, CPN Retail Growth Leasehold Property Fund (“CPNRF”) had four shopping centers and two
office towers. In Sep12, CPN Commercial Growth Leasehold Property Fund (“CPNCG”) was launched
and currently owns one office.
CPNRF and CPNCG are managed by SCB Asset Management, Fund Manager. Their properties are
managed by CPN, Property Manager.
Operational Performance: CPNRF and CPNCG
Remaining Life Leasable Area (1)
(years) (sq.m.) 3Q16 2Q17 3Q17
1. Rama 2 (Retail) 7 Yr & 10 M 83,023 87 90 92
2. Rama 3 (Retail) 77 Yr & 10 M 37,062 90 63 59
3. Pinklao (Retail) 7 Yr & 3 M 27,605 91 96 98
4. Pinklao Tower A & B (Office) 7 Yr & 3 M 33,951 94 90 85
5. Chiangmai Airport (Retail) 26 Yr & 7 M 37,480 92 94 93
219,121 90 87 86
Occupancy Rate (%) (2)
CPNRF Properties
Total
Remaining Life
(years) 3Q16 2Q17 3Q17
CentralWorld (Office) 15 Yr & 6 M 81,400 99 98 98
Occupancy Rate (%) (2)
CPNCG Office Property Leasable Area (1) (sq.m.)

26
Awards & Recognition 2017
“Thailand’s Top Corporate Brands Value 2017”
CPN received Thailand’s Top Corporate Brand Values 2017 Award in Property
Sector with brand value of THB 139,199 mn from Chulalongkorn University
and the Stock Exchange of Thailand
“2017 Down Jones Sustainability Indices (DJSI)” CPN is recognized in the DJSI Emerging Markets for 4 consecutive years.
the list of DJSI members will be effective from September 18, 2017 on wards.
Source: SET News 72/2017
“Top 10 Developers Awards 2017” by BCI ASIA for 2 projects:
Central Phuket and CentralPlaza Mahachai This award is given to the firms in Asia which are the national leading developers
that have developed great design and development, and have environmental
concern.
Silver - The Design and Development Award: CentralFestival
EastVille The International Council of Shopping Centers (ICSC) has announced the winners
of the 2017 Asia-Pacific Shopping Center Awards, recognizing the region’s most
innovative shopping centers for outstanding achievement in marketing, design and
development, and retail.
27
The information contained in this presentation is for information purposes only and does not constitute an offer or invitation to sell or the
solicitation of an offer or invitation to purchase or subscribe for share in Central Pattana Public Company Limited (“CPN” and shares in
CPN, “shares”) in any jurisdiction nor should it or any part of it form the basis of, or be relied upon in any connection with, any contract or
commitment whatsoever.
This presentation may include information which is forward-looking in nature. Forward-looking information involve known and unknown
risks, uncertainties and other factors which may impact on the actual outcomes, including economic conditions in the markets in which CPN
operates and general achievement of CPN business forecasts, which will cause the actual results, performance or achievements of CPN to
differ, perhaps materially, from the results, performance or achievements expressed or implied in this presentation.
This presentation has been prepared by the CPN. The information in this presentation has not been independently verified. No
representation, warranty, express or implied, is made as to, and no reliance should be placed on, the fairness, accuracy, completeness or
correctness of the information and opinions in this presentation. None of the CPN or any of its agents or advisers, or any of their respective
affiliates, advisers or representatives, shall have any liability (in negligence or otherwise) for any loss howsoever arising from any use of this
presentation or its contents or otherwise arising in connection with this presentation.
This presentation is made, furnished and distributed for information purposes only. No part of this presentation shall be relied upon directly
or indirectly for any investment decision-making or for any other purposes.
This presentation and all other information, materials or documents provided in connection therewith, shall not, either in whole or in part, be
reproduced, redistributed or made available to any other person, save in strict compliance with all applicable laws.
Note: All currency figures within this presentation are presented in Thai Baht unless otherwise stated.
Disclaimer
Investor Relations
Address
Central Pattana Public Company Limited
31st Fl, the Offices at CentralWorld
999-9 Rama I Rd., Patumwan District
Bangkok 10330
Thailand
Tel: +66(0) 2667 5555 ext. 1688, 1689, 1632
Facsimile: +66(0) 2264 5593
Email: [email protected]
28

1
CPN Retail Growth Leasehold Property Fund
3rd Quarter 2017 Financial Results
24th November 2017
2
Important Notice
The information contained in this presentation is for information purposes only and does not constitute an offer or invitation to sell or the solicitation of an offer or invitation to purchase or subscribe for units in CPN Retail Growth Leasehold Property Fund (CPNRF and units in CPNRF, “Units”) in any jurisdiction nor should it or any part of it form the basis of, or be relied upon in any connection with, any contract or commitment whatsoever.
This presentation may include information which is forward-looking in nature. Forward-looking information involve known and unknown risks, uncertainties and other factors which may impact on the actual
outcomes, including economic conditions in the markets in which CPNRF operates and general achievement of CPNRF business forecasts, which will cause the actual results, performance or achievements of CPNRF to differ, perhaps materially, from the results, performance or achievements expressed or implied in this presentation.
This presentation has been prepared by the CPNRF Property Manager. The information in this presentation has not been independently verified. No representation, warranty, express or implied, is made as to, and no reliance should be placed on, the fairness, accuracy, completeness or correctness of the information and opinions in this presentation. None of the CPNRF Property Manager or CPNRF Fund Manager or any of its agents or advisers, or any of their respective affiliates, advisers or representatives, shall have any liability (in negligence or otherwise) for any loss howsoever arising from any use of this presentation or its contents or otherwise arising in connection with this presentation.
This presentation is made, furnished and distributed for information purposes only. No part of this presentation shall be relied upon directly or indirectly for any investment decision-making or for any other purposes.
This presentation and all other information, materials or documents provided in connection therewith, shall not, either in whole or in part, be reproduced, redistributed or made available to any other person, save in strict compliance with all applicable laws.
3
Contents
Page
1. Operations 4
2. Financial Highlights 9
3. Q&A

1. Operations
5
Leasable Area and Occupancy
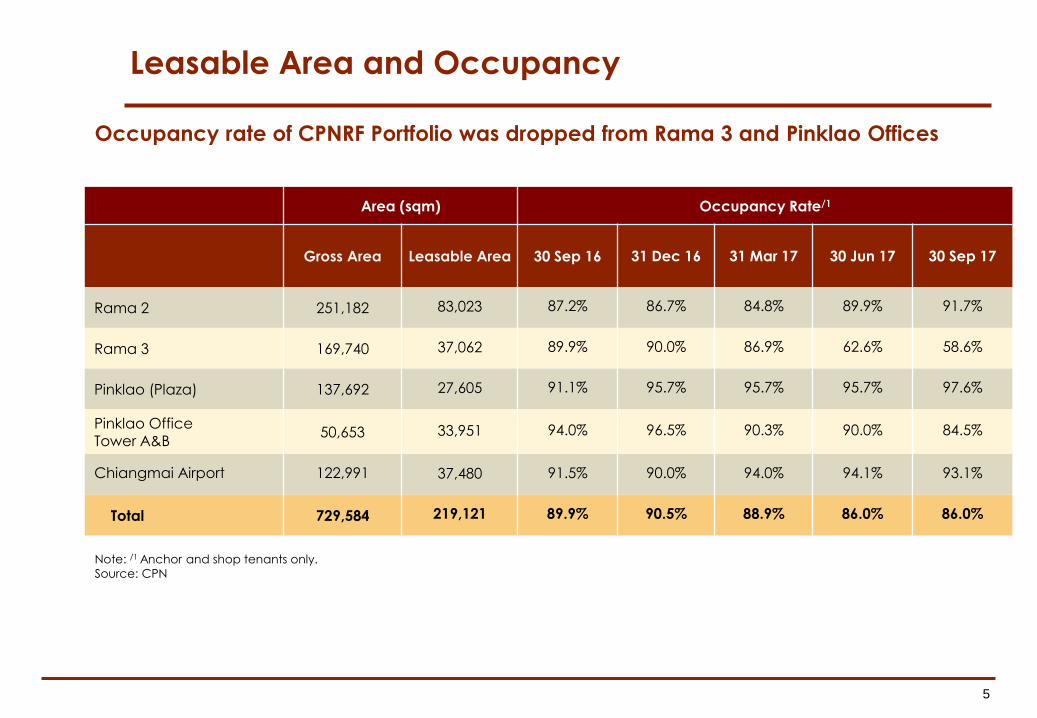
Occupancy rate of CPNRF Portfolio was dropped from Rama 3 and Pinklao Offices
Area (sqm) Occupancy Rate/1
Gross Area Leasable Area 30 Sep 16 31 Dec 16 31 Mar 17 30 Jun 17 30 Sep 17
Rama 2 251,182 83,023 87.2% 86.7% 84.8% 89.9% 91.7%
Rama 3 169,740 37,062 89.9% 90.0% 86.9% 62.6% 58.6%
Pinklao (Plaza) 137,692 27,605 91.1% 95.7% 95.7% 95.7% 97.6%
Pinklao Office Tower A&B
50,653 33,951 94.0% 96.5% 90.3% 90.0% 84.5%
Chiangmai Airport 122,991 37,480 91.5% 90.0% 94.0% 94.1% 93.1%
Total 729,584 219,121 89.9% 90.5% 88.9% 86.0% 86.0%
Note: /1 Anchor and shop tenants only.
Source: CPN
6
New and Renewed Lease Profile
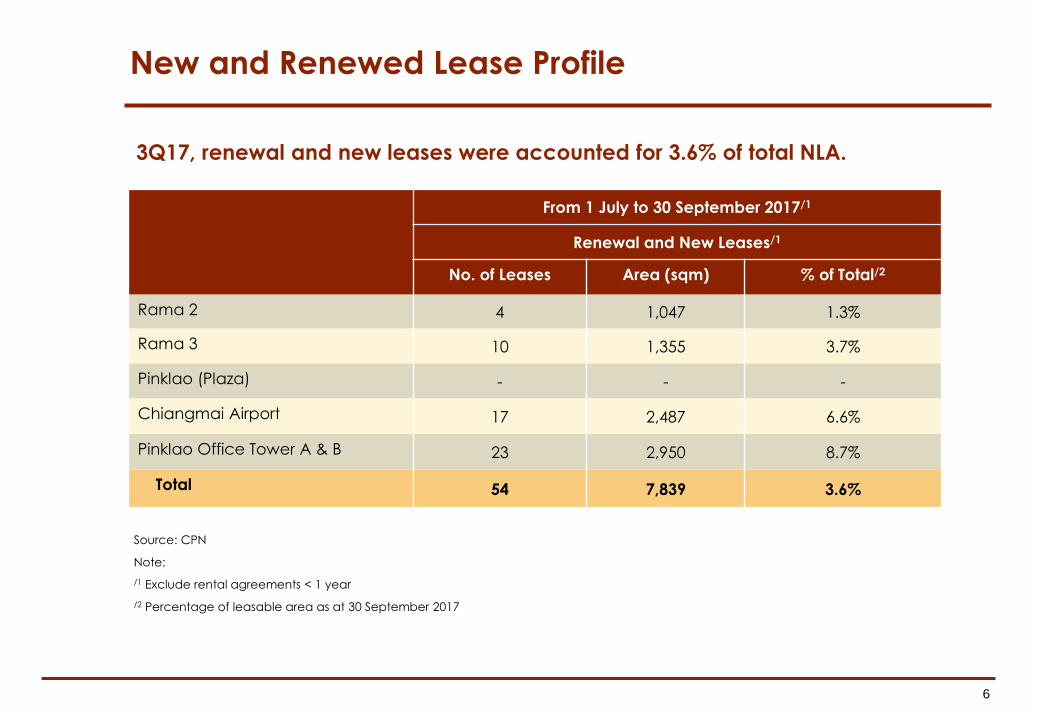
3Q17, renewal and new leases were accounted for 3.6% of total NLA.
From 1 July to 30 September 2017/1
Renewal and New Leases/1
No. of Leases Area (sqm) % of Total/2
Rama 2 4 1,047 1.3%
Rama 3 10 1,355 3.7%
Pinklao (Plaza) - - -
Chiangmai Airport 17 2,487 6.6%
Pinklao Office Tower A & B 23 2,950 8.7%
Total 54 7,839 3.6%
Source: CPN
Note:
/1 Exclude rental agreements < 1 year
/2 Percentage of leasable area as at 30 September 2017
7
Lease expiry profile
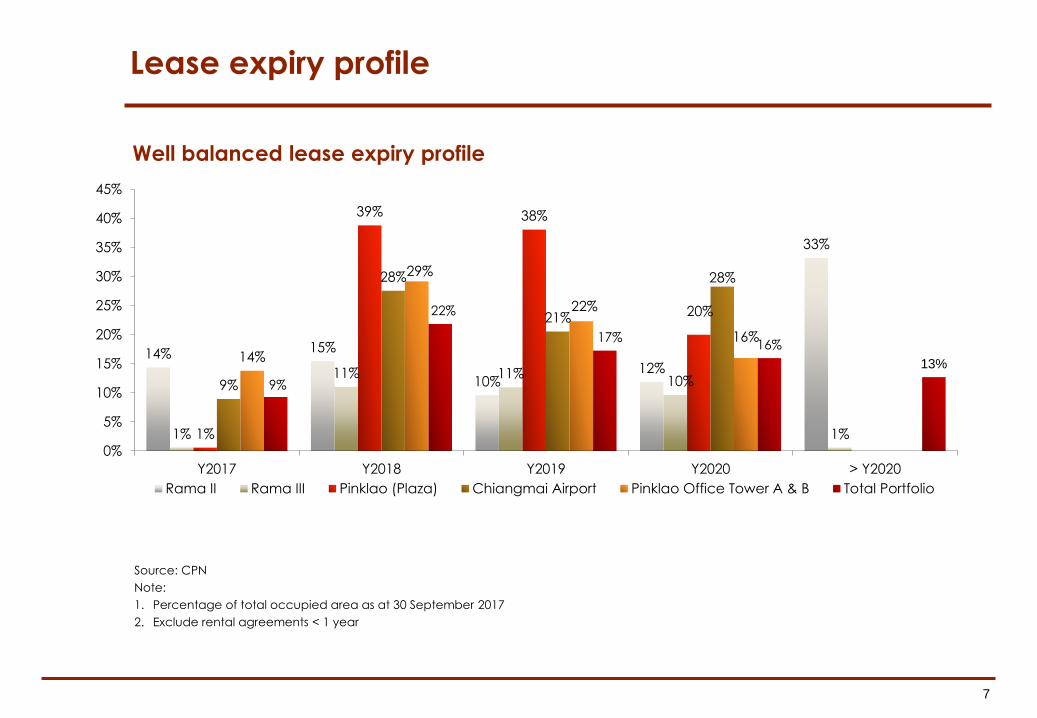
Well balanced lease expiry profile
Source: CPN
Note:
1. Percentage of total occupied area as at 30 September 2017
2. Exclude rental agreements < 1 year
14% 15%
10%12%
33%
1%
11% 11%10%
1%1%
39% 38%
20%
9%
28%
21%
28%
14%
29%
22%
16%
9%
22%
17%16%
13%
0%
5%
10%
15%
20%
25%
30%
35%
40%
45%
Y2017 Y2018 Y2019 Y2020 > Y2020
Rama II Rama III Pinklao (Plaza) Chiangmai Airport Pinklao Office Tower A & B Total Portfolio
8
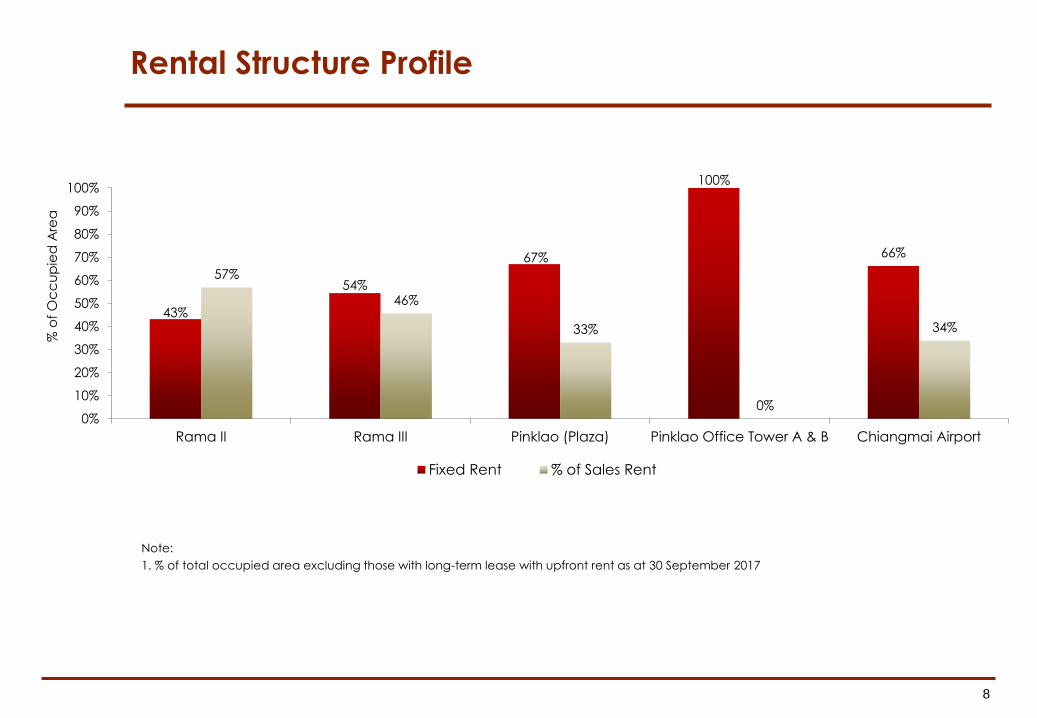
Rental Structure Profile
Note:
1. % of total occupied area excluding those with long-term lease with upfront rent as at 30 September 2017
43%
54%
67%
100%
66%
57%
46%
33%
0%
34%
0%
10%
20%
30%
40%
50%
60%
70%
80%
90%
100%
Rama II Rama III Pinklao (Plaza) Pinklao Office Tower A & B Chiangmai Airport
% o
f O
cc
up
ied
Are
a
Fixed Rent % of Sales Rent

2. Financial Highlights
10
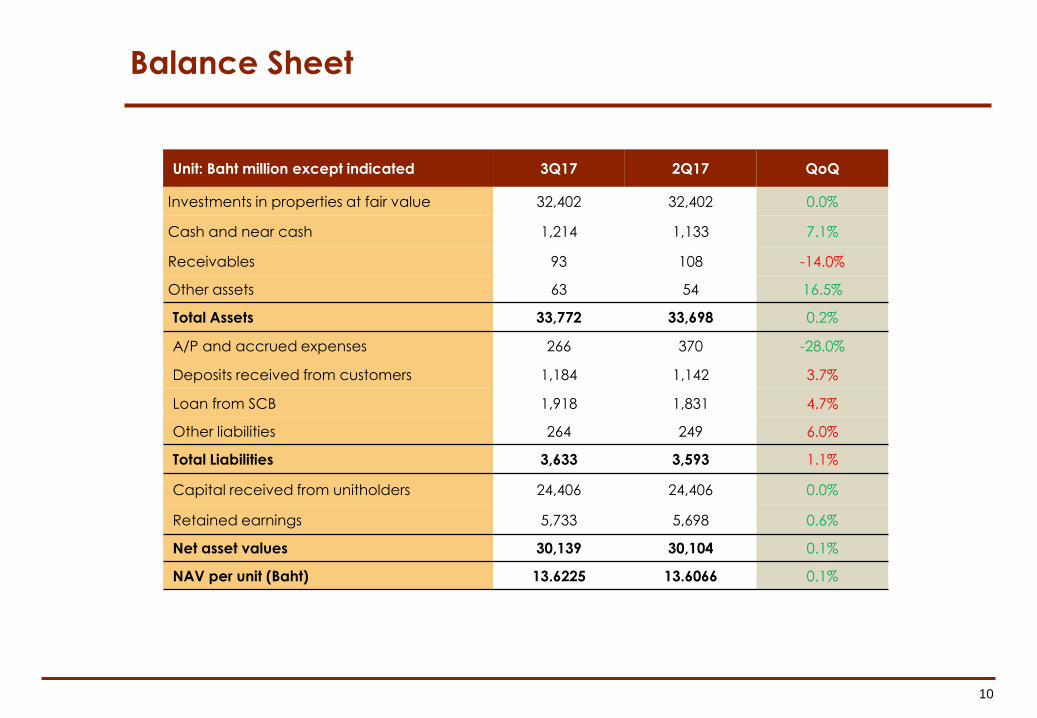
Balance Sheet
Unit: Baht million except indicated 3Q17 2Q17 QoQ
Investments in properties at fair value 32,402 32,402 0.0%
Cash and near cash 1,214 1,133 7.1%
Receivables 93 108 -14.0%
Other assets 63 54 16.5%
Total Assets 33,772 33,698 0.2%
A/P and accrued expenses 266 370 -28.0%
Deposits received from customers 1,184 1,142 3.7%
Loan from SCB 1,918 1,831 4.7%
Other liabilities 264 249 6.0%
Total Liabilities 3,633 3,593 1.1%
Capital received from unitholders 24,406 24,406 0.0%
Retained earnings 5,733 5,698 0.6%
Net asset values 30,139 30,104 0.1%
NAV per unit (Baht) 13.6225 13.6066 0.1%
11
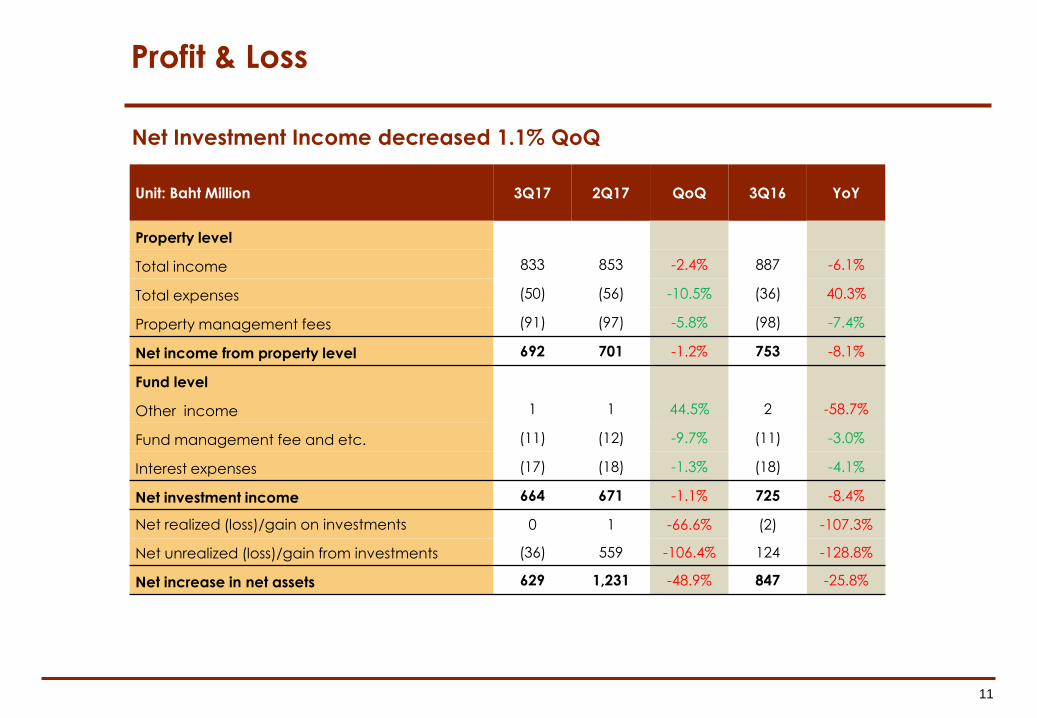
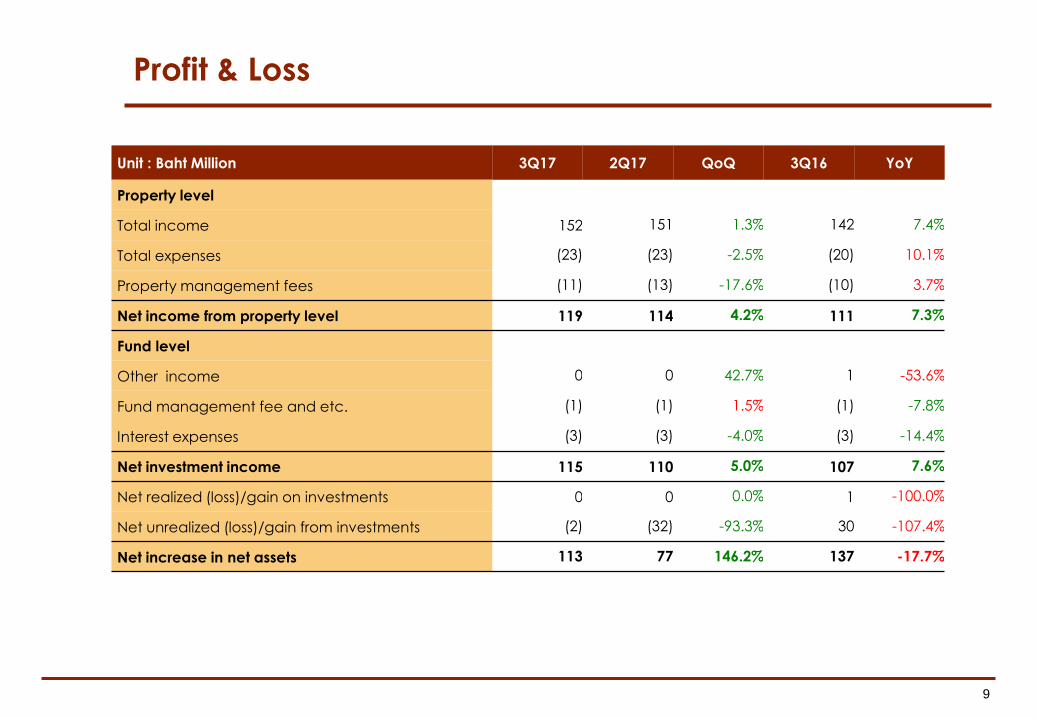
Profit & Loss
Unit: Baht Million 3Q17 2Q17 QoQ 3Q16 YoY
Property level
Total income 833 853 -2.4% 887 -6.1%
Total expenses (50) (56) -10.5% (36) 40.3%
Property management fees (91) (97) -5.8% (98) -7.4%
Net income from property level 692 701 -1.2% 753 -8.1%
Fund level
Other income 1 1 44.5% 2 -58.7%
Fund management fee and etc. (11) (12) -9.7% (11) -3.0%
Interest expenses (17) (18) -1.3% (18) -4.1%
Net investment income 664 671 -1.1% 725 -8.4%
Net realized (loss)/gain on investments 0 1 -66.6% (2) -107.3%
Net unrealized (loss)/gain from investments (36) 559 -106.4% 124 -128.8%
Net increase in net assets 629 1,231 -48.9% 847 -25.8%
Net Investment Income decreased 1.1% QoQ
12
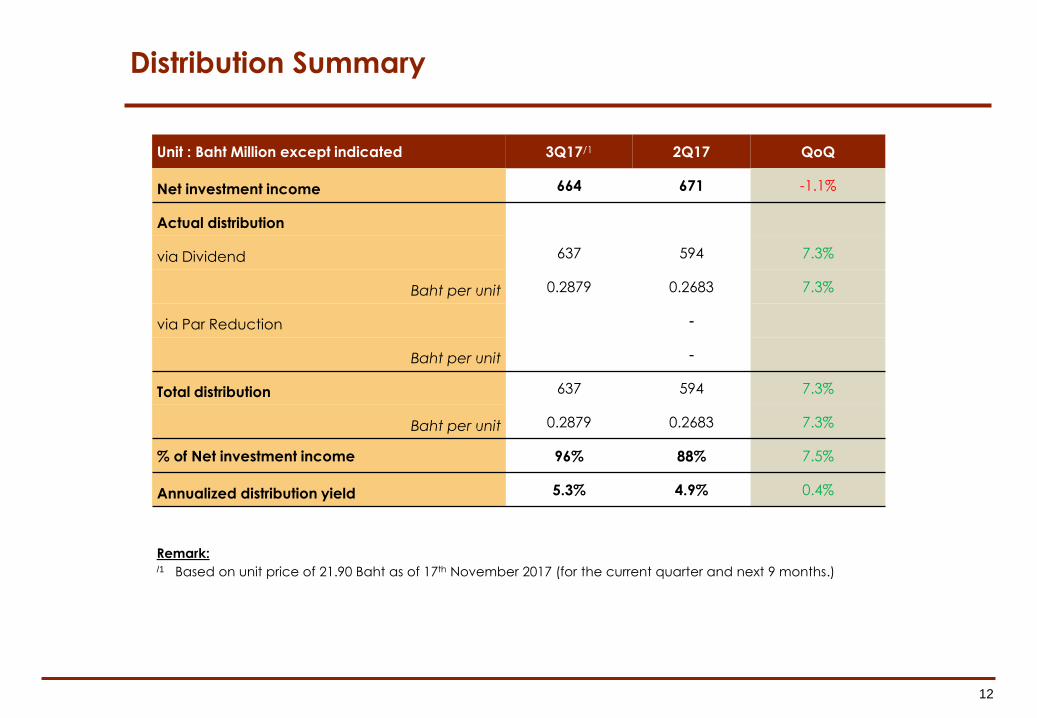
Distribution Summary
Remark:/1 Based on unit price of 21.90 Baht as of 17th November 2017 (for the current quarter and next 9 months.)
Unit : Baht Million except indicated 3Q17/1 2Q17 QoQ
Net investment income 664 671 -1.1%
Actual distribution
via Dividend 637 594 7.3%
Baht per unit 0.2879 0.2683 7.3%
via Par Reduction -
Baht per unit -
Total distribution 637 594 7.3%
Baht per unit 0.2879 0.2683 7.3%
% of Net investment income 96% 88% 7.5%
Annualized distribution yield 5.3% 4.9% 0.4%
13
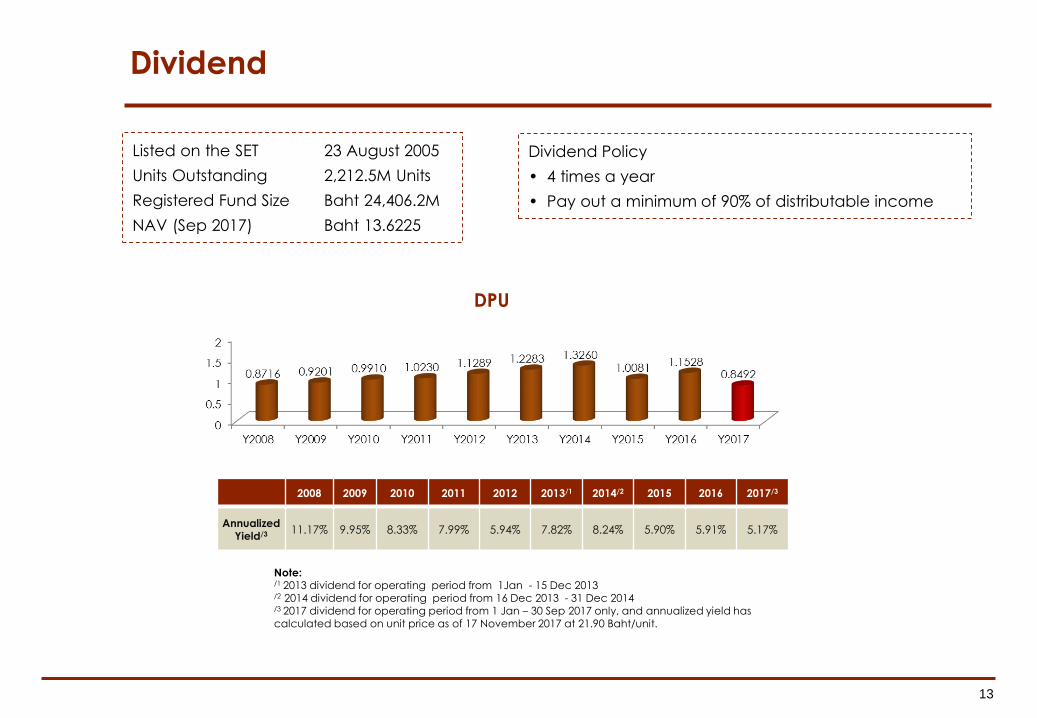
Dividend
Dividend Policy
• 4 times a year
• Pay out a minimum of 90% of distributable income
Note: /1 2013 dividend for operating period from 1Jan - 15 Dec 2013/2 2014 dividend for operating period from 16 Dec 2013 - 31 Dec 2014/3 2017 dividend for operating period from 1 Jan – 30 Sep 2017 only, and annualized yield has calculated based on unit price as of 17 November 2017 at 21.90 Baht/unit.
Listed on the SET 23 August 2005
Units Outstanding 2,212.5M Units
Registered Fund Size Baht 24,406.2M
NAV (Sep 2017) Baht 13.6225
2008 2009 2010 2011 2012 2013/1 2014/2 2015 2016 2017/3
Annualized Yield/3 11.17% 9.95% 8.33% 7.99% 5.94% 7.82% 8.24% 5.90% 5.91% 5.17%
DPU
14
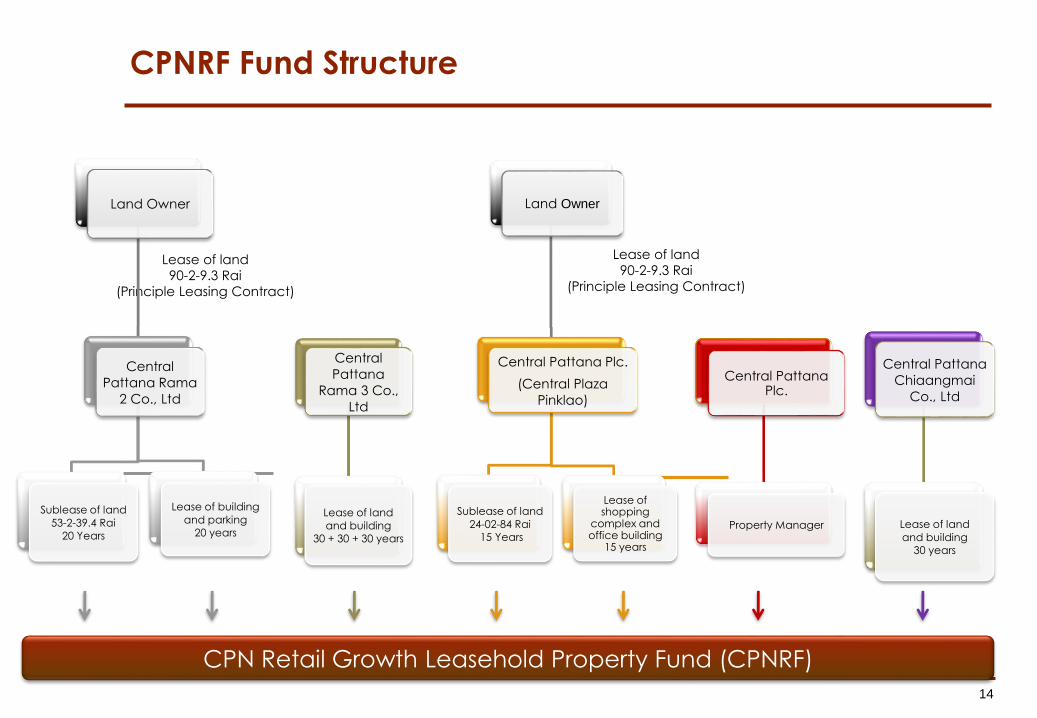
CPNRF Fund Structure
Lease of land
90-2-9.3 Rai
(Principle Leasing Contract)
Lease of land
90-2-9.3 Rai
(Principle Leasing Contract)
CPN Retail Growth Leasehold Property Fund (CPNRF)
Land Owner
Central
Pattana Rama
2 Co., Ltd
Sublease of land
53-2-39.4 Rai
20 Years
Lease of building
and parking
20 years
Central
Pattana
Rama 3 Co.,
Ltd
Lease of land
and building
30 + 30 + 30 years
Land Owner
Central Pattana Plc.
(Central Plaza
Pinklao)
Sublease of land
24-02-84 Rai
15 Years
Lease of shopping
complex and office building
15 years
Central PattanaPlc.
Property Manager
Central Pattana
Chiaangmai
Co., Ltd
Lease of land
and building
30 years
15
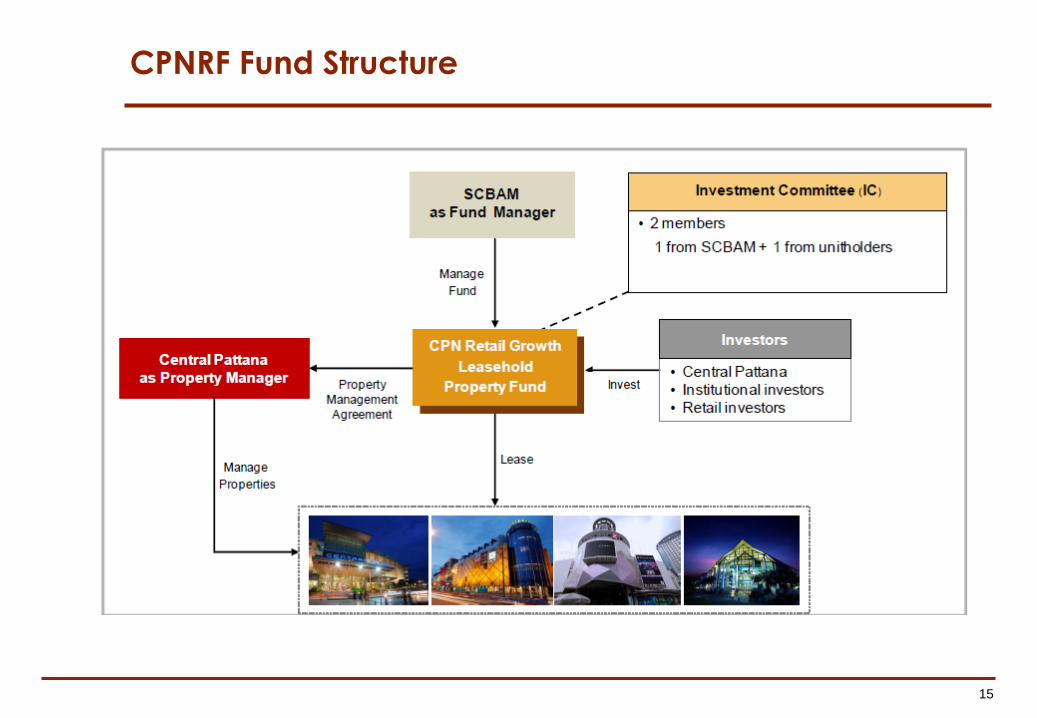
CPNRF Fund Structure
16
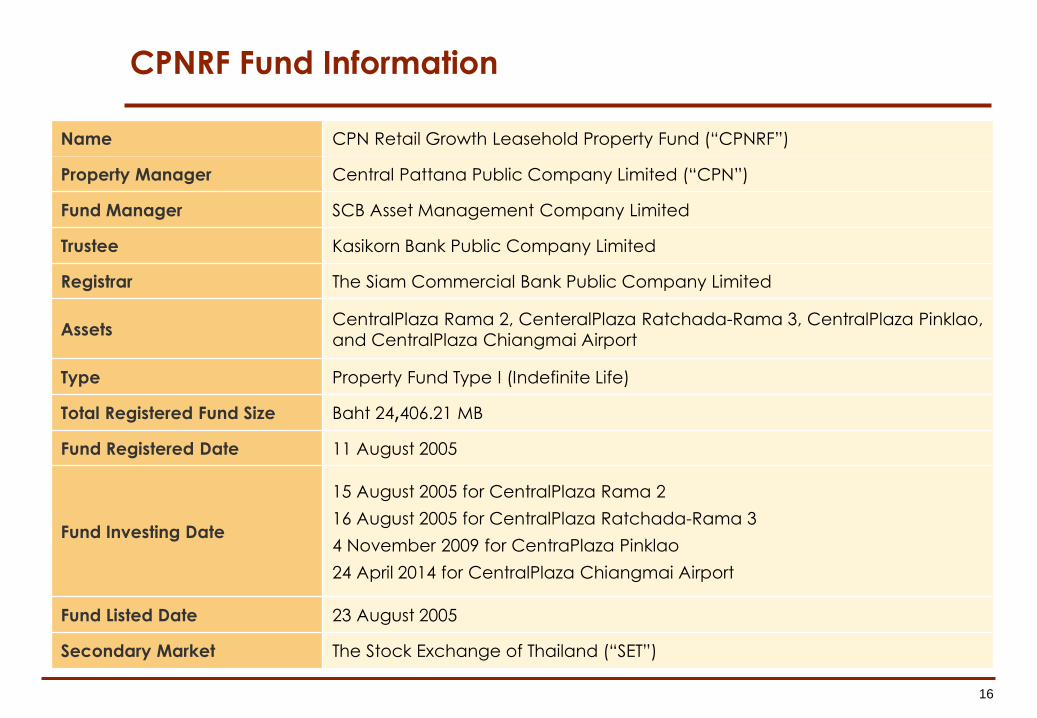
CPNRF Fund Information
Name CPN Retail Growth Leasehold Property Fund (“CPNRF”)
Property Manager Central Pattana Public Company Limited (“CPN”)
Fund Manager SCB Asset Management Company Limited
Trustee Kasikorn Bank Public Company Limited
Registrar The Siam Commercial Bank Public Company Limited
AssetsCentralPlaza Rama 2, CenteralPlaza Ratchada-Rama 3, CentralPlaza Pinklao,
and CentralPlaza Chiangmai Airport
Type Property Fund Type I (Indefinite Life)
Total Registered Fund Size Baht 24,406.21 MB
Fund Registered Date 11 August 2005
Fund Investing Date
15 August 2005 for CentralPlaza Rama 2
16 August 2005 for CentralPlaza Ratchada-Rama 3
4 November 2009 for CentraPlaza Pinklao
24 April 2014 for CentralPlaza Chiangmai Airport
Fund Listed Date 23 August 2005
Secondary Market The Stock Exchange of Thailand (“SET”)

1
CPN Commercial Growth Leasehold Property Fund
3rd Quarter 2017 Financial Results
24th November 2017
2
Important Notice
The information contained in this presentation is for information purposes only and does not constitute an
offer or invitation to sell or the solicitation of an offer or invitation to purchase or subscribe for units in CPN Commercial Growth Leasehold Property Fund (CPNCG and units in CPNCG, “Units”) in any jurisdiction nor should it or any part of it form the basis of, or be relied upon in any connection with, any contract or commitment whatsoever.
This presentation may include information which is forward-looking in nature. Forward-looking information involve known and unknown risks, uncertainties and other factors which may impact on the actual outcomes, including economic conditions in the markets in which CPNCG operates and general
achievement of CPNCG business forecasts, which will cause the actual results, performance or achievements of CPNCG to differ, perhaps materially, from the results, performance or achievements expressed or implied in this presentation.
This presentation has been prepared by the CPNCG Property Manager. The information in this presentation has not been independently verified. No representation, warranty, express or implied, is made as to, and no reliance should be placed on, the fairness, accuracy, completeness or correctness of the information
and opinions in this presentation. None of the CPNCG Property Manager or CPNCG Fund Manager or any of its agents or advisers, or any of their respective affiliates, advisers or representatives, shall have any liability (in negligence or otherwise) for any loss howsoever arising from any use of this presentation or its contents or otherwise arising in connection with this presentation.
This presentation is made, furnished and distributed for information purposes only. No part of this presentation shall be relied upon directly or indirectly for any investment decision-making or for any other purposes.
This presentation and all other information, materials or documents provided in connection therewith, shall not, either in whole or in part, be reproduced, redistributed or made available to any other person, save in strict compliance with all applicable laws.

3
Contents
Page
1. Operations 4
2. Financial Highlights 8
3. Q&A

1. Operations
5
Leasable Area and Occupancy
Source: CPN
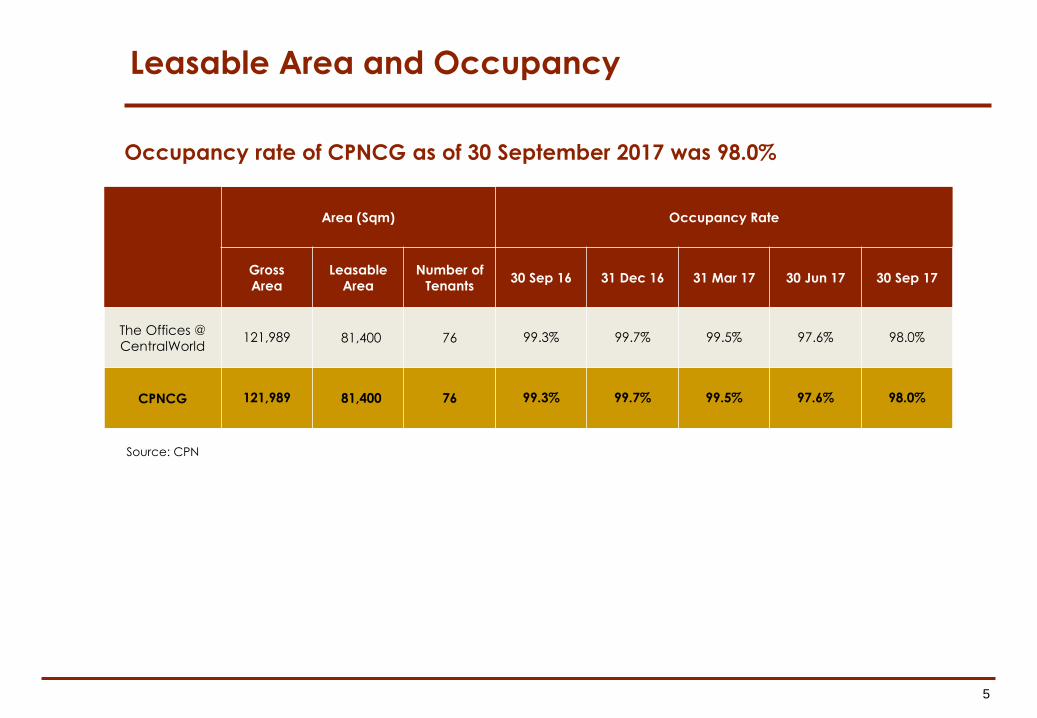
Occupancy rate of CPNCG as of 30 September 2017 was 98.0%
Area (Sqm) Occupancy Rate
Gross
Area
Leasable
Area
Number of
Tenants 30 Sep 16 31 Dec 16 31 Mar 17 30 Jun 17 30 Sep 17
The Offices @
CentralWorld 121,989 81,400 76 99.3% 99.7% 99.5% 97.6% 98.0%
CPNCG 121,989 81,400 76 99.3% 99.7% 99.5% 97.6% 98.0%
6
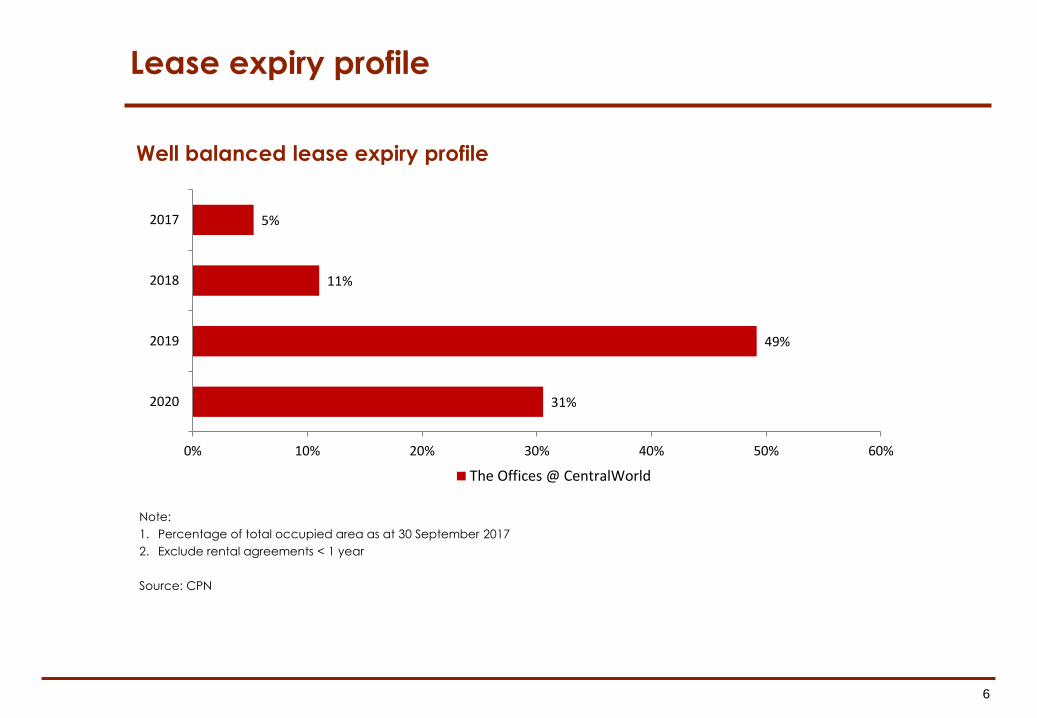
Lease expiry profile
Note:
1. Percentage of total occupied area as at 30 September 2017
2. Exclude rental agreements < 1 year
Source: CPN
Well balanced lease expiry profile
31%
49%
11%
5%
0% 10% 20% 30% 40% 50% 60%
2020
2019
2018
2017
The Offices @ CentralWorld
7
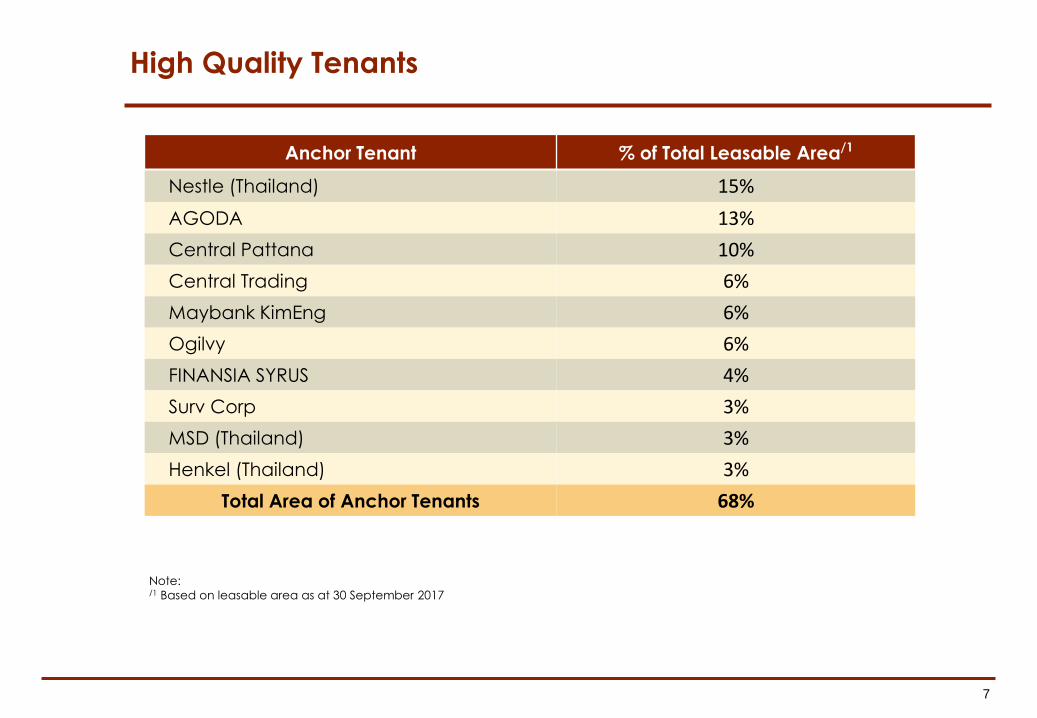
High Quality Tenants
Note: /1 Based on leasable area as at 30 September 2017
Anchor Tenant % of Total Leasable Area/1
Nestle (Thailand) 15%
AGODA 13%
Central Pattana 10%
Central Trading 6%
Maybank KimEng 6%
Ogilvy 6%
FINANSIA SYRUS 4%
Surv Corp 3%
MSD (Thailand) 3%
Henkel (Thailand) 3%
Total Area of Anchor Tenants 68%

2. Financial Highlights
9
Profit & Loss
Unit : Baht Million 3Q17 2Q17 QoQ 3Q16 YoY
Property level
Total income 152 151 1.3% 142 7.4%
Total expenses (23) (23) -2.5% (20) 10.1%
Property management fees (11) (13) -17.6% (10) 3.7%
Net income from property level 119 114 4.2% 111 7.3%
Fund level
Other income 0 0 42.7% 1 -53.6%
Fund management fee and etc. (1) (1) 1.5% (1) -7.8%
Interest expenses (3) (3) -4.0% (3) -14.4%
Net investment income 115 110 5.0% 107 7.6%
Net realized (loss)/gain on investments 0 0 0.0% 1 -100.0%
Net unrealized (loss)/gain from investments (2) (32) -93.3% 30 -107.4%
Net increase in net assets 113 77 146.2% 137 -17.7%
10
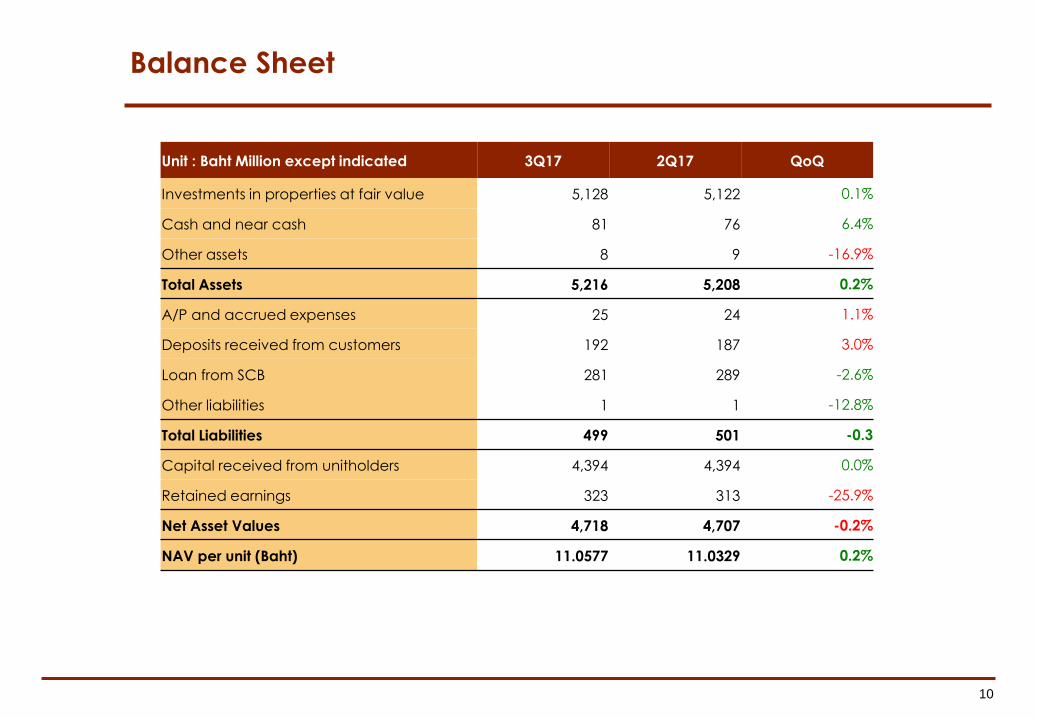
Balance Sheet
Unit : Baht Million except indicated 3Q17 2Q17 QoQ
Investments in properties at fair value 5,128 5,122 0.1%
Cash and near cash 81 76 6.4%
Other assets 8 9 -16.9%
Total Assets 5,216 5,208 0.2%
A/P and accrued expenses 25 24 1.1%
Deposits received from customers 192 187 3.0%
Loan from SCB 281 289 -2.6%
Other liabilities 1 1 -12.8%
Total Liabilities 499 501 -0.3
Capital received from unitholders 4,394 4,394 0.0%
Retained earnings 323 313 -25.9%
Net Asset Values 4,718 4,707 -0.2%
NAV per unit (Baht) 11.0577 11.0329 0.2%
11
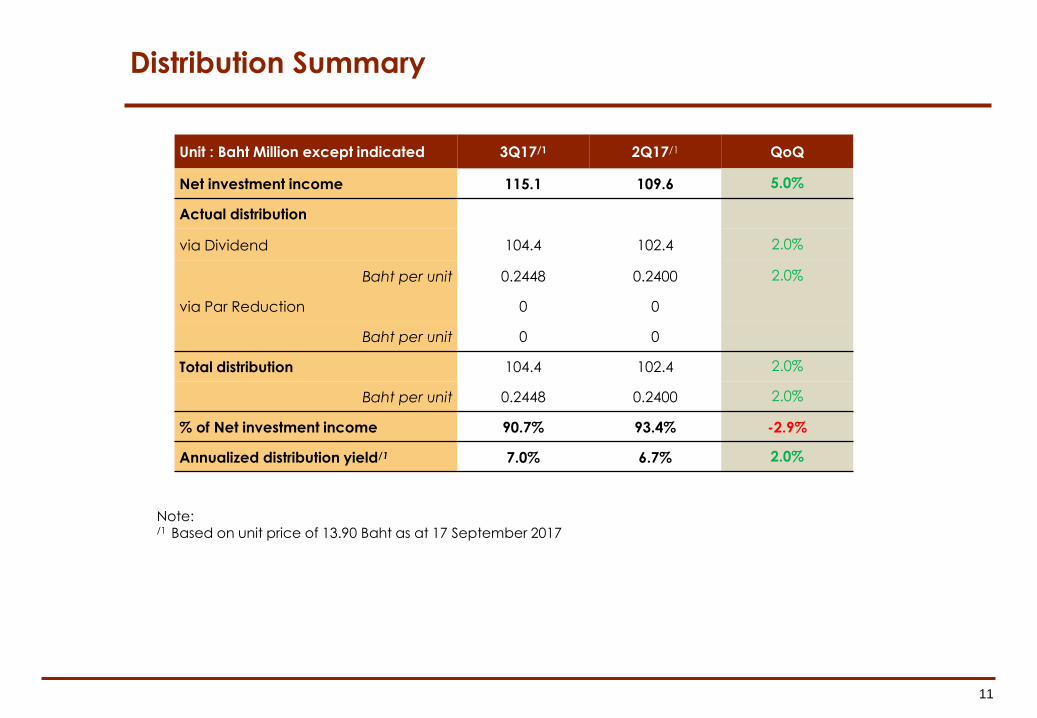
Distribution Summary
Note: /1 Based on unit price of 13.90 Baht as at 17 September 2017
Unit : Baht Million except indicated 3Q17/1 2Q17/1 QoQ
Net investment income 115.1 109.6 5.0%
Actual distribution
via Dividend 104.4 102.4 2.0%
Baht per unit 0.2448 0.2400 2.0%
via Par Reduction 0 0
Baht per unit 0 0
Total distribution 104.4 102.4 2.0%
Baht per unit 0.2448 0.2400 2.0%
% of Net investment income 90.7% 93.4% -2.9%
Annualized distribution yield/1 7.0% 6.7% 2.0%
12
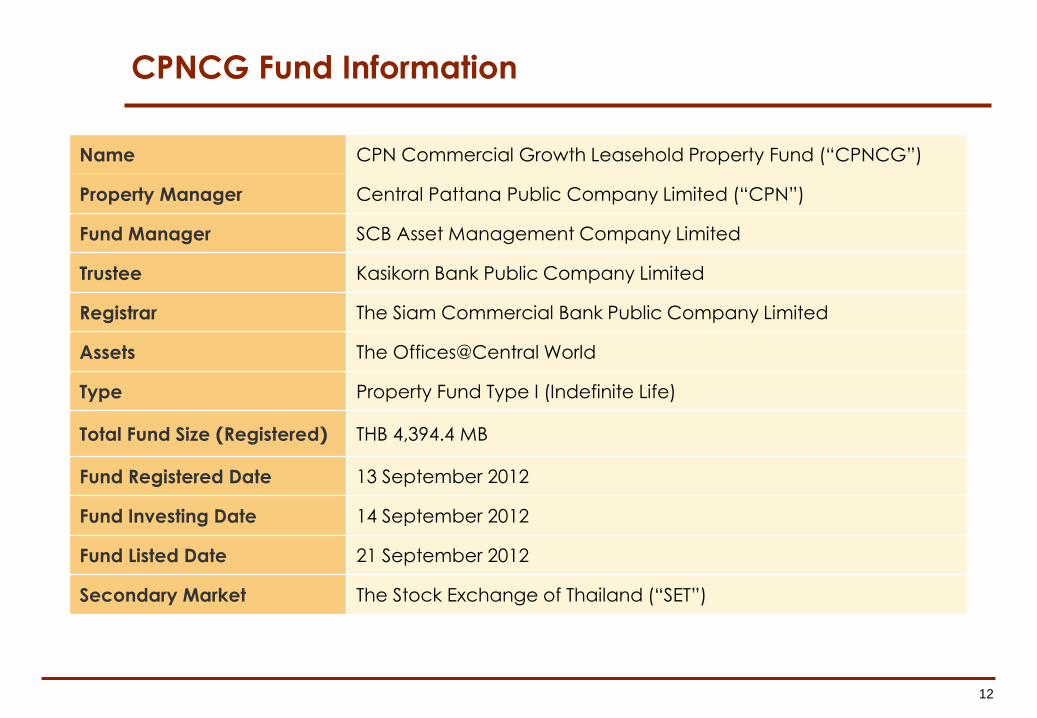
CPNCG Fund Information
Name CPN Commercial Growth Leasehold Property Fund (“CPNCG”)
Property Manager Central Pattana Public Company Limited (“CPN”)
Fund Manager SCB Asset Management Company Limited
Trustee Kasikorn Bank Public Company Limited
Registrar The Siam Commercial Bank Public Company Limited
Assets The Offices@Central World
Type Property Fund Type I (Indefinite Life)
Total Fund Size (Registered) THB 4,394.4 MB
Fund Registered Date 13 September 2012
Fund Investing Date 14 September 2012
Fund Listed Date 21 September 2012
Secondary Market The Stock Exchange of Thailand (“SET”)