Embed Size (px)
Citation preview

Central Valley Project Cost Allocation Study CalSim Modeling Documentation
DRAFT – For Discussion Purposes Only
Date
September 22, 2017
Purpose of Paper
Explain the hydrology modeling that has been used to determine single purpose alternative
facility sizes which are the basis for cost estimates. Models that compute economic benefits of
water supply, power, water quality, and fish and wildlife purposes use hydrology modeling
results which quantify these project purposes as inputs.
Background
This section documents the hydrology modeling tools used and hydrology analysis performed to
support the Central Valley Project (CVP) Cost Allocation Study (CAS). The CAS uses the
Separable Cost Remaining Benefits (SCRB) method for determining the appropriate distribution
of CVP facilities’ costs among the purposes for which the CVP was authorized. Among the
parameters used by the SCRB methodology are single purpose alternative costs, separable costs,
joint costs, and economic benefits. Hydrology modeling and analysis has been used to determine
single purpose alternative facility sizes which are the basis for cost estimates. Models that
compute economic benefits of water supply, power, water quality, and fish and wildlife purposes
use hydrology modeling results which quantify these project purposes as inputs.
The CVP serves multiple purposes, and each CVP facility serves one or more project purposes.
Most reservoirs are built to serve multiple purposes because this is more cost effective than
building multiple reservoirs which each have a single purpose. SCRB methodology uses the
concept of a single purpose alternative which addresses the question “what size reservoir is
required to serve only one purpose?” Single purpose facility sizing/costing for water supply, for
example, ignores all other purposes for the facility in question and assumes that delivering water
is its sole function. For a multi-purpose storage facility, the size that is required to satisfy a single
purpose is typically smaller than the full size of the facility. On the other hand, all of the single
purpose alternative (SPA) sizes of a particular project facility can add up to collectively be
greater than the actual size of the facility.
Model applications used in the CAS analysis include CalSim2, a Flow Tracker, and the Single
Purpose Facility Sizing Model. The CAS analysis used CalSim2 to depict project deliveries and

2
DRAFT – for Discussion Purposes Only
flows under a range of regulatory environments. These results were used as inputs to economic
benefits models and to the sizing model. A Flow Tracker model was developed to identify State
Water Project (SWP) storage release made specifically for Delta outflow – information needed
as input to the sizing model.
Additional analysis included post-processing of CalSim2 results and evaluation of Central Valley
Project Improvement Act (CVPIA) records. A spreadsheet post-processor for CalSim2 results
refined the model’s representation of drought year allocation decisions to ensure that delivery
results reflect recent operations. An evaluation was made of CVPIA 3406(b)(2) accounting
records to determine the use of storage to accomplish the goals of this program.
Details on model assumptions and algorithms and other analyses will be provided in sections for
each CVP purpose.
Water Supply Purpose
The CVP has agreements and contractual obligations to deliver water to agricultural, municipal
and industrial, and refuge water users throughout the Sacramento River and San Joaquin River
watersheds. Water deliveries depict the water supply purpose of the CVP. The capacity of the
system to deliver water is affected by regulations that govern operations to meet water quality
and flow standards at multiple locations. Deliveries are affected by water supply allocation,
which is determined by contract terms, delivery category, and operator decisions on managing
water supply to meet competing priorities.
For the water supply purpose, analysis served two needs: one was to quantify the deliveries that
define the water supply purpose, and the other was to determine the water supply single purpose
alternative storage sizes of the major CVP reservoirs. Figure 1 shows the flow of data, analysis,
and modeling tools used to address the water supply purpose for the CVP CAS.
Figure 1 – Hydrology modeling and analysis for the CVP water supply purpose

3
DRAFT – for Discussion Purposes Only
Quantifying the Water Supply Purpose The historical record of CVP water deliveries cannot be used to characterize the water supply
purpose of the project because demand has increased over time due to the progressive buildout of
project facilities and because basin-wide regulations have evolved over time, mostly decreasing
delivery capacity. The CalSim2 planning model was used to simulate delivery that is possible
1) over a range of hydrologic conditions, 2) given a consistent level of demand (land use and
population), and 3) under the current regulatory environment. The delivery results of this
“current operations” scenario characterize the water supply reliability of the CVP.
CalSim2 is a planning model typically used to compare an operational alternative to a base study
to discern the impact of a particular facility or regulation. Its general operations logic does not
include the ability to make unique decisions such as those taken in recent years under extreme
drought conditions. Results were therefore post-processed to better reflect allocation decisions
such as those made in 2014 and 2015, when allocations were reduced to preserve north-of-Delta
storage. If modeled end-of-September storage in Lake Shasta was below 1.1 MAF, the post-
processing analysis calculated the storage shortfall and made commensurate reductions to
delivery results. First, CVP agricultural deliveries were cut, then San Joaquin River Exchange
Contractor deliveries were cut below the Shasta Critical allocation of 77 percent. Friant-Kern
project deliveries were appropriated to make up for San Joaquin River Exchange Contractor
deliveries lower than CVP contract obligation, taking into consideration San Joaquin River
losses incurred to facilitate conveyance to Mendota Pool. Once additional delivery cuts were
established, lower Jones exports, Sacramento River flows, and Shasta releases were re-calculated
accordingly. No modifications were made based on assumptions for meeting Delta water quality
standards or other flow standards. These assumptions result in conservative estimates of water
supply delivery capability.
In Figure 1, the modeling analysis that captures the water supply purpose is represented by the
CalSim2 and Post Processing boxes. CalSim2 results for deliveries are inputs to the Post-
Processor. Results from the Post-Processor are the best possible estimate of CVP capacity to
deliver water under the current regulatory environment over a range of hydrologic conditions.
These deliveries are used as inputs to the economics models which calculate water supply
benefits.
Calculating Water Supply Purpose SPAs Five multi-purpose CVP reservoirs serve the water supply purpose – Friant, New Melones,
Trinity, Shasta, and Folsom. Friant serves direct diversions into the Madera Canal and Friant-
Kern Canal. New Melones must satisfy CVP contracts with Stockton East Water District and
Central San Joaquin Water District along with settlement obligations to Oakdale Irrigation
District and South San Joaquin Irrigation District. Trinity, Shasta, and Folsom collectively meet
the needs of CVP water users in the Sacramento and American river basins and exports at C.W.
“Bill” Jones Pumping Plant. The sizing model was used to determine the size that each facility
must be in order to satisfy the modeled deliveries determined by the CalSim2 run and post-
processing logic.
Figure 1 shows the pathway of model applications and data that calculates the SPA sizes for
water supply. CalSim2 determines deliveries and flows under current operating conditions.
CalSim2 output for delivery and flow are inputs to the Flow Tracker (see the separate section on
the Flow Tracker for detailed information) which determines SWP storage releases made to meet

4
DRAFT – for Discussion Purposes Only
Delta obligations. Inputs to the sizing model are: 1) post-processed CalSim2 delivery results; 2)
Flow Tracker results for SWP storage release to Delta outflow; and 3) input hydrology.
The sizing model is described in detail in a separate section. All SWP operations, CVP
deliveries, and non-project deliveries were fixed. Stream-groundwater interaction, weir flows,
and Delta Cross Channel gate operations were dynamic. The only flow requirement in place was
to convey the SWP storage release for Delta outflow to its intended destination. With no other
flow requirements and no operational constraints, the sizing model does not release water from
CVP storage except when this is necessary in order to meet the fixed deliveries. Iterations of the
sizing model tested successively smaller CVP reservoir storage capacities until the reduced
conservation storage was fully utilized to supply all deliveries in at least one year in the period of
record. These are the single purpose sizes of the CVP storage facilities.
Full Size (TAF) Water Supply SPA (TAF)
Trinity 2447 709
Shasta 4552 1391
Folsom 967 181
New Melones 2420 640
Friant 524 476
For a system which operates in a highly integrated manner, it was not realistic to determine SPA
sizes based on a “Shasta only” scenario or other similar perspective. SPA sizes were determined
assuming the integrated use of Trinity, Shasta, and Folsom. The ratios of active storage
capacities between north-of-Delta reservoir facilities were kept proportionally the same in
developing the sizing results. Dead pool is included in the SPA sizes.
Figure 2 shows the time series of total north-of-Delta storage for the final sizing model iteration.
In almost every year of the simulation, the system draws on stored water to satisfy delivery and
then storage re-fills to capacity. The red circle indicates the one point in the period of record
when the storage condition reached collective dead pool. This is the year with the largest
drawdown, so it defines the single purpose alternative storage. The grey circles identify multiple
other years with similar storage needs.
Figure 2 – Sequence of single purpose storage operations for water supply

5
DRAFT – for Discussion Purposes Only
Figure 3 – Multiple years have drawdown needs similar to the year which defines NOD SPA sizes
Figure 3 shows the relationship between drawdown, delivery, and inflow for these high-
drawdown years. Note that these years are neither extremely dry nor extremely wet. CVP Ag
allocations in these years vary around the 50 percent mark. It is in these somewhat drier years
where the system needs to fully utilize its storage resources to satisfy project water supply needs.
This analysis is purely theoretical, performed for the unique purpose of providing specialized
information to economics analysis for the CAS. The sizing model does not depict actual
operations. It simply allows the calculation of the storage volume needed to ensure that the
delivery time series is able to happen.
Water Quality Purpose
CVP operations to meet water quality standards under State Water Resources Control Board
(SWRCB) D-1485 are considered to be reimbursable by water and power as joint costs in the
SCRB analysis, while incremental operations to meet the stricter standards of D-1641 are
considered to be mitigation and therefore are non-reimbursable. Quantifying the differences
between CVP operations to meet D-1485 and D-1641, and determining the storage necessary to
accomplish this, were the goals of the hydrology analysis for the Central Valley Project’s Water
Quality Purpose.
Water quality responsibilities of the CVP are expressed both by salinity standards, which are met
by flow, and by flow requirements that can be surrogates for temperature or dissolved oxygen.
Under the complex combined operations of the CVP and SWP, water that is provided to meet a
water quality standard at one location can also be used to satisfy a delivery or water quality
standard at another location. It can thus be difficult to discern a specific operation for
incremental water quality.

6
DRAFT – for Discussion Purposes Only
Separate CalSim2 studies were developed to represent system operations under both D-1641 and
D-1485. A comparison of results between these scenarios shows differences in river flows, Delta
outflow, deliveries, exports and storage conditions, particularly in the Sacramento River basin.
The Delta outflow that is required to meet water quality standards in the Delta depends on export
level. In order to correctly identify the increment of SPA storage required to satisfy the D-1641
water quality standards as compared to those in D-1485, the increment had to be defined given
the same level of export and delivery. Two new CalSim2 studies were constructed that fixed
CVP and SWP project allocations to the time series of results from the Current Operations
scenario but which used D-1485 and D-1641 regulatory environments respectively to guide other
system operations. This provided a consistent delivery basis upon which to discern the difference
in storage resources required to meet the different water quality standards. These studies were
designated as “Hybrid” CalSim2 runs (H-1485 and H-1641), since they combined current
operation delivery levels with prior regulatory criteria.
Quantifying the Water Quality Purpose In Figure 4, the modeling analysis that captures the differences between the D-1641 and D-1485
environments is represented by the box labeled ‘CalSim D1485 D1641’. The differences in
deliveries between these studies reflect the water deliveries that are foregone in order to meet the
higher water quality standards of D-1641. These foregone deliveries were used as inputs to
economic benefits models to calculate the representation of economic benefit for the water
quality purpose.
Figure 4 – Hydrology modeling and analysis for the CVP water quality purpose

7
DRAFT – for Discussion Purposes Only
Calculating the Water Quality SPA Sizes Figure 4 shows that the analysis pathway for determining the SPA sizes for water quality starts
with the Hybrid CalSim2 studies. This is represented by the box labeled ‘CalSim H1485 H1641’.
The H-1485 and H-1641 scenarios resulted in identical delivery and export levels but different
flows and Delta outflow. The SPA sizes for satisfying flows and delivery were used as inputs to
the sizing model. Separate runs of the sizing model were done for each hybrid scenario, and the
differences between the SPA sizes were calculated.
The sizing model runs for the water quality purpose did not size for only flow – deliveries were
inputs to the sizing model as well. Because the input hydrology in CalSim is intrinsically tied to
land use, and thus demand, it would be problematic to develop a scenario that met only flow and
not any delivery. The sizing model runs for water quality are still devoid of any operations logic,
just as in the sizing model for water supply. The difference is that in addition to meeting
delivery, storage reserves are also needed to meet minimum flows at key locations and Delta
outflow requirements. Note that the role of the Flow Tracker in this figure is greyed out. Feather
River operations, which are still fixed, still include releases for SWP responsibilities in the Delta,
but Delta outflow is now a requirement in these sizing model runs and the SWP release helps to
serve that outflow requirement. Table 2 shows the sizing model results for the Hybrid studies and
the differences which describe the SPA’s for water quality.
New Melones does not appear in the table because the difference in SPA is negligible. New
Melones does meet water quality standards at Vernalis and dissolved oxygen standards at Ripon,
but overall differences in the combinations of criteria between D-1485 and D-1641 resulted in
the reservoir needing to be the same size under both regulatory environments. Friant does not
serve a water quality purpose.
Full Size H-1485 (D-1485 with Current Deliveries)
H-1641 (D-1641 with Current Deliveries)
Difference = SPA storage size for water quality
Trinity 2447 1793 1905 112
Shasta 4552 3361 3567 206
Folsom 967 718 757 39 Table 2 – SPA storage size results for the water quality purpose (all values in TAF)
Figure 5 shows the time series of total north-of-Delta storage operations performed to meet
delivery and flow requirements in the sizing model. Similar to the water supply analysis, the
SPA is defined by the largest drawdowns necessary to meet the combined flows and deliveries.
The red circle indicates the point at which both the H-1485 and H-1641 sizing model storage
results reached dead pool. This drawdown happened over the time span of three years leading
into one of the driest years on record.

8
DRAFT – for Discussion Purposes Only
Figure 5 – Sequence of single purpose storage operations for water quality
Figure 6 focuses on the difference between the two sizing runs, since for the water quality
purpose it is not the size of the largest drawdown in either H-1485 or H-1641 that matters, but
rather the difference in the size of the largest drawdown in each run. Note the SPA’s are much
larger than for the water supply purpose, due to the fact that the water quality sizing runs have to
meet both delivery and flow. For both the H-1485 and H-1641 runs, the SPA is determined by
the three-year period from 1975-1977. Figure 6 highlights the increment of storage capacity that
is necessary to meet D-1641 criteria over D-1485 criteria over the period of the drawdown. Both
scenarios start with full SPA reservoirs in 1975, and both end at dead pool by the end of water
year 1977. The difference in the required storage capacities is the SPA for water quality.
Figure 6 – Expanded view of the time period which defines the SPA for water quality
Sizing Facilities to Meet the Central Valley Improvement Act (CVPIA) The CAS considers the single purpose alternative storage cost of producing CVPIA instream
flow actions and of exports that are foregone due to CVPIA Delta actions. Due to the continuous
and evolving nature of CVPIA accounting methodologies, it has not been possible to include a
consistent long-term plan for CVPIA 3406(b)(2) (B2) actions in the CalSim2 model.
Consequently, daily accounting records detailing historical storage releases and export

9
DRAFT – for Discussion Purposes Only
reductions used for actions from 2008-2014 were analyzed. A separate Tech Memo provided
further details on the specific CVPIA B2 analysis process.
The designated reservoir releases to meet instream flow actions were classified as:
Releases under balanced conditions able to be recaptured for other water supply purposes –
not considered B2 use of storage
Releases under excess conditions that could not be recaptured were designated as
o Action to meet D-1641 standard that was counted as a B2 action
o Action to meet a Reasonable and Prudent Alternative (RPA) standard that was
counted as a B2 action
o Action that was performed solely to meet the CVPIA purpose
The designated export reductions were classified as:
Reductions under excess conditions, indicating that storage was not affected by the reduction
and therefore would not have been considered B2 use of storage
Reductions under balanced conditions, indicating that additional use of stored water would
have been necessary to meet the foregone export, were designated as
o Export reduction to meet a D-1641 standard that was counted as a B2 action
o Export reduction to meet an RPA standard that was counted as a B2 action
o Export reduction performed solely to meet the CVPIA purpose
These elements for historical B2 actions are shown in Figure 7:
Figure 7 – Diagram describing the classification of (b)(2) actions for CVPIA cost allocation

10
DRAFT – for Discussion Purposes Only
The required storage for B2 actions was calculated as the 2008-2014 average annual total of the
volume of releases designated to have been made for B2 actions during excess conditions and the
average annual volume of exports reduced for B2 actions during balanced conditions. This
average annual volume can be distributed among the storage facilities based on proportional B2
releases from each reservoir (instream release element) and distribution of north-of-Delta CVP
reservoir sizes (export reduction element). Figure 8 depicts the impact on CVP storage of
meeting CVPIA actions. It is recognized that the suite of actions over the years 2008-2014 reflect
different water year hydrology conditions, different environmental needs, and evolving
perspectives on B2 action management by Reclamation and the Fish and Wildlife Service.
Figure 8 – Components of the storage costs for meeting CVPIA responsibilities, 2008-2014
Flood Control Purpose The CVP storage facilities which operate for flood control are Trinity, Shasta, Folsom, New
Melones, and Friant (Millerton). All of these facilities except for Trinity include flood control in
their authorizing legislation. Trinity provides protection to downstream assets under guidelines
set by the Trinity River Mainstem Fishery Restoration Record of Decision (ROD).
Flood control rules limit the volume of water that may occupy space in a reservoir, mandating
that a certain amount of empty space be maintained in order to accommodate anticipated
seasonal runoff. Figure 9 provides a conceptual diagram. Flood control rule curves are the time-
varying values for flood control rules through the water year. Space requirements are typically
highest in the late fall and may be determined annually depending on runoff forecasts for the
reservoir catchment area. A high space requirement translates to a lower rule curve. Rule curve
values over the course of any water year also depend on operating strategies and safety
considerations for individual storage facilities. Limits are set by the U.S. Army Corps of
Engineers or local flood protection authorities. Figure 10 shows a portion of the historical flood
control rule curve for Folsom Lake, as used by the CalSim2 planning model.

11
DRAFT – for Discussion Purposes Only
The flood control rule method for determining the single purpose size of a reservoir is simply to
select the largest value for required flood space in a reservoir from the historical flood control
diagrams and add this to the dead pool space. The largest flood space is found by taking the
lowest value for the cumulative storage at which the bottom of the flood space begins from the
time series of flood control rules used in the CalSim2 planning model. This value is subtracted
from the storage capacity of the reservoir to define the maximum required flood space. This is
then added to the minimum operating storage level in the reservoir, representing the dead pool,
to calculate the single purpose alternative size for the reservoir. Table 3 provides a summary of
sizing results produced by this method, and Figure 11 shows the rule curves used by CalSim2.
Figure 9 – Flood control rule concept
Figure 10 – Flood control rule curve example
300
400
500
600
700
800
900
1000
10
/01
/19
78
04
/01
/19
79
10
/01
/19
79
04
/01
/19
80
10
/01
/19
80
04
/01
/19
81
10
/01
/19
81
04
/01
/19
82
10
/01
/19
82
04
/01
/19
83
10
/01
/19
83
04
/01
/19
84
10
/01
/19
84
04
/01
/19
85
10
/01
/19
85
04
/01
/19
86
Sto
rage
Le
vel i
n T
AF
Folsom Lake Rule Curve
Minimum Flood
Control Rule
Storage Capacity
Flood Space
Required
Minimum Storage (Dead Pool)
Single Purpose
Reservoir Size
Shasta 3250 4552 1302 550 1852
Folsom 367 967 670 90 690 New Melones 1970 2420 450 80 530
Millerton 350.5 524 173.5 135 308.5 Table 3 – Flood control rule method results - all values in TAF
Figure 11 – Flood control rule curves used for CalSim2 planning studies

12
DRAFT – for Discussion Purposes Only
The flood control rule analysis approach does not necessarily provide a pure single-purpose or
single-facility perspective, as the historical trace of required space in a reservoir may consider
normal operations such as releases for water supply deliveries, flow standards, and other criteria,
as well as the integration of that facility’s operation with other facilities in the system; however,
this approach is also not affected by outlier hydrology events that might exceed the scope of the
project intent. The rule curve method was used for the four CVP facilities that have an
authorized flood control purpose.
Trinity has a unique flood control mandate relative to the other four facilities since flood control
is not an explicitly authorized purposed but the dam instead operates to protect downstream
assets under the Trinity River Mainstem Fishery Restoration ROD. Due to the unique nature of
the flood control mandate for Trinity, a daily hydrology model analysis was used to determine
the flood control SPA for Trinity of 578 TAF.
Trinity Lake Model Historical daily data for computed inflows to Trinity Lake were available from November 1962
through the present day. Monthly input data from the CalSim2 planning model was
disaggregated to a daily average and used to represent the small local accretion between Trinity
Dam and Lewiston Dam. No export of water through Clear Creek Tunnel was assumed. Trinity
Dam is operated to avoid damages that would occur to downstream assets at flows above 11,000
cfs, so this was used as the flow threshold for initiating the flood control operation.
The daily model run for Trinity Dam starts on November 1, 1962, assuming a minimum
regulated storage rule of 240 TAF. Release capacity as a function of reservoir storage is shown
in Figure 12. Reservoir releases are limited to prevent flows above 11,000 downstream of
Lewiston Dam. Daily storage is determined as:
Previous Day Storage + Inflow – Evaporation
– min (Discharge Capacity, 11000-Trinity_Lewiston_Accretion, (Inflow-Evap+CarryoverStorage)).
Figure 12 – Trinity storage vs. discharge capacity
The maximum storage attained in Trinity Lake in the daily hydrology model investigation is
577.9 TAF, occurring in January of 1997. Other extreme inflow events in 1964, 1974, and 1983,
and 2006 result in needs for storage capacities of 564 TAF, 533 TAF, 539 TAF, and 524 TAF
respectively. A time series plot of Trinity inflow, release, and storage is shown in Figure 13a,
and an exceedance plot of the same data is shown in Figure 13b. Instances of higher reservoir

13
DRAFT – for Discussion Purposes Only
storage requirements to contain extreme inflow events are evident in the sharp spikes in the
green lines in the time series plot. The overall frequency of storage requirement for flood control
is about 11 percent. The 11,000 cfs flow threshold for preventing damages in the Trinity River
never actually controls, as discharge capacity is always below that level for the storage levels
attained in the operation.
Figure 12a – Time series of Trinity Lake operation for flood control
Figure 12b – Exceedance of Trinity Lake operation for flood control
Single Purpose Facility Sizing Model The single purpose facility sizing model is essentially CalSim2 with no operations logic. It uses
nearly the same schematic network as CalSim2, removing only the details of canal operations
below the south delta pumping plants (Delta-Mendota Canal below Jones and California
Aqueduct below Banks Pumping Plant). Inputs to the sizing model include all of the hydrology –
rim inflows, local inflows, and Depletion Service Area (DSA) accretion/depletion terms. Stream-
groundwater interactions are dynamic, as are weir spills. Delta Cross Channel gates are closed if
the flow at Hood exceeds 25,000 cfs, but otherwise there are no rules about closures.
All sizing model runs fix all SWP operations using pre-set time series. This includes Feather
River operations such as Oroville and Thermolito release and evaporation, all deliveries, channel
flows, and stream groundwater interaction. Inflows from the Yuba River and Bear River systems,
SWP deliveries to the North Bay Aqueduct, and exports at Banks Pumping Plant are fixed. The
outcome of this locked operation is a pre-determined set of flows entering the Sacramento River
from the Feather River – flows which, depending on the time step, reflect some combination of
controlled release for delivery or Delta outflow and uncontrolled flow which may be available
for CVP purposes. Flows that were the result of a specific action to enable delivery are delivered
at the North Bay Aqueduct or Banks. Flows that were the result of a specific action to meet a
Delta standard under a Coordinated Operations Agreement (COA) sharing relationship are
14
DRAFT – for Discussion Purposes Only
identified by the Flow Tracker and set as a requirement for Delta outflow so that CVP deliveries
do not have access to this flow resource.
All sizing model runs fix all CVP deliveries and associated groundwater pumping and return
flow. Non-project deliveries are also fixed.
The list below summarizes the preceding discussion of sizing model inputs and assumptions:
CalSim2 schematic network (minus DMC below Jones and CAA below Banks)
CalSim2 hydrology
o rim inflows,
o local inflows,
o local accretions,
o DSA accretions/depletions,
o local loss assumptions
Dynamic stream-groundwater interactions
Weir spills determined by flow/spill relationships
Delta Cross Channel Gates closed if flow at Hood exceeds 25,000 CFS
Fixed SWP operations (Feather River, North Bay Aqueduct, Banks Pumping Plant)
Fixed non-project deliveries (Delta consumptive use, all other non-project deliveries)
Fixed CVP delivery operations
o surface diversion
o groundwater pumping
o return flow
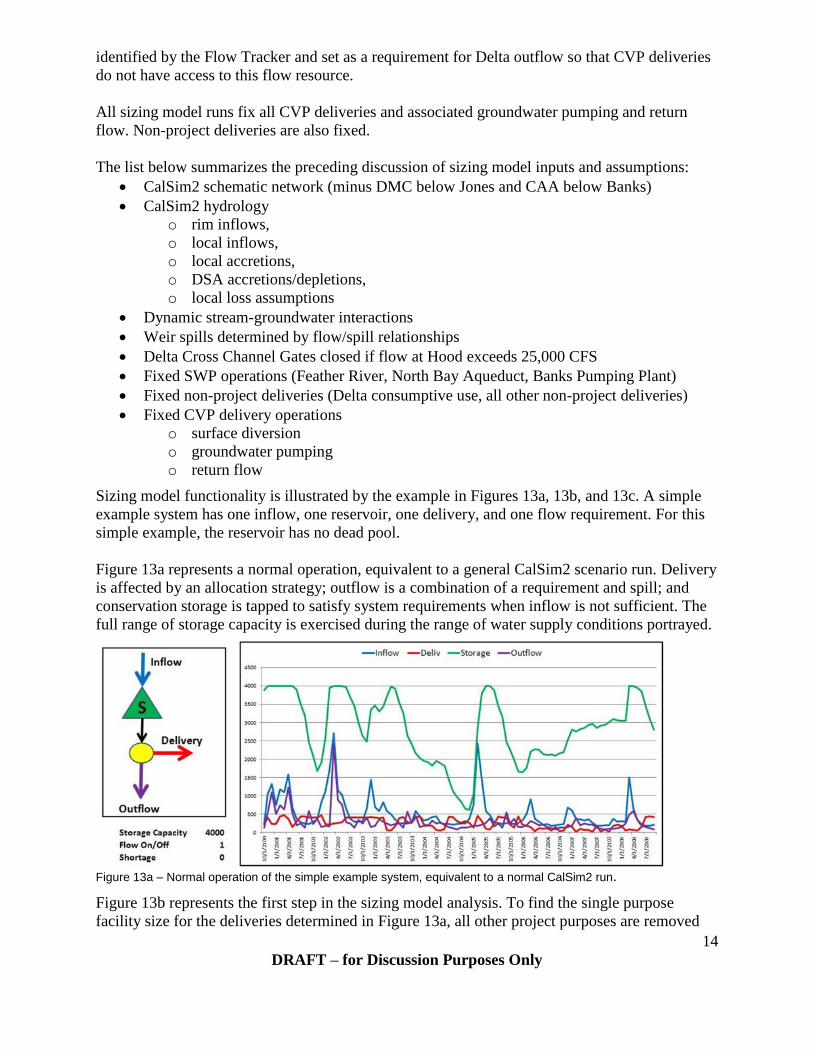
Sizing model functionality is illustrated by the example in Figures 13a, 13b, and 13c. A simple
example system has one inflow, one reservoir, one delivery, and one flow requirement. For this
simple example, the reservoir has no dead pool.
Figure 13a represents a normal operation, equivalent to a general CalSim2 scenario run. Delivery
is affected by an allocation strategy; outflow is a combination of a requirement and spill; and
conservation storage is tapped to satisfy system requirements when inflow is not sufficient. The
full range of storage capacity is exercised during the range of water supply conditions portrayed.
Figure 13a – Normal operation of the simple example system, equivalent to a normal CalSim2 run.
Figure 13b represents the first step in the sizing model analysis. To find the single purpose
facility size for the deliveries determined in Figure 13a, all other project purposes are removed

15
DRAFT – for Discussion Purposes Only
from required operations – in this case the required outflow is no longer imposed. As long as
inflows can meet delivery, storage stays full, and inflow that is not needed for delivery and
cannot be stored goes to outflow as spill. Once the inflow is not sufficient to meet delivery
needs, releases are made from storage to satisfy the delivery. Under these conditions, outflow is
zero because there is no requirement to meet a flow standard – it is a single purpose water supply
operation. Figure 13b shows a modest need for reservoir storage to meet the deliveries – much of
the storage capacity is not used, so clearly a smaller size reservoir would do.
Figure 13b – Removal of operations unrelated to single purpose in question in simple example system
Figure 13c shows the final step of the sizing model analysis. The reservoir size has been dropped
from 4000 to 697, which is just large enough to always be able to satisfy the delivery capabilities
determined under the normal operation in Figure 13a. During the period of record of this
example study, there is one point, indicated by the black circle, when the reservoir storage is
completely used up. This is what defines the single purpose alternative storage for this simple
example system. In a real reservoir with non-zero dead pool, storage would be reduced so that
the largest depletion reached the top of dead pool.
Figure 13c – Sizing model applied to simple example system, identifying minimum required storage
The Flow Tracker The Flow Tracker was created to identify SWP releases of stored water from Oroville that were
specifically to meet Delta requirements for water quality or outflow. As discussed previously,
the sizing model was developed to fix SWP operations on the Feather River, deliveries to North

16
DRAFT – for Discussion Purposes Only
Bay Aqueduct, and Banks exports. Any SWP release for its own water supply would be taken as
SWP delivery, and other water from the Feather River would be available to the fixed CVP
deliveries in the lower Sacramento River or at Jones. But if an SWP storage release was made
specifically to meet a Delta standard, the sizing model would need to know this so it could avoid
making this water available to meet the CVP water supply purpose. Without considering this, the
CVP water supply SPA would be underestimated.
Seven types of flows were identified and tracked:
CVP release of water that passes through a reservoir without being stored
CVP release of previously stored water
SWP release of water that passes through a reservoir without being stored
SWP release of previously stored water
Non-Project flow – accretions or other local inflow that has not passed through a reservoir
Groundwater – seepage to stream channels from groundwater
Return flow – flow in any channel that is the result of return flow from delivery operations
The Flow Tracker, like the sizing model, uses the same network schematic as CalSim2. It takes
as input the merged inputs and outputs of a CalSim2 run. The Flow Tracker determines what
flow types are for each channel and delivery arc in the system by following just two principles:
One, that every channel or diversion arc is the sum of its flow types, and two, that mass balance
of each flow type at each node must be maintained. Storage nodes need specific logic, depending
on their characteristics, to assign flow types to evaporation, delivery, and release.
The user determines the disposition of flow types throughout the system through weights
assigned to each flow type for each diversion. This enables the tool to be used for a wide variety
of purposes in CVP/SWP system analysis. For this application, the ultimate goal of the analysis
was to determine the SWP release for Delta standards, but there were additional sensible
considerations as well. Non-project deliveries and weir flows would be expected to be satisfied
without stored water releases, for example. A matrix of flow types and delivery types was
constructed, with each flow type having a progression of weights for the delivery types that it
could be serve.
Non-project inflow, groundwater, and return flow were given the highest weights so these types
of flow would be used first. The idea was to use it as high up in the system as possible – even by
project delivery – while at the same time reserving what was necessary to meet non-project
demands system-wide. Pass-through inflow was encouraged to be used first by non-project uses
and then by project deliveries, considering the source of the release. For example, CVP release of
pass-through inflow (CVPI) would have a higher weight for a CVP delivery than for SWP
export. Diversions of stored water releases were weighted lower than all other flow types.
Penalties were imposed for use of another project’s stored water release. No weights were
imposed on flow types for Delta outflow. The outcome of this weighting scheme was that the
only time that stored water release would go to Delta outflow was if all other water types had
been used already by deliveries and exports, and the release was actually necessary to meet a
Delta requirement. This was the information needed for the sizing model.