Embed Size (px)
Citation preview
Central Valley Project Operations:
Background and Legislation
Charles V. Stern
Specialist in Natural Resources Policy
Pervaze A. Sheikh
Specialist in Natural Resources Policy
April 26, 2017
Congressional Research Service
7-5700
www.crs.gov
R44456
Central Valley Project Operations: Background and Legislation
Congressional Research Service
Summary After five years of drought, rain and snowstorms in Northern and Central California in the winter
of 2016-2017 significantly improved water supply conditions in the state in 2017. According to
the U.S. Drought Monitor, as of late April 2017, less than 1% of the state was in severe drought
conditions. This represents an improvement from one year prior to that date, when 73% of the
state was in severe drought conditions, and two years prior, when 92% fell under this designation.
Stress on water supplies due to drought resulted in cutbacks in water deliveries to districts
receiving water from federal and state facilities, in particular the federal Central Valley Project
(CVP, operated by the Bureau of Reclamation) and the State Water Project (SWP, operated by the
State of California). In 2015, California mandated a 25% reduction in water use for
nonagricultural water users, and overall SWP deliveries were limited to 20% of contractor
requests. Some of these restrictions have since been relaxed.
Reclamation estimated its initial water allocations for CVP contractors for the 2017 water year in
a series of announcements in February, March, and April 2017. For the first time in years, initial
water allocations for most CVP water contractors were 100%. Contractors south of the
Sacramento and San Joaquin Rivers’ Delta (Bay Delta) initially received lower allocations in
March 2017 (65% for agricultural contractors and 90% for municipal and industrial contractors,
respectively), but Reclamation subsequently revised these allocations upward to 100% in April.
The allocations represented a drastic change from recent years, in which no supplies were made
available to many of these contractors, who farm some of the most valuable irrigated agricultural
land in the country.
Most expect that the historically wet conditions of 2016-2017 will not continue in future years
and that future water years will continue to see deliveries limited to some extent. Previous
cutbacks to CVP deliveries (in particular during periods of increased precipitation) have caused
some to criticize Reclamation’s management of the CVP and question the extent to which factors
beyond limited water supplies (e.g., restrictions to protect endangered species and water quality)
influence water management and the quantity of water delivered to contractors. They argue that
congressionally directed changes in the operation of the CVP that would result in increases to
water allocations are needed. Other stakeholders argue that some of these changes could undercut
environmental regulations, harm fish and wildlife, and potentially lower water quality. They also
worry that legislative proposals that would alter the implementation of the Endangered Species
Act could harm species in the region and set a precedent that could be used to affect other listed
species in the future.
Legislation enacted in the 114th Congress (Subtitle J of S. 612, the Water Infrastructure
Improvements for the Nation [WIIN] Act) incorporated provisions from multiple California
drought-related bills that had been considered dating to the 112th Congress. Among other things,
these provisions directed pumping to “maximize” water supplies for the CVP (in accordance with
applicable biological opinions), allowed for increased pumping during certain high water events,
and authorized expedited reviews of water transfers.
Similar to recent congresses, the 115th Congress is considering legislation that proposes additional
changes to CVP operations. H.R. 23, the Gaining Responsibility on Water Act (GROW Act)
incorporates a number of provisions that were included in previous legislation but were not in the
final version of the WIIN Act. Congress may consider this and similar legislation, as well as
oversight of CVP operations and implementation of WIIN Act CVP provisions.
This report provides an abbreviated background on the CVP and SWP. It also provides a
summary of recent hydrologic conditions in California and their effect on water deliveries.
Central Valley Project Operations: Background and Legislation
Congressional Research Service
Contents
Introduction ..................................................................................................................................... 1
Hydrologic Status ............................................................................................................................ 4
Federal and State Water Project Deliveries ..................................................................................... 5
Central Valley Project Contractor Background ......................................................................... 5 2017 Allocations........................................................................................................................ 7 State Water Project Allocations ................................................................................................. 9 What Is at Stake? ..................................................................................................................... 10 Regulatory Factors .................................................................................................................. 10
Congressional Interest .................................................................................................................... 11
WIIN Act ................................................................................................................................. 12 Legislation in the 115
th Congress ............................................................................................ 12
Figures
Figure 1. Central Valley Project and Related Facilities ................................................................... 3
Figure 2. Water Storage Levels at California’s Five Largest Reservoirs ......................................... 5
Figure 3. Central Valley Project (CVP) Maximum Contract Amounts ........................................... 7
Tables
Table 1. Estimated Water Allocations for CVP Contractors, 2012-2017 ......................................... 8
Table 2. California State Water Project (SWP) Allocations ............................................................ 9
Contacts
Author Contact Information .......................................................................................................... 13
Central Valley Project Operations: Background and Legislation
Congressional Research Service 1
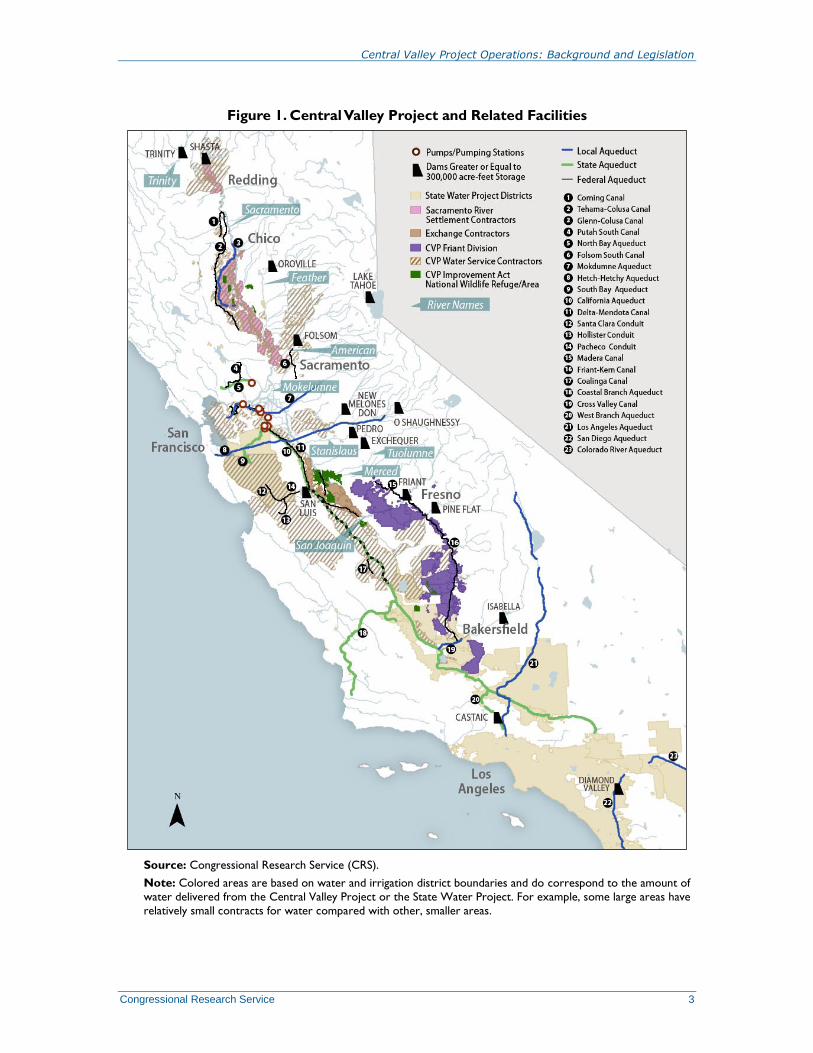
Introduction The Bureau of Reclamation (Reclamation), part of the Department of the Interior, operates the
multipurpose federal Central Valley Project (CVP) in California, one of the nation’s largest water
conveyance systems (see Figure 1). The CVP extends from the Cascade Range in Northern
California to the Kern River in Southern California. In an average year, it delivers approximately
5 million acre-feet of water to farms (including some of the nation’s most valuable farmland),
600,000 acre-feet to municipal and industrial (M&I) users, 410,000 acre-feet to wildlife refuges,
and 800,000 acre-feet for other fish and wildlife needs, among other purposes. The project is
made up of 20 dams and reservoirs, 11 power plants, and 500 miles of canals, as well as conduits,
tunnels, and other storage and distribution facilities.1 A separate major project operated by the
state of California, the State Water Project (SWP), delivers about 70% of its water to urban users
(including water for approximately 25 million users in the South Bay [San Francisco Bay],
Central Valley, and Southern California); the remaining 30% is used for irrigation. Two federal
and state pumping facilities in the southern portion of the Sacramento and San Joaquin Rivers
Delta (Delta) near Tracy, CA, are a hub for water deliveries from both systems. The confluence of
the Sacramento and San Joaquin Rivers and the San Francisco Bay is often referred to as the Bay-
Delta.
After five years of drought, rain and snowstorms in Northern and Central California in the winter
of 2016-2017 improved water supply conditions in the state in 2017.2 According to the U.S.
Drought Monitor, as of April 18, 2017, less than 1% of the state was in severe drought conditions.
This represents a drastic improvement from one year ago, when 73% of the state was in severe
drought conditions, and two years ago, when 92% fell under this designation.
The stress on water supplies due to the drought resulted in cutbacks in water deliveries to
contractors receiving water from the CVP and SWP. In 2015, California Governor Jerry Brown
mandated the first-ever 25% statewide reduction in water use for nonagricultural users.3 On May
18, 2016, California’s State Water Resources Control Board (SWRCB) adopted a new regulation
that replaces the prior percentage reduction-based water conservation standard with a localized
“stress test” approach, which remains in effect.4 On April 7, 2017, the governor lifted the
statewide drought emergency, but maintained a number of prior executive actions aimed at saving
water.5
1 Bureau of Reclamation, “About the Central Valley Project,” at http://www.usbr.gov/mp/cvp/about-cvp.html. 2 The previous four years have been classified by the Sacramento and San Joaquin River indexes as below normal
(2012), dry (2013), and critically dry (2014 and 2015). In 2016, the Sacramento River Index was classified as below
normal, whereas the San Joaquin Index was classified as dry. 3 Although not mandated by the governor, some agricultural water contractors with senior water rights voluntarily
reduced their water usage by 25%, as well. See California Water Boards, “State Water Board Approves Voluntary
Cutback Program for Delta Riparian Water Rights,” press release, May 22, 2015, at http://www.swrcb.ca.gov/
press_room/press_releases/2015/pr052215_riparian_proposal.pdf. 4 The standards require local water agencies to ensure a three-year supply assuming three more dry years like those the
state experienced from 2012 to 2015. Agencies that would face shortages under these scenarios must meet a
conservation standard equal to the amount of shortage. For more information, see California Water Boards, “36 Month
Urban Water Supply Now Basis for Local Emergency Water Conservation Efforts,” updated May 18, 2016, at
http://www.waterboards.ca.gov/water_issues/programs/conservation_portal/docs/factsheet/
fs051816_mediaemergreg.pdf. 5 Executive Department, State of California, Executive Order B-40-17, April 7, 2017, at https://www.gov.ca.gov/docs/
4.7.17_Exec_Order_B-40-17.pdf.
Central Valley Project Operations: Background and Legislation
Congressional Research Service 2
After several consecutive years of cutbacks, in a series of announcements in spring 2017,
Reclamation provided its estimated water allocations for CVP contractors in water year 2017
(October 2016 through September 2017).6 For the first time in years, water allocations for most
CVP water contractors were 100%. Although some contractors south of the Sacramento and San
Joaquin Rivers’ Delta (Bay Delta) received a lower allocation in the initial March 2017
announcement (65% for agricultural contractors and 90% for municipal and industrial
contractors, respectively), Reclamation subsequently revised these allocations upward to 100% in
April.
6 The contract year for most Central Valley Project (CVP) contractors runs from March 1 to February 28; however, the
water year runs from October 1 to September 30.
Central Valley Project Operations: Background and Legislation
Congressional Research Service 3
Figure 1. Central Valley Project and Related Facilities
Source: Congressional Research Service (CRS).
Note: Colored areas are based on water and irrigation district boundaries and do correspond to the amount of
water delivered from the Central Valley Project or the State Water Project. For example, some large areas have
relatively small contracts for water compared with other, smaller areas.
Central Valley Project Operations: Background and Legislation
Congressional Research Service 4
Legislation enacted in the 114th Congress (Subtitle J of S. 612, the Water Infrastructure
Improvements for the Nation ([WIIN] Act) incorporated provisions from multiple California
drought-related bills that had been considered dating to the 112th Congress. These provisions
directed pumping to “maximize” water supplies for the CVP (in accordance with applicable
biological opinions), allowed for increased pumping during certain high water events, and
authorized expedited reviews of water transfers.7 It is unclear the extent to which these provisions
were used prior to 2017 allocations.
The 115th Congress is considering legislation that proposes additional changes to CVP operations.
H.R. 23, the Gaining Responsibility on Water Act (GROW Act), incorporates a number of
provisions that were included in legislation during the 112th-114
th Congresses, including those that
were proposed in the 114th Congress but were not included in the final version of the WIIN Act.
The current Congress may consider these and other related changes, as well as oversight of CVP
operations and implementation of WIIN Act CVP provisions.
This report provides high-level summary information on recent hydrologic conditions in
California and their impact on state and federal water management, with a focus on deliveries
related to the federal CVP. It also summarizes some of the issues pertaining to CVP operations
that are being debated in the 115th Congress.
Hydrologic Status As of April 18, 2017, less than 1% of California was in severe drought, as defined by the U.S.
drought monitor.8 This amount represents a dramatic improvement from this time one year ago,
when 73% of the state was subject to severe drought conditions, and two years ago, when 92%
fell under this designation. The improvement was in large part due to heavy rain and snowfall in
the winter of 2016-2017. As of March 2017, rainfall and snow-water content was 221% of
average for the current water year.9 The April 1 snow-water equivalent is another important
measure of California’s water supplies. As of that date in 2017, statewide snow-water equivalent
was approximately 164% of the historical average.10
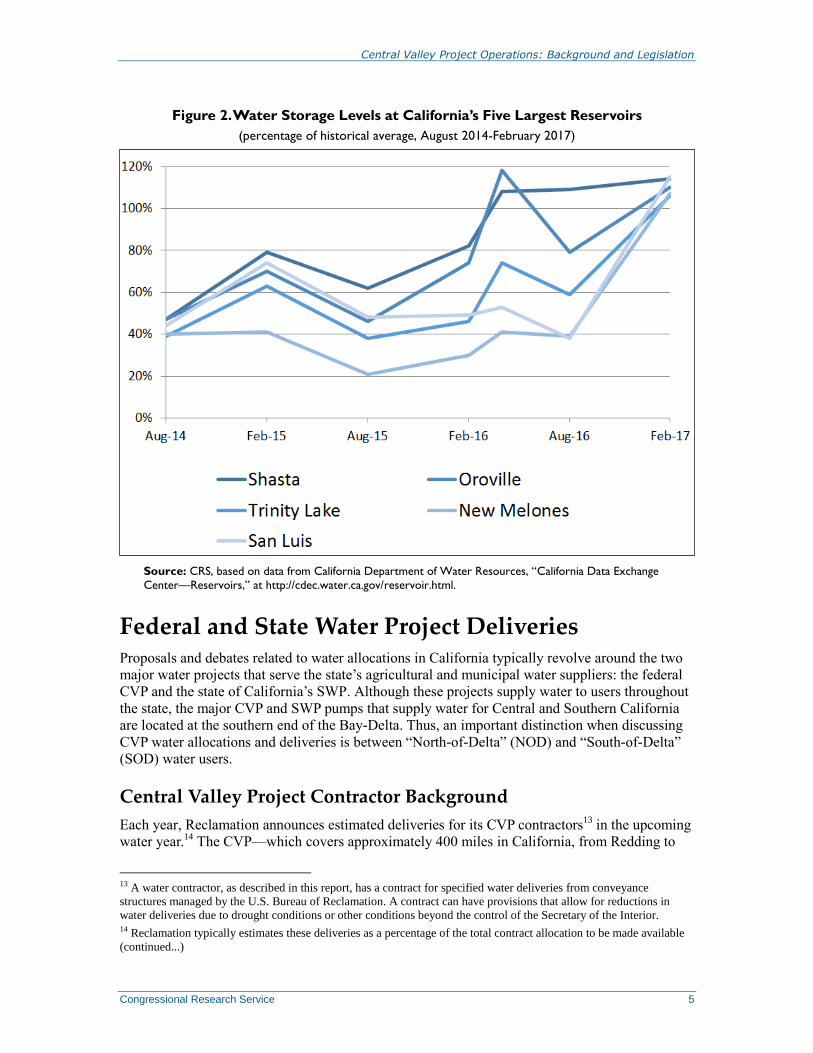
As a result of increased precipitation, water levels at several of California’s largest reservoirs also
continued to rebound in 2017 relative to prior years (see Figure 2). In March 2017, all five of
California’s largest reservoirs were at more than 100% of their historical average and 73%-99%
of their total capacity at this time.11
For the reservoirs specifically serving the CVP (i.e., Shasta,
Trinity, Folsom, New Melones, Millerton Lake, and the federal half of San Luis12
), water year
2017 began with a total of 4.9 million acre-feet in storage but by mid-March this amount had
almost doubled, with more than 9 million acre-feet in storage.
7 For more information, see CRS In Focus IF10536, Water Infrastructure Improvements for the Nation Act (WIIN), by
Nicole T. Carter et al. 8 U.S. Drought Monitor, March 21, 2017, at http://droughtmonitor.unl.edu/data/pdf/20170321/20170321_usdm.pdf. 9 California Data Exchange Center, Hydrologic Conditions as of March 31, 2017, at http://cdec.water.ca.gov/cgi-progs/
reports/EXECSUM. 10 In normal years, the snowpack provides for approximately 30% of California’s water needs. Water from snowpack
typically melts in the spring and early summer, thus addressing water needs for the state in the late summer and fall. 11 California Data Exchange Center, Reservoir Conditions as of March 22, 2017, at http://cdec.water.ca.gov/cgi-progs/
products/rescond.pdf. 12 Federal CVP storage in San Luis is approximately half (966,000 acre-feet) of the reservoir’s total storage.
Central Valley Project Operations: Background and Legislation
Congressional Research Service 5
Figure 2. Water Storage Levels at California’s Five Largest Reservoirs
(percentage of historical average, August 2014-February 2017)
Source: CRS, based on data from California Department of Water Resources, “California Data Exchange
Center—Reservoirs,” at http://cdec.water.ca.gov/reservoir.html.
Federal and State Water Project Deliveries Proposals and debates related to water allocations in California typically revolve around the two
major water projects that serve the state’s agricultural and municipal water suppliers: the federal
CVP and the state of California’s SWP. Although these projects supply water to users throughout
the state, the major CVP and SWP pumps that supply water for Central and Southern California
are located at the southern end of the Bay-Delta. Thus, an important distinction when discussing
CVP water allocations and deliveries is between “North-of-Delta” (NOD) and “South-of-Delta”
(SOD) water users.
Central Valley Project Contractor Background
Each year, Reclamation announces estimated deliveries for its CVP contractors13
in the upcoming
water year.14
The CVP—which covers approximately 400 miles in California, from Redding to
13 A water contractor, as described in this report, has a contract for specified water deliveries from conveyance
structures managed by the U.S. Bureau of Reclamation. A contract can have provisions that allow for reductions in
water deliveries due to drought conditions or other conditions beyond the control of the Secretary of the Interior. 14 Reclamation typically estimates these deliveries as a percentage of the total contract allocation to be made available
(continued...)
Central Valley Project Operations: Background and Legislation
Congressional Research Service 6
Bakersfield—supplies water to hundreds of thousands of acres of irrigated agriculture throughout
the state, including some of the most valuable cropland in the country. It also supplies water
supplies to some wildlife refuges and municipal and industrial (M&I) water users.
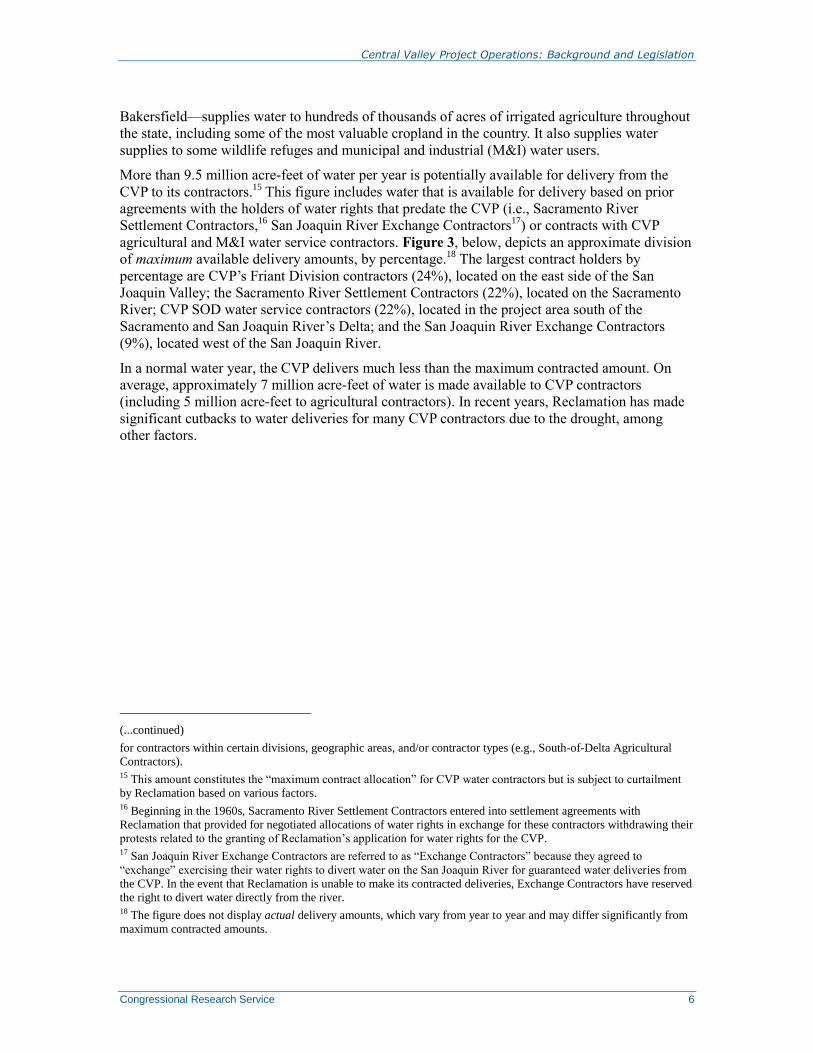
More than 9.5 million acre-feet of water per year is potentially available for delivery from the
CVP to its contractors.15
This figure includes water that is available for delivery based on prior
agreements with the holders of water rights that predate the CVP (i.e., Sacramento River
Settlement Contractors,16
San Joaquin River Exchange Contractors17
) or contracts with CVP
agricultural and M&I water service contractors. Figure 3, below, depicts an approximate division
of maximum available delivery amounts, by percentage.18
The largest contract holders by
percentage are CVP’s Friant Division contractors (24%), located on the east side of the San
Joaquin Valley; the Sacramento River Settlement Contractors (22%), located on the Sacramento
River; CVP SOD water service contractors (22%), located in the project area south of the
Sacramento and San Joaquin River’s Delta; and the San Joaquin River Exchange Contractors
(9%), located west of the San Joaquin River.
In a normal water year, the CVP delivers much less than the maximum contracted amount. On
average, approximately 7 million acre-feet of water is made available to CVP contractors
(including 5 million acre-feet to agricultural contractors). In recent years, Reclamation has made
significant cutbacks to water deliveries for many CVP contractors due to the drought, among
other factors.
(...continued)
for contractors within certain divisions, geographic areas, and/or contractor types (e.g., South-of-Delta Agricultural
Contractors). 15 This amount constitutes the “maximum contract allocation” for CVP water contractors but is subject to curtailment
by Reclamation based on various factors. 16 Beginning in the 1960s, Sacramento River Settlement Contractors entered into settlement agreements with
Reclamation that provided for negotiated allocations of water rights in exchange for these contractors withdrawing their
protests related to the granting of Reclamation’s application for water rights for the CVP. 17 San Joaquin River Exchange Contractors are referred to as “Exchange Contractors” because they agreed to
“exchange” exercising their water rights to divert water on the San Joaquin River for guaranteed water deliveries from
the CVP. In the event that Reclamation is unable to make its contracted deliveries, Exchange Contractors have reserved
the right to divert water directly from the river. 18 The figure does not display actual delivery amounts, which vary from year to year and may differ significantly from
maximum contracted amounts.
Central Valley Project Operations: Background and Legislation
Congressional Research Service 7
Figure 3. Central Valley Project (CVP) Maximum Contract Amounts
(relative share of total maximum contracted CVP supplies)
Source: CRS, using Bureau of Reclamation Data.
Notes: Figure 3 depicts relative percentages of total supplies under a scenario in which maximum contract or
agreement amounts are provided to all contractors. SOD = South-of-Delta; M&I = municipal and industrial water
service contractors. Sacramento River Settlement Contractors includes both “base” water rights supplies
(18.6%) and additional CVP “project” supplies (3.5%). Eastside Water Rights include Oakdale Irrigation District
and South San Joaquin Irrigation District, which receive water based upon a 1988 Agreement. For SOD Refuges,
chart does not reflect “Level 4” supplies, which allows for the acquisition of water from willing sellers, subject to
availability and funding.
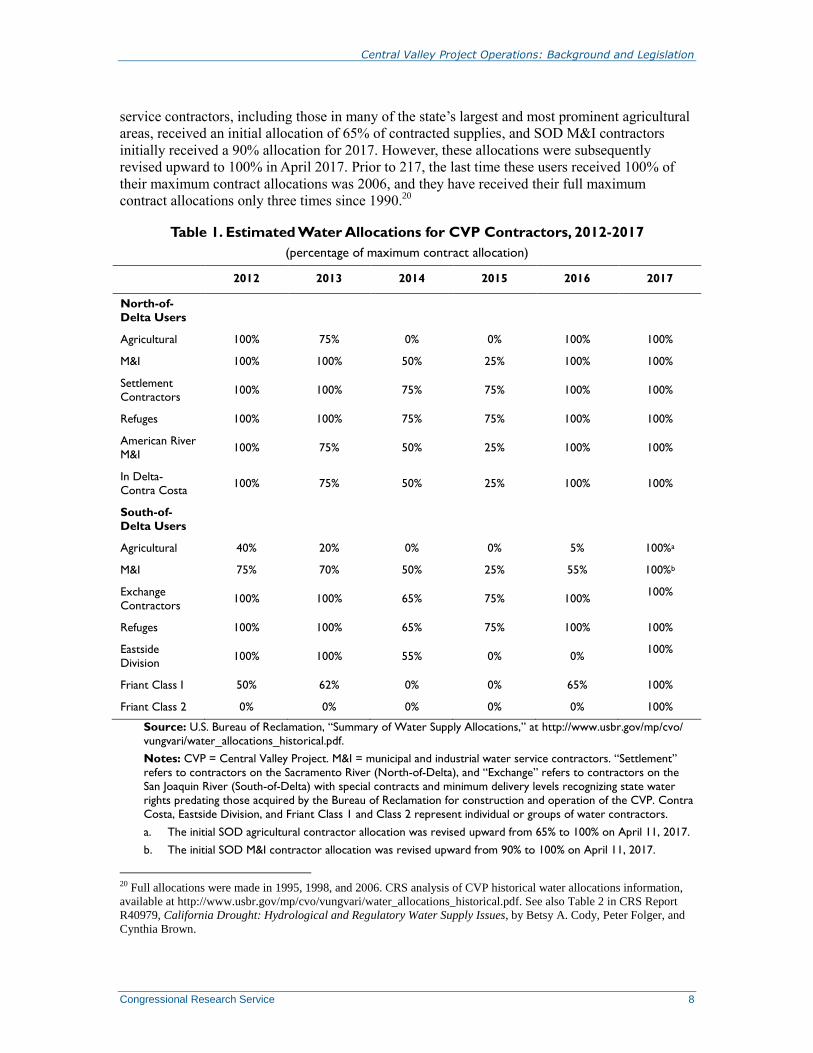
2017 Allocations
In a series of announcements in February, March, and April 2017, Reclamation provided its initial
allocations for the 2017 water year (see Table 1, below). Reclamation announced that for 2017, it
expected that a total of 8.8 million acre-feet of supplies would be available. In contrast to recent
years, Reclamation estimated that it would be able to provide 100% of CVP water supplies for
most water rights contractors with senior water rights predating the project, including Sacramento
River Settlement Contractors and San Joaquin River Exchange Contractors. NOD CVP
agricultural and M&I water service contractors also were expected to receive their full contract
allotments in 2017, as were Friant Division contractors.19
Most CVP SOD agricultural water
19 Senior water rights holders are those known as the Sacramento River Settlement Contractors north of the Bay-Delta
and the Exchange Contractors south of the Bay-Delta. Senior water rights holders have a combined first priority to
approximately 3.0 million acre-feet of CVP water.
Central Valley Project Operations: Background and Legislation
Congressional Research Service 8
service contractors, including those in many of the state’s largest and most prominent agricultural
areas, received an initial allocation of 65% of contracted supplies, and SOD M&I contractors
initially received a 90% allocation for 2017. However, these allocations were subsequently
revised upward to 100% in April 2017. Prior to 217, the last time these users received 100% of
their maximum contract allocations was 2006, and they have received their full maximum
contract allocations only three times since 1990.20
Table 1. Estimated Water Allocations for CVP Contractors, 2012-2017
(percentage of maximum contract allocation)
2012 2013 2014 2015 2016 2017
North-of-
Delta Users
Agricultural 100% 75% 0% 0% 100% 100%
M&I 100% 100% 50% 25% 100% 100%
Settlement
Contractors 100% 100% 75% 75% 100% 100%
Refuges 100% 100% 75% 75% 100% 100%
American River
M&I 100% 75% 50% 25% 100% 100%
In Delta-
Contra Costa 100% 75% 50% 25% 100% 100%
South-of-
Delta Users
Agricultural 40% 20% 0% 0% 5% 100%a
M&I 75% 70% 50% 25% 55% 100%b
Exchange
Contractors 100% 100% 65% 75% 100%
100%
Refuges 100% 100% 65% 75% 100% 100%
Eastside
Division 100% 100% 55% 0% 0%
100%
Friant Class I 50% 62% 0% 0% 65% 100%
Friant Class 2 0% 0% 0% 0% 0% 100%
Source: U.S. Bureau of Reclamation, “Summary of Water Supply Allocations,” at http://www.usbr.gov/mp/cvo/
vungvari/water_allocations_historical.pdf.
Notes: CVP = Central Valley Project. M&I = municipal and industrial water service contractors. “Settlement”
refers to contractors on the Sacramento River (North-of-Delta), and “Exchange” refers to contractors on the
San Joaquin River (South-of-Delta) with special contracts and minimum delivery levels recognizing state water
rights predating those acquired by the Bureau of Reclamation for construction and operation of the CVP. Contra
Costa, Eastside Division, and Friant Class 1 and Class 2 represent individual or groups of water contractors.
a. The initial SOD agricultural contractor allocation was revised upward from 65% to 100% on April 11, 2017.
b. The initial SOD M&I contractor allocation was revised upward from 90% to 100% on April 11, 2017.
20 Full allocations were made in 1995, 1998, and 2006. CRS analysis of CVP historical water allocations information,
available at http://www.usbr.gov/mp/cvo/vungvari/water_allocations_historical.pdf. See also Table 2 in CRS Report
R40979, California Drought: Hydrological and Regulatory Water Supply Issues, by Betsy A. Cody, Peter Folger, and
Cynthia Brown.
Central Valley Project Operations: Background and Legislation
Congressional Research Service 9
Reclamation previously had noted that its lower initial allocation for SOD agricultural water
service contractors was largely a result of two factors: (1) a conservative estimate of water
supplies expected to be added to the system for the remainder of the year (thus, if the remainder
of the year is not abnormally dry, the initial allocation might increase) and (2) limits to available
water supplies in the federal half of San Luis Reservoir (an important provider of SOD water
storage) due to rescheduled and carryover water from 2016.21
Reclamation noted that for 2017,
environmental restrictions (e.g., Endangered Species Act and state water quality requirements)
were expected to account for a relatively small share of cutbacks relative to prior years.22
To
minimize future limitations on storage and allocations associated with the second item above,
Reclamation stated that it plans to limit the availability of water to be carried over to the 2018
contract year to a maximum of 150,000 acre-feet.23
In increasing its 2017 allocation for SOD
contractors up to 100%, Reclamation noted that the carryover limit of 150,000 would remain in
place.
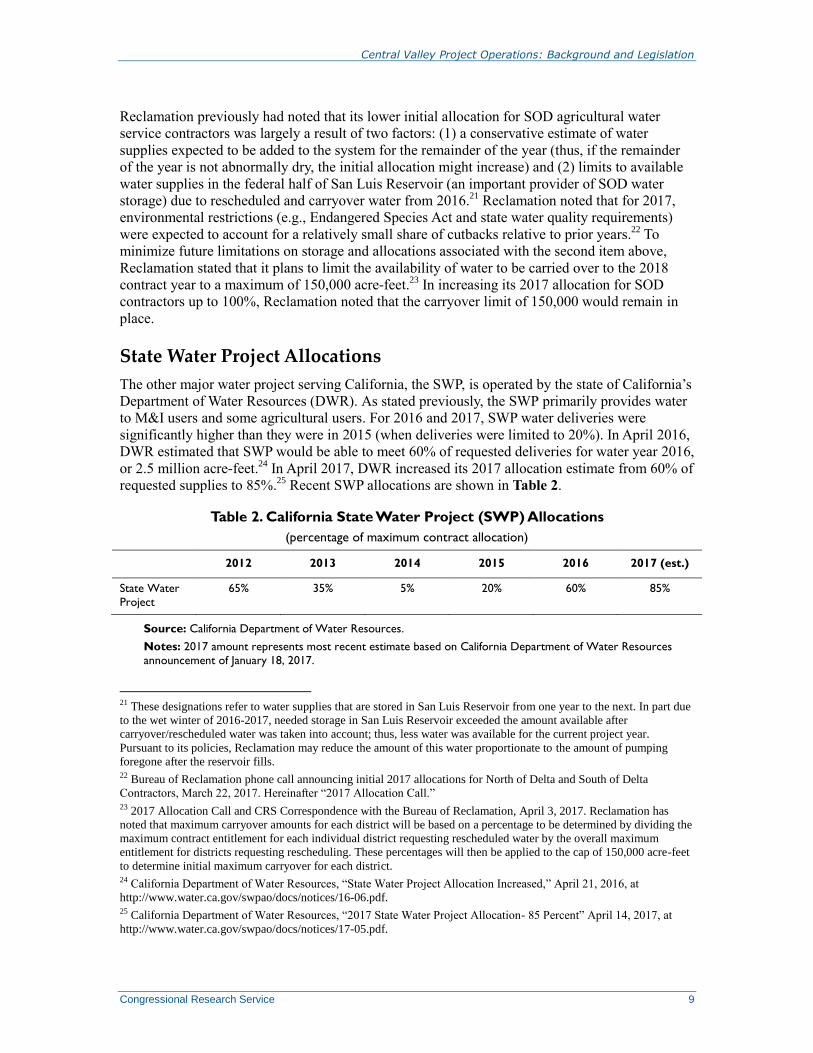
State Water Project Allocations
The other major water project serving California, the SWP, is operated by the state of California’s
Department of Water Resources (DWR). As stated previously, the SWP primarily provides water
to M&I users and some agricultural users. For 2016 and 2017, SWP water deliveries were
significantly higher than they were in 2015 (when deliveries were limited to 20%). In April 2016,
DWR estimated that SWP would be able to meet 60% of requested deliveries for water year 2016,
or 2.5 million acre-feet.24
In April 2017, DWR increased its 2017 allocation estimate from 60% of
requested supplies to 85%.25
Recent SWP allocations are shown in Table 2.
Table 2. California State Water Project (SWP) Allocations
(percentage of maximum contract allocation)
2012 2013 2014 2015 2016 2017 (est.)
State Water
Project
65% 35% 5% 20% 60% 85%
Source: California Department of Water Resources.
Notes: 2017 amount represents most recent estimate based on California Department of Water Resources
announcement of January 18, 2017.
21 These designations refer to water supplies that are stored in San Luis Reservoir from one year to the next. In part due
to the wet winter of 2016-2017, needed storage in San Luis Reservoir exceeded the amount available after
carryover/rescheduled water was taken into account; thus, less water was available for the current project year.
Pursuant to its policies, Reclamation may reduce the amount of this water proportionate to the amount of pumping
foregone after the reservoir fills. 22 Bureau of Reclamation phone call announcing initial 2017 allocations for North of Delta and South of Delta
Contractors, March 22, 2017. Hereinafter “2017 Allocation Call.” 23 2017 Allocation Call and CRS Correspondence with the Bureau of Reclamation, April 3, 2017. Reclamation has
noted that maximum carryover amounts for each district will be based on a percentage to be determined by dividing the
maximum contract entitlement for each individual district requesting rescheduled water by the overall maximum
entitlement for districts requesting rescheduling. These percentages will then be applied to the cap of 150,000 acre-feet
to determine initial maximum carryover for each district. 24 California Department of Water Resources, “State Water Project Allocation Increased,” April 21, 2016, at
http://www.water.ca.gov/swpao/docs/notices/16-06.pdf. 25 California Department of Water Resources, “2017 State Water Project Allocation- 85 Percent” April 14, 2017, at
http://www.water.ca.gov/swpao/docs/notices/17-05.pdf.
Central Valley Project Operations: Background and Legislation
Congressional Research Service 10
What Is at Stake?
Widespread drought conditions over the previous five years—coupled with low water supplies in
the state’s major reservoirs and regulatory restrictions on CVP and SWP operations—affected
sectors and areas throughout California. In 2015 and 2016, total statewide farm receipts declined
sharply; cities and counties were required to institute major cutbacks and even water rationing in
some cases. Many plant and animal populations declined, and a number of major wildfires
occurred throughout the state. Some of these effects may linger for years. Thus, considerable
attention is likely to be paid to CVP and SWP allocations in 2017 and beyond.
Although agriculture constitutes a much smaller percentage of California’s economy now than it
did in the early and mid-20th century, California agriculture is still the nation’s largest producer in
terms of cash farm receipts—accounting for 12.5% of the U.S. total in 2015, the last year for
which national data are available. According to the U.S. Department of Agriculture/National
Agricultural Statistics Service Crop Year Report, California farm and ranch receipts totaled $47
billion in 2015, down from $57 billion and $55 billion in 2014 and 2013, respectively.26
Although
some agricultural users with access to groundwater or other supplies may have seen receipts grow
despite the drought, others had to fallow land or uproot trees and shrubs. Some livestock
producers had to purchase supplemental hay and grain. Fruit and nut orchards largely rely on
irrigation to keep trees alive, and hundreds of thousands of acres were fallowed because sufficient
water was not available.27
In addition to agriculture, water flows are also critical for hydropower, recreation, and fish and
wildlife. For example, cool temperatures are needed in waterways and lakes to maintain aquatic
ecosystems and species viability. Some salmon runs experienced a 95% loss of eggs laid in 2015
due to warm water temperatures, and surveys of Delta smelt in June 2016 found 13 adult smelt,
the lowest catch in the history of the survey (the total population is estimated at 13,000—a record
low.28
Although recent rains and projected runoff may improve conditions for salmon and smelt,
poor ocean conditions in 2015 and 2016 will affect adult returns for coho and Chinook salmon;
thus, 2017 returns remain uncertain. In addition to fisheries, recreational reservoirs, river-rafting
opportunities, and recreational and commercial fisheries are all potentially at risk during a
drought. California wetlands, which might adversely be affected by drought, also provide Pacific
Flyway habitat, which is critical to migrating birds. Thus, some observers pay close attention to
the allocations not only for irrigators but also to wildlife refuges and species.
Regulatory Factors
Complicating the hydrologic situation and water supply allocations is a complex web of state and
federal regulatory requirements on CVP and SWP operations. These requirements affect how
much water is delivered from the projects. They address releases of water from reservoirs and
limits on pumping from the Bay-Delta to protect habitat, threatened and endangered species (e.g.,
salmon and Delta smelt), and water quality.
26 See U.S. Department of Agriculture, Economic Research Service, “State Fact Sheets,” at http://www.ers.usda.gov/
data-products/state-fact-sheets.aspx. 27 One study has reported that the 2015 drought resulted in an estimated 550,000 acres fallowed. See Richard Howitt et
al., Economic Analysis of the 2015 Drought for California Agriculture, UC Davis Center for Watershed Sciences,
August 17, 2015. 28 Drought is one of several factors that could affect fish populations. Other factors include low prey abundance,
toxicity, and non-native fish populations.
Central Valley Project Operations: Background and Legislation
Congressional Research Service 11
In many years, pumping restrictions to protect state-set water quality levels, particularly increases
in salinity levels, are greater than restrictions to protect endangered species.29
In contrast, in wet
years, pumping restrictions due to regulations under the federal Endangered Species Act (ESA; 16
U.S.C. §§1531 et seq.) may have a higher impact on exports than water quality restrictions, and
they may have proportionally higher impacts in certain months. There is disagreement over how
much water might be available absent state and federal restrictions. Reclamation estimated that
ESA restrictions accounted for a reduction of 62,000 acre-feet from the long-term average for
CVP deliveries in 2014, while water quality restrictions accounted for another 176,300 acre-feet
of this reduction. For 2015, Reclamation estimated that ESA accounted for approximately
144,800 acre-feet of CVP delivery reductions from the long-term average, but did not have a
comparable estimate for water quality restrictions.30
For its part, DWR estimated that ESA
restrictions resulted in a reduction of 47,000 acre-feet to SWP deliveries in water year 2014, and a
reduction of 92,000 acre-feet in water year 2015. Comparable figures were not available for water
quality restrictions.31
Ongoing cutbacks to CVP contractor allocations during times of increased water supplies have
caused continuing criticism of Reclamation’s operation of the CVP. As previously noted,
Reclamation argued that its 2017 allocations for SOD users were largely the result of rescheduled
and carryover storage in San Luis Reservoir requested by service contractors and contained
minimal restrictions associated with environmental regulations. However, some users have noted
that they would not need to be so reliant on carryover and rescheduled water in San Luis
Reservoir if there were more certainty of additional water supplies during drought years.32
In recent years, debates have focused on the extent to which factors other than drought (e.g.,
endangered species and water quality requirements) have led to curtailments. To address these
concerns and provide more water to agricultural and municipal contractors, some have proposed,
among other approaches, that Congress amend Reclamation’s directives in operating the CVP,
including directing altered implementation of regulatory requirements under ESA that may
restrict pumping operations (some of these proposals were enacted in the WIIN Act, see “WIIN
Act,” below). Others, however, are opposed to modifying the implementation of ESA regulations
and propose water conservation, water recycling, and increased storage, among other strategies,
to provide more water for users and avoid possible extinction of certain species.
Congressional Interest Congress plays a role in CVP water management and has previously attempted to make available
additional water supplies in the region by facilitating water banking, water transfers, and new
storage. In recent years, Congress has enacted drought-related provisions aiming to benefit the
CVP and the SWP, including extending authorization for the Reclamation States Emergency
Drought Relief Act (P.L. 102-250), providing authority to incorporate water storage into dam
safety projects (P.L. 114-113), and providing additional funding to Reclamation for western
29 Through the Porter-Cologne Act (a state law), California implements federal Clean Water Act requirements and
authorizes the State Water Resources Control Board (SWRCB) to adopt water quality control plans, or basin plans (see
Cal. Water Code §13160). The SWRCB oversees the allocation of water resources to various entities, has regulatory
authority to protect water quality, and addresses flow requirements for fish. 30 Personal communication with the Bureau of Reclamation, February 25, 2016. 31 Personal communication with the California Department of Water Resources, March 30, 2016. 32 “Todd Fitchette, “USBR: Large Carryover Storage the Reason Why CVP Allocation Was Not Higher,” Western
Farm Press, March 23, 2017.
Central Valley Project Operations: Background and Legislation
Congressional Research Service 12
drought response in FY2015 ($50 million) and FY2016 ($100 million) Energy and Water
Development appropriations bills, and most recently, Subtitle J of the WIIN Act (P.L. 114-322; S.
612).
WIIN Act
Legislation enacted at the end of the 114th Congress (the WIIN Act, enacted December 16, 2016)
incorporated provisions from multiple California drought-related bills that had been under
consideration. Among other things, these provisions directed agency officials to pump at the
highest levels allowable under existing biological opinions, for longer periods. The WIIN Act also
authorized higher levels of pumping than currently allowed during certain temporary storm
events, unless managers showed that the increased levels would harm the long-term health of the
listed species.33
These and other changes had been proposed in legislation dating to the 112th
Congress. However, other provisions from those previous bills were not included in the WIIN
Act.
During consideration of the bill, supporters of CVP operational changes contended that they
could potentially make available additional water to users facing curtailed deliveries, while also
improving the flexibility and responsiveness of the management and operations of the CVP and
SWP.34
Opponents worried that the changes may have detrimental effects on species’ survival in
both the short and long terms and may limit agency efforts to manage water supplies for the
benefit of species.35
Some of the notable CVP operational provisions in the WIIN Act aimed to
provide the Administration with authority to make available more water supplies during periods
in which pumping otherwise would have been limited. According to Reclamation, changes in the
WIIN Act that directed increased communication and transparency in certain operational
decisions influenced some decisions in the early part of winter 2016-2017 and led to the
avoidance of certain pumping restrictions. However, Reclamation also has stated that many of the
act’s other authorities seem most applicable to drought years, when sensitivity to reverse flows in
the delta is particularly acute and the need to preserve and maximize the use of available water
supplies often is at its highest.36
Thus, it appears that for the relatively wet water year of 2017, the
changes had a minimal effect on water allocations.
Legislation in the 115th Congress
Similar to recent congresses, the 115th Congress is expected to consider new legislation that
proposes additional changes to CVP operations. H.R. 23, the Gaining Responsibility on Water Act
(GROW Act) incorporates a number of provisions that were included in previous legislation in
the 112th, 113
th, and 114
th Congresses but were not enacted in the final version of the WIIN Act.
Congress may consider this and similar legislation, as well as oversight of CVP operations and
implementation of WIIN Act CVP provisions.
33 Pursuant to Section 4013 of the WIIN Act, most of the CVP operational provisions would expire in December 2021. 34 U.S. Congress, Senate Committee on Energy and Natural Resources, Statement of Dan Keppen, Executive Director,
Family Farm Alliance, 114th Cong., 1st sess., October 8, 2015, p. 4, at http://www.energy.senate.gov/public/index.cfm/
hearings-and-business-meetings?Id=65220e15-0479-492e-8423-ca1a381c1078&Statement_id=378db42f-6b60-44a7-
a16c-3d2b7d712984. 35 U.S. Congress, Senate Committee on Energy and Natural Resources, Statement of Michael L. Connor, Deputy
Secretary, U.S. Department of the Interior, 114th Cong., 1st sess., October 8, 2015, p. 1, at
http://www.energy.senate.gov/public/index.cfm/files/serve?File_id=fb299e7d-7de8-41c8-b8a2-365d544c8911. 36 Personal communication with the Bureau of Reclamation, April 18, 2017.
Central Valley Project Operations: Background and Legislation
Congressional Research Service 13
Author Contact Information
Charles V. Stern
Specialist in Natural Resources Policy
[email protected], 7-7786
Pervaze A. Sheikh
Specialist in Natural Resources Policy
[email protected], 7-6070