Embed Size (px)
Citation preview

CENTRE FOR ECONOMIC HISTORY THE AUSTRALIAN NATIONAL UNIVERSITY DISCUSSION PAPER SERIES
THE AUSTRALIAN NATIONAL UNIVERSITY ACTON ACT 0200 AUSTRALIA T 61 2 6125 3590 F 61 2 6125 5124 E [email protected] http://rse.anu.edu.au/CEH
A NATION WITHOUT A CORPORATE INCOME TAX: EVIDENCE FROM NINETEENTH CENTURY JAPAN
KAZUKI ONJI OSAKA UNIVERSITY
JOHN P. TANG
AUSTRALIAN NATIONAL UNIVERSITY,
DISCUSSION PAPER NO. 2015-10
MAY 2015

A nation without a corporate income tax:Evidence from nineteenth century Japan
Kazuki Onji and John P. Tang ∗
May 2015
Abstract
This study provides evidence on tax distortion to organizationalchoices of firm using historical data. We utilize the 1887 introductionof a personal income tax (PIT) in Japan as a quasi-experiment to ex-amine tax-motivated incorporation. We circumvent the data limitationin the 19th century by drawing on a firm-level dataset constructed fromgenealogies of Japanese corporations. The sample is 3,203 firm-yearobservations spanning 1880-1892. We find that the introduction of PITaffected the adoption of simpler types of corporations and increased thecorporate share of establishments by about 3 percentage points. Theevidence indicates the role of a corporate income tax as a backstop tomaintain revenue performance of PIT.
JEL Classification: G34, H25, K34Keywords: Tax Avoidance, Organizational Form, Business Incorpora-tion
∗Onji (corresponding author): Graduate School of Economics, Osaka University, 1 - 7Machikaneyamacho, Toyonaka, Osaka, Japan, 560-0043. Email: [email protected]; Tang: Research School of Economics, Australian National University, Building 26,Canberra, Australia, ACT0200. Email: [email protected]
1

Introduction
Firms’ choices over their organizational forms have tax consequences: whether
a firm chooses to incorporate is such an ubiquitous issue for businesses that
it is a staple topic in finance textbooks (Hanlon and Heitzman, 2010). To
policymakers and academics, the extent to which taxes affect incorporation
decisions is an important consideration: tax-motivated incorporations can re-
duce government revenue by compromising the revenue performance of a per-
sonal income tax (PIT).1 In understanding a tax system as a set of interacting
tax laws, the organizational choice is a knot that ties PIT and a corporate
income tax (CIT), and is essential in evaluating and predicting impacts of
tax policies (Cullen and Gordon, 2007).2 Earlier empirical studies (Gordon
and MacKie-Mason, 1994; Mackie-Mason and Gordon, 1997; Goolsbee, 1998)
find small influences of taxes on organizational forms, indicating the possible
dominance of non-tax factors: the limited liability status and external finance
considerations can dominate the decision to incorporate, while administrative
simplicity and fewer disclosure requirements may lead others to choose the sole
proprietorship structure. However, later studies (Goolsbee, 2004; de Mooij
and Nicodme, 2008; Liu, 2014) raise concerns over the identification strategy
in earlier studies based on time series analysis of aggregate corporate share,
and instead employ panel data to take advantage of cross-section variation in
tax rates across states or countries. These later studies show that the influence
1de Mooij and Nicodme (2008) show that a shift from the personal to corporate taxbase contributed to the stability of revenue from corporate income taxes despite the taxcompetition that drove average tax rates down in Europe.
2Cullen and Gordon (2007) demonstrate that the progressivity of PIT may discourageentrepreneurship but in fact can encourage startups by sharing risk with the government.
2

of taxes may in fact be larger than previously thought, re-opening the debate
on the magnitude of tax effects.
One alternative strategy, which provides clearer identification, is to utilize
the introduction of PIT as a quasi-experiment. Absent PIT or CIT, the choice
of organizational form should be determined by non-tax factors only. The
introduction of PIT changes incentives, offering a sharp quasi-experimental
setting to examine behavioral responses. The tax incentive is salient, which
Chetty (2012) stresses to be a characteristic important in decision making.
Although a simple idea, this strategy is difficult to implement: industrialized
nations started to introduce PIT during the 19th century when official statis-
tics on corporations, let alone sole proprietors, are limited or non-existent.3
Our paper circumvents this data limitation by drawing on a new approach
in economic history that allows analysis of business activities during a period
when official data do not exist. Using firm-level data from genealogies of ma-
jor corporations compiled by Yagura and Ikushima (1986), Tang (2011, 2013)
examines the Japanese economy during the Meiji period (1868-1912). These
data allow us to distinguish joint-stock corporations from sole proprietors as
well as other corporate forms, and to look at the response of taxpayers to
the introduction of PIT in 1887. The sample of firms drawn from genealo-
gies is a non-random subset of the population of businesses that existed at
the time, and larger firms are over-represented. As such, the sample based
3Grossfeld and Bryce (1983) provide a historical account on the origins of income taxesin the U.K., Germany, and U.S. The earliest attempt was by the U.K. under the Pittadministration in 1799, introduced as a war tax. After an abolishment in 1816 upon theconclusion of the Napoleonic War, the Peel administration re-introduced an income tax in1842. The U.S. first introduced in 1862 also as a war tax and repealed it in 1872. The 1894Income Tax Act was found unconstitutional and did not went into effect.
3

on genealogies likely leads to an underestimation, since the findings in the lit-
erature show smaller businesses tend to respond more strongly. Nonetheless,
the sample represents an important subset of firms, including those belong-
ing to Japanese-equivalent of Rockefeller and Carnegie conglomerates, and the
behavior of large companies is of independent interests.
This study employs a quasi-experimental framework in examining 3,203
firm-year observations spanning 1880-1892. We utilize the time variation in
tax incentives created by the introduction of PIT and control for the macroeco-
nomic environment and industry-specific trends. The baseline analysis treats
the data as a cross-section and tests whether the probability of a firm taking
a corporate form changes discretely following the PIT introduction. We im-
plement a battery of robustness checks to assess the sensitivity of estimates.
First, to control for unobserved heterogeneity, we reformulate the data into a
panel dataset by aggregating firm-year observations by firm genealogy and in-
dustry. Second, we consider the dynamic dependence using the panel dataset
on industries to provide estimates of dynamic panel regressions. Third, the
identification of tax effects relies on the before-after change, which could be
confounded by unobservable time shocks. We chiefly address this issue by
including a set of macroeconomic variables to control for changes in business
conditions, but also consider alternative explanations.
The results suggest that the introduction of the PIT had significant influ-
ence on the incorporation decision. An estimate from the baseline specification
implies that PIT increased the incorporation rate in the sample by around 3.2
percentage points with a 95-percent confidence interval of [1.2, 5.3]. In terms
4

of marginal effects, with the top PIT rate of 3 percent, our estimate suggests
that a 1-percentage-point increase in a PIT rate increases corporate share of
firms by around 1 percentage point.4
Previous studies recognized large tax variations in the early 20th century
U.S. and utilized them in analysis (Goolsbee, 1998; Liu, 2014; Romer and
Romer, 2014). Our study extends the historical studies on the tax distortion
to organizational forms in several ways. We examine a period not covered
in the previous studies, enabled by the new genealogy-based data collection
pioneered by Tang (2011, 2013).5 We also provide additional estimates on
the taxpayer response from a setting outside the U.S. For example, Goolsbee
(1998) examines aggregate U.S. data over 1900-1939, which span the federal
CIT introduction in 1909 and the re-introduction of PIT in 1913 after a consti-
tutional amendment, so the order of tax changes is opposite to ours. He finds
statistically significant but negligible impacts. Liu (2014) examines a state
panel dataset drawn from U.S. census data in the years 1909, 1914 and 1919,
and finds a 1-percentage-point increase in PIT leads to a 5.5-percentage-point
increase in corporate share. As emphasized in previous studies, modern day
tax administration is much more sophisticated. That said, historical evidence
provides an important complement to scholarship that utilizes contemporary
tax laws. Moreover, the introduction of an income tax, whether personal or
corporate, is an epochal event in any country’s history of public finance and
4To be sure, this estimate is not of a structural parameter but is a reduced-form estimate,so that factors such as economic institutions in the 1880s Japan, sample characteristics, anda possible non-linearity of responses in tax rates should be kept in mind in extrapolationand in comparison with existing estimates.
5Takahashi (1956) provides an early descriptive study on this topic, utilizing aggregatedata from the Meiji period.
5
therefore warrants careful statistical documentation.6
The remainder of this paper is organized as follows. Section 1 provides the
institutional background. Since this paper is the first application of genealogi-
cal data in examining a topic in public economics, in Section 2, we elaborate on
how drawing a sample from genealogies of present-day major firms affects the
sample’s characteristics and consider precautions needed to identify the tax
effects. Section 3 presents an empirical analysis including robustness check,
and Section 4 concludes.
1 Institutional background
1.1 Early income tax
The Meiji Japanese government replaced the feudal administration in 1867
and pushed for industrialization to catch up with advanced nations. Initially,
the new government relied on a land tax to finance the modernization of the
military and industries.7 Against the backdrop of rising political demand to
fund the navy and to raise taxes from industrialists, the introduction of a PIT
was considered, at least since 1884 (Hayashi, 1965, p. 299). The Ministry
6Our study also adds to evidence provided by specific policy changes. Scholes and Wolf-son (1991) document an explosion of tax-favored S-corporations following the Tax ReformAct of 1986. Freedman and Crawford (2010) document a rise in incorporation when theU.K. set the starting rate of CIT at 0 percent over 2002-2006, particularly for businesseswith fewer than 10 employees.
7The tax base for the land tax was assessed land values that remained constant regardlessof crop yield. The land tax was therefore penalizing during the severe deflationary period inthe early 1880s, particularly for peasants. The tax policy debate at the time raised inequalityas a motivation for a tax reform. Tariffs, which governments of developing economies usuallyrely on to raise revenue, were negligible since Japan had signed treaties with advancednations that restricted tariff rates.
6

of Finance drafted and sent an income tax proposal to the Prime Minister’s
Cabinet in January 1887. On February 1887, the proposal was sent to the Sen-
ate (Genroin) with some modifications, and the following month, the Income
Tax Law (Shotoku Zeiho) was passed with implementation starting July 1887.
Table 1 provides a summary of the main features of the early PIT, along with
a reform in 1899. Initially, tax rates ranged from 1 to 3 percent with a large
exemption of 300 yen. The rate was simple progressive, unlike the current
PIT, so that taxpayers faced a notch of 3 yen at 300 yen in income.8 In the
initial year, the total number of income tax filers amounted to 0.3 percent
of total Japanese population. As a comparison, the rates for U.S. personal
tax in 1913 ranged from 1 to 7 percent and the personal exemption of 3,000
dollars. The total number of tax filers amounted to 0.5 percent of the total
U.S. population.
Dividend income was taxable but otherwise corporate income escaped tax-
ation. We consider local tax consequences later in this section. The main
argument for excluding corporate income was the protection of the nascent
industrial sector. At senate meetings, policymakers showed clear awareness of
tax avoidance opportunities through incorporation, but opinions differed as to
whether loopholes would be exploited.9 Businessmen at the time would have
understood the tax advantages to incorporation.10 The 1899 reform added cor-
8This amount was three times as much as a starting salary of a police officer and wasUS$228 based on the average exchange rate in 1887 (Toyo Keizai Shinposha, 1975, Table156).
9At a senate meeting held on February 22, 1887, a member of a council argued thatnoblemen were typically owners of businesses and as such noblemen would not conduct pettytax avoidance. Another councilman forcefully pointed that it is unfair to treat businesses runby one person versus multiple people differentially (Orii and Yamamoto, 1990, pp. 77-78).
10Letters written by a manager in Mitui zaibatsu from the early 20th century clearly show
7

porate income as an additional category (Type 1) in the Income Tax Law and
levied 2.5 percent tax on accounting incomes, which were far from standardized
at the time. Dividend income became exempt to avoid double taxation.
The enforcement and administration of the early PIT was different from
modern income taxes administered by tax specialists; the central government
delegated the responsibility of assessment and collection to the county-level
administration. A county-level tax commission, in charge of assessment, con-
sisted of personnel elected in a local election, and served in part as a mod-
erator between the administration and taxpayers. Since the suffrage at the
local election depended on the amount of tax payments, committee members
were local personages and often overlapped with elected officers in local as-
semblies.11 The tax committee checked tax returns submitted by taxpayers
and also conducted investigation, assisted by the county administration. The
early assessment appears idiosyncratic; it is not until around 1893 that the
administration started to ‘predict’ income on the basis of observable features
and compared them with declared figures.12 The National Tax Agency gradu-
ally took over responsibilities: The government established regional tax offices
which took charge of tax collection in 1896, and the local offices assessed cor-
porate income (but not personal income) from 1899. The enforcement regime
would have varied considerably given the new administrative apparatus: The
tax considerations were of first order importance in incorporating Zaibatsu companies. See,for example, Nakamura (2010).
11The Rules and Regulations for Prefectural Assemblies (Fukenkai Kisoku) of 1878 re-stricted the voting right on local election to male who pays at or more than 5 yen in landtax. The first national election was in 1890.
12A record from a county in a sericulture district shows a committee based assessment onobservables such as land price, local business tax, wage, amount of loan extended (Orii andYamamoto, 1990, pp. 334–335).
8
number of personal tax payers increased by 75 percent in one year over 1898-
99 despite the same personal exemption amount.13 Given those weaknesses in
administration, firms might have found it easier to substituted tax avoidance
with tax evasion. Whether firms respond to tax incentives by incorporating
businesses is, however, an empirical question.
1.2 “Corporation” in the Meiji era
What did it mean to be a corporation in Japan during the Meiji period?14
The previous Edo period (1603-1867) had a flourishing commercial economy.
By the beginning of the Meiji era, a well developed customary law enabled
merchants to issue promissory notes. The archetype of modern corporations
existed but most joint ventures were family-oriented (Miyamoto, 1990). To
promote industrialization, the Meiji government published textbooks on in-
corporation, coordinated merchants to form trading companies in 1869, and
organized national banks as joint-stock corporations. Absent formal regula-
tion in most sectors, the various prefectural governments based administrative
orders about incorporation on the incorporation textbooks published by the
central government. However, most sectors were not regulated, so many as-
pects, such as investor liability and voting rights of shareholders, were not well
understood. For firms not in banking and key industries, incorporation often
amounted to notifying a local authority.15
13(Toyo Keizai Shinposha, 1975, Table 730)14Miyamoto (1990) and Nakamura (2010).15For example, in Tokyo Prefecture, firms notified a county office after incorporation, ex-
cluding those in bridge and embarkment constructors, land/water transportation, insuranceand banking (Nakamura, 2010).
9

While regulation at the national level was absent, prefectural governments
stepped up regulation since the mid-1880s. Osaka prefecture, for example,
required new as well as existing corporations to submit corporate charters,
starting from February 1886. Fraud, in which a swindler collected funds from
investors and fled, was common. The urgent need for order led to a drafting of
the Commercial Code (Shoho), but complaints delayed implementation until
1899, except for sections including corporate laws that were promulgated in
January 1893.
The Commercial Code of 1893 defined three types of corporation, and
outlined requirements for organizing a corporation (Yoshida, 1998). First,
investors in joint-stock corporations (kabushiki gaisha) enjoyed limited liabil-
ities, but needed to obtain approval on articles of incorporation and also a li-
cence to establish. Debtors to joint-stock corporations could request disclosure
of balance sheets. Limited partnerships (goshi gaisha) consisted of investors
with partners with limited and unlimited liabilities while partnerships (gomei
gaisha) consisted of partners with unlimited liability. Requirements for found-
ing the latter two types were fewer; a company needed to register but not a
licence to establish. Responsibilities however became more stringent with the
1893 reform: an unlimited partnership was liable to cover losses within 2 years
a partner’s departure, for example. In sum, except for the regulated sectors,
‘corporation’ was loosely defined until 1893, when the partial implementation
of the Commercial Code in 1893 finally established a proper guideline.
10
1.3 Local tax
Were there other taxes that might have discouraged, or encouraged, incorpo-
ration? At the beginning of Meiji, the local administrations inherited taxes
and levies from the Edo period and local taxes varied considerably. Concerns
about uneven tax practices, and the sheer number of various levies, led the
central government to coordinate prefecture-level taxes by standardizing reg-
ulation. One of the main rules, set in 1878, concerned those on the Business
Operations Tax (Eigyo zei), which was a tax based on external characteristics,
such as sales, and levied mainly on merchants at its initial application. This
1878 rule on the Business Operations Tax set an upper limit on the annual
levy by business category. For example, the maximum annual levy for a com-
pany (kaisha) and wholesalers was 15 yen while that for retailers was 5 yen
(Hayashi, 1965). In an application in Saitama prefecture, the amount of tax
was a step function of sales revenue. A company in that prefecture was defined
as a business with a shopfront financed by two or more people that operated
in commerce, manufacturing, transport, printing, contract work, and money
lending (Mizumoto, 1998, p. 42). Thus, except for wholesalers and retailers
who were taxed regardless, incorporation triggered a tax liability and there-
fore was disadvantageous. An amendment in 1880, however, abolished this
categorization and set a uniform maximum tax at 15 yen, and made manufac-
turing plants liable for taxation regardless of organizational form. Further, the
1882 amendment abolished the distinction between commerce and manufac-
turing and sole proprietorship and corporation, respectively. By 1887, the tax
disincentives for incorporation under the Business Operations Tax had been
11

removed.16
2 Data
2.1 Source
The main data source is the collection of corporate genealogies edited by
Yagura and Ikushima (1986), who traced lineages of 1,089 corporations that
were traded at the first tier of the Tokyo Stock Exchange in 1984. In construct-
ing genealogies, these business historians drew from “autobiographical” ac-
counts of corporate histories published by the corporations themselves. These
corporate “family trees” provide information such as a date of establishment,
ownership type, industry classification, and geographical location, but do not
contain financial information. Like a genealogy of an individual family, a
corporate genealogy traces corporate combinations and separations in form of
mergers and division sales. As Tang (2011) emphasizes, the entries are not just
those whose ultimate descendent survived and prospered. The autobiograph-
ical accounts of each corporation’s history provide a record of asset transfers
from bankrupt firms in addition to firms that were taken over in mergers.
Transfers of assets, such as factories or new equipment, were notable events
16As a part of local government reforms, the central government permitted municipal andtownship/village administrations to levy surcharges on national taxes up to 50 percent ofincome tax liability since April 1889. This reform on local government finance was a partof a broader administrative restructuring law passed in 1888. Corporations escaped thissurcharge as they were exempt from income taxation (Maruyama, 1985). For a localitythat adopted a 50 percent surcharge, the national-local combined statutory top tax rateswas 4.5 percent, providing an additional incentives for businesses residing in the locality toincorporate.
12
given their worth. The genealogies therefore include defunct firms whose an-
cestries are also tracked. Since most reorganizations took place within an
industry, firms listed on a given genealogy typically are in the same indus-
try.17 The genealogies record name changes, including those due to changes in
organizational forms. Types of organizational form include sole proprietorship
(kojin kigyo), joint-stock corporation (kabushiki gaisha), limited partnership
(goshi gaisha), partnership (gomei gaisha), limited liability company (yugen
gaisha), mutual company (sougo gaisha), anonymous partnership (tokumei
kumiai), and government corporation (seifu kigyo).
The key advantage of the genealogical data is in providing firm-level ob-
servations, gathered under a systematic scheme, on organizational form for a
period when aggregate data by organizational forms do not exist; aggregated
data on types of corporation are available only from 1894, after the partial im-
plementation of the Commercial Code. The genealogical data provide a good
indicator of the overall movements in the economy: the Pearson’s correlation
coefficient for the number of non-bank corporations in the genealogies and the
estimated number of non-bank corporations for the economy over 1899-1912 is
0.97 and is statistically significant at the 1 percent level.18 Moreover, the cor-
17We computed the Herfindahl-Hirschman Index (HHI) from the count of industry clas-sification within genealogies using unbalanced panel of firms. HHI is a common measureof concentration, and takes values between 0 and 1. HHI of 1 implies that all firms in agenealogy belongs to a same industry. The average HHI is above 0.9 whether we use allavailable sample (1870-1912), restrict to the sample period (1880-1892), or drop genealogieswith fewer than the median number of firms (11) during the sample period. The averageHHI is 0.67 among the top 10 percentile of genealogies in terms of firm count during thesample period, so larger genealogies tend to be more diverse but are still concentrated.
18We obtained the number of Type 1 income taxpayers for 1899-1912 to approximate thenumber of corporations in the population. We then subtracted banks to obtain the numberof non-bank corporations (Japanese Bankers Association, 2012). For the genealogies, wedropped banks, sole proprietors and anonymous partnerships from the original sample to
13

relation coefficient for the number of all firms with real GDP over 1875-1912
is 0.93 and is statistically significant at the 1 percent level.19
It should be noted that the sample of firms from genealogies is a non-
random subset of the population of businesses that existed at the time. As
such, the data have unique characteristics that become important when draw-
ing inference. As t approaches 1984, the number of firms approaches 1,089
by construction. The share of corporations becomes 100 percent mechani-
cally. We would be reluctant to draw inference from a sample close to the
time when the historians constructed the genealogies, out of concern for this
mechanical selection. The current sample is however from a century before
the construction of the genealogies and mechanical selection should not be an
issue; mechanical selection should lead to a decline in the number of firms, but
we see an increase in firm numbers over the Meiji period.
Another important characteristics is that genealogies are observed only for
firms successful enough not only to become public corporations but also be
listed at the first tier, which has tighter listing requirements and receive more
investor attention. Reflecting this selection, the data include major zaibatsu
from the Meiji period such as Mitsui, Sumitomo, and Mitsubishi. Genealogical
data do not contain financial information, but qualitative information suggests
that the sample contains large companies from the period.20 Indeed, the incor-
poration rate gauged from tax statistics from 1899 is 1.3 percent, while that
obtain the number of corporations used for this comparison.19The data for GDP is the ‘Yamada series’ (Japan Statistical Association, 1987, Table
13-03). We used price index from Nakazawa (2001) to deflate GDP. The number of firms inthe genealogies is computed from the whole original dataset.
20We also find via inspection that a list of 200 largest industrial firms in 1918 (Fruin,1994, p.329) overlaps with firms covered in the genealogy.
14

from the sample excluding banks is over 60 percent in that year, suggesting
that the sample predominantly draws from the formal sector.21 If initial cap-
ital affects survival probabilities, joint-stock corporations, which are typically
larger in size, would dominate the sample over time. If so, the corporate share
would increase over time even without any tax incentives, though the inclu-
sion of discontinued firms mitigate over-sampling of successful firms to some
extent. The effects of this sample selection through survivorship, if any, would
however be gradual, while the identification relies on an abrupt change at a
point in time. In the empirical analysis, we control for this possible influence
by including a trend term in the regression.
Lastly, and most relevant to the research question, the sample of large
formal-sector firms is likely to lead to an underestimation of tax effects. Pre-
vious studies indicate that the tax motive affects smaller firms, whose decisions
are at the margin of incorporation, more than larger firms. Liu (2014) finds
corporate shares of employment respond less than those of firm count and
Freedman and Crawford (2010) document that incorporation rates increased
among smaller firms but not larger firms in the UK’s experience with the 0
percent starting rate. Thus, results based on a sample of genealogies of large
corporations would provide a lower bound on any tax effect and understate
the impacts in the population. Appendix Table A1 lists sources for other data.
21The number of taxpayers filing Type 1 income (6,133) divided by Business OperationsTax filers in 1899 (475,917) (Toyo Keizai Shinposha, 1975, Table 728, 730). Small businesses,such as second-hand cloth shops, pawn shops and inns, as well as large businesses, such asbanks, were liable for the Business Operations Tax. Tax records from Nagano Prefecturein 1891 show, for example, rich farmers conducted sericulture and money lending as soleproprietors (Orii and Yamamoto, 1990).
15

2.2 Sample
To prepare the dataset, we convert the genealogical information into firm-year
observations. We also drop banks given the industry’s specificity and exclude
government corporations out of the same concern. We omit anonymous part-
ners since they are pass-through entities. There are no mutual companies be-
tween 1880 and 1892, so the sample consists of sole proprietors, partnerships,
limited partnerships, limited liability corporations, and joint-stock corpora-
tions.
Of the remaining organizational types, joint-stock corporations are on aver-
age much larger than other types of corporations: The average size of paid-in
capital for 1895 is 11 and 3 times as large as that of partnership and lim-
ited partnership respectively. The theory suggests that the tax incentives af-
fect firms at the margin of incorporation (Gordon and MacKie-Mason, 1994).
Non-tax factors, such as the benefit of limited liability for investors, would
likely dominate the choice of organizational form of a modern textile factory,
for example, while a medium-size family businesses may not find a clear ad-
vantage in incorporation. We therefore treat joint-stock corporations as one
category, and combine partnership, limited partnership, and limited liability
corporations into a separate category, referred to as “other corporations”.
Figure 1 provides a preliminary examination, and shows the share of sole
proprietors, joint-stock corporations and other corporations for the entire Meiji
period (1868-1912). The solid vertical line indicates the introduction of PIT.
The dotted vertical lines indicate the timing of other major reforms: the par-
tial implementation of the Commercial Code in 1893, Tax Reform of 1899, and
16

a permanent extension of war taxes in 1906. Also indicated are the timing of
wars: the Civil War (February-September 1877), the First Sino-Japanese War
(August 1894-April 1895), and the Russo-Japanese War (February 1904-May
1905). As the figure shows the sample consists predominantly of sole pro-
prietors at the beginning of the Meiji period. The corporate share increased
gradually throughout the period, and by the end of Meiji, the share of sole
proprietors is about a third of the sample. This broad trend is consistent with
the rapid industrialization that took place particularly since the 1890s. In
1887, the share of other corporations jumps by 4 percentage points while the
share of sole proprietors falls by 4.8 percentage points. In contrast, we do not
see visible changes for joint-stock corporations around the time. These pat-
terns are consistent with the conjecture that the PIT induced sole proprietors
to incorporate their business into a simpler corporate form.
Upon the partial implementation of the Commercial Code in 1893, the
share of joint-stock corporations jumped while the share of other corporations
fell abruptly. This shift suggests that the Commercial Code affected the choice
of organizational forms within the corporate sector. The Tax Reform of 1899
did not appear to have had a large influence on the choice of organizational
forms, despite the introduction of the 2.5 percent tax on corporate income. As
Table 1 shows, the top marginal rate on personal income also increased from
3 to 5 percent, countering the disincentives to incorporate. The lack of a clear
response at the aggregate level may be due to these countering tax incentives.
Temporary war taxes, implemented during the Russo-Japanese War, increased
the progressivity of the PIT and applied the progressive rate to income earned
17

by partnerships, limited partnerships, and joint-stock corporations with 20 or
fewer shareholders. Since its permanent extension in 1906, the share of joint-
stock corporations increased while that of sole proprietorship fell, in line with
the tax minimization motives.
In designing a quasi-experiment, we limit the sample period to 1880-1892
for the following reasons. First, this period keeps regulatory environment
relatively homogenous across the pre- and post-PIT samples; the Commercial
Code of 1893 had had a visible impact, but in addition, the enforcement regime
became more sophisticated over time as discussed. Accounting for all relevant
policy changes would render an empirical model unnecessarily complex. Sec-
ond, the sample spans a period of relative political stability and falls between
the Civil War and First Sino-Japanese War. The rise in corporate share after
the latter war may reflect an economic boom that followed. We chose the
end year given the partial implementation of the 1893 Commercial Code. The
choice of end year limits the number of post-reform years to six. We chose
the beginning year to keep the length of the pre-reform period comparable (7
years). Table 2 provides summary statistics.
3 Analysis
3.1 Baseline model
To estimate the effects of tax incentives, we utilize the introduction of PIT in
1887 as a quasi-experiment. Since the data suggest that the PIT encouraged
the formation of other corporations, we pool firm-year observations for sole
18

proprietors and other corporations from 1880-1892 and examine the likelihood
of incorporation with the following linear probability model:
ocit = α0 + α1PITt + x′itβ + λjt+ µk + uit, (1)
where ocit is an indicator for firm i from time period t being other corpora-
tions (i.e., partners, limited partners, and limited liability corporations). PITt
is an indicator for time period at and after 1887. The coefficient α1 captures
the difference in the probabilities of incorporation before and after the reform.
The identification of tax effects relies on the time variation in tax incentives
since PIT was at the national level. Since business conditions can confound
the influence of taxes, we consider several macroeconomic controls (xit). In the
early 1880s, a contractionary fiscal policy induced a severe deflation, known
as the Matsukata Deflation.22 The economy was still recovering when the
government introduced PIT. To account for possible business cycle effects, we
control for the real GDP growth rate. The impact of the business cycle would
have differed by industries, but we have information on industry-level output
growth for some, but not all, industries. To account for this, we consider the
growth rate of the number of firms in the original sample as a proxy for industry
growth, since the overall changes in the number of firms in the original sample
and the GDP growth are strongly correlated (Tang, 2013). We also include the
growth rate of the Tokyo stock price index. Publicly-traded companies were
small in number, particularly in the first years following the foundation of the
22The economy in the late 1870s suffered from severe inflation after the Civil War of 1877.Finance Minister Matsukata implemented deflationary fiscal policy to counter deflation.
19

Tokyo and Osaka stock exchanges in 1878, but accounted for 30-40 percent of
the total capital of joint-stock corporations, so the stock index captures the
broad trend in the formal sector.23 We control for real interest rates to account
for access to external finance.
An increase in incorporation rates over the Meiji period, shown in Fig-
ure 1, likely reflects technological change. Table 3 presents changes in the
shares of organizational types by industry before and after the 1887 reform.
Notably, the textile industry, which underwent a large transformation by the
introduction of Western-style factories, exhibits a large decline in the share of
sole proprietors across the periods (-31.7 percentage points). Some of these
increases in incorporation rates may be attributable to the survivorship bias
or mechanical increase as discussed earlier. We therefore consider industry-
specific linear time trends (λj) to control for technological change and possible
influences from the dataset construction. In addition, xit includes a vector of
firm-level controls: reginal dummies, industry dummies (12 industries), and
the number of years since the founding of the oldest firm in a genealogy to
which firm i belongs (‘genealogy age’).24 We consider a specification with
and without µk, a genealogy fixed effect. Firms within a genealogy typically
engage in similar operations, so a genealogy fixed effect should capture the
characteristics of narrow industry not accounted for by the industry dummies.
We allow for a heteroskedastic error term.
23In 1878, 1885, and 1915, 4, 24 and 151 firms were traded on the stock market respectively(Okazaki et al., 2005).
24We combine regions with small number of observations.
20

3.1.1 Results
Columns 1-3 in Table 4 show estimates from the linear probability model
using the pooled firm-year sample. The specification in Column 1 includes a
full set of macroeconomic controls, an industry-specific time trend, and firm-
level controls. The model fit seems reasonable: industry-level trends, industry
dummies, and regional dummies account for much of the explained variation.
The coefficients on genealogy age and squared age are statistically significant.
Their point estimates imply that a firm in an ‘older’ genealogy tends to be a
corporation, in line with the theory that businesses incorporate as they mature
and their organizational structures become more complex.
Column 2 includes the dummy for the PIT introduction, which is signifi-
cant at the 1 percent level. Column 3 adds genealogy fixed effects, and shows
that the coefficient on PITt is lower but is still highly significant. This point
estimate implies that the share of incorporation increased by 5.5 percentage
points in this sub-sample that excludes joint-stock corporations. This trans-
lates to a 3.2 percentage-point increase in the whole sample.25 Interestingly,
the coefficients on genealogy age and its square change signs, reflecting the
influence of ‘new comers.’ That is, conditioning on a genealogy, observations
with older genealogies ages are from the latter sample period, which likely
include new business operations.
250.055 divided by the share of firms other than joint-stock corporations in the pre-tax-reform sample (0.585).
21

3.2 Robustness checks
3.2.1 Full sample
The baseline estimation dropped joint-stock corporations to focus on the choice
between a sole proprietorship and a non-joint-stock corporation. To see if this
estimation strategy affects the result, we estimate a multinomial logit model on
a sample that includes joint-stock corporations, following Wooldridge (2010):
P (yit = m|zit) = exp(z′itβm)/[1 +3∑
h=2
exp(z′itβh)], (2)
where m indicates three outcome categories: (i) sole proprietorships, (ii)
other corporations, (iii) and joint-stock corporations, with sole proprietorships
as the base category in the estimation. The vector z includes PITt and a set of
control variables, including x from (1) and industry-specific linear time trends.
As before, we allow for heteroskedastic errors.
Columns 4-5 in Table 4 present the results. The coefficient on PITt is sig-
nificant at the 1 percent level for other corporations but not for joint-stock cor-
porations. To interpret the magnitude, we compute the difference in predicted
probabilities. The result indicates that observations from the post-reform pe-
riod are 6.5 percentage points more likely to become ‘other corporation’ than
observations from the pre-reform period. This is slightly higher than the un-
conditional differences in probabilities between 1886 and 1887. Therefore, the
result is robust to the exclusion of joint-stock corporations.
22

3.2.2 Genealogy panel
We consider a panel regression analysis to account for unobservable charac-
teristics. We first take each genealogy as a panel unit, and use industry as an
alternative panel unit in a separate analysis.26 To construct a genealogy-level
panel data, we aggregate observations over genealogies after dropping banks
and government corporations. We retain genealogies with 5 or more observa-
tions spanning 1887 to ensure each panel unit has sufficient time length, and
we keep observations with gaps.27
We consider counts of each type of organization per genealogy-year, rather
than shares, since the number of firms within a genealogy is typically small,
making data on shares lumpy. Table 5 shows the tabulation by organizational
types. The range for sole proprietor and other corporation is [0, 4], but with
heavy concentration in [0, 1]. Count is therefore an outcome more suitable in
a regression analysis. Thus, following Wooldridge (2010), we employ the fixed-
effect Poisson regression to fit model with count data. We assume that the
number of firms that takes a certain organizational type in a given genealogy
at any point in time, conditional on observables and an unobserved fixed-
component, follows a Poisson distribution:
f(numtypekt|zkt, ck) = exp[−ck exp(z′ktβ)][ck exp(z′ktβ)]numtypekt/numtypekt!,
(3)
26We are unable to take firm as a panel unit since direct lineages are often difficult toderive from genealogies in case of mergers.
27To be clear, while we drop banks in computing the outcome variable, we keep genealogieswhich include banks as member.
23

where f(.) is a probability density function; k indexes genealogy. The out-
come variable, numtypekt, is the number of firms that take an organization
type (sole proprietorship, other corporation, or joint-stock corporation) in ge-
nealogy k at time t. The vector zkt includes PITt and a vector of control
variables from (2), excluding regional and industry dummies. The term ck
accounts for time-invariant unobservable characteristics of genealogy k.
Since the genealogies differ in size, which naturally affects the count of
organizational types, we therefore consider incorporation rates by including the
number of firms as an exposure variable with a unit coefficient. In estimation,
we drop genealogies with all zero outcomes for a given organizational type, so
the sample size varies by outcome analyzed.28 We cluster the standard errors
within panel by genealogies.
Columns 6-8 show estimates from the fixed-effect Poisson regression on the
count of firm type using the genealogy panel data. The coefficient on PITt
is significant at the 5 percent level for sole proprietorship. The magnitude
indicates that the number of sole proprietors fell by 6.8 percent per genealogy,
or by 0.053 firms per genealogy.29 The coefficient on PITt is significant at
the 1 percent level for other corporations. This magnitude implies that the
number of other corporations increased by 84.9 percent, or by 0.048 firms
per genealogy. The coefficient on PITt takes a negative sign for joint-stock
corporations, but is not statistically significant. While the magnitudes of these
28To control for industry output growth, each genealogy needs an industry classification.We counted the frequency of industry classifications within each genealogy over the sampleperiod, and assigned the industry with the highest count. Given that industry counts areconcentrated within genealogy, this approach should provide a reasonable approximation.
29The sample average for 1880-1886 (0.782) multiplied by 0.068.
24

estimates are harder to interpret, in qualitative terms, the results are robust
to controlling for time-invariant unobservable effects.
3.2.3 Industry panel
The standard approach in previous studies is to use a panel regression on
corporate shares over aggregate unit, such as states. To see if a common
framework changes the result, we aggregate the sample over 12 industries and
examine corporate shares by industry-year in a fixed-effects regression model.
The present study differs in using a subset of population.30 While industry
aggregation reduces the sample size substantially, these estimates provide a
basis for comparison with results from the literature. We cluster standard
errors within the panel and weight observations by the number of firms in
industries.
Columns 9-11 show the result. In Column 10, the coefficient on PITt in
the model for other corporations is positive and significant at the 1 percent
level. The result indicates that the share of other corporations increased by
5.8 percentage points in the post-reform period. The coefficients on PITt are
not significant for sole proprietorships and joint-stock corporations. Since the
number of observations is much smaller (N=156), the results likely reflect a
lack of statistical power.
30Unfortunately, we do not have information to construct other measures of corporateactivity, such as employment or output.
25
3.2.4 Dynamic consideration
So far, the empirical framework implicitly assumed that the choice of organi-
zational forms does not depend on firms’ choices in the past. However, the
decision likely exhibits time dependence for obvious reasons: firms would re-
tain their current forms unless faced with a compelling reason to do so.31 To
obtain a sub-sample of firms with a continuous identity, we restrict the sample
to observations with a single unit in a genealogy at a given time, and compute
a transition matrix from each type (sp, oc, and kk) across adjacent years. The
probabilities of remaining in the same type across years typically exceeded 98
percent in this sub-sample, indicating a strong dependence.32
The industry panel readily extends to a dynamic analysis. In addition to
including a lagged dependent variable in the fixed-effects estimation, we use
difference and system GMM estimation to incorporate a dynamic dependence
while allowing for fixed effects and dynamic panel bias. For both difference
and system GMM, we treat the macroeconomic control variables as predeter-
mined but not strictly endogenous; collapse the instruments to avoid overfit-
ting with numerous instruments (Roodman, 2009); use the one-step estimation
procedure. We once again weight observations by the number of firms in the
industries, and cluster standard errors by industries.
31Examining time dependence is not as easy as it might first appear, since, once again,the identity of a firm is not easily tractable due to mergers.
32The transition matrix also indicated that firms tend to “move up” from simpler organi-zational forms. A duration model may be more appropriate in modeling such behavior giventhis “irreversible” tendency, but the limited longitudinal information at firm level precludesus from implementing such model. However, since the off-diagonal elements were muchsmaller compared to the diagonal elements, the dynamic dependency seems the first-orderimportance in modeling.
26

Table 6 presents the main estimates, and all three models produce nearly
identical coefficients on PITt. As is well documented, the dynamic panel bias
affects the lagged dependent variable more severely compared to covariates
(Judson and Owen, 1999; Flannery and Hankins, 2013). The coefficients on
the lagged dependent variable are significant at the 1 percent level across
specifications, and are larger under the GMM estimates, suggesting a high dy-
namic dependence with a possible dynamic panel bias under the fixed effects
estimator. The similarity of the PIT coefficients across the three estimators,
however, suggests that the fixed-effects model is sufficient in assessing robust-
ness. Although the specification tests for the GMM estimators indicate that
the instruments are valid with no second-order autocorrelation, the p-value for
the Hansen test is 1, which is symptomatic of over-proliferation of instruments
despite adopting a recommendation to collapse instruments. Our preferred
estimates are therefore those in Columns 1-3. The coefficient on PITt for the
share of other corporations is 0.044 and is significant at the 1 percent level.
Compared to the static model, this estimate is about 25 percent lower, but is
higher than that suggestted by the baseline estimation employing the firm-level
data. Overall, the dynamic issue does not seem to warrant further probing.
3.3 Alternative explanation
While we have explicitly controlled for economic factors in the analysis, absent
cross-section variation, the identification could be confounded by other changes
in the economy. Particularly, we have noted that local governments started
issuing decrees on incorporation around the time of the PIT introduction.
27
If the creation of local rules increased the benefits of incorporation, perhaps
through a better status of corporations, then an improved legal environment,
rather than the tax motives, may better explain a rise in incorporation in 1887.
To address this concern, we focus on Osaka prefecture which issued a local
guideline for establishing a corporation in February 1886. Osaka was a com-
mercial center during the Edo period and was the second largest local economy
in the country at the time. If the local rule was responsible for the surge in
incorporation, we should observe the incorporation rate in Osaka increase from
1886. Panel B in Figure 2 shows shares of firms in Osaka Prefecture by orga-
nizational types. The dashed and solid vertical line indicates 1886 and 1887
respectively. The overall pattern is similar to that from the country aggregate
(Panel A), and no trend break is evident in 1886. The local guideline would
have somewhat contributed to clarifying legal requirements for incorporation
(Nakamura, 2010), but is unlikely to explain the jump in incorporation rate in
1887.
4 Discussion
Economic historians named the period spanning the PIT introduction the
‘First Surge of the Corporate Sector’ (1886-1889) in Japan. Our study draws
on a new data source and utilize the discrete change in tax law as a quasi-
experiment to examine tax-motivated incorporation in 19th century Japan.
The evidence shows that the introduction of PIT was an important factor be-
hind the surge. Our estimates, while lower than these from the most recent
28

study by Liu (2014), would likely underestimate the true impact at the pop-
ulation level given the sample of prominent firms. In addition, our data are
taken from an economy less developed than the U.S. in the early 20th century,
so the tax administration in the late 19th century Japan would have been much
weaker, possibly enabling firms to substitute avoidance with evasion.33 That
said, our results confirm findings in the existing literature that tax incentives
affect small firms disproportionately. Specifically, the estimates show that the
tax incentives affected the margin between sole proprietorship and ‘simpler’
corporations but not joint-stock corporations.
More generally, our study demonstrats the role of the CIT as a backstop
to the PIT, also emphasized in recent studies (de Mooij and Nicodme, 2008;
Liu, 2014). The early PIT collected 70 percent of projected revenue in the
first year (Hayashi, 1965), but the portion of this shortfall attributable to tax-
motivated incorporation is hard to gauge from data available from the period
under investigation. Rather, it would be relevant to examine further how PIT
and CIT affect each other’s revenue performance, as considered in de Mooij
and Nicodme (2008). We left several opportunities for quasi-experiments with
later tax changes unexamined in the paper, primarily because the advantage of
genealogical data becomes less clear with the availability of aggregate statistics
since the mid-1890s. However, qualitative evidence from the latter period
suggests the importance of tax motives: well-documented correspondences by
managers of Mitsui zaibatsu reveal tax planning efforts that included a survey
33The discrepancy may in addition arose from nonlinear effects of PIT. The top federal-state-combined PIT rate in Liu (2014) was 22 percent (Table 1), while the top rate of theinitial Japanese PIT was 3 percent.
29

trip to Europe (Nakamura, 2010) and records of discussions from the National
Assembly show a conscious development of anti-avoidance policies in the latter
period (Takagi, 2007). We leave these questions for further study.
References
Chetty, R. (2012). Bounds on elasticities with optimization frictions: A synthe-
sis of micro and macro evidence on labor supply. Econometrica, 80(3):969–
1018.
Cullen, J. B. and Gordon, R. H. (2007). Taxes and entrepreneurial risk-taking:
Theory and evidence for the US. Journal of Public Economics, 91(7):1479–
1505.
de Mooij, R. and Nicodme, G. (2008). Corporate tax policy and incorporation
in the EU. International Tax and Public Finance, 15(4):478–498.
Flannery, M. J. and Hankins, K. W. (2013). Estimating dynamic panel models
in corporate finance. Journal of Corporate Finance, 19:1–19.
Freedman, J. and Crawford, C. (2010). Small business taxation. In Institute
for Fiscal Studies, editor, Dimensions of Tax Design: The Mirrlees Review.
Oxford University Press, Oxford.
Fruin, W. M. (1994). The japanese enterprise system: Comparative strategies
and cooperative structures.
30

Goolsbee, A. (1998). Taxes, organizational form, and the deadweight loss of
the corporate income tax. Journal of Public Economics, 69(1):143–152.
Goolsbee, A. (2004). The impact of the corporate income tax: evidence from
state organizational form data. Journal of Public Economics, 88(11):2283–
2299.
Gordon, R. H. and MacKie-Mason, J. K. (1994). Tax distortions to the choice
of organizational form. Journal of Public Economics, 55(2):279–306.
Grossfeld, B. and Bryce, J. D. (1983). Brief comparative history of the orgins of
the income tax in Great Britain, Germany and the United States. American
Journal of Tax Policy, 2:211–252.
Hanlon, M. and Heitzman, S. (2010). A review of tax research. Journal of
Accounting and Economics, 50(2):127–178.
Hayashi, T. (1965). Nihon ni okeru sozei kokka no seiritsu (Establishment of
the modern taxation and state in Japan. Tokyo University Press, Tokyo.
Japan Statistical Association (1987). Nihon choki tokei soran (Historical
statistics of Japan). Nihon Tokei Kyokai, Tokyo.
Japanese Bankers Association (2012). Bank database change history. URL:
http://www.zenginkyo.or.jp/library/hensen/. Accessed 2012-06-01.
Judson, R. A. and Owen, A. L. (1999). Estimating dynamic panel data models:
A guide for macroeconomists. Economics Letters, 65(1):9–15.
31

Liu, L. (2014). Income taxation and business incorporation: Evidence from
the early twentieth century. National Tax Journal, 67(2):387–418.
Mackie-Mason, J. K. and Gordon, R. H. (1997). How much do taxes discourage
incorporation? The Journal of Finance, 52(2):477–506.
Maruyama, T. (1985). Nihon chiho zeiseishi. Gyosei, Tokyo.
Miyamoto, M. (1990). Sangyoka to kaisha seido no hatsuten (Industrialization
and the development of company institution). In Nishikawa, S. and Abe,
T., editors, Sangyoka no jidai (Era of industrialization). Sansuisha, Tokyo.
Mizumoto, T. (1998). Kosuwarizei no seiritsu to tenkai (Foundation and
development of household tax). Ochanomizu Shobo, Tokyo.
Nakamura, N. (2010). Nihon ni okeru kindai kigyo no seisei (Development
of modern corporations in Japan). In Abe, T. and Nakamura, N., ed-
itors, Sangyo kakumei to kigyo keiei (Industrial revolution and business
administration): 1882-1914. Minerva Shobo, Tokyo.
Nakazawa, B. (2001). Nihon beika hendoshi (The history of rice price
fluctuation in Japan). Kashiwa Shobo, Tokyo.
Okazaki, T., Hamao, Y., and Hoshi, T. (2005). The genesis and the develop-
ment of the pre-war Japanese stock market. Keizai Kenkyu, 56(1):15–29.
Orii, K. and Yamamoto, Y. (1990). Souseiki no shotokuzei souko (The origin
of income tax). Zeidai Ronso, 20:1–376.
32

Romer, C. D. and Romer, D. H. (2014). The incentive effects of marginal
tax rates: Evidence from the interwar era. American Economic Journal:
Economic Policy, 6(3):242–281.
Roodman, D. (2009). A note on the theme of too many instruments. Oxford
Bulletin of Economics and Statistics, 71(1):135–158.
Scholes, M. S. and Wolfson, M. A. (1991). The Role of Tax Rules in the Recent
Restructuring of U.S. Corporations, pages 1–24. The MIT Press.
Takagi, K. (2007). Nihon shotokuzei hatten shi: Shotokuzei kaikaku no hatten
to rekishi, soseiki kara genzai made (The development of the Japanese
income tax: History and development of income tax reforms from the
foundation to present). Gyosei, Tokyo.
Takahashi, K. (1956). Waga kuni kigyo no shiteki hatten (The historical
development of the corporate sector in Japan). Toyokeizai Shinposha,
Tokyo.
Tang, J. P. (2011). Technological leadership and late development: Evidence
from Meiji Japan, 1868–1912. The Economic History Review, 64(s1):99–116.
Tang, J. P. (2013). Financial intermediation and late development in Meiji
Japan, 1868 to 1912. Financial History Review, 20(02):111–135.
Toyo Keizai Shinposha (1975). Meiji Taisyo Kokusei Soran. Toyo Keizai
Shinposha, Tokyo.
33

Wooldridge, J. M. (2010). Econometric analysis of cross section and panel
data. MIT press, Massachusetts.
Yagura, S. and Ikushima, Y. (1986). Genealogical charts of Japanese major
corporations. Yushodo, Tokyo.
Yoshida, J. (1998). Nihon no kaishaseido hattatsushi no kenkyu (The history
of corporate institution in Japan). Ryutu Keizai University Press, Tokyo.
34

Table 1: Early income tax in Japan
1887 1899
Type 1 Type 2 Type 3Corporate income Bonds Other income
Schedule bracket (yen) rate (%) bracket (yen) rate (%)300 1 2.50% 2% 300 1
1,000 1.5 .10,000 2 .20,000 2.5 .30,000 3 100,000 5.5
Number of brackets 5 1 1 12
Exemption 300 300
Excluded income Corporate income Dividend incomeReal estate income
Taxpayers Japanese Resident of Japan
Family income Aggregation Aggregation
Source: Takagi (2007)
35

Table 2: Summary statistics
Variables mean sd min max N
Joint-stock corporation = 1 0.42 0.49 0 1 3,203Sole proprietor = 1 0.50 0.50 0 1 3,203Other corporation = 1 0.08 0.27 0 1 3,203Stock index growth -0.02 0.17 -0.40 0.46 3,203Real IR index 0.36 0.14 0.26 0.75 3,203GDP growth 0.04 0.08 -0.06 0.17 3,203Industry growth 0.09 0.16 -0.13 3.00 3,203Age (/100) 0.34 0.59 0.01 3.07 3,203
Note: Firm-year observations covering 1880-1892 constructed fromthe genealogies. Banks are excluded from the sample. See text forfurther details.
Table 3: Changes in the share of organizational type by industries and taxregimes
Sole proprietor Other corporations Joint-stock corporations
Industry Before After Total Change Before After Total Change Before After Total Change
primary 0.900 0.861 0.878 -0.039 0.000 0.040 0.022 0.040 0.100 0.099 0.100 -0.001retail 0.872 0.850 0.860 -0.022 0.000 0.049 0.026 0.049 0.128 0.101 0.114 -0.027metal 0.811 0.619 0.690 -0.192 0.000 0.000 0.000 0.000 0.189 0.381 0.310 0.192machinery 0.651 0.657 0.654 0.006 0.048 0.157 0.110 0.109 0.301 0.185 0.236 -0.116chem etc 0.734 0.588 0.640 -0.146 0.109 0.096 0.101 -0.013 0.156 0.316 0.258 0.160ceramic 0.692 0.525 0.590 -0.167 0.031 0.129 0.090 0.098 0.277 0.347 0.319 0.070foodbev 0.500 0.422 0.455 -0.078 0.045 0.100 0.077 0.055 0.455 0.478 0.468 0.023textile 0.530 0.213 0.308 -0.317 0.052 0.194 0.151 0.142 0.417 0.593 0.540 0.176wood etc 0.302 0.232 0.257 -0.070 0.151 0.343 0.276 0.192 0.547 0.424 0.467 -0.123transport 0.272 0.178 0.216 -0.094 0.029 0.118 0.082 0.089 0.699 0.704 0.702 0.005other 0.174 0.191 0.184 0.017 0.000 0.059 0.032 0.059 0.826 0.750 0.784 -0.076finance 0.135 0.174 0.155 0.039 0.108 0.104 0.106 -0.004 0.757 0.721 0.738 -0.036
Total 0.545 0.458 0.495 -0.087 0.039 0.112 0.081 0.073 0.415 0.43 0.424 0.015
36

Table 4: Regression analysis
(1) (2) (3) (4) (5) (6) (7) (8) (9) (10) (11)Sample pooled (sp, oc) pooled (all) genealogy panel industry panelEstimator LP MNL FE Poisson FE
Dependent variable oc oc oc oca kka numsp numoc numkk sharesp shareoc sharekk
PIT Introduction 0.104** 0.055** 1.200** 0.108 -0.068* 0.849** -0.027 -0.025 0.058** -0.033(0.032) (0.018) (0.381) (0.214) (0.030) (0.306) (0.039) (0.035) (0.015) (0.027)
GDP growth 0.020 0.011 -0.011 0.294 -0.012 0.024 0.492* 0.034 -0.029 0.012 0.017(0.134) (0.134) (0.074) (1.145) (0.787) (0.051) (0.242) (0.075) (0.041) (0.012) (0.037)
Industry growth 0.028 -0.000 -0.013 -0.091 0.288 0.011 -0.052 0.021 -0.063** -0.002 0.065**(0.047) (0.046) (0.031) (0.609) (0.339) (0.028) (0.229) (0.063) (0.015) (0.010) (0.015)
Stock index growth -0.036 0.028 -0.001 0.532 -0.066 0.002 0.345+ -0.042 0.031 0.010 -0.041(0.051) (0.053) (0.030) (0.734) (0.380) (0.022) (0.206) (0.035) (0.021) (0.011) (0.025)
IR index -0.019 -0.031 0.030 -1.471 -0.810 -0.001 -0.010 -0.002 0.001+ 0.000 -0.001(0.087) (0.088) (0.054) (1.166) (0.666) (0.001) (0.007) (0.001) (0.001) (0.000) (0.001)
Age/100 -0.057* -0.058* 0.029 -3.153** -1.533**(0.025) (0.025) (0.107) (0.552) (0.311)
Age/1002 0.024* 0.024* -0.143** 1.273** 0.664**(0.009) (0.009) (0.052) (0.197) (0.129)
Time 0.020* 0.006 -0.002 0.086 0.074 -0.038+ 0.060 0.055 -0.026** 0.008* 0.018**(0.008) (0.010) (0.004) (0.103) (0.061) (0.022) (0.111) (0.065) (0.005) (0.003) (0.003)
Constant -0.385* -0.163 -0.357** -6.461** -3.058* 0.564** 0.015 0.421**(0.169) (0.191) (0.133) (2.378) (1.328) (0.094) (0.057) (0.073)
Fixed effects NO NO YESb NO YES YES YES YES YES YES
PIT marginal effects 10.4 5.5 6.5 2.0 -6.8 84.9 -2.7 -2.5 5.8 -3.3(Unit) (%pt) (%pt) (%pt) (%pt) (%) (%) (%) (%pt) (%pt) (%pt)Observations 1,846 1,846 1,846 3,203 1,324 325 860 156 156 156R-squaredc 0.228 0.232 0.753 0.280 . . . 0.690 0.774 0.575Number of panel 108 27 72 12 12 12LL -2113 -1126 -188.4 -750.5LL 0 -2935
Note: This table presents regression analysis on the base sample (Column 1-5) and panel data constructed from the sample (Column 6-11).Column (1)-(3) presents OLS estimates on the indicator for other corporations in a sample that excludes joint-stock corporations. Column(4)-(5) presents a Multinomial Logit estimates (the base category is sp). Column (6)-(8) presents fixed-effects poisson estimates on the countof organizational types in a genealogy. Column (9)-(11) presents fixed-effects regression estimates on the share of organizational types in anindustry. All regression include industry-specific time trends. LP and MNL include industries and regional dummies. FE include regionaldummies. FE Poission includes the number of firms in a genealogy as an exposure variable. Robust standard errors and clustered standard errorsare in parentheses for (1)-(5) and (6)-(11) respectively. a. Outcome variables. b. Genealogy dummies. c. Adjusted R-squared for (1)-(3) and(10)-(12); pseudo R-squared for (4)-(6). ** p < 0.01, ∗p < 0.05,+p < 0.1.
37

Table 5: Frequency of type counts within genealogy-year
Count Sole proprietor Other corp. Joint-stock corp. Combined
0 600 (32.4) 1,671 (90.2) 1,154 (62.3) 01 1,087 (58.7) 149 (8.0) 401 (21.6) 1,3602 140 (7.6) 20 (1.1) 145 (7.8) 2123 25 (1.4) 12 (0.7) 82 (4.4) 1254 1 (0.1) 1 (0.1) 35 (1.9) 715 0 (0.0) 0 (0.0) 29 (1.6) 546 0 (0.0) 0 (0.0) 1 (0.1) 12
7+ 0 (0.0) 0 (0.0) 6 (0.4) 19
Note: The sample is based on the panel of genealogies. Percent of column inparentheses.
38

Table 6: Dynamic panel regression using the industry panel
(1) (2) (3) (4) (5) (6) (7) (8) (9)Estimator FE FE FE DGMM DGMM DGMM SGMM SGMM SGMMDep. var. sharesp shareoc sharekk sharesp shareoc sharekk sharesp shareoc sharekk
PIT Introduction -0.022 0.044** -0.024 -0.023 0.043** -0.023 -0.022 0.043** -0.023(0.025) (0.010) (0.022) (0.025) (0.009) (0.021) (0.026) (0.010) (0.022)
Lagged dep. var. 0.412* 0.462** 0.378** 0.455** 0.547** 0.452** 0.455** 0.518** 0.465**(0.141) (0.054) (0.121) (0.108) (0.063) (0.108) (0.123) (0.053) (0.092)
Observations 144 144 144 132 132 132 144 144 144Number of panels 12 12 12 12 12 12 12 12 12
Sargan test (p-val.) . . . 0.225 0.383 0.789 0.0767 0.315 0.751Hansen test (p-val.) . . . 1.000 1.000 1.000 1.000 1.000 1.000AR(2) test (p-val.) . . . 0.215 0.201 0.686 0.230 0.200 0.703No. of instruments . . . 45 45 45 59 59 59
Note: This table examines the robustness of results by including a lagged dependent variable in the industrypanel regression on the share of organizational type. Three estimators include fixed effects (FE), differenceGMM (DGMM), and system GMM (SGMM). For the GMM estimators, we treated the macroeconomic con-trol variables as predetermined but not strictly endogenous, collapsed the instruments, and used the one-stepestimation procedure. Observations are weighted by the number of firms in the industries, and standard errors,clustered at industry, are in parentheses. ** p < 0.01, ∗p < 0.05.
39

Figure 1: Shares of firms by organizational types: All regions
Civil War Sino War Russo War
0.2
.4.6
.8
1870 1880 18871890 1900 1910
joint stock corp. other corp.sole proprietor estimation sample
Note: The sample of genealogical firms excluding banks. See text for more details. TheCivil War, First Sino-Japanese War, and Russo-Japanese War is for 1877.2-9, 1894.8-1895.4,and 1904.2-1905.9 respectively.
40
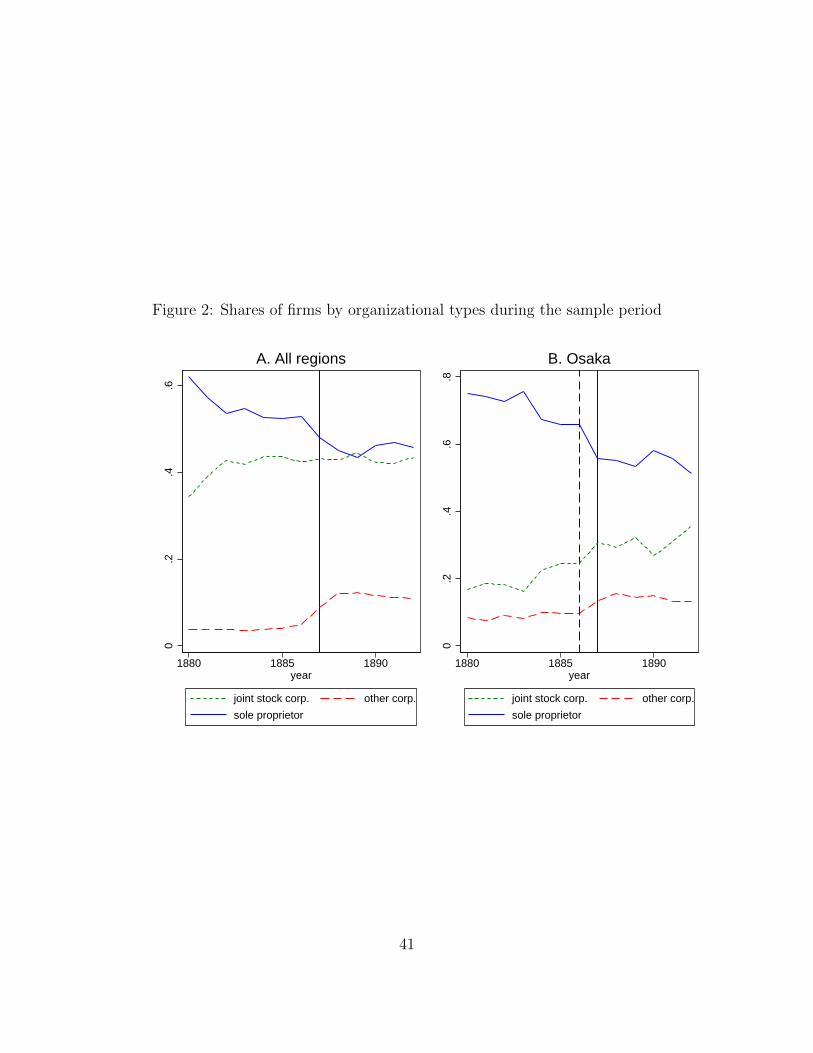
Figure 2: Shares of firms by organizational types during the sample period
0.2
.4.6
1880 1885 1890year
joint stock corp. other corp.
sole proprietor
A. All regions
0.2
.4.6
.8
1880 1885 1890year
joint stock corp. other corp.
sole proprietor
B. Osaka
41

Table A1: Variable list
Variable Code Description Source
Sole proprietor sp Indicator for observation i being asole proprietor
Authors’ compu-tation based onthe genealogies
Joint-stockcorporations
kk Indicator for observation i being ajoint-stock corporation
as above
Othercorporations
oc Indicator for observation i being apartnership, limited partnership, orlimited liability corporation
as above
PITIntroduction
pit Indicator for observations with t ator greater than 1887
as above
Industry growth numgr The growth rate of the number offirms in industry j.
as above
Age age The number of years since the foun-dation of the first firm in a geneal-ogy until t.
as above
GDP growth gdpgr GDP growth rate, deflated by theprice level
Japan Statisti-cal Association(1987), Table13–03)
Price level priceindex Price level Nakazawa(2001)
Stock indexgrowth
stockgr The growth rate of stock index. as above
IR index ririndex Daily interest in 1/100 yen, de-flated by the price level and indexedto 1868
as above
42