Embed Size (px)
Citation preview
Centre for Globalisation Research School of Business and Management
Does inequality foster or hinder the growth of
entrepreneurship in the long-run?
CGR Working Paper 83
Roxana Gutiérrez-Romero and Luciana Méndez Errico
Abstract
This article assesses the extent to which historical levels of inequality affect the creation and survival of businesses over time. To this end, we use the Global Entrepreneurship Monitor (GEM) survey across 66 countries over 2005–2011. We complement this survey with data on income inequality dating back to early 1800s and current institutional environment, such as the number of procedures to start a new business, countries’ degree of financial inclusion, corruption and political stability. We find that although inequality increases the number of firms created out of need, inequality reduces entrepreneurial activity as in net terms businesses are less likely to be created and survive over time. These findings are robust to using different measures of inequality across different points in time and regions, even if excluding Latin America the most unequal region in the world. Our evidence then supports theories that argue early conditions, crucially inequality, influence development path.
Keywords: Inequality; entrepreneurship; panel data; instrumental variables. JEL codes: M2; O1; D3; C23.
http://www.busman.qmul.ac.uk/cgr
CG
R W
orki
ng P
aper
Ser
ies
Does inequality foster or hinder the growth of entrepreneurship in the long-run?*
Roxana Gutiérrez-Romero♦ and Luciana Méndez-Errico±
Abstract
This article assesses the extent to which historical levels of inequality affect the creation and survival of businesses over time. To this end, we use the Global Entrepreneurship Monitor (GEM) survey across 66 countries over 2005–2011. We complement this survey with data on income inequality dating back to early 1800s and current institutional environment, such as the number of procedures to start a new business, countries’ degree of financial inclusion, corruption and political stability. We find that although inequality increases the number of firms created out of need, inequality reduces entrepreneurial activity as in net terms businesses are less likely to be created and survive over time. These findings are robust to using different measures of inequality across different points in time and regions, even if excluding Latin America the most unequal region in the world. Our evidence then supports theories that argue early conditions, crucially inequality, influence development path. Keywords: Inequality; entrepreneurship; panel data; instrumental variables.
JEL Codes: M2, O1, D3, C23.
* We thank Fabrice Murtin for having shared with us the historical estimators on income distribution
shown in this chapter. We thank Isabel Busom, Cristina López-Mayan, Adam Pepelasis, Xavi
Ramos, Francesc Trillas and the participants of the EDIE workshop, the GEM-Barcelona conference,
UAB PhD seminar, Universidad Tecnológica Metropolitana de Mérida, the
LACEA/IADB/WB/UNDP Research Network of Inequality and Poverty for their comments and
suggestions on earlier drafts of this chapter. We acknowledge financial support from the Spanish
Ministry of Science and Innovation (reference ECO2010-21668-C03-02 and ECO2013-46516-C4-
1-R), and from the Generalitat of Catalunya (reference 2014SGR-1279).
♦ Corresponding author: Queen Mary, University of London, School of Business and Management,
London, E1 4NS, UK. Email: [email protected]
± Universidad Autónoma de Barcelona, Building B, Department of Applied Economics, Bellaterra,
08193, Spain.
2
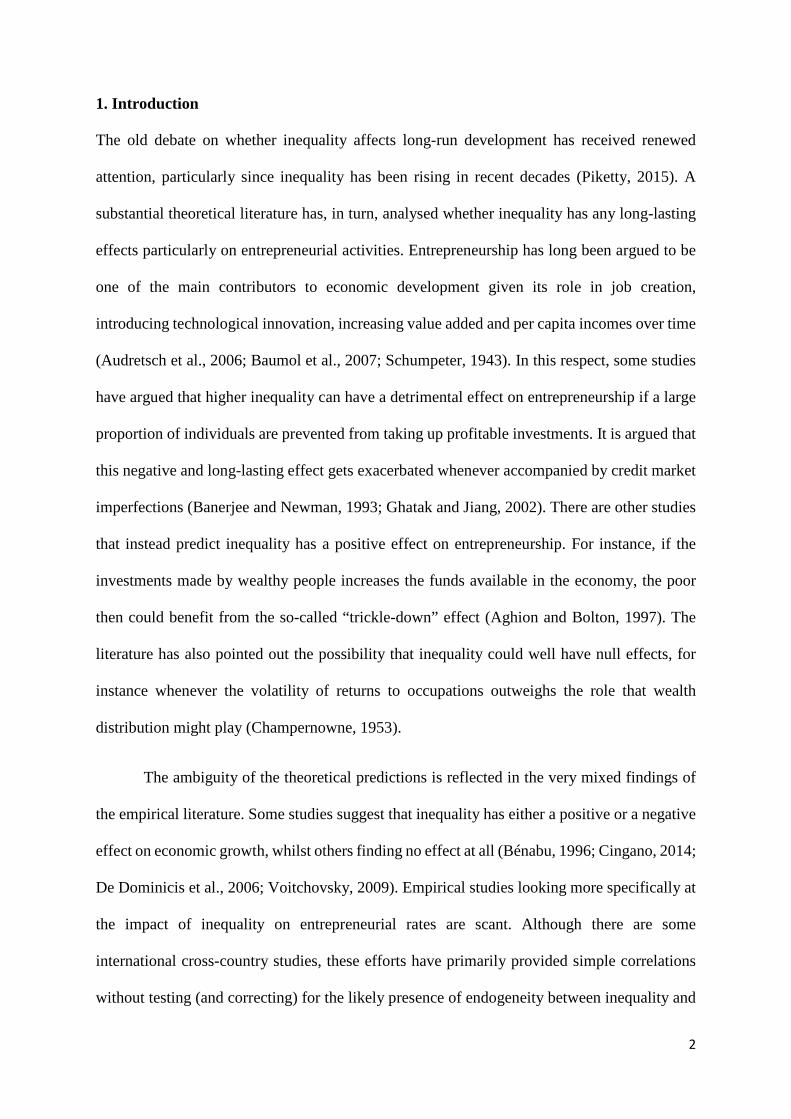
1. Introduction
The old debate on whether inequality affects long-run development has received renewed
attention, particularly since inequality has been rising in recent decades (Piketty, 2015). A
substantial theoretical literature has, in turn, analysed whether inequality has any long-lasting
effects particularly on entrepreneurial activities. Entrepreneurship has long been argued to be
one of the main contributors to economic development given its role in job creation,
introducing technological innovation, increasing value added and per capita incomes over time
(Audretsch et al., 2006; Baumol et al., 2007; Schumpeter, 1943). In this respect, some studies
have argued that higher inequality can have a detrimental effect on entrepreneurship if a large
proportion of individuals are prevented from taking up profitable investments. It is argued that
this negative and long-lasting effect gets exacerbated whenever accompanied by credit market
imperfections (Banerjee and Newman, 1993; Ghatak and Jiang, 2002). There are other studies
that instead predict inequality has a positive effect on entrepreneurship. For instance, if the
investments made by wealthy people increases the funds available in the economy, the poor
then could benefit from the so-called “trickle-down” effect (Aghion and Bolton, 1997). The
literature has also pointed out the possibility that inequality could well have null effects, for
instance whenever the volatility of returns to occupations outweighs the role that wealth
distribution might play (Champernowne, 1953).
The ambiguity of the theoretical predictions is reflected in the very mixed findings of
the empirical literature. Some studies suggest that inequality has either a positive or a negative
effect on economic growth, whilst others finding no effect at all (Bénabu, 1996; Cingano, 2014;
De Dominicis et al., 2006; Voitchovsky, 2009). Empirical studies looking more specifically at
the impact of inequality on entrepreneurial rates are scant. Although there are some
international cross-country studies, these efforts have primarily provided simple correlations
without testing (and correcting) for the likely presence of endogeneity between inequality and
3
entrepreneurial rates. The lack of robust evidence thus limits our understanding of the effects
that inequality might have (Lecuna, 2014; Lippman et al., 2005; Reynolds et al., 2005).
The objective of this article is to empirically test whether income inequality has a long-
term effect on entrepreneurship. Specifically, the article offers two contributions. First, unlike
much of previous empirical studies, we directly test whether income inequality that prevailed
in the distant past, dating back to early 1800s, has any effect on contemporaneous
entrepreneurial activity across 66 countries over 2005–2011. Since inequality might have a
non-linear effect over time, we use different inequality measures, and over different periods
(1820, 1910 and 1980). This approach allows us to overcome some of the issues pointed out
by Piketty and Saez (2006), who argue that in order to understand the causes and consequences
of changes in income and wealth distribution one needs to put them in a broad historical
perspective. Second, we assess the impact that inequality has broadly on different stages of
entrepreneurship by analysing: start-ups, established businesses, as well as those businesses
that were opened out of need. By separately studying the association between historical
inequality and these different entrepreneurial activities, we are able to provide a broader picture
as to how inequality might affect the creation and survival of businesses. For instance, previous
studies have shown that Latin America, the most unequal region in the world, has a positive
correlation between contemporaneous indicators of income inequality and the number of
enterprises being created. However, many of these enterprises do not survive over time given
that some of these businesses were opened out of need (as people had no other job options, or
due to the poor economic conditions of the country). Hence, it is important to analyse the
impact that inequality has on the number of established enterprises and on those that were
created for reasons other than seeking-pure profits.
To study the relationship between inequality and entrepreneurship we use the Global
Entrepreneurship Monitor (GEM) survey. GEM is the largest survey of entrepreneurial activity
4
around the globe, drawing nationally representative surveys on entrepreneurial activity on an
annual basis. We complement this survey with historical estimates of income distribution
ranging from the 19th century until the 20th century as estimated by Bourguignon and Morrison
(2002). In addition to past inequality indicators, we also consider contemporaneous
institutional factors that could affect the creation and maturity of firms according to the
literature. These refer to a number of procedures to start a new business, access to formal credit
and indicators of good governance such as the degree of country’s political stability and control
of corruption (La Porta et al., 1998; Naudé, 2008; Perotti, 1996). In contrast to previous similar
studies, we address for the likely endogeneity that might be present when considering the
impact of these institutional variables on entrepreneurship (e.g. Alvarez and Urbano, 2011;
Lecuna, 2014). We do so given that these institutional variables could be endogenously
determined by the proportion of people involved in entrepreneurial activities who, for instance,
may lobby for lower business start costs, more financial access, better governance, etc. To this
end, we use instrumental variables (IV), a method commonly to deal with endogeneity.2
2 As instruments, we include those shown in previous literature to be strongly correlated with the
institutional variables considered. Thus, number of procedures to start a new business, control of
corruption and political stability are instrumented with the colonial origin of the country and the
European settler mortality rate (Acemoglu et al., 2001) and the number of journalist killed by country
(Besley and Burgess, 2001; Besley and Prat, 2006; Chowdhury, 2004). We also instrument financial
inclusion with the fixed telephone subscriptions per 100 people (Beck et al., 2007) and other indicators
found in the literature as associated with the biological responses that people suffer due to experiencing
financial hardship such as high systolic blood pressure (O’Neil et al., 2005) and high cholesterol levels,
both indicators aggregated at country level (Ezzati et al., 2005). The various robustness tests confirm
that all instruments are jointly correlated with the endogenous variables and to be valid instruments.
5
Several articles before ours have found quite mixed evidence on the impact that
inequality has on development, and specifically on entrepreneurship. Our findings help
reconcile and understand this previous mixed evidence. On the one hand, we find countries that
started with high levels of inequality in the early 1800s currently are more likely to have a
higher number of enterprises created out of need. However, in net terms inequality overall has
a detrimental effect on net entrepreneurial activity in both start-ups and established businesses
(those businesses that have survived over 3.5 years), even when considering current business
and institutional environment. This detrimental effect is consistent if analysing different
inequality measures, across different points in time, and if analysing the entire 66 countries
together, considering only the Global South (Africa, Asia and Latin America), or excluding
Latin America. Our results are also robust if using instrumental variables.
We also find a strong association between the historical inequality indicators used and
the contemporaneous differences in access to credit markets between the rich and poor. These
findings give support to the common assumption in the theoretical literature that suggests
income inequality reflects the severity of credit constraints people face (Ljungqvist, 1993). This
evidence also gives evidence to the extent that inequality in the distant past has prevented the
poorest and credit-constrained people investing in profitable activities, thereby reinforcing
inequality patterns and dampening entrepreneurial activities over time (Banerjee and Newman,
1993).
Our results thus challenge those studies that argue entrepreneurship can be a ladder
through which social mobility can take place given that the enterprises that get opened out of
need are unlikely to survive in the long- or even medium-term (Solimano, 2014). Overall our
results support theories that recommend wealth-distribution efforts and improved financial
inclusion as means to foster entrepreneurship and development. If no such public interventions
6
are taken, entrepreneurial activities in highly unequal countries are unlikely to render a
sustainable channel to bridge development gaps.
The rest of the article proceeds as follows. Section 2 briefly reviews the literature on
inequality and entrepreneurship. Section 3 describes the datasets used and methodology used.
Section 4 presents the baseline results, whilst Section 5 offers robustness checks. The last
section concludes.
2. Impact of inequality on entrepreneurship
The impact that inequality might have on development has been greatly debated in the
literature. In this section, we briefly discuss some of the most prominent views, focusing on
the alleged role that inequality might have for entrepreneurial activity in the long-run.
2.1 Does inequality deter entrepreneurial activity?
One view within the theoretical literature is that initial conditions can have long-term
consequences for development, particularly if starting from high levels of wealth/income
inequality. Inequality could affect development through different channels. For instance by
leading to inefficient institutions (Glaeser et al., 2003), political instability (Alesina and
Perotti, 1996, Bénabu, 1996), affecting the size, composition of domestic demand and level of
industrialization (Jaramillo, 1995; Murphy et al., 1989) and preventing individuals from taking
up profitable investments in capital (Evans and Jovanovic, 1989; Banerjee and Newman, 1993)
or human capital (Galor and Zeira, 1993; Galor and Moav, 2004).
For instance, high levels of inequality could lead to political pressure to set up
inefficient levels of taxation thereby hindering growth (Perotti, 1996; Persson and Tabellini,
1994). This could be as in Alesina and Rodrick (1994) who argue high levels of inequality
could lead to the majority of people voting for high capital taxes. These high taxes reduce the
7
incentives to accumulate capital thereby reducing growth. The damaging effect of inequality
on growth could also be reached if wealthier individuals lobby against policies that seek to
redistribute wealth and foster a more inclusive growth path (Bénabu, 1996).
Other scholars have argued that early wealth distribution determines whether a country
industrializes by affecting market size (Murphy et al., 1989), the adoption of modern
production technologies, productivity, and the number of workers employed in the modern
sector (Jaramillo, 1995). Similarly, others argue that differences in wealth, particularly under
the presence of imperfect credit markets, can be detrimental to growth. For instance, Banerjee
and Newman (1993) assume in an overlapping generations model that each agent can choose
to become a wage-earner or an entrepreneur which requires a larger up-front investment than
the one required to become a self-employed. These up-front investments can be financed from
would-be entrepreneurs’ own wealth or by requesting a loan. However, due to the possibility
that people could renege on their debts, lenders will be willing to loan only to those that can
put in place collateral. Thus, people who do not have enough wealth to provide such collateral
will be credit-constrained and be destined to be workers or unemployed. More importantly,
the initial distribution of wealth in this model, in particular, the ratio of credit to non-credit
constrained, determines who can invest, occupational returns, bequests and endowments
across generations. Countries with low inequality -in the sense of having a high proportion of
non-credit constrained people- will grow over time by having a large share of the population
being able to establish businesses that survive over time paying high salaries. A contrasting
equilibrium, however, could be reached if a country starts with high levels of inequality in the
sense of having a small proportion of non-credit constrained people and very large proportion
of credit constrained people. In this case, in the long-run, there will be a very large number of
poor wage-earners and a small number of entrepreneurs.
8
In terms of empirical evidence, the extensive literature review of Bénabu (1996) shows
that although most studies find a negative association between inequality and economic
growth, still there is no consensus. A more recent review by De Dominicis et al. (2006)
coincides that older studies using data for the mid-1990s and before show a negative
relationship between inequality and growth. Nonetheless, most recent empirical studies have
tended to find a positive relationship instead. Voitchovsky (2009) reports in another literature
review that despite several studies finding high inequality associated with lower growth rate,
still no consensus has been reached. She argues that the mixed results might obey as high
inequality at the bottom of the distribution hinders growth, but high inequality at the top is
associated with higher growth rate.
With regards to the effect on entrepreneurship, Quadrini (1999) using the Panel Study
of Income Dynamics in the USA for the 1980s finds that only those with sufficient personal
wealth can start up a business since relying on external funds alone is insufficient. Similarly,
Evans and Jovanovic (1989) in a study from the National Longitudinal Survey of Young Men
in the USA find evidence that would-be entrepreneurs must bear most of the risk from their
ventures. As a result, wealthier people are most likely to become entrepreneurs, evidence that
agrees with other recent studies (Fairlie and Krashinsky, 2012). Although some find that
liquidity constraints deter self-employment for poorer households (Gentry and Hubbard, 2004;
Zissimopolos et al., 2009), others find no evidence of a necessary binding liquidity constraint
(Hurst and Lusardi, 2004). As Frid et al. (2016) argue, this mixed evidence might be explained
by two factors. First, the empirical literature has typically not considered the initial wealth of
the household, prior to becoming an entrepreneur. Second, empirical studies often focus on
only people that have businesses already established, omitting assessing start-ups. To
overcome these limitations, Fried et al. (2016) use the Panel Study of Entrepreneurial
Dynamics II from 1214 nascent entrepreneurs in the USA. They find that initial wealth of the
9
entrepreneur, does not constrain start-ups, but it is an important determinant of entrepreneurial
success. In similar fashion, Holtz-Eakin et al. (1994), using data from individual income tax
returns of people who received inheritances, find that liquidity constraints are an important
deterrent to engaging in entrepreneurial activities and for entrepreneurs to survive and grow in
the medium to long-run.
Evidence from developing countries suggests that despite start-up costs for small
businesses being significantly low, there is still evidence to support liquidity constraints. For
instance, Mesnard and Ravallion (2001) find the number of business start-ups in Tunisia is an
increasing function of aggregate wealth, where higher the wealth inequalities produce lower
overall rates of new business start-ups. The evidence on this later point is nonetheless
inconclusive. For instance, other studies have found a positive association between moderate
levels of inequality and entrepreneurship, thus suggesting that inequality might also encourage
business participation, particularly in developing countries (Rapoport, 2002; Naudé, 2008).
2.2 Does inequality foster entrepreneurial activity?
Other studies have instead argued for the positive role that inequality might have on
entrepreneurial activity. Within this view, references to self-made millionaires and offspring
of working class or migrants that became successful business owners are put as clear examples
that lacking access to financial markets or having limited wealth are not necessarily a binding
constraint. The critics of the importance of liquidity constraints for nascent entrepreneurship
are not oblivious that the survival of business might depend not only on the ability of the
entrepreneur but also on access to financial resources to survive (Aldrich and Fiol, 1994).
Nonetheless, sociologists such as Aldrich (1999) suggest that economic models tend to put too
much emphasis on the importance that income might play for nascent entrepreneurship.
Besides, even within the economic literature, there are scholars that suggest wide differences
10
in returns to capital or education might actually provide incentives for people to work harder
to try to take up profitable investments (Rosenzweig and Binswanger, 1993). If people are able
to take these investments, then these cases could represent important source mobility for
current and future generations (Keister, 2000; Lippmann et al., 2005). Thus, past inequality
might not necessarily be a deterrent for entrepreneurial activity nor a determinant for future
inequality.
For instance, Lippman et al. (2005) using the Global Entrepreneurship Monitor (GEM),
the same survey used in this article, find that inequality has a positive effect on overall
entrepreneurial activity. These authors argue that this positive finding is perhaps given that
those in the top of the distribution have enough financial resources to set up their business and
those at the bottom some might become self-employed rather than earning low wages.
Similarly, Lecuna (2014) finds that the Gini coefficient has a positive effect on the Total Early-
Stage Entrepreneurial Activity (TEA) as measured by the GEM survey using data from 54
countries over 2005–2009. This result is robust if the entry density is derived from the World
Bank Group Entrepreneurship Snapshot.
Given the ambiguous impact that inequality and wealth constraints might have on
entrepreneurship, some empirical studies have distinguished those businesses that were opened
out of need, and those seeking an opportunity in the market (Reynolds et al., 2005). For
instance, Lippmann et al. (2005) use the GEM survey to find that inequality has a positive
association with the entrepreneurial activity initiated out of need. Similarly, inequality is
positively associated with the total entrepreneurial activity that is initiated to seize a business
opportunity; however, this positive relationship was found up to a point, only for countries with
a Gini coefficient of 45 or less. Beyond that level, this relationship becomes negative, which
was the case for Latin American countries such as Mexico, Chile and Brazil. In these cases,
11
the high levels of inequality are negatively associated with the entrepreneurial activity that was
initiated to seize market opportunities.
In line with the discussed literature, this article seeks to test the following two
hypotheses.
Hypothesis 1: Historical levels of inequality are negatively associated with the net
entrepreneurial activity (in terms of start-up and the established firms) over time.
Hypothesis 2: Historical levels of inequality are positively associated with higher levels
of entrepreneurial activity for start-ups opened out of need. Since these start-ups are unlikely
to survive, inequality is likely to have null effects on those established firms that were
originally opened out of need.
To prevent the likely endogenous relationship between inequality and entrepreneurial
activity, unlike much of similar previous empirical literature, we use historical estimators of
income inequality for the distant past, dating back to early 1800s. This approach also allows us
to more directly test the predictions of the theoretical literature that argues initial conditions
influence the accumulation of wealth across generations, thereby affecting entrepreneurship
activity over time. Moreover, to assess whether the impact of inequality remains strong over
time, we also use other inequality indicators across different points in time.
3. Data and Methodology
3.1 Historical Statistics
The theoretical literature has highlighted that credit market imperfections exacerbate the
detrimental impact that inequality may have on investments and output over time (Aghion et
al., 1999; Banerjee and Newman, 1993; Galor and Zeira, 1993). It is argued that if a large
percentage of the population is credit-constrained, they and their offspring, in turn, will be
unable to take up potentially profitable activities, thus, reducing the number of start ups and
12
investment in human capital. As a result, a country with such conditions will remain with low
returns over time. To test these theoretical implications ideally we would need historical
statistics on the percentage of people that might have been credit and non-credit constrained.
Since there are no such historical statistics, we instead use the readily available historical
estimators of income distribution across the globe dating back to early 1800s. Our implicit
assumption is that these historical inequality measures are a good proxy for the historical ratio
of people that were credit and non-credit constrained in the distant past. This assumption is
based on contemporaneous evidence that suggests poorer people are often credit-constrained.
That is the case as poor population lack enough wealth to provide collateral or live far from a
banking institution, thus affecting their chances of obtaining credit (Baliamoune-Lutz et al.,
2011; Berg, 2013). Later on, in Section 5, as a robustness check, we show evidence that these
historical inequality measures correlate well with current measures of credit availability for the
wealthy and poor income groups.
Specifically, we use Bourguignon and Morrisson (2002) estimates of the world income
distribution spanning from the 19th century until the 20th century. These authors were the first
to provide a broad historical picture about the levels of global inequality. This study provides
income share by decile, which we use to build different inequality indicators ranging from the
traditional Gini coefficient to different ratios of income shares across deciles.
Bourguignon and Morrisson (2002) estimated the historical income distribution around
the globe using several sources of historical GDP per capita and population.3 Since these
3 To estimate the distribution of income three main variables were used: the real GDP expressed in
constant purchasing power parity (PPP) dollars; population size, and the distribution of income
summarised by nine decile income shares, and the top two vintile shares. The sources of these indicators
include the historical estimates of GDP per capita and population from Maddison (1995 cited by
Bourguignon and Morrisson 2002, p. 729), those of Berry et al. (1983a, b, cited by Bourguignon and
13
historical indicators were not available for a few countries, these authors grouped a few
countries to minimize problems of missing income distribution data. The groupings were based
on considerations of economic and historical consistency. In total, the authors estimated the
income distribution for 33 countries or groups of countries. Those countries whose weight in
the world is significant were considered individually, that is the case of China, India, Italy and
the USA to mention a few. Others such as Sub-Saharan and Latin America were broken down
into sub-groups according to their economic evolution and homogeneity. In Table A.1, in the
Appendix, we include the list of individual countries and sub-groups and for which we have
such estimators of income inequality.
Given the use of historical data these income inequality indicators should be taken as
suggestive of the levels and dynamics of historical income distribution and not necessarily at
face value. Particularly, those related to the far distant past. For this reason, we also use the
indicators by Bourguignon and Morrisson (2002) for a more recent period, including 1980s.
These recent indicators provide a more reliable picture of the recent inequality levels.
Table 1 provides the descriptive statistics for the three measures of inequality we use
across 66 countries at three points in time 1820, 1910 and 1980. Given the relative stability of
inequality over time, we focus on estimating our regressions in the next section only using
these years as inequality around other nearby years reaches same results as those presented.
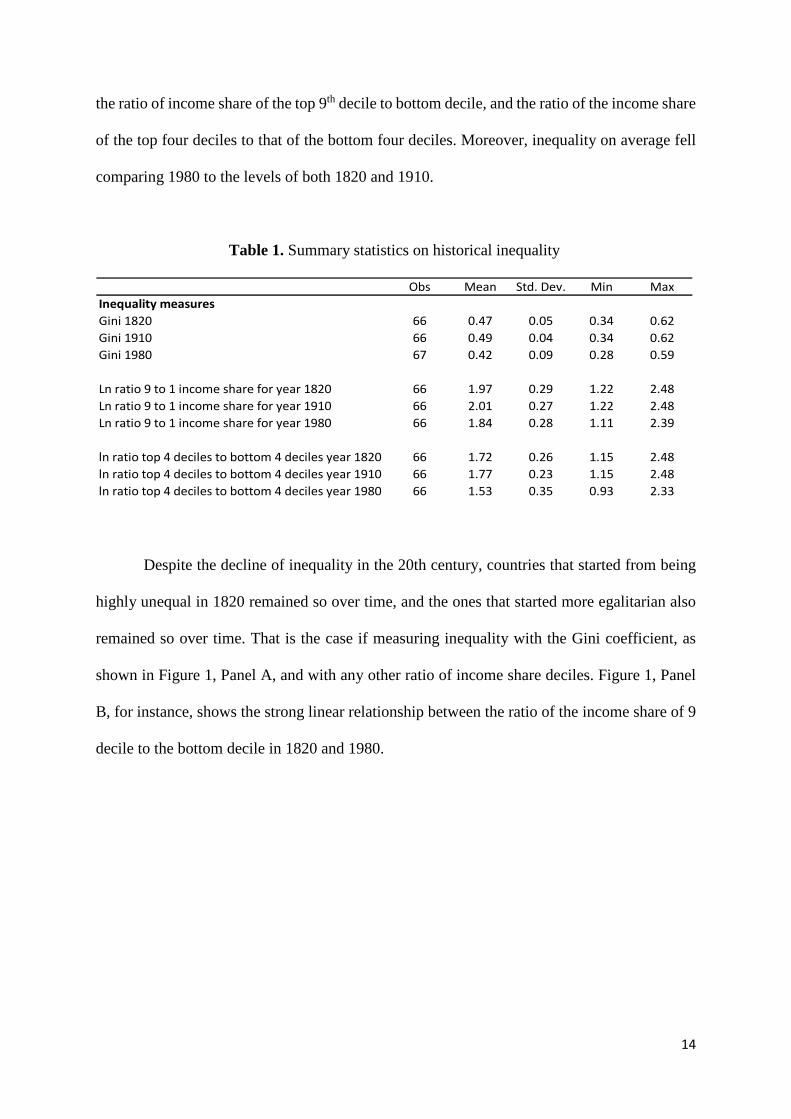
On average, inequality increased slightly from 1820 to 1910. That was the case if using
the traditional Gini coefficient or the two other measures of inequality we constructed. That is
Morrisson 2002, p. 730) for the pre- and post-World War II period. More recent data for historical data,
the USA and UK, for instance, were drawn from Lindert (2000 cited by Bourguignon and Morrisson
2002, p. 730) and for continental Europe from Morrisson (2000 cited by Bourguignon and Morrisson
2002, p. 730). To fill in the gaps in information, the authors in some cases also used growth rates
observed for comparable neighbouring countries over the same period.
14
the ratio of income share of the top 9th decile to bottom decile, and the ratio of the income share
of the top four deciles to that of the bottom four deciles. Moreover, inequality on average fell
comparing 1980 to the levels of both 1820 and 1910.
Table 1. Summary statistics on historical inequality
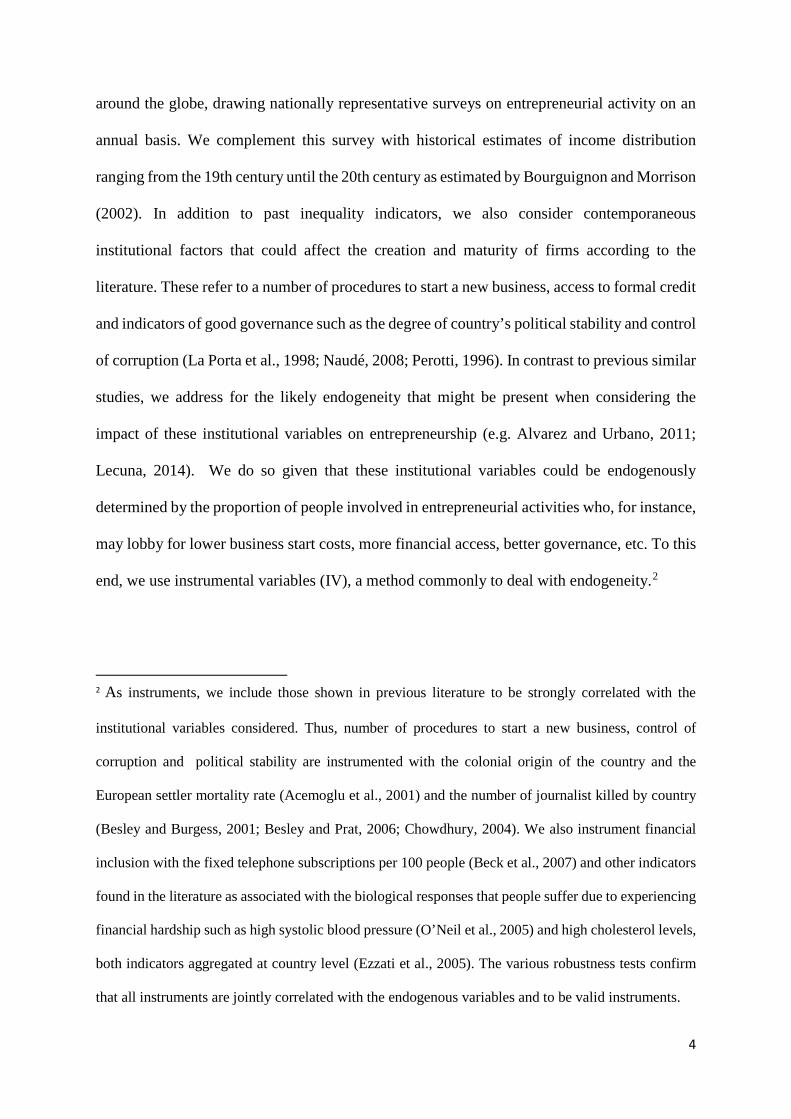
Despite the decline of inequality in the 20th century, countries that started from being
highly unequal in 1820 remained so over time, and the ones that started more egalitarian also
remained so over time. That is the case if measuring inequality with the Gini coefficient, as
shown in Figure 1, Panel A, and with any other ratio of income share deciles. Figure 1, Panel
B, for instance, shows the strong linear relationship between the ratio of the income share of 9
decile to the bottom decile in 1820 and 1980.
Obs Mean Std. Dev. Min MaxInequality measuresGini 1820 66 0.47 0.05 0.34 0.62Gini 1910 66 0.49 0.04 0.34 0.62Gini 1980 67 0.42 0.09 0.28 0.59
Ln ratio 9 to 1 income share for year 1820 66 1.97 0.29 1.22 2.48Ln ratio 9 to 1 income share for year 1910 66 2.01 0.27 1.22 2.48Ln ratio 9 to 1 income share for year 1980 66 1.84 0.28 1.11 2.39
ln ratio top 4 deciles to bottom 4 deciles year 1820 66 1.72 0.26 1.15 2.48ln ratio top 4 deciles to bottom 4 deciles year 1910 66 1.77 0.23 1.15 2.48ln ratio top 4 deciles to bottom 4 deciles year 1980 66 1.53 0.35 0.93 2.33
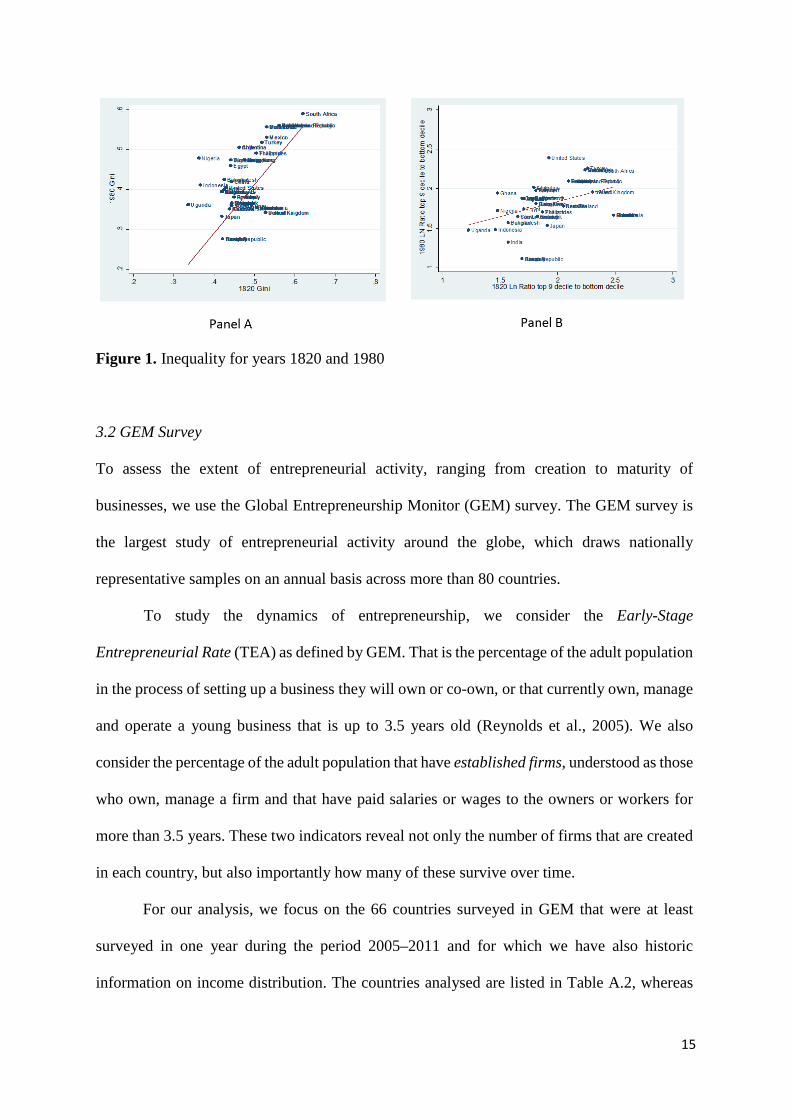
15
Figure 1. Inequality for years 1820 and 1980
3.2 GEM Survey
To assess the extent of entrepreneurial activity, ranging from creation to maturity of
businesses, we use the Global Entrepreneurship Monitor (GEM) survey. The GEM survey is
the largest study of entrepreneurial activity around the globe, which draws nationally
representative samples on an annual basis across more than 80 countries.
To study the dynamics of entrepreneurship, we consider the Early-Stage
Entrepreneurial Rate (TEA) as defined by GEM. That is the percentage of the adult population
in the process of setting up a business they will own or co-own, or that currently own, manage
and operate a young business that is up to 3.5 years old (Reynolds et al., 2005). We also
consider the percentage of the adult population that have established firms, understood as those
who own, manage a firm and that have paid salaries or wages to the owners or workers for
more than 3.5 years. These two indicators reveal not only the number of firms that are created
in each country, but also importantly how many of these survive over time.
For our analysis, we focus on the 66 countries surveyed in GEM that were at least
surveyed in one year during the period 2005–2011 and for which we have also historic
information on income distribution. The countries analysed are listed in Table A.2, whereas
16
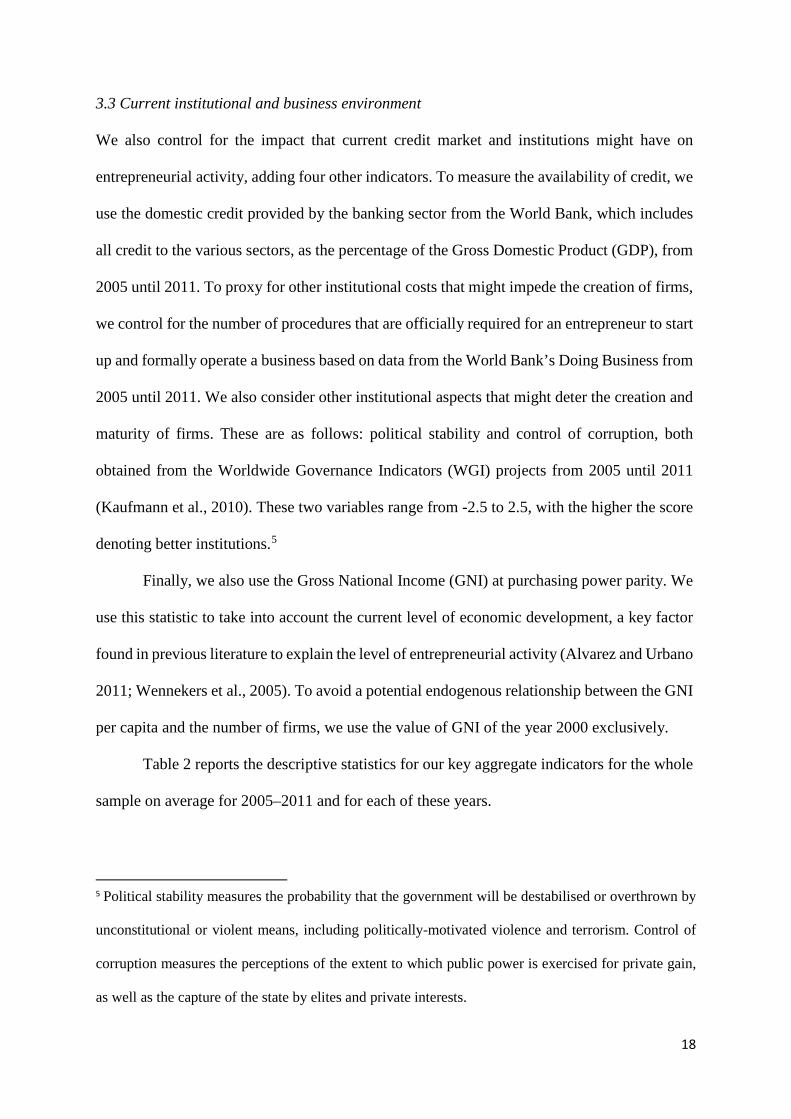
Table A.3 provides a description of the variables used and data sources.4 In our period of
analysis, on average 9.6% owned a young firm, and 7.6% had an established firm as shown in
Table 2. Crucial for our study is to test whether these contemporaneous indicators of
entrepreneurial activity are associated with the levels of income inequality prevailing in the
distant past.
Table 2. Summary statistics
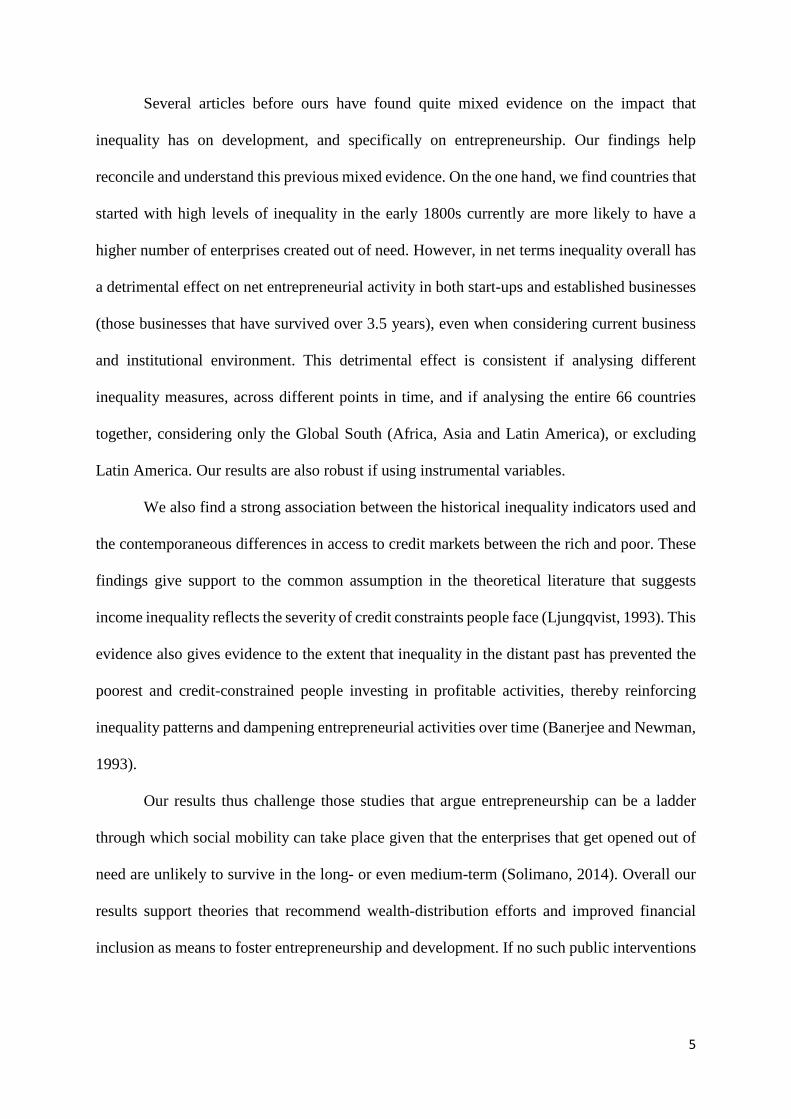
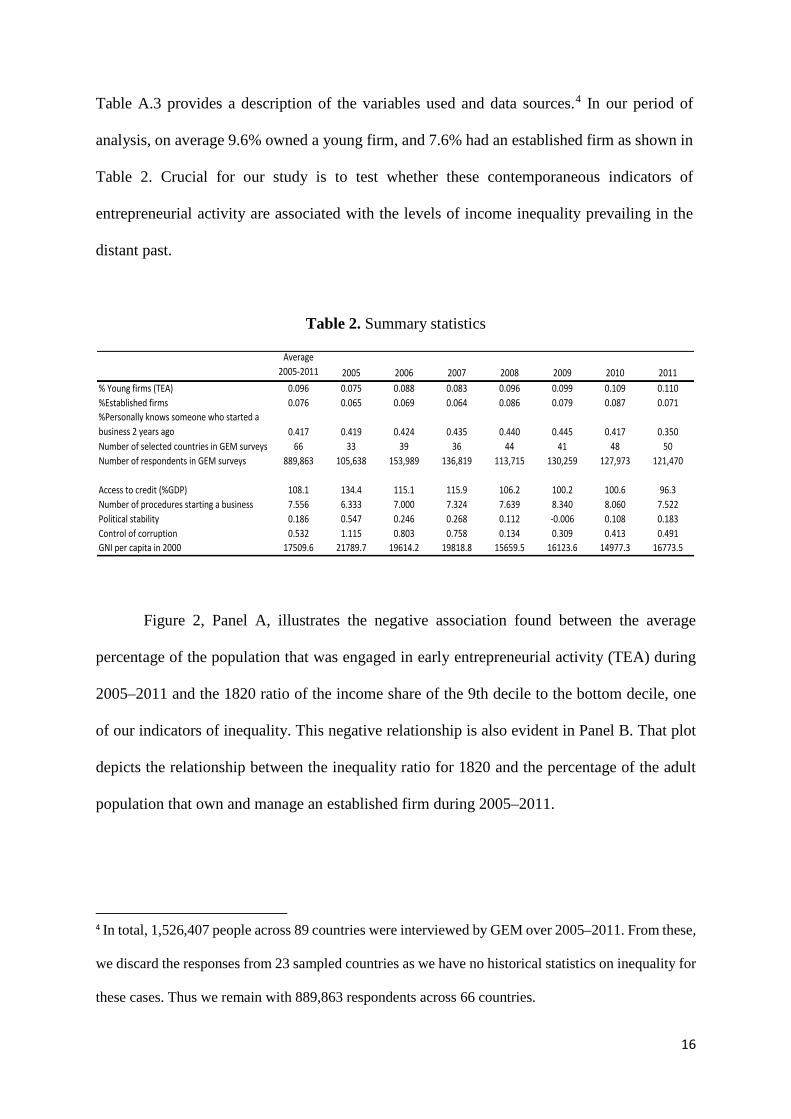
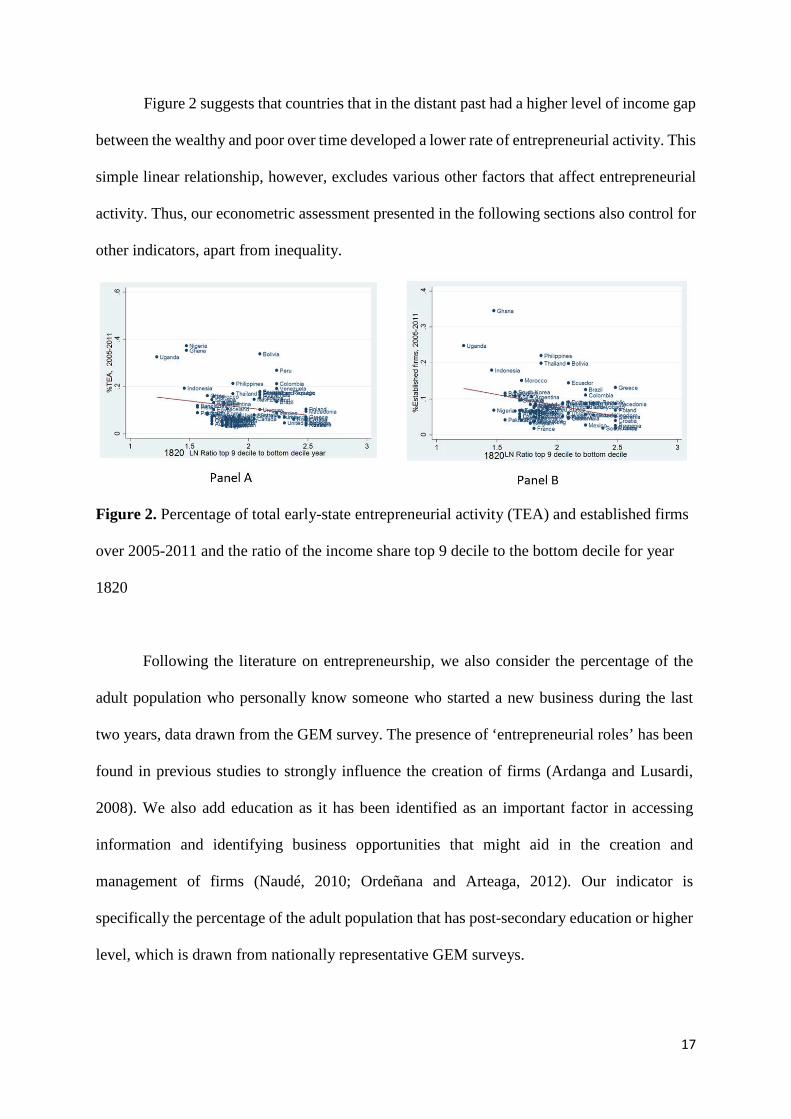
Figure 2, Panel A, illustrates the negative association found between the average
percentage of the population that was engaged in early entrepreneurial activity (TEA) during
2005–2011 and the 1820 ratio of the income share of the 9th decile to the bottom decile, one
of our indicators of inequality. This negative relationship is also evident in Panel B. That plot
depicts the relationship between the inequality ratio for 1820 and the percentage of the adult
population that own and manage an established firm during 2005–2011.
4 In total, 1,526,407 people across 89 countries were interviewed by GEM over 2005–2011. From these,
we discard the responses from 23 sampled countries as we have no historical statistics on inequality for
these cases. Thus we remain with 889,863 respondents across 66 countries.
Average 2005-2011 2005 2006 2007 2008 2009 2010 2011
% Young firms (TEA) 0.096 0.075 0.088 0.083 0.096 0.099 0.109 0.110%Established firms 0.076 0.065 0.069 0.064 0.086 0.079 0.087 0.071%Personally knows someone who started a business 2 years ago 0.417 0.419 0.424 0.435 0.440 0.445 0.417 0.350Number of selected countries in GEM surveys 66 33 39 36 44 41 48 50Number of respondents in GEM surveys 889,863 105,638 153,989 136,819 113,715 130,259 127,973 121,470
Access to credit (%GDP) 108.1 134.4 115.1 115.9 106.2 100.2 100.6 96.3Number of procedures starting a business 7.556 6.333 7.000 7.324 7.639 8.340 8.060 7.522Political stability 0.186 0.547 0.246 0.268 0.112 -0.006 0.108 0.183Control of corruption 0.532 1.115 0.803 0.758 0.134 0.309 0.413 0.491GNI per capita in 2000 17509.6 21789.7 19614.2 19818.8 15659.5 16123.6 14977.3 16773.5
17
Figure 2 suggests that countries that in the distant past had a higher level of income gap
between the wealthy and poor over time developed a lower rate of entrepreneurial activity. This
simple linear relationship, however, excludes various other factors that affect entrepreneurial
activity. Thus, our econometric assessment presented in the following sections also control for
other indicators, apart from inequality.
Figure 2. Percentage of total early-state entrepreneurial activity (TEA) and established firms
over 2005-2011 and the ratio of the income share top 9 decile to the bottom decile for year
1820
Following the literature on entrepreneurship, we also consider the percentage of the
adult population who personally know someone who started a new business during the last
two years, data drawn from the GEM survey. The presence of ‘entrepreneurial roles’ has been
found in previous studies to strongly influence the creation of firms (Ardanga and Lusardi,
2008). We also add education as it has been identified as an important factor in accessing
information and identifying business opportunities that might aid in the creation and
management of firms (Naudé, 2010; Ordeñana and Arteaga, 2012). Our indicator is
specifically the percentage of the adult population that has post-secondary education or higher
level, which is drawn from nationally representative GEM surveys.
18
3.3 Current institutional and business environment
We also control for the impact that current credit market and institutions might have on
entrepreneurial activity, adding four other indicators. To measure the availability of credit, we
use the domestic credit provided by the banking sector from the World Bank, which includes
all credit to the various sectors, as the percentage of the Gross Domestic Product (GDP), from
2005 until 2011. To proxy for other institutional costs that might impede the creation of firms,
we control for the number of procedures that are officially required for an entrepreneur to start
up and formally operate a business based on data from the World Bank’s Doing Business from
2005 until 2011. We also consider other institutional aspects that might deter the creation and
maturity of firms. These are as follows: political stability and control of corruption, both
obtained from the Worldwide Governance Indicators (WGI) projects from 2005 until 2011
(Kaufmann et al., 2010). These two variables range from -2.5 to 2.5, with the higher the score
denoting better institutions.5
Finally, we also use the Gross National Income (GNI) at purchasing power parity. We
use this statistic to take into account the current level of economic development, a key factor
found in previous literature to explain the level of entrepreneurial activity (Alvarez and Urbano
2011; Wennekers et al., 2005). To avoid a potential endogenous relationship between the GNI
per capita and the number of firms, we use the value of GNI of the year 2000 exclusively.
Table 2 reports the descriptive statistics for our key aggregate indicators for the whole
sample on average for 2005–2011 and for each of these years.
5 Political stability measures the probability that the government will be destabilised or overthrown by
unconstitutional or violent means, including politically-motivated violence and terrorism. Control of
corruption measures the perceptions of the extent to which public power is exercised for private gain,
as well as the capture of the state by elites and private interests.
19
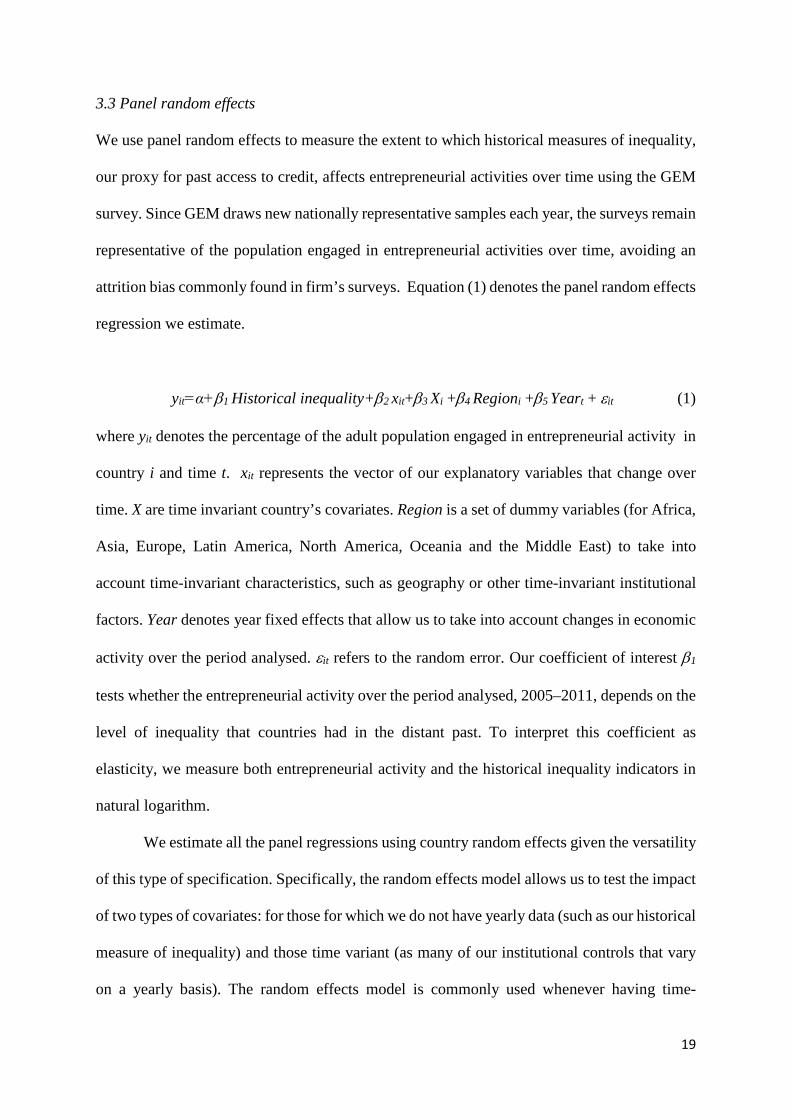
3.3 Panel random effects
We use panel random effects to measure the extent to which historical measures of inequality,
our proxy for past access to credit, affects entrepreneurial activities over time using the GEM
survey. Since GEM draws new nationally representative samples each year, the surveys remain
representative of the population engaged in entrepreneurial activities over time, avoiding an
attrition bias commonly found in firm’s surveys. Equation (1) denotes the panel random effects
regression we estimate.
yit=α+β1 Historical inequality+β2 xit+β3 Xi +β4 Regioni +β5 Yeart + εit (1)
where yit denotes the percentage of the adult population engaged in entrepreneurial activity in
country i and time t. xit represents the vector of our explanatory variables that change over
time. X are time invariant country’s covariates. Region is a set of dummy variables (for Africa,
Asia, Europe, Latin America, North America, Oceania and the Middle East) to take into
account time-invariant characteristics, such as geography or other time-invariant institutional
factors. Year denotes year fixed effects that allow us to take into account changes in economic
activity over the period analysed. εit refers to the random error. Our coefficient of interest β1
tests whether the entrepreneurial activity over the period analysed, 2005–2011, depends on the
level of inequality that countries had in the distant past. To interpret this coefficient as
elasticity, we measure both entrepreneurial activity and the historical inequality indicators in
natural logarithm.
We estimate all the panel regressions using country random effects given the versatility
of this type of specification. Specifically, the random effects model allows us to test the impact
of two types of covariates: for those for which we do not have yearly data (such as our historical
measure of inequality) and those time variant (as many of our institutional controls that vary
on a yearly basis). The random effects model is commonly used whenever having time-
20
invariant explanatory variables (e.g. our historical measure of inequality) that are of great
theoretical importance to test as the effects of this type of variables are impossible to measure
in panel fixed effects model (Mehmetoglu and Jakobsen 2017, p. 251). The random effects
model yields unbiased and efficient estimates provided that there is no (or little) covariance
between the error term and the explanatory variables, as we show that is our case in section 5.
Moreover, the Hausman’s specification tests suggest we should adopt the random specification
as yields consistent and more efficient estimates than the fixed effects specification.6
4. Econometric Results
4.1 To what extent historical inequality affects contemporaneous entrepreneurial activity?
Table 3 reports the panel random country effects regression of the log of entrepreneurial
activity on historical inequality using robust standard errors across all models. Columns (1) to
(4) focus on the log of the percentage of people engaged in early entrepreneurial activity (TEA).
Columns (5) to (8) instead focus on the log of the percentage of people engaged in established
business. As a measure of historical inequality, we use the log of the ratio of the income share
of the top 9th decile and the bottom decile. We separately test the effects of this indicator if
measured for the year 1820, 1910 and 1980.
6 We have unbalanced panel regression given that the countries analysed do not appear across every
single year analysed. The Hausman test when using the log of TEA as our dependent variable is equal
to χ2=10.18 with a probability> χ2=0.6002, which accepts the null hypothesis that states the random
effects and fixed effects are both consistent, but fixed effects is inefficient; thus the random specification
should be preferred. Similarly, the Hausman test when using the log of the percentage of the population
that have an established business as our dependent variable is equal to χ2=11.39 with a probability>
χ2=0.4958.
21
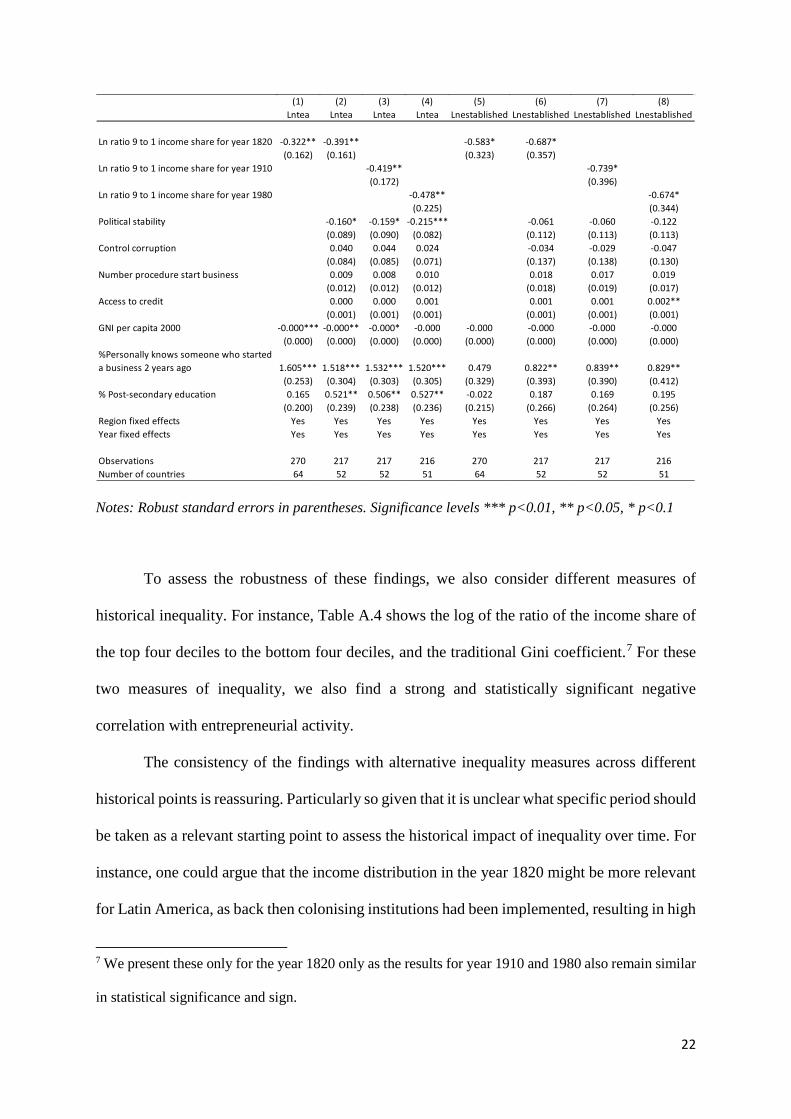
Confirming our first hypothesis, all models estimated show there is a strong and
statistically significant negative correlation between the measures of historical inequality and
entrepreneurial activity conducted over 2005–2011. That is, the larger the income share held
by the wealthy relative to the poor the lower the share of people involved in young or
established firms. For instance, a 1% increase in the historic ratio of wealthy to poor reduces
the proportion of people involved in young firms by around 4% and the proportion of people
involved in established firms by 6% in established firms. These effects are quite similar for the
historical measures of inequality of 1820, 1910 and 1980, albeit higher for more recent
indicators, suggesting that the detrimental impact of inequality increases over time. These
results are also consistent if controlling for current credit and institutional factors or not, as
seen in columns (1) and (5). Interestingly, the level of entrepreneurial activity is not
significantly affected by the contemporaneous access to credit or by the level of GNI per capita
in 2000. We also explored whether the absolute level of GNI in the distant past (in 1820)
affected current entrepreneurial activity, finding no effect thus the results are not shown in the
table. These findings suggest that current entrepreneurial activity is more strongly dependent
of past income distribution (our proxy for how credit was distributed among the poor and rich)
than our measures of contemporaneous levels of credit or GNI.
Table 3. Entrepreneurial activity during 2005-2011 and historical inequality, panel random
effects
22
Notes: Robust standard errors in parentheses. Significance levels *** p<0.01, ** p<0.05, * p<0.1
To assess the robustness of these findings, we also consider different measures of
historical inequality. For instance, Table A.4 shows the log of the ratio of the income share of
the top four deciles to the bottom four deciles, and the traditional Gini coefficient.7 For these
two measures of inequality, we also find a strong and statistically significant negative
correlation with entrepreneurial activity.
The consistency of the findings with alternative inequality measures across different
historical points is reassuring. Particularly so given that it is unclear what specific period should
be taken as a relevant starting point to assess the historical impact of inequality over time. For
instance, one could argue that the income distribution in the year 1820 might be more relevant
for Latin America, as back then colonising institutions had been implemented, resulting in high
7 We present these only for the year 1820 only as the results for year 1910 and 1980 also remain similar
in statistical significance and sign.
(1) (2) (3) (4) (5) (6) (7) (8)Lntea Lntea Lntea Lntea Lnestablished Lnestablished Lnestablished Lnestablished
Ln ratio 9 to 1 income share for year 1820 -0.322** -0.391** -0.583* -0.687*(0.162) (0.161) (0.323) (0.357)
Ln ratio 9 to 1 income share for year 1910 -0.419** -0.739*(0.172) (0.396)
Ln ratio 9 to 1 income share for year 1980 -0.478** -0.674*(0.225) (0.344)
Political stability -0.160* -0.159* -0.215*** -0.061 -0.060 -0.122(0.089) (0.090) (0.082) (0.112) (0.113) (0.113)
Control corruption 0.040 0.044 0.024 -0.034 -0.029 -0.047(0.084) (0.085) (0.071) (0.137) (0.138) (0.130)
Number procedure start business 0.009 0.008 0.010 0.018 0.017 0.019(0.012) (0.012) (0.012) (0.018) (0.019) (0.017)
Access to credit 0.000 0.000 0.001 0.001 0.001 0.002**(0.001) (0.001) (0.001) (0.001) (0.001) (0.001)
GNI per capita 2000 -0.000*** -0.000** -0.000* -0.000 -0.000 -0.000 -0.000 -0.000(0.000) (0.000) (0.000) (0.000) (0.000) (0.000) (0.000) (0.000)
%Personally knows someone who started a business 2 years ago 1.605*** 1.518*** 1.532*** 1.520*** 0.479 0.822** 0.839** 0.829**
(0.253) (0.304) (0.303) (0.305) (0.329) (0.393) (0.390) (0.412)% Post-secondary education 0.165 0.521** 0.506** 0.527** -0.022 0.187 0.169 0.195
(0.200) (0.239) (0.238) (0.236) (0.215) (0.266) (0.264) (0.256)Region fixed effects Yes Yes Yes Yes Yes Yes Yes YesYear fixed effects Yes Yes Yes Yes Yes Yes Yes Yes
Observations 270 217 217 216 270 217 217 216Number of countries 64 52 52 51 64 52 52 51
23
levels of inequality.8 Similarly, 1820 might also be quite relevant for Europe as this period
witnessed the transition to new manufacturing processes that lead to the industrial revolution.
Thus, the income distribution back then provided crucial to decide how many people could set
up businesses or become wage-earners. Although one could argue that perhaps the most
relevant starting point for Africa is closer to 1920 given that by then much of the continent had
been colonised by European powers, one should also consider that pre-colonial institutions
have been linked to the slow development of the region (Michalopoulos and Papaioannou,
2011). Regardless of what initial point might be regarded as more relevant for Africa, the
inequality distribution for the continent had very little changes from 1820 to 1910, and
afterward. The lack of significant changes might well be because many pre-colonial local elites
were used by colonisers to implement their rule, preserving their preferential status. The small
tax-redistributive nature of independent African governments also explain the low investment
in public goods in the region (Acemoglu and Robinso, 2010).
With regard to the controls used, we find that political stability also has a strong and
negative association with entrepreneurial activity, but only for young firms, as shown in Table
3. There is not much evidence that our measures of the number of procedures required to start
a business, control of corruption or domestic credit affect the creation of firms. In general, the
findings of political stability and lack of effect on our measure of credit markets coincides with
those of Alvarez and Urbano (2011) who also used these indicators to explore the association
between these variables and entrepreneurial activities for young firms using the GEM survey.
We also find education has a positive effect for early-stage entrepreneurial activity, but
no effect on established firms. This mixed evidence has also been found in other studies. For
8 Engerman and Sokoloff (2005) stress that the colonial institutions in the region perpetuated unequal
opportunities given the low taxes for the wealthy and low public investment in education, and
infrastructure conducive to (inclusive) growth.
24
instance, those that find a positive correlation between education and entrepreneurial activity
argue that education helps people identify business opportunities, and as such, higher education
levels produce higher engagement in new business opportunities (Simón-Moya et al., 2014).
However, for running established business entrepreneurial-specific knowledge and previous
business experience is more relevant than simply having higher a level of education attainment
(Man et al., 2002).
The estimated coefficient of knowing someone who started a business two years ago is
positive and statistically significant. This finding is consistent with the existing literature on
entrepreneurial role models (Krueger, 1993; Shapero and Sokol, 1982). We also find a negative
(albeit quite weak) and statistically significant relationship between the GNI per capita for
2000, which we use as a baseline for development level, and entrepreneurial activity,
particularly in young firms. This negative association has also been found in previous studies
(Alvarez and Urbano 2011; Reynolds et al., 2001).9 A potential explanation for this finding is
that as countries develop, the percentage of people who needs to open a business out of need
decreases.
4.2 Does historical inequality fosters out of need entrepreneurship?
We re-run our analysis to test our second hypothesis. However, this time we focus only on the
percentage of people who stated in GEM survey opened their business out of need as ‘there
were no better choices for work’. Roughly a third of entrepreneurs engaged in young firms and
in established firms stated that out of need was the reason they engaged in their current
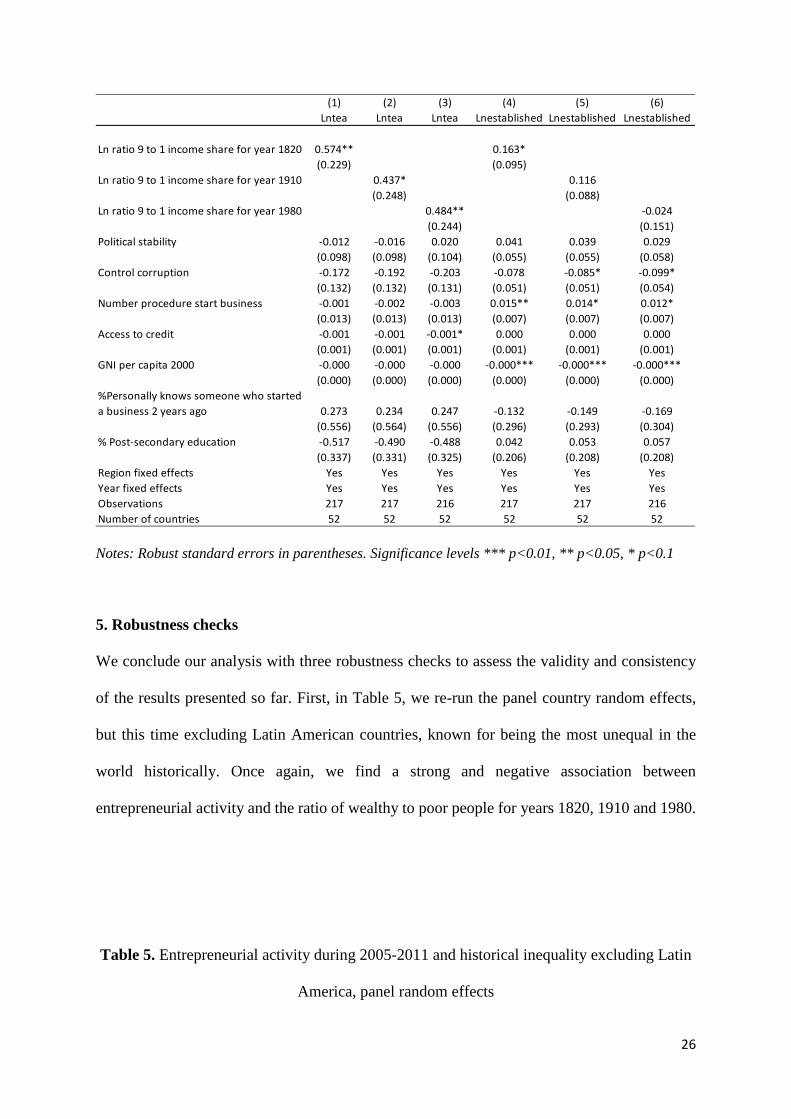
business. As expected, Table 4 shows a positive and statistically significant relationship
9 We also find this weak negative relationship if using instead the absolute level of GNI in the distant
past (in 1820). These results are not presented as the regression coefficients are nearly equal to zero.
25
between our historical measure of inequality and the percentage of people involved in these
young firms. That is, as expected, the higher income shares of the wealthy relative to the poor
produce higher shares of people that will open firms out of need. There is however mixed
evidence about this relationship for established firms (firms that have survived for longer than
3.5 years). As column (4) shows, this relationship with inequality is positive, but are no longer
statistically significant in columns (5) and (6). These findings suggest that although more
unequal countries have a higher probability of people opening firms out of need, these might
not survive in the short and medium-run; thus, our lack of association between inequality and
established firms opened out of need. Overall, these findings are consistent with the high
entrepreneurial activity of young firms noted in highly unequal developing countries, where
although quite a few firms are opened each year, not many of them survive (Naudé, 2010).
Table 4. Firms opened for need during 2005-2011 and historical inequality, panel random
effects
26
Notes: Robust standard errors in parentheses. Significance levels *** p<0.01, ** p<0.05, * p<0.1
5. Robustness checks
We conclude our analysis with three robustness checks to assess the validity and consistency
of the results presented so far. First, in Table 5, we re-run the panel country random effects,
but this time excluding Latin American countries, known for being the most unequal in the
world historically. Once again, we find a strong and negative association between
entrepreneurial activity and the ratio of wealthy to poor people for years 1820, 1910 and 1980.
Table 5. Entrepreneurial activity during 2005-2011 and historical inequality excluding Latin
America, panel random effects
(1) (2) (3) (4) (5) (6)Lntea Lntea Lntea Lnestablished Lnestablished Lnestablished
Ln ratio 9 to 1 income share for year 1820 0.574** 0.163*(0.229) (0.095)
Ln ratio 9 to 1 income share for year 1910 0.437* 0.116(0.248) (0.088)
Ln ratio 9 to 1 income share for year 1980 0.484** -0.024(0.244) (0.151)
Political stability -0.012 -0.016 0.020 0.041 0.039 0.029(0.098) (0.098) (0.104) (0.055) (0.055) (0.058)
Control corruption -0.172 -0.192 -0.203 -0.078 -0.085* -0.099*(0.132) (0.132) (0.131) (0.051) (0.051) (0.054)
Number procedure start business -0.001 -0.002 -0.003 0.015** 0.014* 0.012*(0.013) (0.013) (0.013) (0.007) (0.007) (0.007)
Access to credit -0.001 -0.001 -0.001* 0.000 0.000 0.000(0.001) (0.001) (0.001) (0.001) (0.001) (0.001)
GNI per capita 2000 -0.000 -0.000 -0.000 -0.000*** -0.000*** -0.000***(0.000) (0.000) (0.000) (0.000) (0.000) (0.000)
%Personally knows someone who started a business 2 years ago 0.273 0.234 0.247 -0.132 -0.149 -0.169
(0.556) (0.564) (0.556) (0.296) (0.293) (0.304)% Post-secondary education -0.517 -0.490 -0.488 0.042 0.053 0.057
(0.337) (0.331) (0.325) (0.206) (0.208) (0.208)Region fixed effects Yes Yes Yes Yes Yes YesYear fixed effects Yes Yes Yes Yes Yes YesObservations 217 217 216 217 217 216Number of countries 52 52 52 52 52 52
27
Notes: Robust standard errors in parentheses. Significance levels *** p<0.01, ** p<0.05, * p<0.1
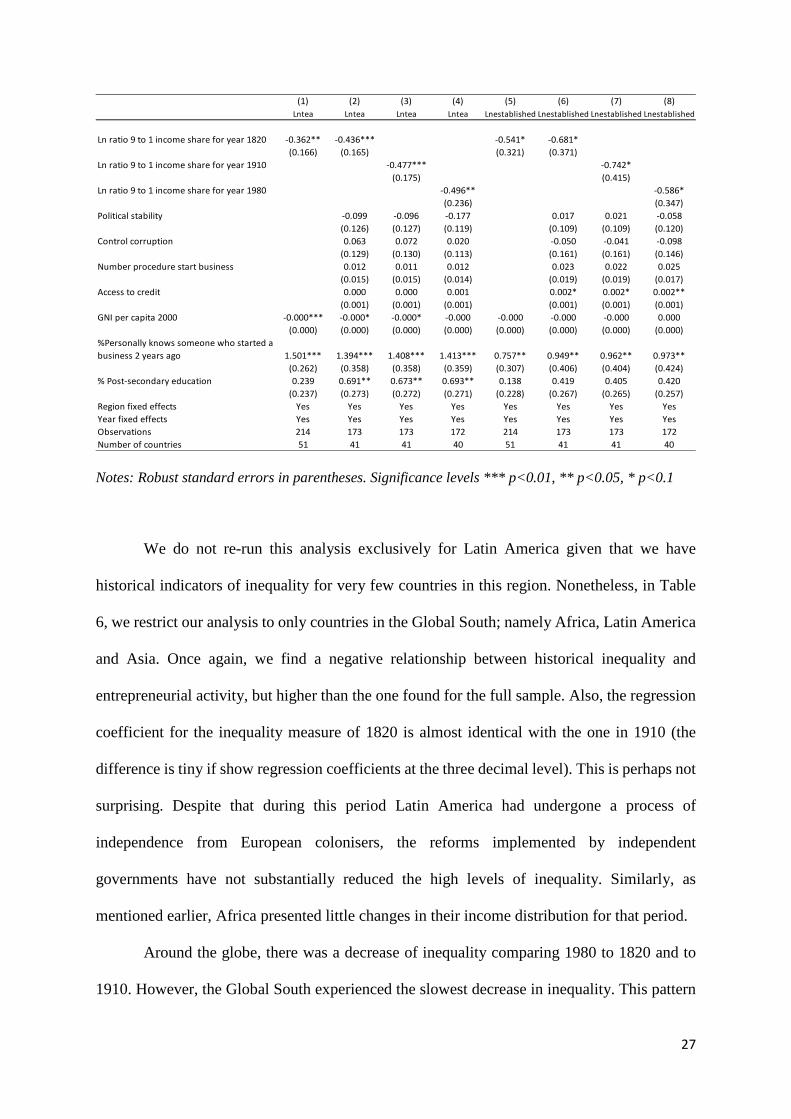
We do not re-run this analysis exclusively for Latin America given that we have
historical indicators of inequality for very few countries in this region. Nonetheless, in Table
6, we restrict our analysis to only countries in the Global South; namely Africa, Latin America
and Asia. Once again, we find a negative relationship between historical inequality and
entrepreneurial activity, but higher than the one found for the full sample. Also, the regression
coefficient for the inequality measure of 1820 is almost identical with the one in 1910 (the
difference is tiny if show regression coefficients at the three decimal level). This is perhaps not
surprising. Despite that during this period Latin America had undergone a process of
independence from European colonisers, the reforms implemented by independent
governments have not substantially reduced the high levels of inequality. Similarly, as
mentioned earlier, Africa presented little changes in their income distribution for that period.
Around the globe, there was a decrease of inequality comparing 1980 to 1820 and to
1910. However, the Global South experienced the slowest decrease in inequality. This pattern
(1) (2) (3) (4) (5) (6) (7) (8)Lntea Lntea Lntea Lntea Lnestablished Lnestablished Lnestablished Lnestablished
Ln ratio 9 to 1 income share for year 1820 -0.362** -0.436*** -0.541* -0.681*(0.166) (0.165) (0.321) (0.371)
Ln ratio 9 to 1 income share for year 1910 -0.477*** -0.742*(0.175) (0.415)
Ln ratio 9 to 1 income share for year 1980 -0.496** -0.586*(0.236) (0.347)
Political stability -0.099 -0.096 -0.177 0.017 0.021 -0.058(0.126) (0.127) (0.119) (0.109) (0.109) (0.120)
Control corruption 0.063 0.072 0.020 -0.050 -0.041 -0.098(0.129) (0.130) (0.113) (0.161) (0.161) (0.146)
Number procedure start business 0.012 0.011 0.012 0.023 0.022 0.025(0.015) (0.015) (0.014) (0.019) (0.019) (0.017)
Access to credit 0.000 0.000 0.001 0.002* 0.002* 0.002**(0.001) (0.001) (0.001) (0.001) (0.001) (0.001)
GNI per capita 2000 -0.000*** -0.000* -0.000* -0.000 -0.000 -0.000 -0.000 0.000(0.000) (0.000) (0.000) (0.000) (0.000) (0.000) (0.000) (0.000)
%Personally knows someone who started a business 2 years ago 1.501*** 1.394*** 1.408*** 1.413*** 0.757** 0.949** 0.962** 0.973**
(0.262) (0.358) (0.358) (0.359) (0.307) (0.406) (0.404) (0.424)% Post-secondary education 0.239 0.691** 0.673** 0.693** 0.138 0.419 0.405 0.420
(0.237) (0.273) (0.272) (0.271) (0.228) (0.267) (0.265) (0.257)Region fixed effects Yes Yes Yes Yes Yes Yes Yes YesYear fixed effects Yes Yes Yes Yes Yes Yes Yes YesObservations 214 173 173 172 214 173 173 172Number of countries 51 41 41 40 51 41 41 40
28
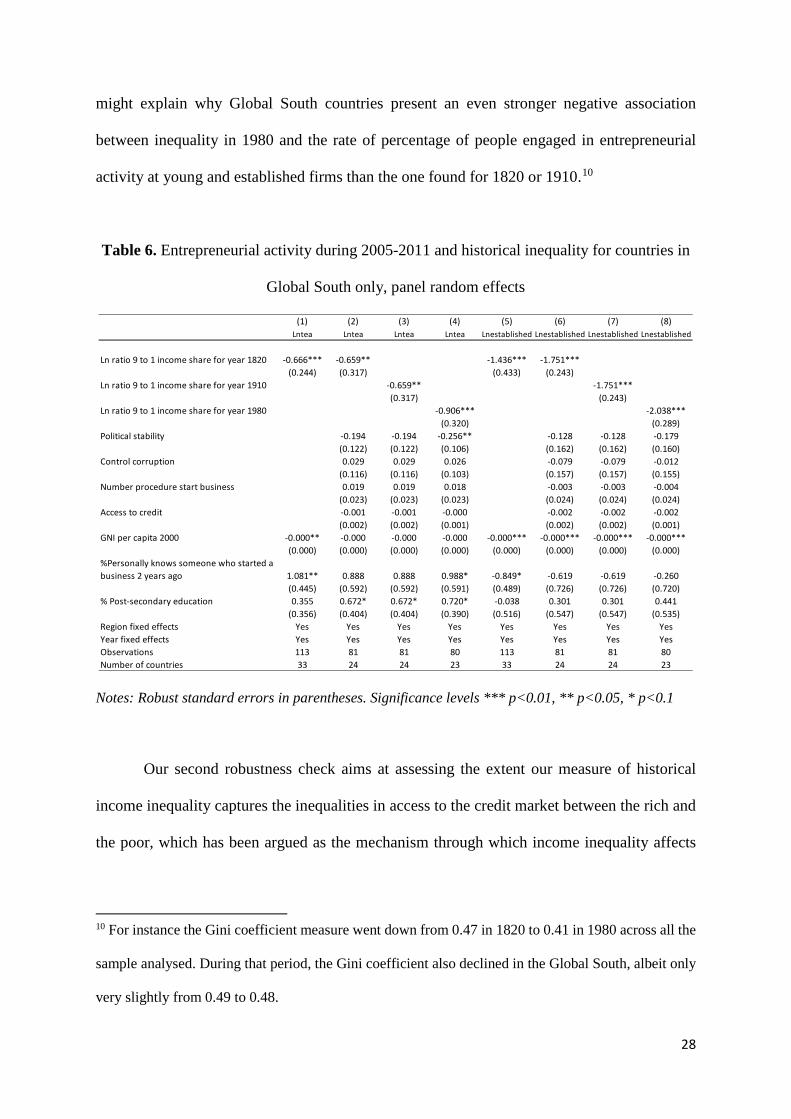
might explain why Global South countries present an even stronger negative association
between inequality in 1980 and the rate of percentage of people engaged in entrepreneurial
activity at young and established firms than the one found for 1820 or 1910.10
Table 6. Entrepreneurial activity during 2005-2011 and historical inequality for countries in
Global South only, panel random effects
Notes: Robust standard errors in parentheses. Significance levels *** p<0.01, ** p<0.05, * p<0.1
Our second robustness check aims at assessing the extent our measure of historical
income inequality captures the inequalities in access to the credit market between the rich and
the poor, which has been argued as the mechanism through which income inequality affects
10 For instance the Gini coefficient measure went down from 0.47 in 1820 to 0.41 in 1980 across all the
sample analysed. During that period, the Gini coefficient also declined in the Global South, albeit only
very slightly from 0.49 to 0.48.
(1) (2) (3) (4) (5) (6) (7) (8)Lntea Lntea Lntea Lntea Lnestablished Lnestablished Lnestablished Lnestablished
Ln ratio 9 to 1 income share for year 1820 -0.666*** -0.659** -1.436*** -1.751***(0.244) (0.317) (0.433) (0.243)
Ln ratio 9 to 1 income share for year 1910 -0.659** -1.751***(0.317) (0.243)
Ln ratio 9 to 1 income share for year 1980 -0.906*** -2.038***(0.320) (0.289)
Political stability -0.194 -0.194 -0.256** -0.128 -0.128 -0.179(0.122) (0.122) (0.106) (0.162) (0.162) (0.160)
Control corruption 0.029 0.029 0.026 -0.079 -0.079 -0.012(0.116) (0.116) (0.103) (0.157) (0.157) (0.155)
Number procedure start business 0.019 0.019 0.018 -0.003 -0.003 -0.004(0.023) (0.023) (0.023) (0.024) (0.024) (0.024)
Access to credit -0.001 -0.001 -0.000 -0.002 -0.002 -0.002(0.002) (0.002) (0.001) (0.002) (0.002) (0.001)
GNI per capita 2000 -0.000** -0.000 -0.000 -0.000 -0.000*** -0.000*** -0.000*** -0.000***(0.000) (0.000) (0.000) (0.000) (0.000) (0.000) (0.000) (0.000)
%Personally knows someone who started a business 2 years ago 1.081** 0.888 0.888 0.988* -0.849* -0.619 -0.619 -0.260
(0.445) (0.592) (0.592) (0.591) (0.489) (0.726) (0.726) (0.720)% Post-secondary education 0.355 0.672* 0.672* 0.720* -0.038 0.301 0.301 0.441
(0.356) (0.404) (0.404) (0.390) (0.516) (0.547) (0.547) (0.535)Region fixed effects Yes Yes Yes Yes Yes Yes Yes YesYear fixed effects Yes Yes Yes Yes Yes Yes Yes YesObservations 113 81 81 80 113 81 81 80Number of countries 33 24 24 23 33 24 24 23
29
entrepreneurial activity over time. To the best of our knowledge, there are no historical
estimators on access to credit by income groups across countries. There is scant evidence on
this even for the latest decades. Thus, we use the recently released data on Financial Inclusion
by the World Bank. This dataset shows the percentage of loans given in the previous year to
the highest 60% income richest group and the bottom 40% income poorest group. This
information is only available for 49 of the countries for which we also have historical indicators
of income distribution, and unfortunately only have information for 2011 (the last year for
which the GEM survey is publically accessible). Bearing in mind these limitations, in Table 7,
we show that on average, roughly the same percentage of rich and poor people received a loan
in the previous year, but with important differences across countries.
Table 7. Summary statistics on financial inclusion for 2011
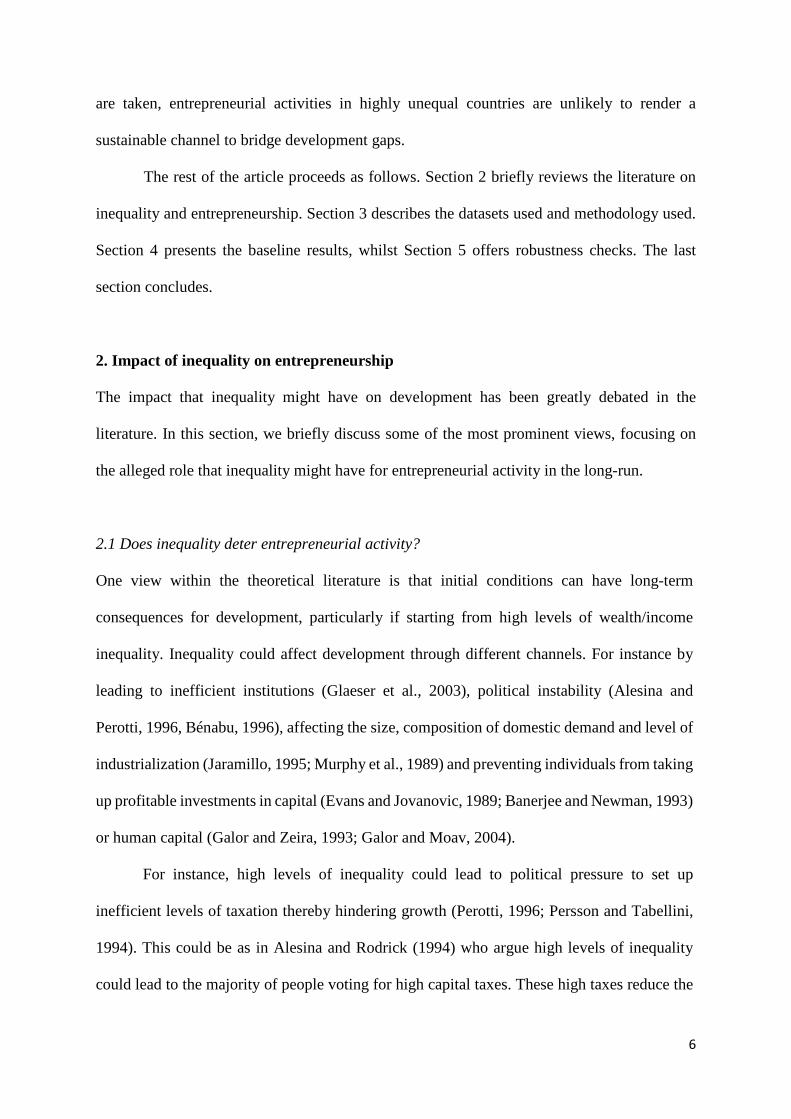
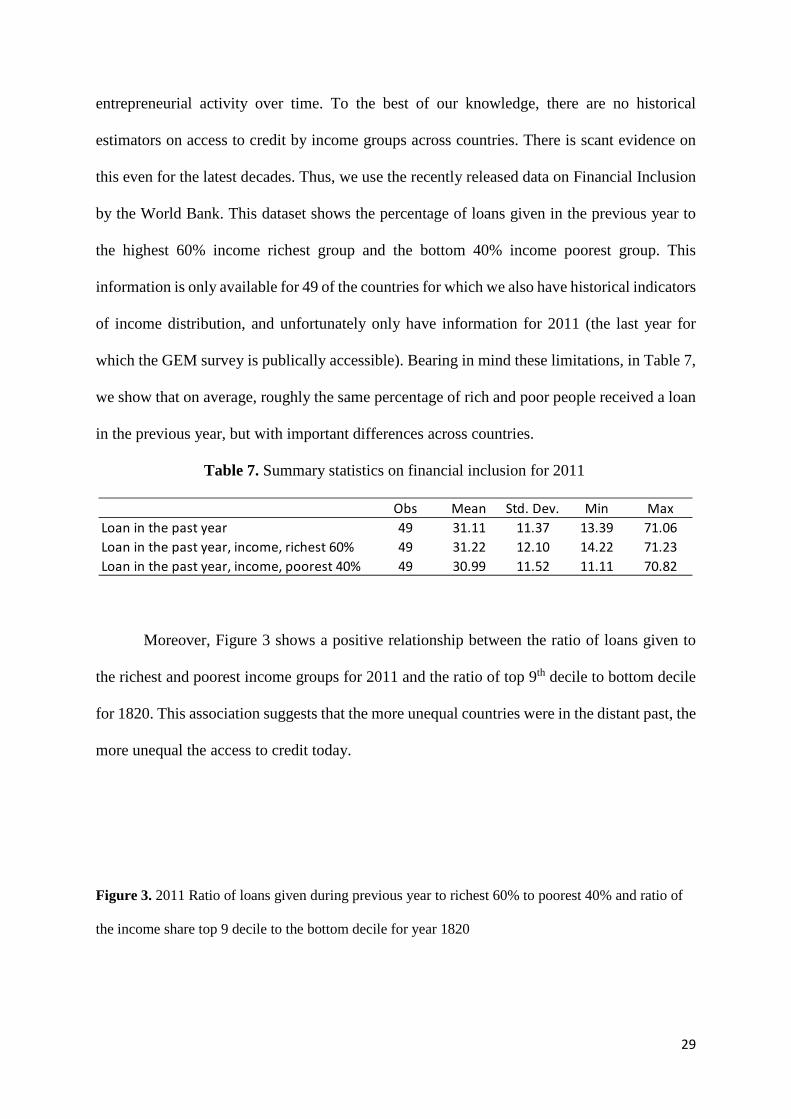
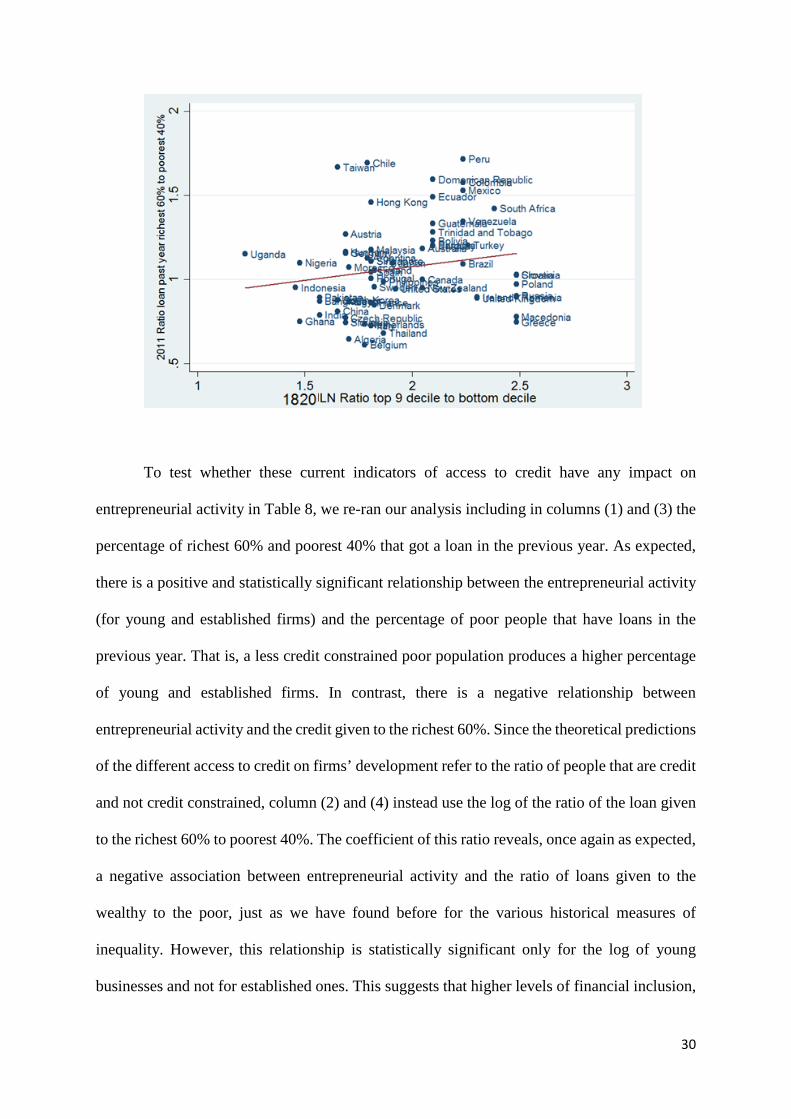
Moreover, Figure 3 shows a positive relationship between the ratio of loans given to
the richest and poorest income groups for 2011 and the ratio of top 9th decile to bottom decile
for 1820. This association suggests that the more unequal countries were in the distant past, the
more unequal the access to credit today.
Figure 3. 2011 Ratio of loans given during previous year to richest 60% to poorest 40% and ratio of
the income share top 9 decile to the bottom decile for year 1820
Obs Mean Std. Dev. Min MaxLoan in the past year 49 31.11 11.37 13.39 71.06Loan in the past year, income, richest 60% 49 31.22 12.10 14.22 71.23Loan in the past year, income, poorest 40% 49 30.99 11.52 11.11 70.82
30
To test whether these current indicators of access to credit have any impact on
entrepreneurial activity in Table 8, we re-ran our analysis including in columns (1) and (3) the
percentage of richest 60% and poorest 40% that got a loan in the previous year. As expected,
there is a positive and statistically significant relationship between the entrepreneurial activity
(for young and established firms) and the percentage of poor people that have loans in the
previous year. That is, a less credit constrained poor population produces a higher percentage
of young and established firms. In contrast, there is a negative relationship between
entrepreneurial activity and the credit given to the richest 60%. Since the theoretical predictions
of the different access to credit on firms’ development refer to the ratio of people that are credit
and not credit constrained, column (2) and (4) instead use the log of the ratio of the loan given
to the richest 60% to poorest 40%. The coefficient of this ratio reveals, once again as expected,
a negative association between entrepreneurial activity and the ratio of loans given to the
wealthy to the poor, just as we have found before for the various historical measures of
inequality. However, this relationship is statistically significant only for the log of young
businesses and not for established ones. This suggests that higher levels of financial inclusion,
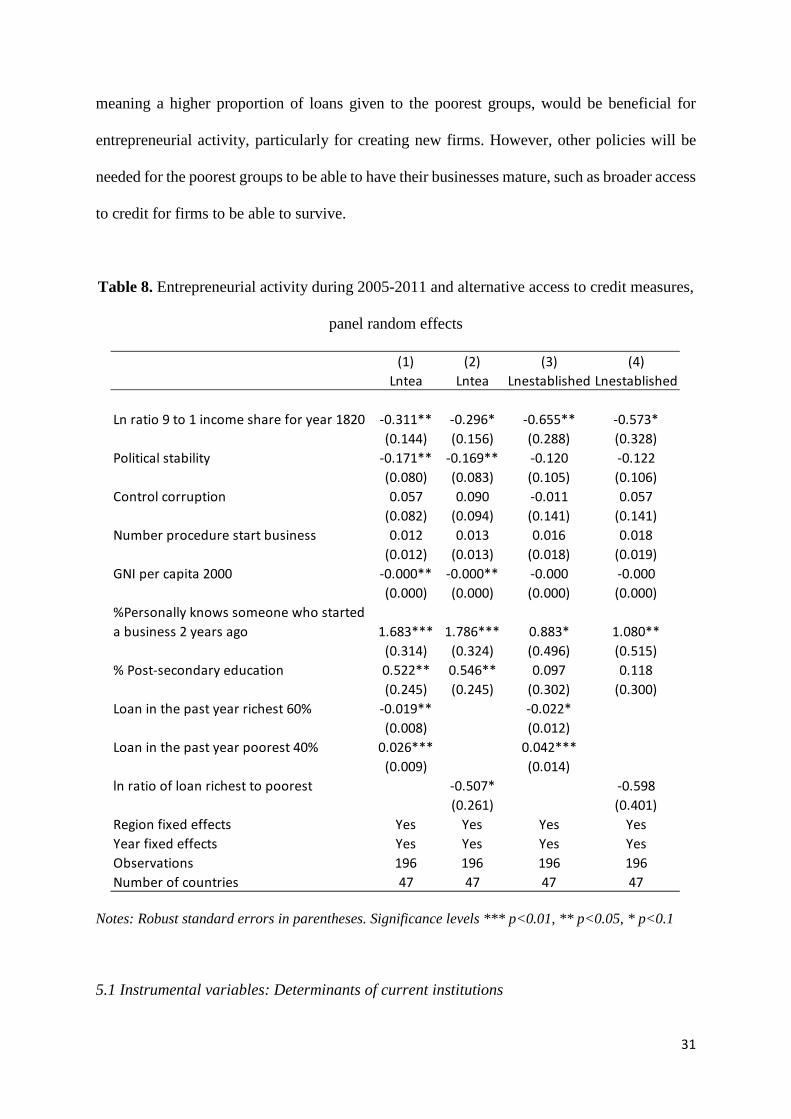
31
meaning a higher proportion of loans given to the poorest groups, would be beneficial for
entrepreneurial activity, particularly for creating new firms. However, other policies will be
needed for the poorest groups to be able to have their businesses mature, such as broader access
to credit for firms to be able to survive.
Table 8. Entrepreneurial activity during 2005-2011 and alternative access to credit measures,
panel random effects
Notes: Robust standard errors in parentheses. Significance levels *** p<0.01, ** p<0.05, * p<0.1
5.1 Instrumental variables: Determinants of current institutions
(1) (2) (3) (4)Lntea Lntea Lnestablished Lnestablished
Ln ratio 9 to 1 income share for year 1820 -0.311** -0.296* -0.655** -0.573*(0.144) (0.156) (0.288) (0.328)
Political stability -0.171** -0.169** -0.120 -0.122(0.080) (0.083) (0.105) (0.106)
Control corruption 0.057 0.090 -0.011 0.057(0.082) (0.094) (0.141) (0.141)
Number procedure start business 0.012 0.013 0.016 0.018(0.012) (0.013) (0.018) (0.019)
GNI per capita 2000 -0.000** -0.000** -0.000 -0.000(0.000) (0.000) (0.000) (0.000)
%Personally knows someone who started a business 2 years ago 1.683*** 1.786*** 0.883* 1.080**
(0.314) (0.324) (0.496) (0.515)% Post-secondary education 0.522** 0.546** 0.097 0.118
(0.245) (0.245) (0.302) (0.300)Loan in the past year richest 60% -0.019** -0.022*
(0.008) (0.012)Loan in the past year poorest 40% 0.026*** 0.042***
(0.009) (0.014)ln ratio of loan richest to poorest -0.507* -0.598
(0.261) (0.401)Region fixed effects Yes Yes Yes YesYear fixed effects Yes Yes Yes YesObservations 196 196 196 196Number of countries 47 47 47 47
32
The great majority of previous empirical studies similar to ours have not tested for the potential
endogenous relationship between entrepreneurial activity and institutional variables.11 Thus,
based on previous empirical literature, we have a priori no certainty on whether our results
presented thus far could be biased. As our third and last robustness check, we test for
endogeneity between entrepreneurial activity and our institutional variables in a two-stage
process. In the first stage, we estimate the relationship between current credit and institutions,
the potential endogenous covariates so far used, and external instruments as shown in eq. (2).
External instrument Zi denotes a set of dummy variables indicating the former coloniser,
whether Spain, Great Britain or France, and instruments frequently used in the literature (La
Porta, 1998, 1999). In addition, we use the European settler mortality rate during the colonizer
era, used by Acemoglu et al. (2001). These instruments are likely good candidates to measure
how inclusive the institutions have been over time influencing political stability, control of
corruption and entrepreneurial environment. Zit denotes the external instruments that vary over
time within countries. Among these, we include the number of journalists killed by country12
and year from 2005–2011 given that previous studies have found the degree of freedom of
media is strongly correlated with control of corruption and with political stability (Besley and
Burgess, 2001; Besley and Prat, 2006; Chowdhury, 2004). We also consider the fixed
telephone subscriptions per 100 people as previous studies have found it associated with
financial inclusion (Beck et al., 2007). In addition, we use the average systolic blood pressure
by country and year, as according to recent literature, people who find it hard to gain access to
credit can experience physiological responses to stress. For instance, people experiencing
11 An exception is found in Ardanga and Lusardi (2008), in which business regulations are instrumented
with the countries’ legal origin to assess endogeneity between entrepreneurship and credit regulation.
In that study, as to some extent ours, find no evidence of endogeneity.
12 Data obtained from CPJ (2017).
33
financial distress are less likely to follow recommended health maintenance practices such as
eating a healthy diet, thus elevating blood pressure and risk of cardiovascular diseases and
cholesterol (O’Neil et al., 2005). Since cardiovascular diseases, high blood pressure and
cholesterol are associated with economic development, they vary across countries, making
them ideal instruments since institutions and credit vary across countries (Ezzati et al., 2005).
institutionit=α+ γ1Historical inequality+γ2xit+ γ3 Xi +γ 4Zi + γ 5Zit+γ 6 Regioni+γ 7Yeart + vi+ ηit
(2)
Table A.5 in Appendix shows the results of the first-stage regressions for each of the
four instrumented institutional variables: political stability, control of corruption, the number
of procedures to start a new business and access to credit.
Table A.6 then presents the results of the instrumental variable (IV)-second stage least
squares of the regression shown in eq. (3). There, we also include the Anderson-Rubin Wald
Join test of all instruments, which confirms that the instruments are jointly correlated with the
endogenous variable and are valid instruments. The Sargan statistics suggest the instruments
are valid, that is uncorrelated with the error term, and the excluded instruments are correctly
excluded from the main panel random effects (Baum, 2006).
yit=α+β1Historicalinequality+β2xit+β3Xi+β4Regioni+β5Yeart+β6𝚤𝚤𝚤𝚤𝚤𝚤𝚤𝚤𝚤𝚤𝚤𝚤𝚤𝚤𝚤𝚤𝚤𝚤𝚤𝚤𝚤𝚤𝚤𝚤� +ui+εit (3)
The endogeneity test confirms the presence of endogeneity when considering the
current institutions for young business but not for the established firms. Despite the mixed
evidence of the endogeneity test, the second-stage regressions suggest that current institutions
have no impact on the proportion of people involved in entrepreneurial activity, as shown in
the previous results. Moreover, these IV regressions confirm the hypothesis that inequality is
negatively associated with entrepreneurial activity. A higher ratio of wealthy to poor people in
34
1820 produces a lower proportion of people engaged in young or established firms during
2005–2011 (Table A.5, columns 1 and 2).13
Given that none of the instrumented current institutions turned statistically significant,
and the mixed evidence of the presence of endogeneity, our preferred estimates remain the
panel country random effects presented earlier.
6. Conclusion
The aim of this article was to empirically test whether income inequality has any long-term
effect on entrepreneurship, thereby affecting development over time. To this end, we used a
panel of 66 countries from 2005–2011 using the Global Entrepreneurship Monitor (GEM)
survey. We triangulated this survey with current institutional indicators, access to financial
markets and with the estimates of income distribution around the globe from the 19th to 20th
century provided by Bourguignon and Morrisson (2002).
We draw two main conclusions from our results. First, high levels of historical
inequality in the long-run are associated with a high percentage of people reporting opening
13 We re-ran all our IV regressions using the different historical inequality measures so far presented
showing very similar results, but for simplification purposes, we only present those for 1820 and the
ratio of the 9 decile to the bottom decile. We also tried other combinations of instruments, such as the
percentage of the population with access to mobile, internet, the percentage of media owned by the
state, and the legal origin of counties’ legal code. All these instruments resulted in similar results but
turned out to be weaker than the instruments thus far presented. We also tried to instrument only one
institutional variable at a time, whilst leaving the rest out of the regression resulting once again in similar
results. There is a negative association between historical inequality and entrepreneurial activity and no
evidence that the current institutional environment affects much the creation and maturity of firms.
35
business out of need. This result is fully compatible with the empirical observation that regions
that today are highly unequal, such as Latin America, also have high levels of early-stage
businesses and informal economy. Second, since these young businesses are unlikely to
survive in the short run, we find that income inequality prevailing in the distant past has overall
a negative effect on the creation and survival of businesses over time. These results are
consistent regardless of the different measures of inequality (whether the Gini index or
different ratios of income share) for different years (1820, 1910 or 1980), whether removing
regions that are highly unequal from the analysis, or focusing only on the Global South. The
results are also robust if using instrumental variables to deal for the potential endogeneity
between the institutional variables used and the entrepreneurial activity assessed.
Our results then give support to the theoretical literature that suggests that if the early
wealth/income distribution is such that a large percentage of the population is credit
constrained, then fewer businesses will be created and survive over time (Banerjee and
Newman, 1993; Ghatak and Jiang, 2002). Moreover, our findings might help reconcile the
mixed evidence of previous studies that suggest high levels of inequality increase early
entrepreneurial activity (Lippman et al., 2005; Naudé, 2010) as well as that of Halter et al.
(2014) who find inequality helps economic performance in the short term, but has an overall
negative effect in the long term. Our findings also support recent articles concerned about the
damaging effects that inequality has in the long-run, particularly given the rise of inequality in
developed countries seen over the last four decades (Dabla-Norris et al., 2015; Piketty, 2015;
Stiglitz, 2012; 2015).
Our results have important policy implications. Our findings suggest economic
convergence across countries is unlikely to occur since countries are predisposed to their initial
conditions for their businesses to thrive and in others to struggle. Thus, to foster the creation
of businesses, policies should focus on addressing long-standing differences in wealth within
36
countries as well as fostering financial inclusion among the poor. Incidentally, these policies
could well foster convergence across countries as well, which is an issue that deserves further
research.
References
Acemoglu, D., Johnson, S. and Robinson, J. 2001. “The colonial origins of comparative
development: An empirical investigation,” American Economic Review, 91(5): 1369-1401.
Acemoglu, D. and Robinson, J. 2010. “Why is Africa poor?” Economic History of
Southern Africa, 25(1): 21-50.
Aghion, P. and Bolton, P. 1997. “A theory of trickle-down growth and development,”
The Review of Economic Studies, 64(2): 151-172.
Aghion, P., Caroli, E., and Garcia-Penalosa, C. 1999. “Inequality and economic
growth: The perspective of the new growth theories,” Journal of Economic Literature, 37(4):
1615-60.
Aldrich, H. E. and Fiol, M. C. 1994. “Fools rush in? The institutional context of industry
creation,” Academy of Management Review, 19(4): 645-670.
Aldrich. H. E. 1999. Organizations Evolving, London: Sage.
Alesina, A. and Perotti, R. 1996. “Income distribution, political instability, and
investment,” European Economic Review, 40(6): 1203-1228.
Alesina, A. and Rodrick, D. 1994. “Distributive politics and economic growth,” The
Quarterly Journal of Economics, 109(2): 465-490.
Alvarez, C. and Urbano, D. 2011. “Environmental factors and entrepreneurial activity
in Latin America,” Academia Revista Latinoamericana de Administración, 48: 126-139.
37
Ardagna, S. and Lusardi, A. 2008. “Explaining international differences in
entrepreneurship: The role of individual characteristics and regulatory constraints,” NBER
Working Paper 14012.
Audretsch, D. B., Keilbach, M. C., and Lehmann, E. E. 2006. Entrepreneurship and
Economic Growth. New York: Oxford University Press.
Baliamoune-Lutz, M., Brixiová, Z. and Ndikumana, L. 2011. “Credit constraints and
productive entrepreneurship in Africa. Political Economy Research Institute.” Working Paper
No. 276.
Banerjee, A. and Newman, A. F. 1993. “Occupational choice and the process of
development,” Journal of Political Economy, 101 (2): 274-298.
Baum, C.F. 2006. An Introduction to Modern Econometrics Using Stata. College
Station, TX: Stata Press.
Baumol, W. J., Litan, R.E. and Schramm, C. J. 2007. Good capitalism, bad capitalism,
and the economics of growth and prosperity. Yale University Press, New Haven, CT.
Beck, T., Demirguc-Kunt, A. and Martinez Peria, M. 2007. “Reaching out: Access to
and use of banking services across countries,” Journal of Financial Economics, 85(1): 234-
266.
Bénabou, R. 1996. Inequality and Growth, in NBER Macroeconomics Annual. Ben
Bernanke and Julio Rotemberg, eds. London and Cambridge: MIT Press, pp. 11-7.
Berg, E. 2013. “Are poor people credit-constrained or myopic? Evidence from a South
African panel,” Journal of Development Economics, 101(2): 195-205.
Besley, T. and Burgess, R. 2001. “Political agency, government responsiveness and
the role of the media,” European Economic Review, 45(4-6): 629-640.
Besley, T. and Prat, A. 2006. “Handcuffs for the grabbing hand? Media capture and
government accountability,” American Economic Review, 96(3): 720-736.
38
Bourguignon, F. and Morrisson, C. 2002. “Inequality among world citizens: 1820–
1992,” American Economic Review, 92(4): 727–744.
Champernowne, D.G. 1953. “A model of income distribution,” The Economic
Journal, 63(250): 318-351.
Chowdhury, S. K. 2004. “The effect of democracy and press freedom on corruption:
An empirical test,” Economic Letters 85(1), 93-101.
Cingano, F. 2014. “Trends in income inequality and its impact on economic growth,”
OECD Social, Employment and Migration, Working papers, No. 163. OECD Publishing.
Committee to Protect Journalists (CPJ). 2017. Journalists killed since 1992 database,
Retrieved from https://cpj.org/killed
Dabla-Norris, E., Kochhar, K., Suphaphiphat, N., Ricka, F. and Tsounta, E. 2015.
“Causes and consequences of income inequality: A global perspective,” IMF Staff Discussion
Note SDN/15/13.
De Dominicis, L. De Groot, H. and Florax, R. 2006. “Growth and inequality: A meta-
analysis,” Tinbergen Institute Discussion Paper, No. 2006-064/3.
Engerman, S. and Sokoloff, K. 2005. “Colonialism, inequality and long-run paths of
development,” National Bureau of Economic Research, working paper 11057.
Evans, D. and Jovanovic, B. 1989. “An estimated model of entrepreneurial choice
under liquidity constraints,” Journal of Political Economy, 97(4): 808-827.
Ezzati, M., Vander Hoorn, S., Lawes, C., Leach, R., James, W., Lopez, A., Rodgers,
A. and Murray, C. 2005. “Rethinking the ‘Diseases of affluence’, Paradigm: Global Patterns
of Nutritional Risks in Relation to Economic Development,” PLoS Med, 2(5): 404-412.
Fairlie, R, and Krashinsky, H.A. 2012. “Liquidity constraints, household wealth, and
entrepreneurship revisited,” Review of Income and Wealth, 58(2): 279-306.
39
Frid, C. J., Wyman, D. and Coffey, B. 2016. “Effects of wealth inequality on
entrepreneurship,” Small Business Economics, 47(4): 895-920.
Galor, O. and Moav. O. 2004. “From physical to human capital accumulation:
Inequality and the process of development,” Review of Economic Studies, 71(4):1001-1026.
Galor, O. and Zeira, J. 1993. “Income distribution and macroeconomics,” Review of
Economic Studies, 60(1): 35-52.
Gentry, W. M., and Hubbard, R. G. 2004. “Entrepreneurship and household saving,”
Advances in Economic Analysis and Policy, 4(1):1-55.
Ghatak, M. and Jiang, N.H. 2002. “A simple model of inequality, occupational choice
and development,” Journal of Development Economics, 69(1): 205-226.
Glaeser, E., La Porta, R., Lopez-de-Silanes, F. and Shleifer, A. 2004. “Do institutions
cause growth?” Journal of Economic Growth, 9(3): 271-303.
Glaeser, E., Scheinkman, J., Shleifer, A. 2003. “The injustice of inequality,” Journal
of Monetary Economics, 50(1): 199-222.
Halter, D., Oeschslin, M. and Zweimüller, M. 2014. “Inequality and growth: The
neglected time dimension,” Journal of Economic Growth, 19(1): 81-104.
Holtz-Eakin, D.D., Joulfaian, D. and Rosen, H.D. 1994. “Sticking it out:
Entrepreneurial survival and liquidity constraints,” Journal of Political Economy, 102(1): 53-
75.
Hurst, E. and Lusardi, A. 2004. “Liquidity constraints, household wealth, and
entrepreneurship,” Journal of Political Economy, 112(3): 319-347.
Jaramillo, F. 1995. “Distribution du revenue, composition de la demande et croissance,
” MAD, Université de Paris I, mimeo.
40
Kaufmann, D., Kraay, A. and Mastruzzi, M. 2010. “The worldwide governance
indicators: Methodology and analytical issues,” World Bank Policy Research Working Paper
No. 5430.
Keister, L. A. 2000. Wealth in America, New York: Cambridge University Press.
Krueger, N.F. 1993. “The Impact of Prior Entrepreneurial Exposure on Perceptions and
New Venture Feasibility and Desirability,” Entrepreneurship Theory and Practice, 18(1): 5-
21.
La Porta, R., Lopez-de-Silanes, F., Shleifer, A. and Vishny, R.W. 1998. “Law and
finance,” Journal of Political Economy, 106(6): 1113-1155.
La Porta, R., Lopez-de-Silanes, F., Shleifer, A. and Vishny, R.W. 1999. “The quality
of government,” Journal of Law, Economics and Organization, 15(1): 222-279.
Lecuna, A. 2014. “High income inequality as a structural factor in entrepreneurial
activity,” Journal of Technology Management & Innovation, 9(1):13-26.
Lippmann, S., Davis, A., and Aldrich, H. E. 2005. “Entrepreneurship and Inequality,”
in Lisa A. Keister (ed.) Entrepreneurship (Research in the Sociology of Work, Volume 15)
Emerald Group Publishing Limited, pp.3-31.
Ljungqvist, L. 1993. “Economic underdevelopment: The case of a missing market for
human capital,” Journal of Development Economics, 40(2): 219-239.
Man, T., Lau, T. and Chan, K.F. 2002. “The competitiveness of small and medium
enterprises. A conceptualization with focus on entrepreneurial competencies,” Journal of
Business Venturing, 17(2):123-142.
Mehmetoglu, M. and Jakobsen G. 2017. Applied statistics using stata: A guide for the
social sciences. Ed. Sage Publications.
Mesnard, A. and Ravallion, M. 2001. “Is inequality bad for business?” Policy Research
Working Paper 2527, World Bank.
41
Michalopoulos, S. and Papaioannou, E. 2011. “The Long-Run Effects of the Scramble
for Africa,” CEPR Discussion Paper No. 8676.
Murphy, K., Shleifer, A. and Vishny, R. 1989. “Income Distribution, Market Size, and
Industrialization,” Quarterly Journal of Economics, 104(3): 537-564.
Naudé, W. 2008. “Entrepreneurship in economic development.” UNU-Wider Research
Paper No. 2008/20.
Naudé, W. 2010. “Entrepreneurship, developing countries, and development
economics: new approaches and insights,” Small Business Economics, 34(1): 1-12.
O’Neill, B., Sorhaindo, B., Xiao, J. J. and Garman, E. T. 2005. “Health, financial well-
being, and financial practices of financially distressed consumers,” Consumer Interests Annual
51, 80-82.
Ordeñaga, X. and Arteaga, E. 2012. “Middle-Class Entrepreneurship and the Effect of
Social Capital,” IADB WP No. 318.
Perotti, R. 1996. “Growth, income distribution and democracy: What the data say,”
Journal of Economic Growth, 1(2): 149-87.
Persson, T. and Tabellini, G. 1994. “Is inequality harmful for growth,” The American
Economic Review, 84(3): 600-621.
Piketty, T. 2015. “Putting distribution back at the center of economics,” Journal of
Economic Perspectives, 29(1): 67-88.
Piketty, T. and Saez, E. 2006. “The evolution of top incomes: A historical and
international perspective,” American Economic Review, 96(2): 200-205.
Quadrini, V. 1999. “The importance of entrepreneurship for wealth concentration and
mobility,” Review of Income and Wealth, 45(1): 1 -19.
Rapoport, H. 2002. “Migration, credit constraints and self-employment: A simple
model of occupational choice, inequality and growth,” Economics Bulletin, 15(7) 1–5.
42
Reynolds, P., Bosma, N., Autio, E., Hunt, S., De Bono, N., Servais, I. and Lopez-
Garcia, P. 2005. “Global entrepreneurship monitor: data collection design and implementation
1998-2003,” Small Business Economics, 24(3): 205-31.
Reynolds, P. D., Camp, S. M., Bygrave, W. D., Autio, E. and Hay, M. 2001. “Global
Entrepreneurship Monitor. 2001 Executive report,” Kansas City: Kauffman Center for
Entrepreneurial Learning.
Rosenzweig, M. R. and Hans P. Binswanger, H. P. 1993. “Wealth, Weather Risk and
the Composition and Profitability of Agricultural Investments” The Economic Journal,
103(416): 56-78.
Shapero, A. and Sokol, L. 1982. “Social Dimensions of Entrepreneurship.” In: Kent
C, Sexton D, Vesper K (eds.), The Encyclopedia of Entrepreneurship, Prentice-Hall,
Englewood Cliffs, pp. 72–90.
Schumpeter, J. 1943. Capitalims, Socialism and Democracy. London: Allen and
Unwin.
Simón-Moya, V., Revuelto-Taboada, L. and Fernández-Guerrero, R. 2014.
“Institutional and economic drivers of entrepreneurship: An international perspective,”
Journal of Business Research, 67(5):715-721.
Solimano, A. 2014. Entrepreneurship, The Middle Class, and Social Mobility: An
Overview of Literature, in Entrepreneurship in Latin America: A step up the social ladder?,
edited by Lora, E. and Castellani, F.; Interamerican Development Bank and World Bank.
Stiglitz, J. 2012. The Price of Inequality: How Today’s Divided Society Endangers Our
Future. W.W. Norton, New York, NY.
Stiglitz, J. 2015. “The origins of inequality, and policies to contain it,” National Tax
Journal, 68(2), 425-448.
43
Voitchovsky, S. 2009. “Inequality and Economic Growth,” in Wiemer Salverda, Brian
Nolan, and Tim Smeeding (eds). The Oxford Handbook of Economic Inequality. Oxford, OUP.
Wennekers, S., van Stel, A., Thurik, R. and Reynolds, P. 2005. “Nascent
entrepreneurship and the level of economic development,” Small Business Economics, 24(3):
293-309.
Zissimopoulos, J., Karoly, L. and Gu, Q. 2009. “Liquidity constraints, household
wealth and self-employment: The case of older workers,” RAND working paper series.
Appendix
Table A.1. List of countries and country groups for which Bourgignon and Morrison (2002)
estimated historical inequality indicators
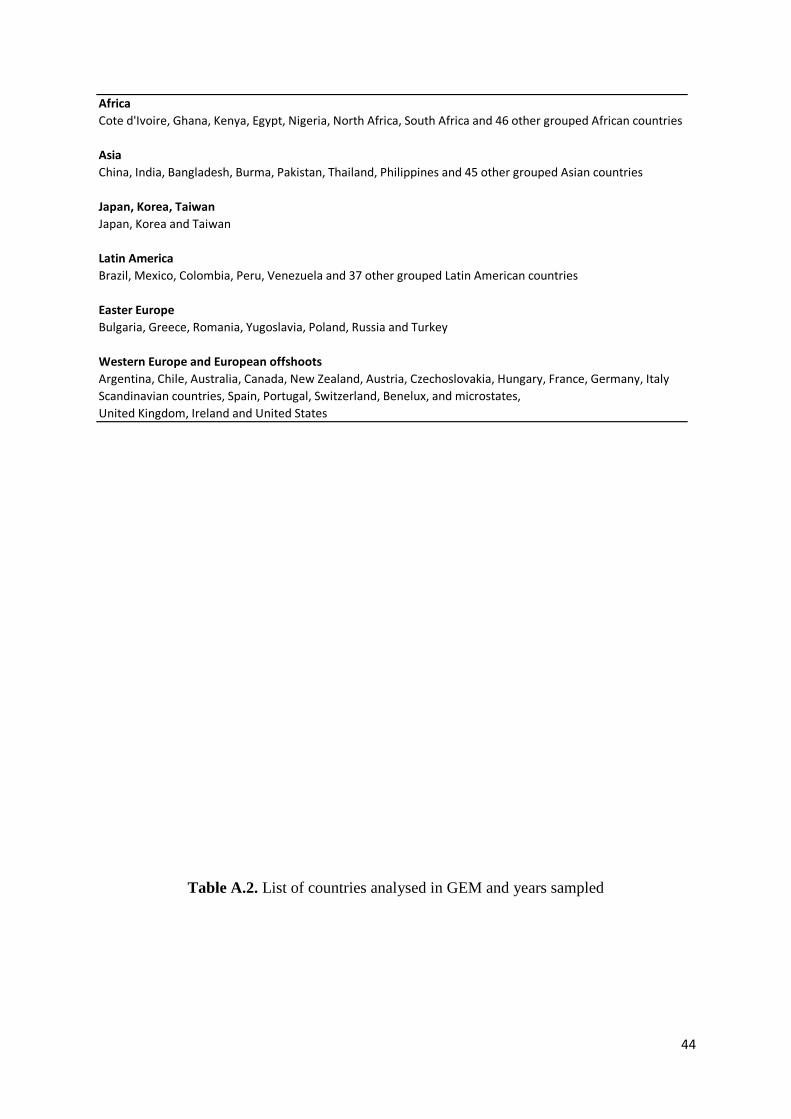
44
Table A.2. List of countries analysed in GEM and years sampled
AfricaCote d'Ivoire, Ghana, Kenya, Egypt, Nigeria, North Africa, South Africa and 46 other grouped African countries
AsiaChina, India, Bangladesh, Burma, Pakistan, Thailand, Philippines and 45 other grouped Asian countries
Japan, Korea, TaiwanJapan, Korea and Taiwan
Latin AmericaBrazil, Mexico, Colombia, Peru, Venezuela and 37 other grouped Latin American countries
Easter EuropeBulgaria, Greece, Romania, Yugoslavia, Poland, Russia and Turkey
Western Europe and European offshootsArgentina, Chile, Australia, Canada, New Zealand, Austria, Czechoslovakia, Hungary, France, Germany, ItalyScandinavian countries, Spain, Portugal, Switzerland, Benelux, and microstates, United Kingdom, Ireland and United States
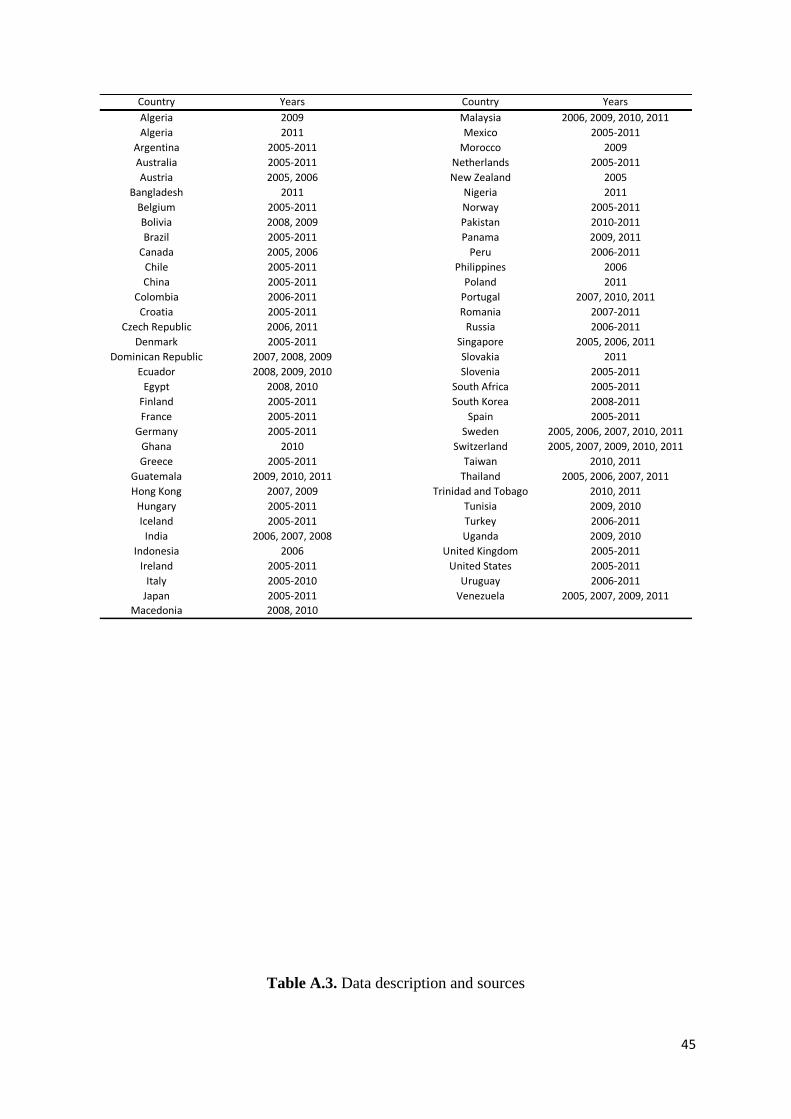
45
Table A.3. Data description and sources
Country Years Country YearsAlgeria 2009 Malaysia 2006, 2009, 2010, 2011Algeria 2011 Mexico 2005-2011
Argentina 2005-2011 Morocco 2009Australia 2005-2011 Netherlands 2005-2011Austria 2005, 2006 New Zealand 2005
Bangladesh 2011 Nigeria 2011Belgium 2005-2011 Norway 2005-2011Bolivia 2008, 2009 Pakistan 2010-2011Brazil 2005-2011 Panama 2009, 2011
Canada 2005, 2006 Peru 2006-2011Chile 2005-2011 Philippines 2006China 2005-2011 Poland 2011
Colombia 2006-2011 Portugal 2007, 2010, 2011Croatia 2005-2011 Romania 2007-2011
Czech Republic 2006, 2011 Russia 2006-2011Denmark 2005-2011 Singapore 2005, 2006, 2011
Dominican Republic 2007, 2008, 2009 Slovakia 2011Ecuador 2008, 2009, 2010 Slovenia 2005-2011
Egypt 2008, 2010 South Africa 2005-2011Finland 2005-2011 South Korea 2008-2011France 2005-2011 Spain 2005-2011
Germany 2005-2011 Sweden 2005, 2006, 2007, 2010, 2011Ghana 2010 Switzerland 2005, 2007, 2009, 2010, 2011Greece 2005-2011 Taiwan 2010, 2011
Guatemala 2009, 2010, 2011 Thailand 2005, 2006, 2007, 2011Hong Kong 2007, 2009 Trinidad and Tobago 2010, 2011
Hungary 2005-2011 Tunisia 2009, 2010Iceland 2005-2011 Turkey 2006-2011
India 2006, 2007, 2008 Uganda 2009, 2010Indonesia 2006 United Kingdom 2005-2011
Ireland 2005-2011 United States 2005-2011Italy 2005-2010 Uruguay 2006-2011
Japan 2005-2011 Venezuela 2005, 2007, 2009, 2011Macedonia 2008, 2010
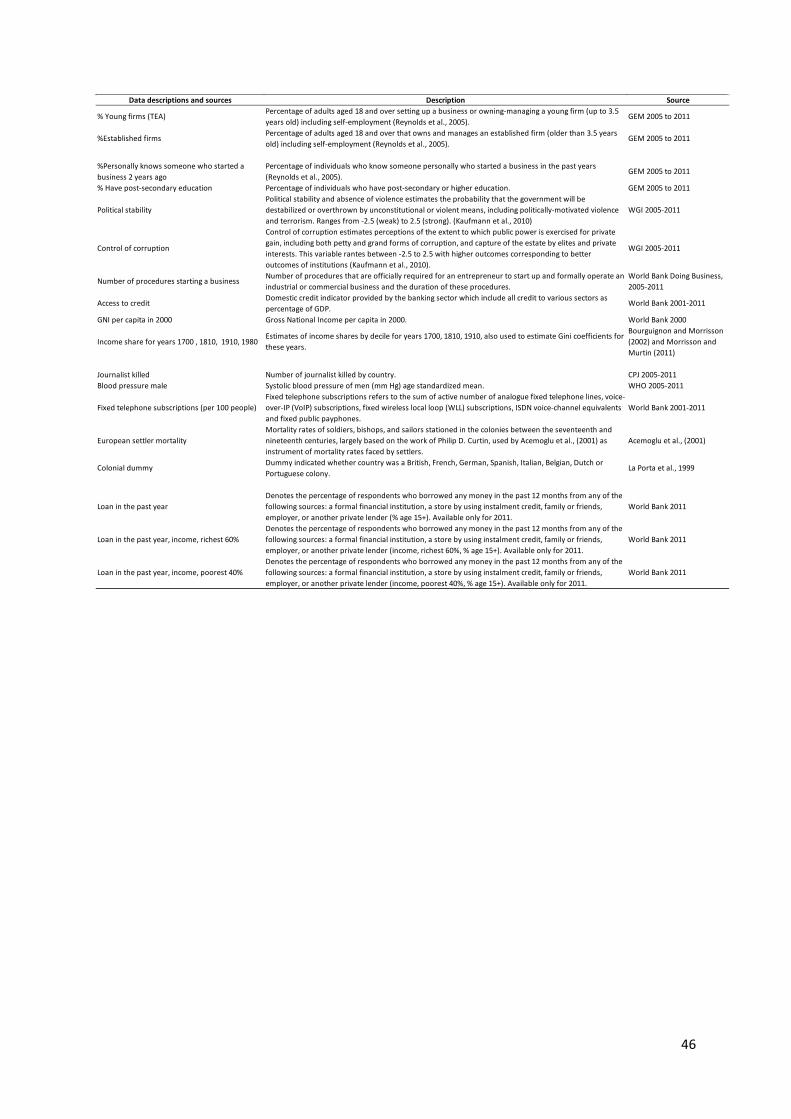
46
Data descriptions and sources Description Source
% Young firms (TEA)Percentage of adults aged 18 and over setting up a business or owning-managing a young firm (up to 3.5 years old) including self-employment (Reynolds et al., 2005).
GEM 2005 to 2011
%Established firmsPercentage of adults aged 18 and over that owns and manages an established firm (older than 3.5 years old) including self-employment (Reynolds et al., 2005).
GEM 2005 to 2011
%Personally knows someone who started a business 2 years ago
Percentage of individuals who know someone personally who started a business in the past years (Reynolds et al., 2005).
GEM 2005 to 2011
% Have post-secondary education Percentage of individuals who have post-secondary or higher education. GEM 2005 to 2011
Political stabilityPolitical stability and absence of violence estimates the probability that the government will be destabilized or overthrown by unconstitutional or violent means, including politically-motivated violence and terrorism. Ranges from -2.5 (weak) to 2.5 (strong). (Kaufmann et al., 2010)
WGI 2005-2011
Control of corruption
Control of corruption estimates perceptions of the extent to which public power is exercised for private gain, including both petty and grand forms of corruption, and capture of the estate by elites and private interests. This variable rantes between -2.5 to 2.5 with higher outcomes corresponding to better outcomes of institutions (Kaufmann et al., 2010).
WGI 2005-2011
Number of procedures starting a businessNumber of procedures that are officially required for an entrepreneur to start up and formally operate an industrial or commercial business and the duration of these procedures.
World Bank Doing Business, 2005-2011
Access to creditDomestic credit indicator provided by the banking sector which include all credit to various sectors as percentage of GDP.
World Bank 2001-2011
GNI per capita in 2000 Gross National Income per capita in 2000. World Bank 2000
Income share for years 1700 , 1810, 1910, 1980Estimates of income shares by decile for years 1700, 1810, 1910, also used to estimate Gini coefficients for these years.
Bourguignon and Morrisson (2002) and Morrisson and Murtin (2011)
Journalist killed Number of journalist killed by country. CPJ 2005-2011Blood pressure male Systolic blood pressure of men (mm Hg) age standardized mean. WHO 2005-2011
Fixed telephone subscriptions (per 100 people)Fixed telephone subscriptions refers to the sum of active number of analogue fixed telephone lines, voice-over-IP (VoIP) subscriptions, fixed wireless local loop (WLL) subscriptions, ISDN voice-channel equivalents and fixed public payphones.
World Bank 2001-2011
European settler mortality Mortality rates of soldiers, bishops, and sailors stationed in the colonies between the seventeenth and nineteenth centuries, largely based on the work of Philip D. Curtin, used by Acemoglu et al., (2001) as instrument of mortality rates faced by settlers.
Acemoglu et al., (2001)
Colonial dummyDummy indicated whether country was a British, French, German, Spanish, Italian, Belgian, Dutch or Portuguese colony.
La Porta et al., 1999
Loan in the past yearDenotes the percentage of respondents who borrowed any money in the past 12 months from any of the following sources: a formal financial institution, a store by using instalment credit, family or friends, employer, or another private lender (% age 15+). Available only for 2011.
World Bank 2011
Loan in the past year, income, richest 60% Denotes the percentage of respondents who borrowed any money in the past 12 months from any of the following sources: a formal financial institution, a store by using instalment credit, family or friends, employer, or another private lender (income, richest 60%, % age 15+). Available only for 2011.
World Bank 2011
Loan in the past year, income, poorest 40% Denotes the percentage of respondents who borrowed any money in the past 12 months from any of the following sources: a formal financial institution, a store by using instalment credit, family or friends, employer, or another private lender (income, poorest 40%, % age 15+). Available only for 2011.
World Bank 2011
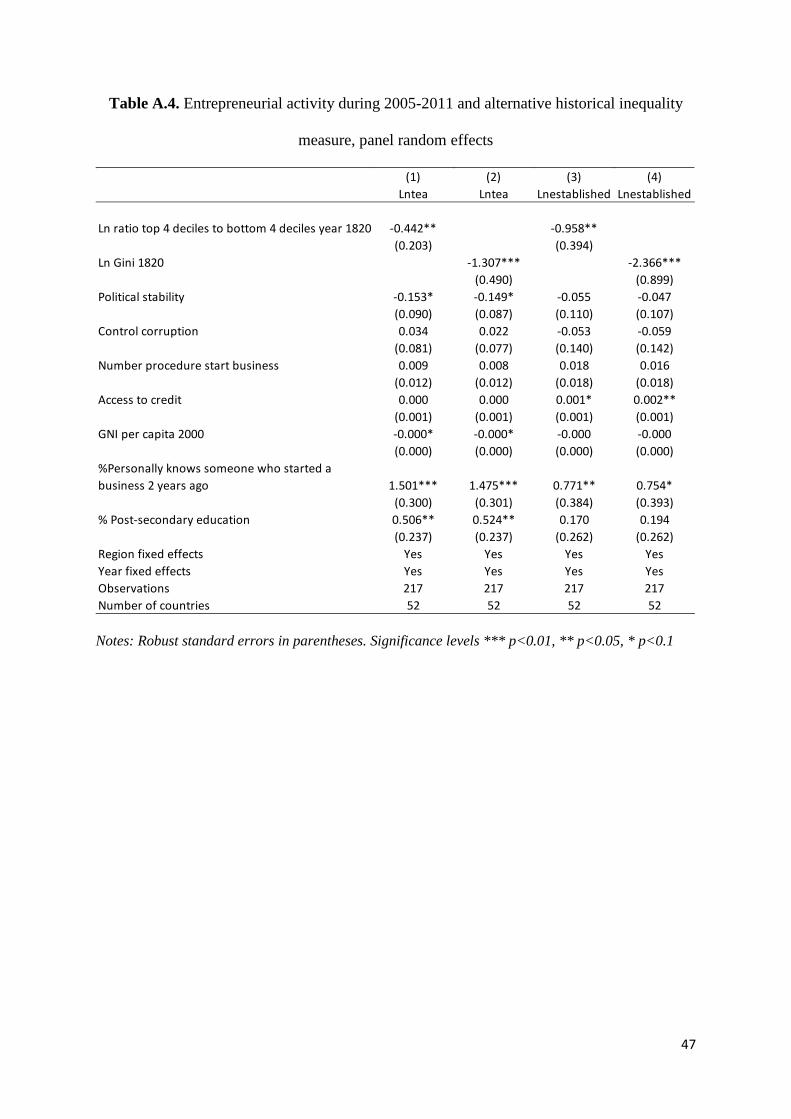
47
Table A.4. Entrepreneurial activity during 2005-2011 and alternative historical inequality
measure, panel random effects
Notes: Robust standard errors in parentheses. Significance levels *** p<0.01, ** p<0.05, * p<0.1
(1) (2) (3) (4)Lntea Lntea Lnestablished Lnestablished
Ln ratio top 4 deciles to bottom 4 deciles year 1820 -0.442** -0.958**(0.203) (0.394)
Ln Gini 1820 -1.307*** -2.366***(0.490) (0.899)
Political stability -0.153* -0.149* -0.055 -0.047(0.090) (0.087) (0.110) (0.107)
Control corruption 0.034 0.022 -0.053 -0.059(0.081) (0.077) (0.140) (0.142)
Number procedure start business 0.009 0.008 0.018 0.016(0.012) (0.012) (0.018) (0.018)
Access to credit 0.000 0.000 0.001* 0.002**(0.001) (0.001) (0.001) (0.001)
GNI per capita 2000 -0.000* -0.000* -0.000 -0.000(0.000) (0.000) (0.000) (0.000)
%Personally knows someone who started a business 2 years ago 1.501*** 1.475*** 0.771** 0.754*
(0.300) (0.301) (0.384) (0.393)% Post-secondary education 0.506** 0.524** 0.170 0.194
(0.237) (0.237) (0.262) (0.262)Region fixed effects Yes Yes Yes YesYear fixed effects Yes Yes Yes YesObservations 217 217 217 217Number of countries 52 52 52 52
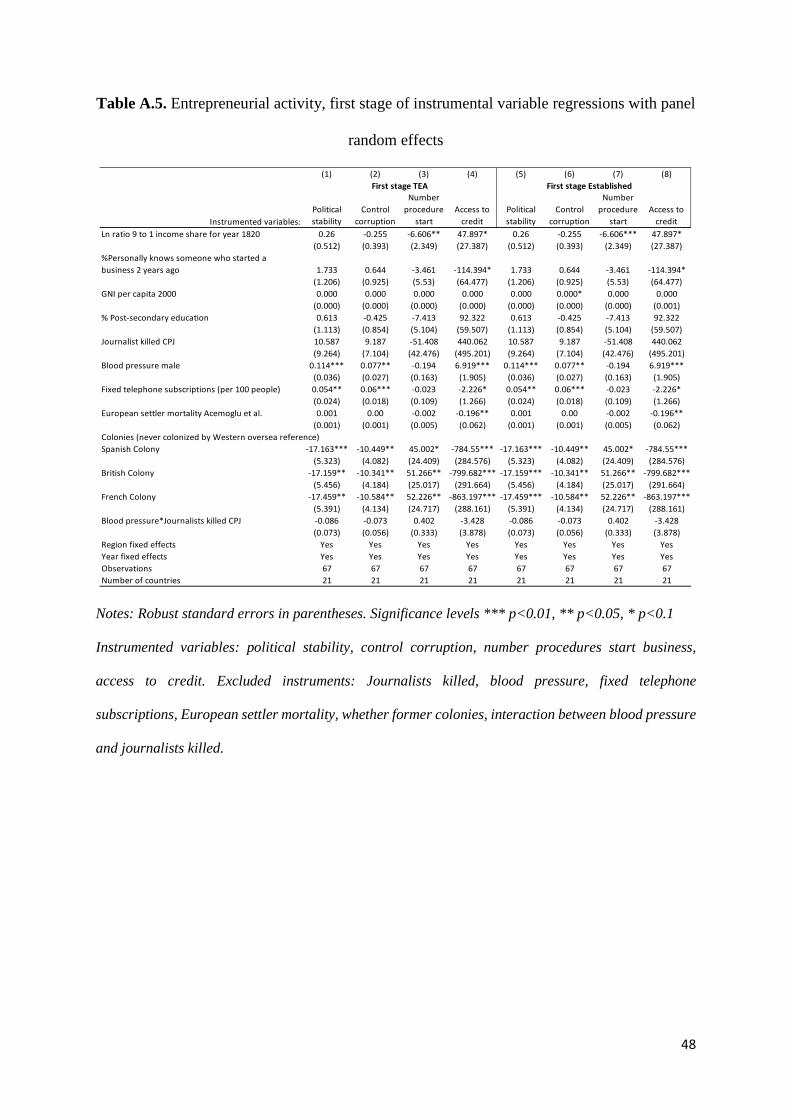
48
Table A.5. Entrepreneurial activity, first stage of instrumental variable regressions with panel
random effects
Notes: Robust standard errors in parentheses. Significance levels *** p<0.01, ** p<0.05, * p<0.1
Instrumented variables: political stability, control corruption, number procedures start business,
access to credit. Excluded instruments: Journalists killed, blood pressure, fixed telephone
subscriptions, European settler mortality, whether former colonies, interaction between blood pressure
and journalists killed.
(1) (2) (3) (4) (5) (6) (7) (8)First stage Established
Instrumented variables:Political stability
Control corruption
Number procedure
startAccess to
creditPolitical stability
Control corruption
Number procedure
startAccess to
creditLn ratio 9 to 1 income share for year 1820 0.26 -0.255 -6.606** 47.897* 0.26 -0.255 -6.606*** 47.897*
(0.512) (0.393) (2.349) (27.387) (0.512) (0.393) (2.349) (27.387)%Personally knows someone who started a business 2 years ago 1.733 0.644 -3.461 -114.394* 1.733 0.644 -3.461 -114.394*
(1.206) (0.925) (5.53) (64.477) (1.206) (0.925) (5.53) (64.477)GNI per capita 2000 0.000 0.000 0.000 0.000 0.000 0.000* 0.000 0.000
(0.000) (0.000) (0.000) (0.000) (0.000) (0.000) (0.000) (0.001)% Post-secondary education 0.613 -0.425 -7.413 92.322 0.613 -0.425 -7.413 92.322
(1.113) (0.854) (5.104) (59.507) (1.113) (0.854) (5.104) (59.507)Journalist killed CPJ 10.587 9.187 -51.408 440.062 10.587 9.187 -51.408 440.062
(9.264) (7.104) (42.476) (495.201) (9.264) (7.104) (42.476) (495.201)Blood pressure male 0.114*** 0.077** -0.194 6.919*** 0.114*** 0.077** -0.194 6.919***
(0.036) (0.027) (0.163) (1.905) (0.036) (0.027) (0.163) (1.905)Fixed telephone subscriptions (per 100 people) 0.054** 0.06*** -0.023 -2.226* 0.054** 0.06*** -0.023 -2.226*
(0.024) (0.018) (0.109) (1.266) (0.024) (0.018) (0.109) (1.266)European settler mortality Acemoglu et al. 0.001 0.00 -0.002 -0.196** 0.001 0.00 -0.002 -0.196**
(0.001) (0.001) (0.005) (0.062) (0.001) (0.001) (0.005) (0.062)Colonies (never colonized by Western oversea reference)Spanish Colony -17.163*** -10.449** 45.002* -784.55*** -17.163*** -10.449** 45.002* -784.55***
(5.323) (4.082) (24.409) (284.576) (5.323) (4.082) (24.409) (284.576)British Colony -17.159** -10.341** 51.266** -799.682*** -17.159*** -10.341** 51.266** -799.682***
(5.456) (4.184) (25.017) (291.664) (5.456) (4.184) (25.017) (291.664)French Colony -17.459** -10.584** 52.226** -863.197*** -17.459*** -10.584** 52.226** -863.197***
(5.391) (4.134) (24.717) (288.161) (5.391) (4.134) (24.717) (288.161)Blood pressure*Journalists killed CPJ -0.086 -0.073 0.402 -3.428 -0.086 -0.073 0.402 -3.428
(0.073) (0.056) (0.333) (3.878) (0.073) (0.056) (0.333) (3.878)Region fixed effects Yes Yes Yes Yes Yes Yes Yes YesYear fixed effects Yes Yes Yes Yes Yes Yes Yes YesObservations 67 67 67 67 67 67 67 67Number of countries 21 21 21 21 21 21 21 21
First stage TEA
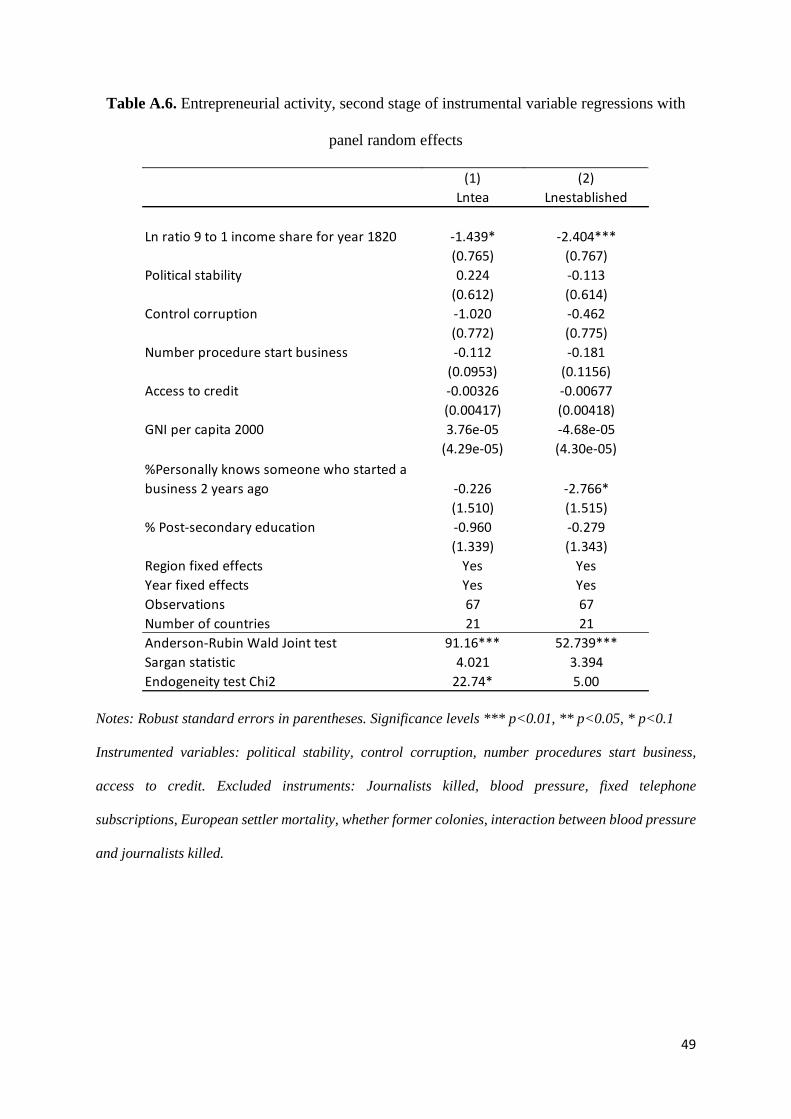
49
Table A.6. Entrepreneurial activity, second stage of instrumental variable regressions with
panel random effects
Notes: Robust standard errors in parentheses. Significance levels *** p<0.01, ** p<0.05, * p<0.1
Instrumented variables: political stability, control corruption, number procedures start business,
access to credit. Excluded instruments: Journalists killed, blood pressure, fixed telephone
subscriptions, European settler mortality, whether former colonies, interaction between blood pressure
and journalists killed.
(1) (2)Lntea Lnestablished
Ln ratio 9 to 1 income share for year 1820 -1.439* -2.404***(0.765) (0.767)
Political stability 0.224 -0.113(0.612) (0.614)
Control corruption -1.020 -0.462(0.772) (0.775)
Number procedure start business -0.112 -0.181(0.0953) (0.1156)
Access to credit -0.00326 -0.00677(0.00417) (0.00418)
GNI per capita 2000 3.76e-05 -4.68e-05(4.29e-05) (4.30e-05)
%Personally knows someone who started a business 2 years ago -0.226 -2.766*
(1.510) (1.515)% Post-secondary education -0.960 -0.279
(1.339) (1.343)Region fixed effects Yes YesYear fixed effects Yes YesObservations 67 67Number of countries 21 21Anderson-Rubin Wald Joint test 91.16*** 52.739***Sargan statistic 4.021 3.394Endogeneity test Chi2 22.74* 5.00