Embed Size (px)
Citation preview

RATE-PEGGING IN NEW SOUTH WALES LOCAL GOVERNMENT
Brian Dollery·
Centre for Local Government
Un iversity of New England
1. INTRODUCTION
New South Wales (NSW) is alone amongst Australian states and territories in
employing a policy of rate-pegging designed to limit increases in property taxes that
can be levied by local councils in that state l. This longstanding policy has been an
ongoing source of bitter controversy in NSW itself and the cause of much
bemusement in the broader Australasian local government community (Dollery, Crase
and Johnson, 2006). While NSW had employed a form of rate-pegging between 1901
and 1952, which was discontinued due to its ' impracticality' (NSW Local
Government and Shires Association , 2008, p.16), the genesis of the modern method of
rate-pegging may be found in the 1976 state election campaign. Under the Local
Government (Rating) Further Amendment Bill , an interim type of rate-pegging was
re-introduced by the victorious Wran Labor Government in 1977 and further refined
into its contemporary form in 1978. The timing ofthe introduction of rate-pegging
legislation into the NSW Parliament shou ld be seen against the historical backdrop of
economic developments in NSW in the 1970s; over the period 1973 to 1976, rates had
increased on average by 188 per cent whereas average weekly earnings over the same
• Director of the UNE Centre for Local Government, School of Business, Econom ics and Public Policy, University of New England, Armidale, NSW 2351.Telephone: 61 26773250; Fax: 61 267733596; Emai l: [email protected]
I The Northern Territory wi ll join NSW in imposing rate-pegging for a transitional three-year period beginning 2008 wh ile extensive structural reform is put in place (Productivity Comm ission, 2008, p.97).
I

~ --~-----~---
period rose by 75 per cent and the rate of inflation was 56 per cent (Johnson, 2001,
p.5).
While the mechanics of the rate-pegging process have been adjusted periodically, the
basic principle has remained unchanged to the present day. However, on 27 October
2008, NSW Premier Nathan Rees announced to the annual New South Wales Local
Government Association conference that his government was giving serious thought
to removing rate pegging. It thus seems an opportune time to consider the nature of
rate-pegging, the arguments surrounding its desirability, and its economic effects on
NSW local government. This forms the aim of the present submission.
This submission is divided into four main parts. Section 2 provides a synoptic
description of the principles and practice of rate-pegging. Section 3 considers the
rationale for rate-pegging and various arguments on this question. Section 4 seeks to
evaluate the impact of rate-pegging on trends in rates in NSW relative to other
Australian state local government jurisdictions. The submission ends with some brief
concluding remarks in section 5.
2. PRINCIPLES AND PRACTICE OF NSW RATE-PEGGING
It terms of the Local Government Act 1993, NSW local authorities have six main
sources of revenue: rates, charges, fees, grants, borrowings, and investments. With
respect to income from property, under Section 493 of the Local Government Act
1993 local councils calculate and distribute rates among four defined categories of
rateable properties in their respective local jurisdictions; farmland, residential, mining
and business. Section 492 of the Act makes provision for two types of rates; ordinary
rates and special rates. Section 494 of the: Act stipulates that every council must strike
2

and levy an ordinary rate each year on all rateable land within its jurisdiction. By
contrast, a local council can exercise discretion on whether or not to levy a special
rate under Section 495 of the Act. Special rates are aimed at the finance of particular
projects, such as specified local infrastructure, and must be applied to all ratepayers if
the project will benefit'the entire local government area (Department of Local
Government, 2007),
For each category of property, rates can be calculated in one of three ways: Entirely
on the land value of the property; on a combination of the land value ofthe property
and a fixed amount per property; and entirely on the land value, but subject to a
minimum amount. Land value in turn is periodically determined by the Land and
Property Information Division of the NSW Department of Lands (Department of
Local Government, 2007).
Part 2 of Chapter 15 of the Local Government Act 1993 allows the relevant Minister
to impose limits inter alia on a council's 'general income,2. With respect to the
mechanics of rate-pegging, the NSW government sets.a ceiling on the total amount of
income that each council can raise from its rates and charges on land. This limit is
termed the 'rate-peg percentage' and it is prescribed prior to each fiscal year by the
Minister for Local Government. As a consequence of rate pegging, a given council's
overall rates revenue cannot increase by more than the percentage increase approved
by the Minister. Indeed, even if land values in a local government area rise in
aggregate, local councils may have to reduce or otherwise adjust the amounts levied
2 In addition to rate-pegging, other budgetary arid legislative constraints operate on the ability of local councils to set rates in NSW, which also operate in other Australian local govemmentjurisdictions. These include the land and property valuation methods stipulated by state governments, constraints on the ability of local authorities to impose differential rates on different categories of ratepayer, exemptions made for various classes of ratepayers (sometimes offset by reciprocal tax arrangements), and concessions that must be applied to certain categories of ratepayer (sometimes offset by reimbursements).
3

per dollar so that total revenue does not increase by more than the percentage increase
stipulated by the Minister (Department of Local Government, 2007).
A simple example will serve to illustrate the operation of rate-pegging. Suppose the
value of total rateable land in a given local council area is equal to $250 million in
year 1. If the rate is 10 cents in the dollar for all categories of property, then income
would be equal to $25 million. If total land value increased to $300 million, due to a
'growth factor', such as land being sold to the public, then notional 'general income'
from land would be $30 million beginning year 2. But if the Minister set a rate
pegging limit at 2.5 percent for year 2, then the maximum permissible level of income
in year 2 would be $30,750,000 on a land base of$300 million. Assuming a general
revaluation of land occurred at the beginning of the fiscal year 2, which raised total
land value to $500 million in the local government area, with 'general income' limited
to $30,750,000, then the council would have to set its rate at 6.15 cents in the dollar to
accrue the permitted maximum of $30,750,000 from a land base of$500 million. In
other words, owing to a land valuation increase stemming from a 'growth factor' and
a 'general valuation', the rate had to fall from 10 cents in the dollar for all categories
of property to only 6.15 cents in the dollar (Department of Local Government, 2007,
p.75).
In terms of the Local Government Act 1993, 'general income' does not include
various rates and charges, including rates on water supply and sewerage, annual
charges for waste management and stormwater management services. Other sources
of revenue are also not covered under' general income' , such as user charges, interest,
grants, developer contributions, donations, and other forms of revenue, like fines and
business activities.
4

Under Section 208(2), Section 508A and Section 548(3) (a) and (b) of the Local
Governrnent Act 1993, councils can apply to the Minister for Local Government for
permission to increase their general income by more than the rate-peg limit. This is
called a special variation application. A council must include details of its intention to
apply for a special variation in its draft management plan and consider any
submissions received from the public. If approved, the Minister will specify the
percentage by which the council may increase its general income as well as the period
oftime over which rates may exceed the rate-peg.
Grounds for an exemption under a special variation are spelt out in the Local
Government Act 1993. For instance, under Section 208(2), the council in question
must demonstrate that it meets one of three conditions: (a) additional funding is
required for a project which has regional significance or a regional economic benefit;
(b) additional funding is necessary to finance new or improved local government
services or facilities specified in the council's management plan; and ( c) additional
funding is required to meet increases in state government charges (Department of
Local Government, 2007).
With respect to the process involved in rate-pegging, the annual rate-peg percentage is
typically set in March each year. In principle, 'this percentage reflects the projected
annual increase in costs that a typical council delivering services at levels comparable
to the previous year is likely to incur this year' (IPART, 2008, pA8). Following this
announcement, individual councils can submit requests to the Minister for Local
Government for a special variation to the rate-peg percentage. These submissions are
considered by the Minister, who makes a final determination on each submission by
5

June. This enables affected local councils to strike their rates to take effect by 1 July
of each financial year.
Given the proposition that the rate-peg percentage is supposed to reflect the 'projected
annual increase in costs' faced by councils, it is interesting to compare the rate-peg
with the Consumer Price Index (CPI) over the past ten years. Figure 1 compares the
annual rate peg with the CPI over the fiscal years 1998/99 to 2008/09:
6

Figure 1: Annual Rate Peg Percentage and Change in CPI, 1998/99 to 2008/09
NSW: Annual rate peg percentage and change in the CPI, 1998/99 to 2008/09
7
6
5
4 .. Rate Cap
~~~ I-=r I~ ~
• [, CPI (prel,;'ous year) 3
2
I~ 1- 1-
o .--Y.-
Source: Amended Table 7.1 (!PART, 200S, p.4S).
The information contained in Table I indicates that, in general , the rate cap exceeded
the change in the CPI over the previous financial year; this is true for all years, except
2002/03 and 2007/08. It should be noted that the CPI for 2001 /02 contained in the
2002/03 column in Table 1 reflects the impact of the introduction of the GST, making
it an unusual year. A second feature of the data contained in Table I is that, by way of
a general trend, the rate cap and the CP1 track each other closely. Finally, it should be
stressed that the CPI is a measure of the rate of increase of a given basket of goods
and services, weighted to reflect Australian consumption patterns, rather than a
measure of production costs.
7
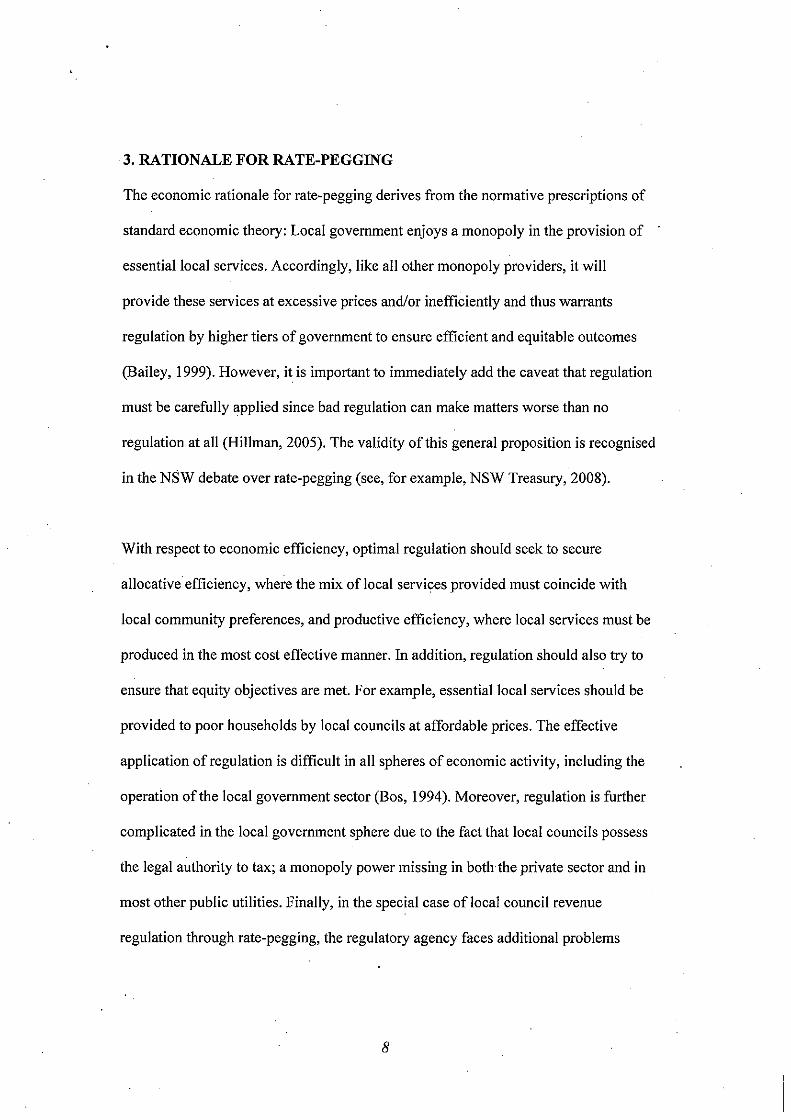
3. RATIONALE FOR RATE-PEGGING
The economic rationale for rate-pegging derives from the normative prescriptions of
standard economic theory: Local government enjoys a monopoly in the provision of
essential local services. Accordingly, like all other monopoly providers, it will
provide these services at excessive prices and/or inefficiently and thus warrants
regulation by higher tiers of government to ensure efficient and equitable outcomes
(Bailey, 1999). However, it is important to immediately add the caveat that regulation
must be carefully applied since bad regulation can make matters worse than no
regulation at all (Hillman, 2005). The validity ofthis general proposition is recognised
in the NSW debate over rate-pegging (see, for example, NSW Treasury, 2008).
With respect to economic efficiency, optimal regulation should seek to secure
allocative efficiency, where the mix oflocal services provided must coincide with
local community preferences, and productive efficiency, where local services must be
produced in the most cost effective manner. In addition, regulation should also try to
ensure that equity objectives are met. For example, essential local services should be
provided to poor households by local councils at affordable prices. The effective
application of regulation is difficult in all spheres of economic activity, including the
operation of the local government sector (80S, 1994). Moreover, regulation is further
complicated in the local government sphere due to the fact that local councils possess
the legal authority to tax; a monopoly power missing in both the private sector and in
most other public utilities. Finally, in the special case of local council revenue
regulation through rate-pegging, the regulatory agency faces additional problems
8
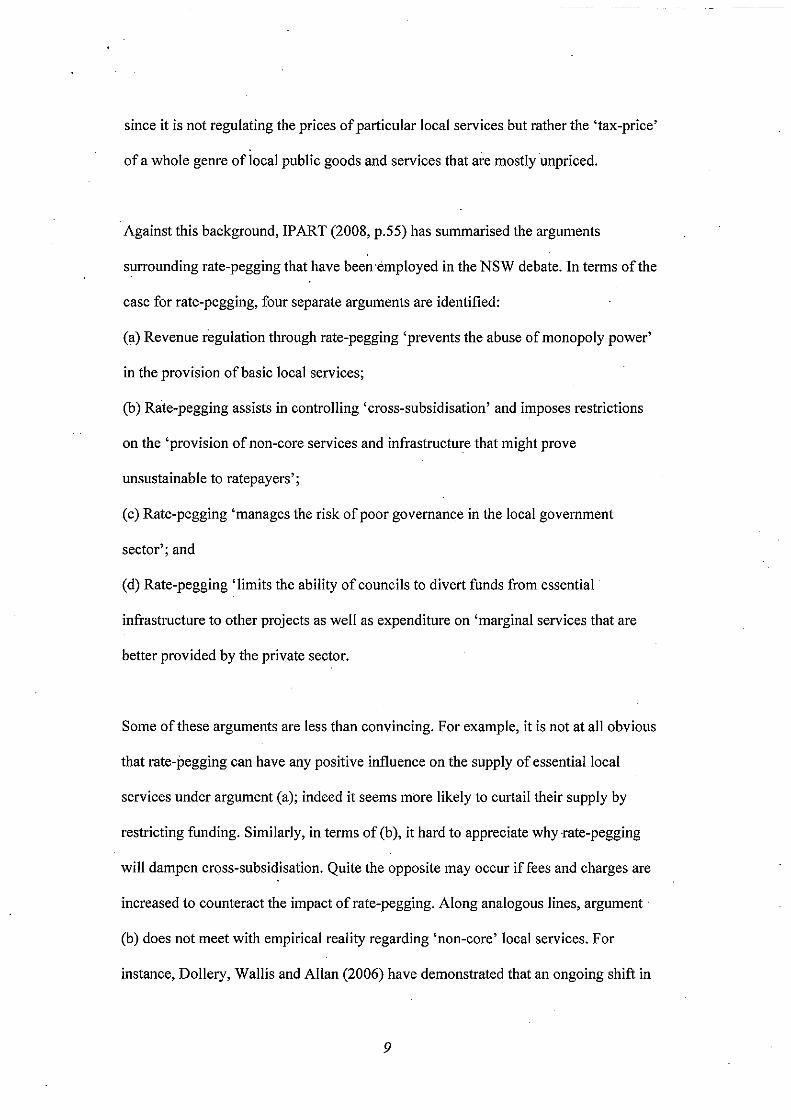
since it is not regulating the prices of particular local services but rather the 'tax-price'
of a whole genre of local public goods and services that are mostly unpriced.
Against this background, IPART (2008, p.55) has summarised the arguments
surrounding rate-pegging that have been'employed in the NSW debate. In terms of the
case for rate-pegging, four separate arguments are identified:
(a) Revenue regulation through rate-pegging 'prevents the abuse of monopoly power'
in the provision of basic local services;
(b) Rate-pegging assists in controlling 'cross-subsidisation' and imposes restrictions
on the 'provision of non-core services and infrastructure that might prove
unsustainable to ratepayers';
(c) Rate-pegging 'manages the risk of poor governance in the local government
sector'; and
(d) Rate-pegging' limits the ability of councils to divert funds from essential
infrastructure to other projects as well as expenditure on 'marginal services that are
better provided by the private sector.
Some of these arguments are less than convincing. For example, it is not at all obvious
that rate-pegging can have any positive influence on the supply of essential local
services under argument (a); indeed it seems more likely to curtail their supply by
restricting funding. Similarly, in terms of (b), it hard to appreciate why ·rate-pegging
will dampen cross-subsidisation. Quite the opposite may occur if fees and charges are
increased to counteract the impact of rate-pegging. Along analogous lines, argument
(b) does not meet with empirical reality regarding 'non-core' local services. For
instance, Dollery, Wall is and Allan (2006) have demonstrated that an ongoing shift in
9

all Australian local government jurisdictions has taken place away from 'services to
property' towards 'services to people', including NSW. Much the same objection can
be levelled against argument (d). The NSW Treasury (2008, p.13/14) also found
arguments (a) to (d) largely unconvincing.
An additional argument for rate-pegging is adduced later in Revenue Framework for
Local Government: IPART (2008, p.63) contends that local government
accountability is improved through rate-pegging because 'the process of assessing and
makin'g determinations on applications for special variation' ensures that the
'reasonableness of all applications is scrutinised' which may 'enhance councils'
accountability'. But this argument is partly undermined by that fact that only a small
proportion of NSW councils - only 26 councils in 2008/09 (IPART, 2008, Table 7.3,
p.56)- actually apply for special variation.
Two further implied arguments for rate-pegging were put forward in the Independent
Inquiry into the Financial Sustainability of NSW Local Government (Allan Report)
(2006). Firstly, rate-pegging had worked well, compared with other Australian local
government jurisdictions, if its primary aim was to constrain rises in council rates; an
argument supported by both the Productivity Commission (2008) and the NSW Local
Government and Shires Association (2008), which we will examine more closely in
this paper. Secondly, rate-pegging may have forced NSW local government to
become more efficient than it would otherwise have been in the absence of rate
pegging, especially in the domain of corporate overheads and administrative costs
(Allan Report, 2006, pp. 245-257).
10

A final and much more convincing public choice argument for rate-pegging has been
advanced by Dollery, Crase and Byrnes (2006). Invoking Wittman's (1995) model of
democratic efficiency, they asserted that the pervasive nature of the phenomenon of
'local government failure' in Australian local government meant that electors had
demanded state government oversight of local councils, especially in pecuniary
affairs. Thus, in Australian states, "'watchdog" institutions will form an agency
relationship with local government voters to demystifY fiscal illusion by monitoring
council revenue and expenditure decisions on behalf of voters' (Dollery, Crase and
Byrnes, 2006, p.350). In NSW, this 'watchdog' role has occurred inter alia in the
form of rate-pegging.
IPART (2008, p.55) put forward four separate arguments employed in the debate
against the use of rate-pegging:
(a) Rate-pegging 'limits councils' ability to provide local services';
(b) Rate-pegging prevented 'infrastructure backlogs from being addressed';
(c) Rate-pegging led councils to impose' higher user pays charges which could result
in pricing inequities'; and
(d) Rate-pegging contradicts the 'principles of democracy and accountability oflocal
government' .
Most of these arguments seem to carry weight. In particular, argument (c) appears
especially convincing. In this regard, the NSW Treasury (2008, p.14) has noted that
'constraints on general revenue distort revenue raising sources and result in higher
user charges'. Argument (a) also seems valid. After all, ifthe net effect of rate
pegging has indeed been to constrain total council income, then it follows that it must
11

have limited local services as well. Argument (d) rests on normative grounds rather
than on economic observation; it would appear obvious that regulation of rate-setting
must diminish local democratic autonomy since it arbitrarily limits local decision
making.
However, argument (b) does not meet available empirical evidence. For instance, the
recent Price WaterhouseCoopers (2006) National Financial Sustainability Study of
Local Government found that not only was a large number of local councils in all
Australian local government jurisdictions financially unsustainable in the long run,
but that most councils confronted a massive local infrastructure backlog. Moreover,
Byrnes, Dollery, Crase and Simmons (2008), Dollery, Byrnes and Crase (2007), and
others, have demonstrated that the magnitude of this backlog is so substantial that it is
now beyond the present capacity of any Australian local government system to
remedy without outside financial intervention. Since this problem is endemic to all
Australianjurisdictions, and does not appear to be comparatively more acute in NSW,
it would thus seem that the NSW local infrastructure backlog cannot be ascribed to
rate-pegging.
The Local Government and Shires Association of NSW (2008) has developed a
further and more general argument against rate-pegging couched in political economy
terms. One aspect of this argument is that rate-pegging has an unintended and broader
'dampening' effect on rates than simply the pegged limit. In this vein, the Local
Government and Shires Association of NSW (2008, p.14) contended that 'one likely
explanation for the dampening effect is that rate-pegging provides a public framework
and creates public expectations about maximum rate increases, placing political
12

pressure on councils to stay within the limit and not seek special variations'. A second
dimension of this general argument is that rate-pegging provides a useful mechanism
for local councils in NSW to engage in politically expedient 'blame shifting' onto the
state government. The NSW Local Government and Shires Association (2008, p.15)
has argued that rate-pegging 'provides an easy default option from both a political and
managerial perspective' since (a) all rate increases can be attributed to the state
government; (b) the need for community consultation to justify rate rises diminishes;
c) sticking to the rate-peg limit avoids the problems contingent on special variation
applications; (d) 'councils can blame the state government for their financial
deficiencies'; and (e) the existence of rate-pegging enables councils to avoid long
term planning. The net result of these factors has been the 'under-provision of
community infrastructure and services', the emergence of a local infrastructure
backlog and 'undermining the financial sustainability of councils'.
4. IMPACT OF RATE-PEGGING
The impact of rate-pegging on the NSW local government sector is best assessed not
in isolation, but rather in comparison with the experience of local government systems
in other Australian state jurisdictions which do not have any regulatory ceiling
imposed on rate increases. In other words, the unique use of rate-pegging in NSW
allows analysts to treat it as a kind of 'natural experiment' in Australian local
government. A comparative exercise of this kind faces several difficulties, quite apart
from the ubiquitous problem of data comparability. The most important of these
difficulties in the present context are twofold:
(a) There are substantial differences in relative significance of different sources of
revenue in the different states (Worthington and Dollery, 2001; 2002). For example,
13

IPART (2008, p.25) has observed that 'there tends to be an inverse relationship
between taxation revenue and revenue obtained from the sale of goods and services'.
Thus 'states with greater reliance on taxation revenue (South Australia (57.9 per cent),
Victoria (47.2 per cent), and Western Australia (43.5 per cent» collected less revenue
from the sale of goods and services, whereas states with less reliance on taxation
revenue (Tasmania (32.2 per cent) and Queensland (26.0 per cent» obtained greater
revenue from the sale of goods and services' . By contrast, the NSW local government
sector 'is close to average, with a relatively even split in terms of its reliance on either
revenue source'. However, in the present context, this problem is ameliorated by the
fact that we are not concerned with absolute differences in the level of rates between
NSW and other state local government jurisdictions, but rather in the rates of change
in property tax revenue through time.
(b) Considerable variation exists in the functions of local government in the different
jurisdictions (Worthington and Dollery, 200 I; 2002), which affect both expenditure
and revenue patterns. For instance, in Queensland, Tasmania and non-metropolitan
NSW (outside of the greater Newcastie-Sydney-Wollongong conurbation served by
Sydney Water and Hunter Water), councils provide sewerage and water supply
services, which earn an income, in contrast to the other state local government
jurisdictions. In addition, as we have seen, there is an ongoing shift in local
government function away from 'services to property' towards 'services to people'
(Dollery, Wallis and Allan, 2006), which further distorts comparisons, unless it is
heroically assumed that this shift has occurred in a uniform manner across all states.
However, because we are chiefly concerned with trends through time in rate rises,
both of these problems become less acute.
14

Difficulties (a) and (b) are compounded by the fact that large disparities in the
capacities of individual local councils to raise rate revenues also exist within given
state jurisdictions, which hasbeen vividly illustrated in the Productivity
Commission's (2008) Assessing Local Government Revenue Raising Capacity,
especially Table 3.1 in this Report. While this is probably mostly attributable to the
socio-economic characteristics of different local government areas, particularly local
disposable incomes and their impact on the ability of householders to pay rates,
numerous other influences are obviously at play, such as 'differences between urban,
rural and remote councils, in population, rating base and the ability or willingness of
councils to levy user charges' (DOTARS, 2007, p.l2).
With these caveats in mind, we now seek to determine the impact of rate-pegging in
NSW local government in the larger Australian local government context. Figure I
illustrates trends in local government rate revenue per capita by state and territory
jurisdiction over the period \998/99 to 2005/06, expressed in constant 1998/99
dollars.
15

Figure 2: Local Government Rate Revenue per Capita, 1998/99 to 2005/06
400 SA
380 Vie
360 WA Aust
340 Tas
'" 320 Qld
ACT
'a !'l 300 NSW 1!. ~ 280
260
240 ~ ____ NT
220
200
1998-99 1999- 00 2000- 01 2001- 02 2002-03 2003-04 2004-05 2005-06
Year
SOllrce: DOTARS, 2007, p. 15 .
A glance at Figure 2 demonstrates that the average per capita rate revenue funding
gap between NSW and the other Australian jurisdictions has grown over the period in
question. Furthermore, it is noteworthy that NSW also has ' the lowest council rates
per capita of any jurisdiction in Australia other than the Northern Territory ' (Allan
Report, 2006, p.207).
Similar insightful data have been assembled in the Allan Report (2006, Table 9.4,
p.207), reproduced here in Tab le I , which reinforce the information in Figure 2.
16

Table 1: Percentage Rate Increases by State Jurisdiction, 1995/96 to 2003/04
State or territory Per cent increase NSW 29.2% ACT 35.2% Tasmania 36.3% South Australia 55.1% Queensland 55.6%
. Western Australia 64.8% Victoria 66.1% Gross domestic product 61.8%
Source: Allan Report (2006, p.207.
It is evident from Table 2 that that percentage increase in rates was substantially lower
than in the other states; indeed, it amounted to less than half of the rate rises
experienced in Western Australia and Victoria. From this and other data, the Allan
Report (2006, p.2007) concluded that 'rate-pegging has been a constraint on [NSW]
councils' revenue-raising capacity causing it to fall behind other states,
notwithstanding NSW's relatively strong property market over this period compared
with Australia as a whole'. The Productivity Commission (2008, p.xxxiii/xxxiv) drew
very similar conclusions from its deliberations. After stressing that 'the rate of growth
in rates revenue in NSW has been among the lowest of all jurisdictions over the past
seven years', NSW 'also has rate revenue per person below that of most other
jurisdictions'. It thus found that 'rate-pegging in NSW appears to have been
restricting revenue raised from rates, notwithstanding scope for councils to seek
variations to mandated rate increases'. The Local Government and Shires Association
of NSW (2008, p.14) reached an analogous conclusion: 'If the objective of rate-
pegging was simply to constrain council rate revenues, rate-pegging has been a
success' since 'NSW rate revenue growth is lagging other jurisdictions'.
17

In addition, as we have seen, the NSW Local Government arid Shires Association
(2008, p.14) contended that rate-pegging had several other unintended effects. It has
asserted that rate-pegging has reduced investment in infrastructure maintenance and
renewal- an argument which does not accord with the evidence garnered by the
PriceWaterhouseCoopers(2006) Report. A much more important argument in the
present context resides in the NSW Local Government and Shires Association (2008,
p.14) claim that the special variation option is under-utilised, which 'shows that rate-
pegging system has had a more general 'dampening' effect than the stipulated rate peg
itself.
This proposition is worth considering in more detail. Table 2 provides information on
the number of special variation applications submitted over the past seven years and
the number of these applications that were approved by the Minister.
Table 2: Total Special Variation Applications Submitted and Approved, 2002/03
to 2008/09.
2002103 2003/04 2004/05 2005/06 2006/07 2007/08 2008/09
Rate peg percentage 3.3 3.6 3.5 3.5 3.6 3.4 3.2
Number of applications 30 23 25 42 46 34 26 for special variation received Number of applications 23 23 22 30 39 30 24 for special variation approved Total number of 172 172 152 152 152 152 152 Councils
Source: IPART (2008, p.56) and Allan Report (2006, p.50).
The information contained in Table 2 seems to vindicate the observations made by the
NSW Local Government and Shires Association (2008), considered earlier in this
18
paper, regarding the broader ' dampening ' effects of rate-pegging. Thus in the 2008/09
special variation round, only 26 councils applied - a mere 17 per cent of all councils -
of which 24 were successful. Put differently, while only a small proportion of councils
actually apply under the special variation system, a very high faction of these
applications prove successful, ranging from a low of7l per cent in the 2005/06 round
to a high of I 00 per cent in 2003/04. In other words, even though the great majority of
special variation applications are approved by the Minister, comparatively few local
authorities apply; a fact which thus must be ascribed to factors other than the
prospects of success of an application.
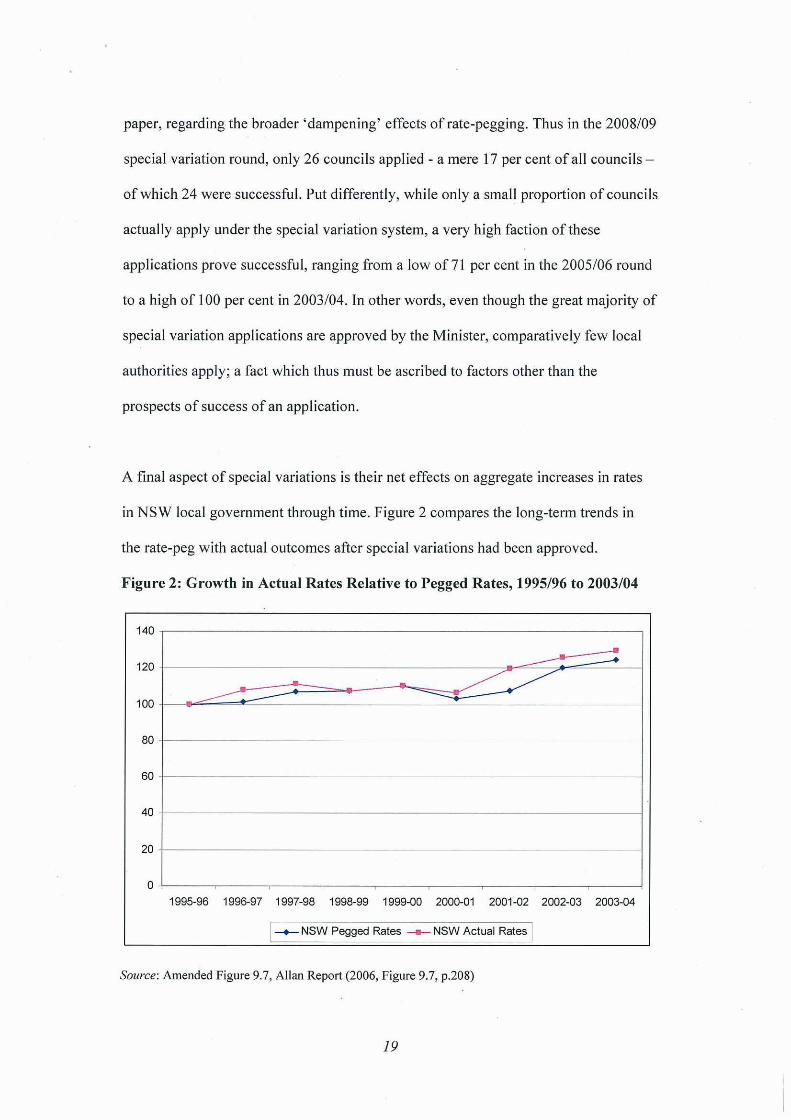
A final aspect of special variations is their net effects on aggregate increases in rates
in NSW local government through time. Figure 2 compares the long-term trends in
the rate-peg with actual outcomes after special variations had been approved.
Figure 2: Growth in Actual Rates Relative to Pegged Rates, 1995/96 to 2003/04
140
.... 120 ----- ~
~~ ...----:: 100
80
60 ·
40
20 ·
0 ·.
1995·96 1996·97 1997-98 1998-99 1999-00 2000-01 2001-02 2002-03 2003-04
I--+- NSW Pegged Rates ---- NSW Actual Rates I
SOllree: Amended Figure 9.7, Allan Report (2006, Figure 9.7, p.208)
19

The data contained in Figure 2 demonstrate that the impact of special variations on
actual outcomes has little effect; the observed final growth of rates diverges
minimally from the rate-pegged trend line. The Allan Report (2006, p.207) drew the
same general conclusion; 'additional revenue allowed' as a consequence of the special
variation system has 'not been large as a proportion of the total increase in the rate
peg limit'.
5. CONCLUDING REMARKS
We have seen that the case for rate-pegging seems to hinge only on three convincing·
arguments. In the first place, as we have demonstrated in this paper, rate-pegging has
achieved its basic objective of slowing increases in NSW council rates over time
relative to other Australian jurisdictions (Allan Report, 2006). Secondly, a prima facie
case exists which suggests that the constraints imposed on council revenue by rate
pegging may have enhanced the administrative efficiency of NSW councils and
reduced their overheads, at least in comparison with the NSW state government
departments (Allan Report, 2006). Finally, rate-pegging has enjoyed ongoing and
strong public support (IRIS Research, 2005), which appears to demonstrate the
operation of an efficient 'political market' in NSW (Dollery, erase and Byrnes (2006)
in the Wittman (1995) sense.
By contrast, several cogent arguments have been advanced against rate-pegging.
Firstly, it has depressed the rating effort by NSW councils more than it intended since
it has had a broader' dampening' impact on rates in particular and local government
finance more generally. Secondly, the existence of rate-pegging has partly absolved
20
local councils of full responsibility for their own financial affairs, with numerous
deleterious consequences, not least a lack oflong-term planning. Finally, rate-pegging
has undermined the democratic bedrocks of 'local voice' and 'local choice' in local
government and thereby reduced local autonomy.
Despite the announcement by NSW Premier Rees that his government is considering
the abolition of rate-pegging, its continuing popularity seems to indicate that, at best,
efforts will be made to improve the operation of rate-pegging and thereby at least
ameliorate some of its harmful effects. If rate-pegging is indeed to be retained in
NSW local government, over the years there has been no shortage of suggestions on
how to improve its operation. For example, a Rate Pegging Taskforce, established by
the NSW Local Government and Shires Association in 2001, called for a
'compromise' two-tiered rate-pegging system (Centennial Consultancy, 2004). Tier I
would employ an annually determined index of local government costs, which would
apply to all NSW councils, which would accurately reflect the real costs impinging on
local councils much more precisely than the CPI used at present. Tier 2 would replace
the current special variation system with a method that took the circumstances of
individual councils into account and allow councils to make their own variations
above Tier 1 levels up to some stipulated maximum.
The Allan Report (2006, p.210) also presented a 'compromise' proposal to revise the
rate-pegging system. The Report argued that 'the view of this Inquiry is that the peg
should be made less discretionary (i.e. not subject to Ministerial fiat), be based on
explicit criteria (e.g. local government unit costs), and be made more transparent (i.e.
be published in full),. Moreover, 'any variations to the peg with respect to a particular
21

council should be more fully disclosed and explained in terms of rational criteria that
are applied consistently across all councils and not subject to capricious change'.
At a more general level, in its Revenue Framework/or Local Government, IPART
(2008, pp.63/65) presented five alternative regulatory frameworks that could replace
the current rate-pegging system. While a detailed evaluation of these options falls
outside the scope of this paper, it is nonetheless worth briefly outlining these
possibilities. Option 1 would retain existing rate-pegging arrangements, but publish
the economic basis for the peg, modify the special variations process, and leave all
other charges unregulated. Option 2 would develop a more' disaggregated form of
rate-pegging' using specific pegs for specific categories of council. Option 3 would
'reduce the scope of rate-pegging to cover only local government revenue needed to
fund operating expenditure', thereby excluding capital expenditure and all other
charges unregulated. Option 4 would retain rate-pegging but exempt individual
councils, provided they could demonstrate financial prudence and operational
efficiency in various stipulated ways. Finally, Option 5 would remove mandatory rate
pegging and simultaneously 'enhance accountability to the local community' using
several criteria and the threat of a 'default rate cap'.
A detailed analysis of the characteristics of these five options has been conducted by
the NSW Treasury (2008). It has also suggested several additional feasible approaches
to NSW council rates regulation. Amongst all these alternative regulatory methods,
the NSW Treasury (2008, p.27) argued that the objectives of the current NSW rate
pegging regime could best be achieved at the least cost by retaining the existing rate
pegging system, but with 'improved criteria'.
22

References
Bailey, S. J. (1999) Local Government Economics: Principles and Practice (London:
Macmillan) .
Bos, D. (1994). Pricing and Price Regulation (Amsterdam: Elsevier North Holland).
Byrnes, J., Dollery, B. E., Crase, L. and Simmons, P. (2008) Resolving the
infrastructure crisis in local government: a bond market issue approach based on local
council income, Australasian Journal of Regional Studies, 14(2), pp. 115-131.
Centennial Consultancy (1994) NSW Rate-pegging: Refining the SVA Process: Report
Preparedfor the NSW Local Government and Shires Association (Sydney: NSW
Local Government and Shires Association).
Department of Local Government (2007) Council Rating and Revenue Raising
Manual (Sydney: NSW Department of Local Government).
Department of Transport and Regional Services (DOTARS) (2007) 2005106 Local
Government National Report (Canberra: DOTARS).
Dollery, B.E., Byrnes, J.D. and Crase, L (2007) The infrastructure crisis in Australian
local government: a proposed federal asset fund solution" Australasian Journal of
Regional Studies, 13(1), pp. 3-19.
23

Dollery, B. E., Crase, L. and Byrnes, J. L. (2006) local government failure: why does
Australian local government experience permanent financial austerity?, Australian
Journal o/Political Science, 41(3), pp. 395-409.
Dollery, B. E., Crase, L. and Johnson, A. K. (2006) Australian Local Government
Economics (Sydney: UNSW Press).
Dollery, B. E., Wallis, J. L. and Allan, P. (2006) 'The debate that had to happen but
never did: the changing role of Australian local government, Australian Journal 0/
Political Science, 41(4), pp. 553-567.
Hillman, A. L. (2005) Public Finance and Public Policy (Cambridge: Cambridge
University Press).
Independent Pricing and Revenue Tribunal (IPART) (2008) Revenue Framework/or
Local Government: Issues Paper (Sydney: IPART).
Inquiry into the Financial Sustainability of NSW Local Government (Allan Report)
(2006) Are Councils Sustainable: Final Report and Recommendations (Sydney: NSW
Local Government and Shires Association).
IRIS Research (2005) Opinion poll of local government in NSW, in Inquiry into the
Financial Sustainability of NSW Local Government (Allan Report) (2006), Are
Councils Sustainable: Final Report and Recommendations, Volume Two (Sydney:
NSW Local Government and Shires Association).
24

Johnson, A. K. (2001) Beyond the Three R's: Financing Local Government
. (Armidale: Centre for Local Government, University of New England).
Local Government and Shires Association of NSW (2008) Submission to the
Independent Pricing and Regulatory Tribunal of NSW's Review of Revenue
Frameworkfor Local Governl!'lent (Sydney: Local Government and Shires
. Association of NSW).
NSW Treasury (2008) Submission to the NSW Independent Pricing and Regulatory
Tribunal (Sydney: NSW Treasury).
Price WaterhouseCoopers (2006), National Financial Sustainability Study of Local
Government (Canberra: Australian Local Government Association).
Productivity Commission (2008) Assessing Local Government Revenue Raising
Capacity (Canberra: Productivity Commission Research Report).
Wittman, D. (1995) The Myth of Democratic Failure: Why Political Institutions are
Efficient (Chicago: University of Chicago Press).
Worthington; A. C. and Dollery, B. E. (2001) Diversity in Australian local
government: the case against the imposition of national uniform standards,
International Review of Public Administration, 6(1), pp. 49-58.
25

Worthington, A. C. and Dollery, B. E. (2002), 'An Analysis of Recent Trends in
Australian Local Government', International Journal of Public Sector Management,
15(6),496-515.
26