Embed Size (px)
Citation preview

PART D: BUDGET
STATEMENT
CENTRELINK


3
SECTION 1: AGENCY OVERVIEW
OVERVIEW
Centrelink’s purpose is to provide exceptional service to the community by linking Australiangovernment services and to achieve best practice in service delivery. Its vision is to make apositive difference to Australian individuals, families and communities during transitionalperiods in their lives.
Centrelink delivers information, payments and services on behalf of the following clientagencies:
� Commonwealth Department of Family and Community Services (FaCS);Commonwealth Department of Employment, Workplace Relations and Small Business
(DEWRSB);Commonwealth Department of Education, Training and Youth Affairs (DETYA);Commonwealth Department of Agriculture, Fisheries and Forestry Australia (AFFA);Commonwealth Department of Communications, Information Technology and the Arts (DoCITA);Commonwealth Department of Finance and Administration (DOFA);Commonwealth Department of Foreign Affairs and Trade (DFaT);Commonwealth Department of Health and Aged Care (Health), including the Office of Hearing
Services;Commonwealth Department of Immigration and Multicultural Affairs (DIMA);Commonwealth Department of Transport and Regional Services (DoTRS);Commonwealth Department of Veterans’ Affairs (DVA);Child Support Agency;Australian Dairy Corporation;Dairy Adjustment Authority;Australian Electoral Commission;New South Wales State Government; andall State and Territory Housing Authorities.
Centrelink acts in partnership with other levels of government and the broader Australiancommunity and distributes payments to Australian families, communities and individuals.These payments include income support, family assistance, disability and carers, youth andstudents, rural and housing and retirement. The outcomes relate to Government welfarepriorities.
APPROPRIATIONS
Centrelink is a service provider operating under purchaser-provider arrangements. The majorityof Centrelink’s funding is appropriated to its client departments and then paid to Centrelinkaccording to either Business Partnership Agreements or Service Level Agreements (refer toTable 2.2).
Centrelink receives direct appropriations for funding relating to equity injections andDepartmental loans. In 2001-02, Centrelink has $24.250 million appropriated as an equity

4
injection (refer to Tables 1.2 and 3.4) and $0.250 million for Compensation for Detrimentcaused by Defective Administration (CDDA) (refer to Tables 1.1 and 2.1). Table 1.1, on thefollowing page, shows the total revenue for Centrelink for 2001-02 by Government outcome.

5
Table
1.1
: Centr
elin
k A
ppro
priations
and O
ther
Revenue 2
001 -
02 (
$’0
00)
OU
TC
OM
ES
Re
ve
nu
eP
rice
of
Sp
ecia
lT
ota
lT
OT
AL
fro
m o
the
ro
utp
uts
Ap
pro
ps
Ad
min
iste
red
AP
PR
OP
RIA
TIO
NS
so
urc
es
(4)
(3)
Ap
pro
pri
ati
on
s
Bil
l N
o.
1T
ota
lB
ill
No
. 1
Bil
l N
o.
2
(SP
Ps)
(C =
A+
B)
(E =
C+
D)
(2)
(I =
F+
G+
H)
(J=
C+
I)
(A)
(B)
(C)
(D)
(E)
(F)
(G)
(H)
(I)
(J)
Outc
om
e 1
: 2
50
250
1,7
99,3
97
1,7
99,6
47
--
--
250
0.0
1%
(1)
To
tal
25
02
50
1,7
99
,39
71
,79
9,6
47
00
00
25
0
(K1
)(K
1)
(K1
)(K
1)
Am
ou
nts
in
sh
ad
ing
are
in
clu
ded
in
an
nu
al
ap
pro
pri
ati
on
bil
lsD
epart
menta
l Capital (E
quity I
nje
ctio
ns
and L
oans)
24
,25
0(K
2)
Adm
inis
tere
d C
apital
-
TO
TA
L A
PP
RO
PR
IA
TIO
NS
24
,50
0
De
pa
rtm
en
tal
(P
rice
of
Ou
tpu
ts)
Ad
min
iste
red
Re
ve
nu
e f
rom
Go
ve
rnm
en
tA
nn
ua
l
(Ap
pro
pri
ati
on
s)
Ap
pro
pri
ati
on
s
Sp
ecia
l
Ap
pro
p
1.
Am
ount
K1 r
efe
rs t
o B
udgete
d S
tate
ment
of Fin
anci
al Perf
orm
ance
, and a
mounts
K2 r
efe
rs t
o C
apital Budget.
2.
Under
the a
ppro
priation s
truct
ure
, Bill
No.
2 i
ncl
udes
Speci
fic
Purp
ose
Paym
ents
(SPPs)
, N
ew
Agency
Outc
om
es
(NAO
s),
adm
inis
tere
d c
apital
and d
epart
menta
l
capital via
depart
menta
l in
ject
ions
and loans.
3.
Refe
r to
Budgete
d S
tate
ment
of Fin
anci
al Perf
orm
ance
for
applic
ation o
f agency
revenue.
4.
Revenue f
rom
oth
er
sourc
es
incl
udes
sale
of
goods
and s
erv
ices
to a
genci
es
such
as
Fam
ily a
nd C
om
munity S
erv
ices
(FaCS),
Em
plo
ym
ent
Work
pla
ce R
ela
tions
and
Sm
all
Busi
ness
(D
EW
RSB)
and o
ther
revenue s
uch
as
inte
rest
earn
ed.
*Perc
enta
ge fig
ure
s in
dic
ate
the p
erc
enta
ge c
ontr
ibution o
f R
evenue fro
m G
overn
ment
(Depart
menta
l Appro
priations)
to t
he T
ota
l Price
of O
utp
uts
, by o
utc
om
e.

6
BUDGET MEASURES — OVERVIEW
Centrelink will receive funding from FaCS to implement the following Budget Measures in2001-02:
AUSTRALIANS WORKING TOGETHER
A Fair Go for Mature Age Workers: This measure will give working people aged 50 and over moreencouragement to participate, better assistance and more help for retrenchees.
A Better Deal for People with Disabilities: This measure will improve employment prospects andcommunity engagement for people with disabilities and/or temporary incapacities through more accurateassessment of their work capacities, increased placement in specialist disability employment services andincreased participation in mainstream education and training.
Getting People the Right Help: This measure will help to ensure disadvantaged people get the right helpthrough better assessment, providing more appropriate assistance.
Helping Parents to Return to Work: This measure will encourage parents with school-age children toprepare for a return to the paid workforce as their children grow up, through annual interviews, moreassistance, and part time activity requirements for parents with a youngest child aged 13 – 15.
More Child Care Places: This measure will improve access to child care and simplify child care feeassistance for Jobs, Education and Training (JET) customers and will provide more outside school hours careplaces. The combination of these two measures will help to facilitate the transition for greater numbers ofparents into employment.
Helping People to Find Jobs: This measure is aimed at helping unemployed people return to work. Itwill improve employment assistance outcomes across urban, regional and remote areas by enhancing Workfor the Dole, Job Search Training and Intensive Assistance programmes. Mutual obligation requirements willbe standardised for people on unemployment payments aged up to 49 years.
Help to Participate: This measure introduces a Working Credit that will let workforce age people onincome support accrue a credit of up to $48 a fortnight that will allow some of their earnings to be excludedfrom the income test when they start work; a simpler income test assessment of earnings from work forworkforce age pensions and Parenting Payment; and a Literacy and Numeracy Supplement to incomesupport recipients undertaking approved literacy and numeracy training.
Promoting Self-Reliance for Indigenous People: The level of service delivery and employmentoutcomes for Indigenous Australians will be improved as a result of initiatives for Indigenous people.
ACKNOWLEDGING OLDER AUSTRALIANS
One-off Payment to the Aged: Provides a one-off payment of $300 to income support customers of agepension age. This payment will be made automatically without them needing to lodge a claim. A one-offpayment will be available to people in the same age group who are outside the income tax and socialsecurity systems and who do not have partners in either system.
Exempt Superannuation from the Social Security Means Test for People Aged Between 55 andAge Pension Age: This measure is expected to benefit approximately 55,000 customers by exemptingsuperannuation assets from the means test for people aged 55 or more, but below age pension age.

7
Extend Eligibility for Commonwealth Seniors Health Card Holders: This measure will extendeligibility for the Commonwealth Seniors Health Card. The annual income limits for eligibility for the Cardwill be increased from $41,000 to $50,000 for singles and from $68,676 to $80,000 for couples.
Telephone Allowance to Commonwealth Seniors Health Card Holders: This measure will extendTelephone Allowance to people who qualify for a Commonwealth Seniors Health Card.
COMPLIANCE MEASURES
Prevention: To assist Centrelink in preventing identity related fraud and associated debts by improvingproof of identity processes, and developing client risk profiles to enable Centrelink to target its contacts withcustomers.
Detection: To increase the range of data matching undertaken, and ensure funding is available to processreviews arising from tip-offs received from the public.
Research and Development: To conduct feasibility studies with the Australian Taxation Office into theeffectiveness of data matching with group certificate data and the Australian Business Number (ABN) data.To also conduct a random sample survey of a number of payments to assess the effectiveness ofCentrelink's control framework.
INTERNATIONAL MEASURES
New and Revised International Social Security Agreements: To adjust for a new Social SecurityAgreement between Australia and the USA, and revised agreements with Canada, Austria, Portugal, Spainand the Netherlands.
Further Simplification of International Payments: To extend the working life residence for overseaspensioners to 30 years and allow certain people to build up their working life residence after retirement, andstandardise the recovery of overpayments where lump sum foreign pensions are received.
OTHER MEASURES
Family Homelessness Prevention and Early Intervention Pilots: To conduct pilots to target familiesat risk of homelessness as identified through a number of possible indicators such as frequent changes ofaddress, debt patterns, multiple breaches and frequent calls on emergency relief or payments so that theycan be given early assistance to prevent homelessness arising.
NON BUDGET MEASURES
New Social Security Arrangement between Australia and New Zealand: People from NZ will needto obtain permanent resident status in the same way as all other migrants to Australia to claim SocialSecurity Act (SSA) payments. Special Category Visas (SCV) will still be available but the holder will no longerbe entitled to the current range of income support payments available.
Family Tax Benefit Shared Care Arrangements and Child Support Agency Liability: To allow theRegistrar of the Child Support Agency to redirect a child support payee’s Family Tax Benefit in certain casesto the resident parent for a nominated period of time.

8
Introduce Discretion for Parents who have Shared Care to Waiver Eligibility for Family TaxBenefit: To allow certain non residential parents with up to 30% shared care to waive their eligibility forFamily Tax Benefit for a nominated period of time to allow the resident parent to claim 100% of Family TaxBenefit for the child.
Provide Health Care Cards to Foster Children: Further extend access to Health Care Cards for fosterchildren.
OTHER PORTFOLIO MEASURES
Increase in the Permanent Migrant Intake: DIMA anticipate an increase in Spouse Provision Visas andan increase in skilled Australian sponsored migrants. This will lead to an increase in the number of NonAssurance of Support cases.

9
ADMINISTERED CAPITAL, DEPARTMENTAL EQUITY INJECTIONS AND
LOANS
A departmental equity injection of $24.250 million is provided in the 2001 - 02 Budget, asindicated in Table 1.1 and as accounted for in the Capital Budget (see Tables 3.4 and 3.5), andAppropriation Bill Number 2, 2001 - 02.
$8.144 million is for the implementation of previous Budget measures. The additional equityinjection of $16.106 million will be used for internally developed software to assist with theimplementation of the Helping Parents Return to Work and Help to Participate measures of theAustralians Working Together package.
Table 1.2: Centrelink Summary of Equity Injections
2001 - 02 ($'000)
Previous Budget measures 8,144
2001 - 02 Budget initiatives 16,106
Total 24,250

10
SECTION 2: OUTCOMES AND OUTPUTS INFORMATION
OUTCOMES AND OUTPUT GROUPS
Centrelink has one Government outcome: ‘Effective delivery of Commonwealth services toeligible customers’. This outcome is supported by the output of ‘Efficient delivery ofCommonwealth services to eligible customers’. Centrelink’s output consists of a range ofbusiness outcomes aligned to its strategic goals and contributes to the outcomes of all its clientagencies.
Chart 2.1 shows the relationship between the one Government outcome and the contributingoutput for Centrelink.
Financial details for Outcome by output appear in Table 2.1 while non-financial informationappears in Table 2.4.
Chart 2.1: Centrelink Outcomes and Output Groups
Outcome 1
Effective delivery of
Commonwealth services to
eligible customers
Total Resources $1,799.6m
Centrelink
Chief Executive Officer:
Ms Sue Vardon
Total Resources $1,799.6m
Output Group 1.1
Efficient delivery of
Commonwealth services to
eligible customers
Total Resources $1,799.6m

11
TRENDS IN RESOURCING ACROSS OUTCOMES
Table 2.1.1: Centrelink Total Resources for Outcome 1
Final Budget
estimates estimates
2000 - 01 2001 - 02
$'000 $'000
Total Administered Resourcing (A) 0 0
Subtotal output group 1.1 250 250
250 250
Revenue from other sources
Family and Community Services (1) 1,603,698 1,648,427
Employment, Workplace Relations and Small Business 107,765 111,528
Education, Training and Youth Affairs 14,029 13,073
Health and Aged Care 2,397 2,418
Agriculture, Fisheries and Forrestry Australia 11,118 5,130
Other (2) 22,979 18,821
Section 31 of the FMA Act
Total revenue from other sources (C) 1,761,986 1,799,397
1,762,236 1,799,647
1,762,236 1,799,647
Average staffing level (number) 21,180 21,430
Total price of departmental outputs (B+C)
(Total revenue from Government and from other sources)
Total estimated resourcing for outcome 1 (A+B+C)
(Total price of outputs and admin expenses)
ADMINISTERED APPROPRIATIONS
DEPARTMENTAL APPROPRIATIONS
Output Group 1.1 - Efficient Delivery of Commonwealth
Services to Eligible Customers
Total revenue from government (appropriations) (B)
1 Revenue from Family and Community Services does not include adjustments to funding for Family TaxBenefit Shared Care Arrangements and Child Support Agency Liability change of implementation date, orfunding for delivering the One-Off Payment to Older Australians, Extension of Telephone Allowance toCSHC holders, and Exempt Superannuation from the Social Security Means Test for People AgedBetween 55 and Age Pension Age measures.
2 Other revenue includes revenue from anticipated new business outside existing Business PartnershipArrangements or Service Level Agreements with other client agencies.

12
Table 2.2: Centrelink Summary of Future Revenue
2001 - 02 2002 - 03 2003 - 04 2004 - 05
$'000 $'000 $'000 $'000
FaCS (1) 1,648,427 1,722,338 1,677,193 1,650,744
DEWRSB 111,528 114,424 115,867 117,786
DETYA 13,073 13,191 13,569 13,492
Health 2,418 2,469 2,526 2,500
AFFA 5,130 3,169 2,839 1,623
Subtotal Service Delivery 1,780,576 1,855,591 1,811,994 1,786,145
Revenue from other sources (2) 19,071 42,266 56,273 56,336
Total 1,799,647 1,897,857 1,868,267 1,842,481
1 Revenue from Family and Community Services does not include adjustments to funding for Family
Tax Benefit Shared Care Arrangements and Child Support Agency Liability change of implementation date, orfunding for delivering the One-Off Payment to Older Australians, Extension of Telephone Allowance to CSHCHolders, and Exempt Superannuation from the Social Security Means Test for People Aged Between 55 andAge Pension Age measures.
2 Revenue from other sources includes revenue from anticipated new business outside existing
Business Partnership Arrangements or Service Level Agreements with other client agencies.
Chart 2.2: Centrelink Summary of 2001 - 02 Revenue
FaCS
DETYA
DEWRSB
O ther AFFAHealth

13
Chart 2.3: Trends in Centrelink Service Delivery Revenue
$1.762$1.800
$1.898 $1.868 $1.842
.000
.250
.500
.750
1.000
1.250
1.500
1.750
2.000
2000-01 2001-02 2002-03 2003-04 2004-05
Financial Years
1 The most significant change to Centrelink’s estimated revenue from 2002 - 03 onwards can be
attributed to the implementation and ongoing workload for the Australians Working Together package. Thisis reflected in the increase seen in the estimate for 2002 – 03.

14
CONTRIBUTION OF OUTPUTS TO OUTCOME 1
Centrelink’s output of efficient delivery of Commonwealth services to eligible customersreflects the Government’s objective to provide a better standard of service delivery to thebroader Australian community and to individuals, and to do this with increasing effectiveness.
Centrelink is tasked with delivering a range of services and works in partnership with clientagencies, provider and community organisations advising on assistance and delivery design andensuring the delivery of services appropriate to each customer’s circumstances and needs.Centrelink continues to build on its plans to offer customers a wider range of options foraccessing face to face, mobile, telephone and Internet services.
Centrelink has two major roles:
� paying benefits and allowances to entitled Australians on behalf of its client agencies; and
� providing Australians with options from a range of services provided by Federal, State,local governments and community service organisations.
In this capacity Centrelink:
� assesses customer entitlements on the basis of current Government policy;
� pays appropriate benefits and allowances accurately on time;
� prevents and detects fraud;
� identifies customers who have additional needs and refers them to specialist Federal, State,local government or community based agencies; and
� delivers a wide range of services to match the needs of the diversity of people within theAustralian community.
CENTRELINK’S DEVELOPMENT
The stages of Centrelink’s development are as follows:
Stage 1: The transition to, and creation of, Centrelink (completed in June 1998). The creationof Centrelink was part of the Commonwealth Government’s public sector reforms designed toproduce more efficient and streamlined government services via a one-stop-shop, and throughthe innovative use of Information and Technology.
Stage 2: The consolidation phase (1998 - 99 to 2000 - 01). Centrelink focused on ensuring thatcurrent work was undertaken accurately and effectively, and continue to develop its capacity inareas that require improvement. This was an important time in Centrelink’s development –demonstrating its commitment to continuous improvement in standards of service to clients,customers and the community.

15
By listening to customers, Centrelink has learnt that they value an organisation that is easy todeal with, which treats them as individuals, values their time, and minimises the complexity ofdealing with Government. At the same time, the Government and Centrelink client agencieswant to see the delivery of efficient and effective services for customers that clearlydemonstrate value for money.
At the completion of stage 2, Centrelink has returned $586.2 million in efficiency dividends toGovernment while improving on overall performance.
Stage 3: Centrelink’s new service delivery model, delivering services based on a customer’s‘life events’. The service delivery model will transform the way in which Centrelink deliversits services. Access will be designed to balance customer preferences and use of the mosteffective channel for the services offered. Centrelink will improve its systems and processes toenable the Government to enhance access to a wider range of service offers into the future.
Centrelink will commence a long-term transition from delivering services predominantlythrough its Customer Service and Call Centres to a mix of physical and online service andinformation delivery. This will be done cognisant of customer preference, the needs of clientagencies for cost effective service delivery and the respective costs of delivering throughvarious channels.
Centrelink will support customers by delivering:
� personalised assessments and referrals;
� appropriate benefits and allowances paid accurately on time;
� a simpler and more convenient customer experience;
� links with community based service sector, intermediary organisations and other levels ofgovernment; and
� improvement of services in rural and regional Australia.
Centrelink will support client agencies by delivering:
timely service and accurate assessment of customer entitlements;timely and adaptive responses to changes in business;enhanced community connections;assured quality and accountability;expert advice on service delivery design and new initiatives; andservices to ensure policy and programme outcomes are met.

16
GOALS AND STRATEGIES
The Centrelink Strategic Directions 2001 - 06 is the key document that engages Centrelink’speople in a common purpose and approach. It explains Centrelink’s purpose, vision, missionand goals, and the underlying details necessary to achieve them. It is supported by theCentrelink Business Plan at the corporate level and Business Improvement Plans at the locallevel.
Six goals will guide Centrelink to achieve its commitments to Government, client agencies,customers, Centrelink people and the community. The details to achieve each goal, as well asthe areas of focus for the financial year 2001 - 02, are outlined in the following tables.
Goal: Client Partnerships
To build partnerships with client agencies that deliver the required results and providevalue for money
Details:
etain current business by delivering agreedbusiness outcomes.
arket Centrelink's capabilities.xplore possibilities for new business.uild partnerships and alliances for effective
programme development and servicedelivery.
uild effective and balanced communicationmechanisms with clients.
uild and maintain optimum competitiveadvantage.
Focus in 2001 - 02:
ffectively delivering client outputs.oviding value for money for stakeholders.oviding input for policy development.uild and maintain a strong competitive
advantage.creasing and diversifying business.
artnering across sectors to deliver a greaterrange of government services.
eveloping more sophisticated client partnershipsand alliances with an outcome focus.
Centrelink is already an integral part of the delivery of Federal Government services to theAustralian community. As new initiatives are introduced, Centrelink will maintain and improveits core service responsibilities and integrate new policy initiatives into the changing serviceoffer from Government. At a whole-of-government level, this connectedness is essential for acoherent and seamless presentation, and will be complemented by supporting individual clientagencies’ initiatives and programme outcomes.
Centrelink is a valuable source of information for client agencies to formulate policy anddelivery options. Effective feedback processes within Centrelink will enable meaningfulcommunity engagement and input into Government policy directions. As Centrelink’s businessgrows in complexity, both in terms of the number of programmes it delivers and in the deliverychannels it makes available, so the need for strong integrated and aligned business managementsystems will grow.
Goal: Customer and Community
To increase customer and community involvement and satisfaction with services.
Details: Focus in 2001 - 02:

17
aintain customer and community focus.onnect the citizens of Australia to
community and government services.mplify and personalise service.ffectively integrate and target service
delivery channels.nsure equity of access to services for all
customers.omote Centrelink's image in the community.
rengthening and supporting the ‘life events’approach.
aking it easier to do business with us.ailoring service offers.
mplementing ‘Getting It Right’ strategy.ecoming a Premier Broker.tegrating service delivery channels.onnecting the public to federal, state and local
government, business and community basedorganisations.
elivering components of the Government’sAustralians Working Together agenda.
ecoming a key part of local communities.oviding consistent and equitable access to
services across all customer groups.tegrating strategic data for stronger business
outcomes.
Centrelink was established to be the face of government services to the Australian community.To achieve this, Centrelink must deliver the highest quality level of service. This requires acontinual focus on improving service delivery today while introducing innovative andcollaborative solutions to meet the growing expectations of Government and the Australiancommunity.
Centrelink will offer customers a new and wider range of choice for accessing serviceswherever they choose, with a wide range of contact hours. Electronically, this will be throughthe Internet and enhanced Call Centre services, and personally through mobile face-to-faceservices outside offices and at times that suit customers. There will be a greater degree of self-service allowing Centrelink people to focus on the more complex interactions and offer animproved level of assessment and support.
Centrelink will develop an enhanced service offer that will include customer planning andreferral across a range of both government and community support agencies to increase thevalue of outcomes for customers. These changes will support the introduction of theGovernment’s response to the Welfare Reform Report and other Budget initiatives.
The ‘Getting It Right’ strategy will involve an intense focus on assuring the correct andaccurate payment of entitlements matched by new, pragmatic client partnership agreements.
Goal: Centrelink People
To provide Centrelink people with confidence, knowledge, skills and tools to meetchallenges of current and future business and their own career aspirations.
Details:
mploy people who have the appropriateskills and experience needed to do theirjobs effectively.
ontinually provide Centrelink people and ouragents with skills and knowledge requiredto do their jobs.
Focus in 2001 - 02:
killing people for their jobs.creasing recognition for high performance.creasing commitment to high performance.aving valued and capable staff giving their best.oviding first class working conditions.rengthening leadership framework.

18
omote a culture in which people performhighly and accept responsibility for theiractions.
nsure Centrelink is an employer providingfirst class working conditions.
rengthen leadership and succession planningat all levels.
Centrelink will have an increasing focus on supporting employees to be able to deliver excellentservices to customers. This will involve Centrelink people working from varying facilities – inoffices, in call centres, and in situations suiting customers. Centrelink people will use increasinglevels of electronic support tools, including decision support systems and connections to a rangeof community and government resources. This will require new skills to use such tools quicklyand flexibly to deliver services. It will also require continued building of personalisedindividual services to the full diversity of Centrelink customers and the Australian community.
Goal: Cost-Efficiency
To manage our business efficiently and return a dividend to Government.
Details:
nhance business management systems at alllevels across Centrelink.
dopt best practice in financial systemsfundamentals to provide better decisionsupport.
nhance business culture that reduces costwhile maintaining satisfactory servicelevels.
omote efficient, effective and ethical use ofresources including alternative sourcingarrangements and service deliverychannels.
Focus in 2001 - 02:
ffective business pricing and funding allocationmodel.
creasing Call Centre automation.mplementing robust cost management
methodologies.ffectively using service delivery channels.
Centrelink will continue to improve its operations, reducing the cost of service delivery andindirect and support costs, improving productivity and the quality of services, and increasingthe responsiveness with which it meets new Government and client agency demands.
In this context, Centrelink will continue to streamline and re-engineer its business processes toexploit the value and application of information technology. The emphasis will be on deliveringlower prices to client agencies while at the same time delivering higher quality services tocustomers.
Centrelink has already reduced the cost of service delivery by approximately $211 million from1999 - 2000. This is expected to rise to $285 million by 2004 - 05, returned as efficiencydividends to Government. This will result in cumulative savings to the Budget of $1.637 billionover the period 1997 - 98 to 2004 - 05. Table 2.3 provides a summary of all efficiencydividends returned to Government since Centrelink’s inception and expected returns for thenext three years.

19
Table 2.3: Summary of Centrelink’s Efficiency Dividends ($ million)
1997 -
2000(1) 2000-01 2001 - 02 2002 - 03 2003 - 04 2004 - 05
Standard ED -93 -61 -76 -91 -106 -121
Special ED -236.7 -139.4 -139.4 -139.4 -139.4 -139.4
IT Dividend -31.3 -24.8 -24.8 -24.8 -24.8 -24.8
Annual Total -225.2 -240.2 -255.2 -270.2 -285.2
Cumulative Total -361 -586.2 -826.4 -1081.6 -1351.8 -1637
1 These figures are a cumulative total for three financial years from 1997 - 98 to 1999 - 2000.
This reflects a range of factors, including the continuation of productivity improvements beingachieved through measures such as:
� changes from business process re-engineering work being undertaken by reviews ofexisting procedures;
� efficiency gains delivered through the funding and implementation of a range of capabilityprojects;
� the reduction and elimination of unnecessary re-work through the “Getting It Right”Strategy.
Working with the National Office for the Information Economy, Centrelink will be a focus forthe Government’s online strategy by providing a primary gateway for Australians who wish toaccess Government services. As the face of Government, Centrelink’s physical and electronicnetwork will help Government agencies and community organisations to extend and integratetheir reach into rural, remote and outer metropolitan areas.
Goal: Innovation
To provide innovative and personalised solutions consistent with government policy.
Details:
xploit new and emerging technologies andmethods to support our goals.
xplore and develop new markets, productsand services.
apitalise on Centrelink’s intellectualproperty.
ctively support and promote innovation andcreativity in Centrelink people.
xplore innovative business partnerships andstrategic alliances with the federal, stateand local government, business andcommunity based organisations.
Focus in 2001-02:
aximising technological innovation topersonalise service and support staff decisionmaking.
eading in developing a Citizen to GovernmentPortal.
uilding on innovation (further developing ideasbank etc.).
xploring gatekeeper role in joint service deliveryas in Family Assistance Office.
xploring new markets and productsapitalising on Centrelink’s intellectual property.

20
Centrelink will form partnerships and consider outsourcing arrangements with private andpublic sector organisations to develop new innovative and cost effective service delivery offersand ways to access Government services.
GOAL: BEST PRACTICE
To be first choice and benchmarked as the best practice in service delivery.
etails:stablish a systematic approach to benchmark
Centrelink business and services.hare and implement best practice throughout
Centrelink.aximise learning through links with other
organisations.nsure effective internal and external
governance and accountabilityarrangements.
ocus in 2001-02:xploring internal and external benchmarking.creasingly benchmarked as best practice.
haring best practice.
Centrelink will continue to focus on identifying best practice, using internal benchmarkingtogether with benchmarking of relevant national and international organisations, to setappropriate standards.
Centrelink is an organisation committed to quality. The “Quality First” Policy is a structuredway of thinking about providing quality customer service. It is based upon a plan, whichprovides a systematic and participative approach to the way day-to-day work is performed.

21
PERFORMANCE INFORMATION FOR OUTCOME 1
Table 2.4 below lists the performance information that Centrelink will use to assess theachievement of its Outcome during 2001 - 02. Achievement against planned performance willbe reported in the Centrelink Annual Report.
Table 2.4: Centrelink Performance Information for Outcome 1
CENTRELINK BALANCED SCORECARD
Contribution of Strategic Goals to Output 1 – Efficient delivery of Commonwealth Servicesto eligible customers
GOAL OUTCOME
Client
Partnerships
Client Agency satisfaction
Client Agency satisfaction with Centrelink’s delivery of their services asmeasured by the value for money question on the client agency survey.
Business Partnership Agreements
Number of Measurable Key Performance Indicators met within thestandards set out in the Business Partnership Agreements.
Customer and
Community
Customer satisfaction with overall service
Percentages of customers rating their satisfaction with the overall quality ofCentrelink’s people, services and information as ‘good’ or ‘very good’.
Customer satisfaction with service delivery channels
Percentage of customers rating their satisfaction with the service providedby Centrelink (including the quality of people, services and information) as‘good’ or ‘very good’.
Centrelink
People
An environment which develops our people’s skills and commitment to
service
An improvement in the Centrelink People performance measures result ascompared to previous year’s result.
Cost Efficiency Return required efficiency dividend to Government
Centrelink’s operational expenses are managed within revenue from clientagencies, Government and other sources.
Cost per service
Reduction in cost per service per customer.
Innovation Business Improvement
Return on investment from Change Projects.
The Balanced Scorecard measures performance against Centrelink’s first five strategic goals.The sixth goal, Best Practice, is not measured individually as it is the sum of the achievementagainst the other five goals and is validated through external benchmarking.

22
EVALUATIONS FOR OUTCOME 1
Proposed evaluations within Centrelink form part of an annual evaluation strategy, which isapproved by the Centrelink Board. The strategy is developed on the basis of a risk assessmentbased upon consultation with key stakeholders, including client agencies.
COMPETITIVE TENDERING AND CONTRACTING
Centrelink will continue its ongoing programme of market testing corporate support function.
The Centrelink Board of Management has directed, following its assessment of the HumphryReview, that a strategic sourcing assessment be undertaken of all Information and Technologyservices. Appropriate services for market testing will be identified through this assessmentprocess. Selected corporate services functions will also be market tested in accordance with theGovernment's decision.

23
SECTION 3: BUDGETED FINANCIAL STATEMENTS
Budgeted Departmental Statement of Financial Performance
This statement provides a picture of the expected financial results for the Department byidentifying full accrual expenses revenues and capital use charge, which highlights whether theDepartment is operating at a sustainable level.
Budgeted Departmental Statement of Financial Position
This statement shows the financial position of the Department. It helps decision-makers totrack the management of the Department's assets and liabilities.
Budgeted Departmental Statement of Cash Flows
Budgeted cash flows, as reflected in the statement of cash flows, provides importantinformation on the extent and nature of cash flows by categorising them into expected cashflows from operating activities, investing activities and financing activities.
Departmental Capital Budget Statement
Shows all planned departmental capital expenditure (capital expenditure on non financialassets), whether funded either through capital appropriations for additional equity orborrowings, or from funds from internal sources.
Departmental Non-financial Assets – Summary of Movement
Shows budgeted acquisitions and disposals of non-financial assets during the budget year.

24
Table 3.1: Centrelink Budgeted Statement of Financial PerformanceFinal Budget Forward Forward Forward
estimate estimate estimate estimate estimate
2000-01 2001-02 2002-03 2003-04 2004-05
$'000 $'000 $'000 $'000 $'000
Revenues
Revenue from government 250 250 250 250 250
Sales of goods and services 1,749,681 1,789,697 1,887,845 1,858,194 1,832,346
Interest and dividends 7,500 4,835 4,835 4,835 4,835
Other 4,805 4,865 4,926 4,988 5,050
Total Revenue 1,762,236 1,799,647 1,897,856 1,868,267 1,842,481
Expenses
Employees 1,017,197 1,072,041 1,105,410 1,096,898 1,087,230
Suppliers 628,419 645,904 707,610 682,935 660,124
Depreciation and amortisation 74,553 75,617 81,189 86,116 94,244
Write down of assets 5,810 4,667 2,778 1,667 556
Other 1,423 1,031 639 246 0
Total Expenses 1,727,402 1,799,260 1,897,626 1,867,862 1,842,154
Operating Result 34,834 387 230 405 327
Operating Result and
Extraordinary Items after
Income Tax34,834 387 230 405 327
Operating Results after
Transfers 34,834 387 230 405 327

25
Table 3.2: Centrelink Budgeted Statement of Financial Position
Final Budget Forward Forward Forward
estimate estimate estimate estimate estimate
2000-01 2001-02 2002-03 2003-04 2004-05
$'000 $'000 $'000 $'000 $'000
ASSETS
Financial assets
Cash 99,009 67,946 78,002 97,796 59,448
Receivables 17,946 19,449 20,754 20,390 19,991
Investments
Accrued revenues
Other
Total financial assets 116,955 87,395 98,756 118,186 79,439
Non-financial assets
Land and buildings 87,710 84,883 81,966 79,979 78,141
63,819 88,978 91,413 78,712 82,253
Intangibles 161,502 171,874 173,334 177,559 176,922
Other 37,202 37,327 37,454 37,582 37,712
Total non-financial assets 350,233 383,062 384,167 373,832 375,028
Total assets 467,188 470,457 482,923 492,018 454,467
LIABILITIES
Debt
Loans 18,699 12,466 6,233 0 0
Leases
Deposits
Overdrafts
Other 2,238 2,238 2,238 2,237 2,237
Total debt 20,937 14,704 8,471 2,237 2,237
Provisions and payables
Employees 281,565 289,037 293,873 302,835 266,787
Suppliers 49,889 51,283 56,215 54,236 52,406
Grants
Other 28,524 4,523 4,523 4,523 4,523
Total provisions and payables 359,978 344,843 354,611 361,594 323,716
Total liabilities 380,915 359,547 363,082 363,831 325,953
EQUITY
Capital 47,159 71,409 80,110 88,051 88,051
Reserves 2,467 2,467 2,467 2,467 2,467
Accumulated surpluses or deficits 36,647 37,034 37,264 37,669 37,996
Total equity 86,273 110,910 119,841 128,187 128,514
Liabilities and equity 467,188 470,457 482,923 492,018 454,467
Infrastructure, plant and
equipment

26
Table 3.3: Centrelink Budgeted Statement of Cash Flows
Final Budget Forward Forward Forward
estimate estimate estimate estimate estimate
2000-01 2001-02 2002-03 2003-04 2004-05
$'000 $'000 $'000 $'000 $'000
OPERATING ACTIVITIES
Cash received
Appropriation Receipts 250 250 250 250 250
Sales of goods and services 1,759,101 1,765,377 1,887,060 1,858,431 1,832,553
Interest 7,500 4,835 4,835 4,835 4,835
GST receipts
Other 48,634 65,214 71,272 69,865 67,606
Total cash received 1,815,485 1,835,676 1,963,417 1,933,381 1,905,244
Cash used
Employees 1,020,298 1,064,570 1,100,576 1,087,935 1,123,279
Suppliers 676,267 703,746 767,666 748,061 722,736
Interest 1,424 1,031 639 246 0
Other 2,489 2,421 2,003 1,733 1,711
Total cash used 1,700,478 1,771,768 1,870,884 1,837,975 1,847,726
Net cash from operating
activities 115,007 63,908 92,533 95,406 57,518
INVESTING ACTIVITIES
Cash received - Non Financial
Financial 0 0 0 0 0
Cash used - Non Financial
Purchase of property, plant and
equipment85,614 112,988 84,945 77,320 95,866
Purchase of replacement of
intangibles
Other
Total cash used - Non Financial 85,614 112,988 84,945 77,320 95,866
Net cash from Investing
Activities -85,614 -112,988 -84,945 -77,320 -95,866
FINANCIAL ACTIVITIES
Cash received
Proceeds from issuing equity
instruments20,948 24,250 8,701 7,941 0
Total cash received 20,948 24,250 8,701 7,941 0
Cash used
Repayment of debt 6,233 6,233 6,233 6,233 0
Total cash used 6,233 6,233 6,233 6,233 0
Net cash from financing
activities 14,715 18,017 2,468 1,708 0
Net increase in cash held 44,108 -31,063 10,056 19,794 -38,348
Cash at the beginning of the
period 54,901 99,009 67,946 78,002 97,796
Cash at the end of the period 99,009 67,946 78,002 97,796 59,448

27
Table 3.4: Centrelink Capital Budget Statement
Final Budget Forward Forward Forward
estimate estimate estimate estimate estimate
2000-01 2001-02 2002-03 2003-04 2004-05
$'000 $'000 $'000 $'000 $'000
CAPITAL APPROPRIATIONS
Total equity injections 20,948 24,250 8,701 7,941 0Appropriation of previous years'
carryover
Total Capital Appropriations 20,948 24,250 8,701 7,941 0
Represented by:
Purchase of non-current assets 20,948 24,250 8,701 7,941 0
Other
PURCHASE OF NON-CURRENT
ASSETS
Funded by capital appropriations
Funded internally by Departmental
resources64,666 88,738 76,244 69,379 95,866
Total amount funded 64,666 88,738 76,244 69,379 95,866

28
Table 3.5: Centrelink Non-financial Assets — Summary of Movement (BudgetYear 2001 - 02)
Land Buildings Other Intangibles Total
Infrastructure
Plant and
Equipment
$m $m $m $m $m
GROSS VALUE
As at 1 July 2001 (opening) 2,414 133,045 157,543 220,079 513,081
Additions 0 20,000 61,971 31,016 112,987
Disposals 0 4,666 0 0 4,666
Other movements - 0 0 0
As at 30 June 2002 (closing) 2,414 148,379 219,514 251,095 621,402
ACCUMULATED DEPRECIATION
As at 1 July 2001 (opening) 0 47,749 93,724 58,577 200,050
Disposals
Charge for the reporting period 0 18,161 36,812 20,643 75,616
Other movements
As at 30 June 2002 (closing) 0 65,910 130,536 79,220 275,666
Net book value as at 30 June 2002
(closing book value) 2,414 82,469 88,978 171,875 345,736
Net book value as at 1 July 2001
(opening book value) 2,414 85,296 63,819 161,502 313,031
TOTAL ADDITIONS
Self funded 20,000 53,827 14,910 88,737
Appropriations - 8,144 16,106 24,250
Total - 61,971 31,016 112,987

29
NOTES TO THE FINANCIAL STATEMENTS
Departmental Statements
The projected financial statements reflect the entries in the Accrual Information ManagementSystem (AIMS) as at April 2001.
Budgeted Departmental Statement of Financial Performance
Centrelink has projected an operating surplus of $34.834 million for 2000 - 01, representing a2% underspend against revenue. This improvement on the estimate in the 2000 - 01 PortfolioAdditional Estimates operating surplus of $0.22 million is due to several contributing factors: awrite back of long service leave provisions based on an independent actuarial study, delays inthe implementation of a number of service delivery improvement projects, a reduction indepreciation expense resulting from deferred capital expenditure, better than expected interestearnings on cash holdings, and a general underspend in operating budgets.
An operating surplus of $0.387 million has been budgeted for 2001 - 02. This takes into account$52.520 million of revenue relating to AWT and other budget initiatives together with acorresponding match in expenses. Efficiency dividends totalling $240.2 million are expected tobe returned to government in 2001 - 02. This will bring the cumulative total, since 1997 - 98, toan expected $826.4 million.
Operating surpluses have been budgeted for each of the forward years.
Budgeted Departmental Statement of Financial Position
A positive equity result has been forecast for 2000 - 01 due to the estimated operating surplus aswell as capital injections totalling $20.948 million for that year. Positive equity positions havebeen budgeted for the period 2001 - 05 as a result of capital injections and/or budgeted positiveoperating results in each of those years.
Capital expenditure in 2001 - 02 includes expenditure on deferred capital purchases from 2000 - 01.
Budgeted Departmental Statement of Cash Flows
A positive cash position is forecast for 2000 - 01 and each of the forward years. The estimatedpositive cash position for 2000 - 01 is mainly due to the estimated 2000 - 01 surplus of $35.834million, lower than expected levels of capital expenditure, unearned revenue from uncompletedbudget initiatives and cash held for repayment of customer number movements in 2001 - 2002.
No additional cash borrowings have been budgeted. The 1998 - 99 loan of $31.165 million isexpected to be fully repaid by the end of 2003 - 04.
30
Cross Agency Overview
Centrelink provides services to FaCS, which are outlined in Part C, Section 5 of this PBS.
Other cross agency arrangements that exist between Centrelink are outlined in Part D, Section 1of this PBS.
Responsibility
The responsibilities of Centrelink regarding the Department of Family and Community Servicesare set out in Part C of this Portfolio Budget Statement. Responsibilities regarding otherpurchasing departments are set out in their respective Portfolio Budget Statements.
Control Arrangements
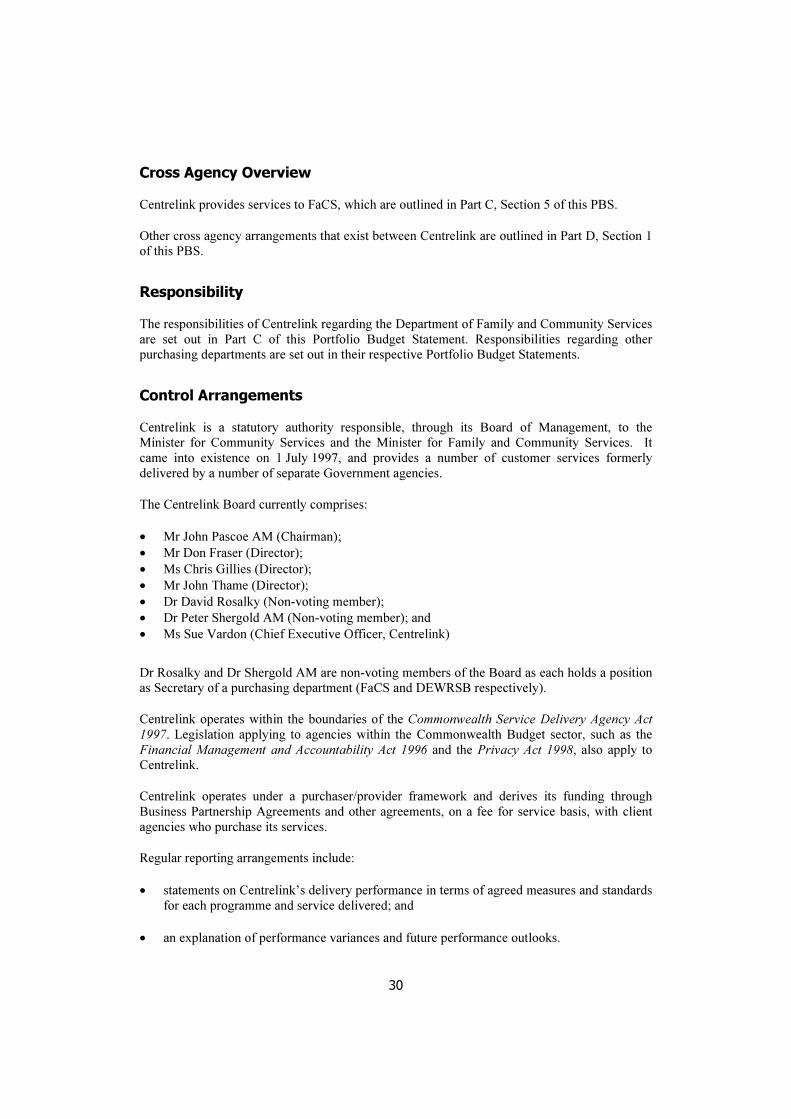
Centrelink is a statutory authority responsible, through its Board of Management, to theMinister for Community Services and the Minister for Family and Community Services. Itcame into existence on 1 July 1997, and provides a number of customer services formerlydelivered by a number of separate Government agencies.
The Centrelink Board currently comprises:
� Mr John Pascoe AM (Chairman);
� Mr Don Fraser (Director);
� Ms Chris Gillies (Director);
� Mr John Thame (Director);
� Dr David Rosalky (Non-voting member);
� Dr Peter Shergold AM (Non-voting member); and
� Ms Sue Vardon (Chief Executive Officer, Centrelink)
Dr Rosalky and Dr Shergold AM are non-voting members of the Board as each holds a positionas Secretary of a purchasing department (FaCS and DEWRSB respectively).
Centrelink operates within the boundaries of the Commonwealth Service Delivery Agency Act
1997. Legislation applying to agencies within the Commonwealth Budget sector, such as theFinancial Management and Accountability Act 1996 and the Privacy Act 1998, also apply toCentrelink.
Centrelink operates under a purchaser/provider framework and derives its funding throughBusiness Partnership Agreements and other agreements, on a fee for service basis, with clientagencies who purchase its services.
Regular reporting arrangements include:
� statements on Centrelink’s delivery performance in terms of agreed measures and standardsfor each programme and service delivered; and
� an explanation of performance variances and future performance outlooks.

31
In addition, Centrelink provides reports on specific programmes and activities, whereappropriate.
Resourcing
Refer to Part D, Table 2.2 for summary of revenue from client departments.
Performance against Outcomes and Outputs
Centrelink’s performance is measured by a ‘Balanced Scorecard’ outlined in Part D, Table 2.4.