Embed Size (px)
Citation preview

CEO Compensation, Regulation, and Risk inBanks: Theory and Evidence from the
Financial Crisis∗
Vittoria Cerasia and Tommaso Olivierob
aBicocca UniversitybCSEF
This paper studies the relation between CEOs’ monetaryincentives, financial regulation, and risk in banks. We developa model where banks lend to opaque entrepreneurial projectsthat need to be monitored by bank managers. Bank man-agers are remunerated according to a pay-for-performancescheme and their effort is not observable to depositors andbank shareholders. Within a prudential regulatory frameworkthat imposes a minimum capital ratio and a deposit insurancescheme, we study the effect of increasing the variable compo-nent of managerial compensation on bank risk in equilibrium.We test the model’s predictions on a sample of large banksaround the world, gauging how the monetary incentives forCEOs in 2006 affected their banks’ stock price and volatility
∗We thank Franklin Allen, Elena Carletti, Andrew Ellul, Daniel Paravisini,Nicola Pavoni, Laura Rondi, Shastri Sandy, Annalisa Scognamiglio, and in par-ticular Loretta Mester (co-editor) for insightful comments. We also appreciatedcomments from participants at the Workshop on Institutions, Individual Behaviorand Economic Outcomes in Alghero (June 2014), at the 6th International Confer-ence IFABS in Lisbon (June 2014), at the NFA meetings in Ottawa, at the IJCBannual conference in Philadelphia (September 2014), and at the SIE in Trento(October 2014). We are grateful to the Wharton Business School, University ofPennsylvania, since it was during a post-doc visiting period that it was possibleto collect the data for this project. We acknowledge excellent research assistancefrom Tiziana Maida. We received financial support from Einaudi Institute forEconomics and Finance (EIEF Research Grant, 2013). A previous version of thispaper has circulated with the title “Managerial Compensation, Regulation andRisk in Banks.” All errors remain our own. Corresponding author (Cerasi): Bic-occa University, Department of Economics, Management and Statistics (DEMS),Piazza del’Ateneo Nuovo 1, 20126 Milano, Italy. Tel.: +39-02.6448.5821. Fax:+39-02.6448.5878. E-mail: [email protected].
241
242 International Journal of Central Banking June 2015
during the 2007–8 financial crisis. Our international sampleallows us to study the interaction between monetary incen-tives and financial regulation. We find that greater sensitiv-ity of CEOs’ equity portfolios to stock prices and volatilityis associated with poorer performance and greater risk at thebanks where shareholder control is weaker and in countrieswith explicit deposit insurance.
JEL Codes: G21, G38.
1. Introduction
The recent global recession has demonstrated that capital mar-ket failures may be responsible for economic downturns. In thewake of the financial crisis, a consensus appears to have emergedamong researchers and practitioners that financial institutions tooktoo much risk in the run-up to the crisis, notwithstanding risk-management arrangements and solvency regulations (Diamond andRajan 2009). The monetary incentives given to executives havebeen cited as one of the culprits in the failure of banking gover-nance.1 Executive compensation tied to firm performance in its var-ious forms—such as bonuses related to firm value, stock options,and equity plans—has become a standard instrument of managerialremuneration in all sectors, and especially in banking.2 Given thegrowing importance of CEOs’ variable compensation, we need tounderstand its impact on risk in banks.
We focus on the agency conflicts inside and outside the bank—shareholders vs. bank managers and insiders vs. depositors—tostudy the determinants of bank risk and its interaction with finan-cial regulation. We develop a model in which bank managers havea variable compensation scheme, and use the resulting insights forempirical exploration of the relationship between CEOs’ monetaryincentives and bank performance.
1See Becht, Bolton, and Roell (2011) and Mehran, Morrison, and Shapiro(2011) for excellent reviews of the literature on the conflicts among the vari-ous stakeholders in banks and, in particular, on how executive remuneration canaffect risk taking.
2Giannetti and Metzger (2013) find that the increase in equity-based compen-sation and the consequent increase in total compensation is bound up with height-ened competition for talent, which creates a retention motive and exacerbatesagency problems.
Vol. 11 No. 3 CEO Compensation, Regulation, and Risk 243
Our theoretical contribution serves to provide guidance in exam-ining the empirical evidence. In our model, banks lend to opaqueentrepreneurial projects that need to be monitored by a bank man-ager.3 The bank manager might reduce loan losses by monitoring theloan portfolio, but this effort is not observable to outsiders. To inducemonitoring, shareholders reward the manager with a bonus tied tothe bank’s performance.4 Depositors are insured and minimum cap-ital requirements are in place. Shareholders may directly inspect thebank manager and in some cases may decide to replace him witha new manager. In this setting, the risk choice is endogenous; it isthe equilibrium outcome of the strategic interaction between bankmanagers and shareholders. Comparative statics exercises illuminatethe way in which equilibrium risk at a bank reacts to changes in theCEO’s variable compensation, and how its sign and measure areaffected by regulation and by the efficacy of control by shareholders.
In particular, we suggest a possible perverse effect of larger man-agerial bonuses on bank risk. On the one hand, the larger the bonus,the greater the monitoring effort of the bank manager, so that bankrisk is reduced; on the other hand, a larger bonus discourages share-holders’ control by lowering their stake in the overall return of theloan portfolio, and so leads to greater risk. We also show that fora given capital structure and regulatory environment, the sign ofthe relation between bonus and risk is decreasing in the efficacyof shareholders’ control. In other words, the perverse effect of thebonus is greater where shareholder control is weaker. Finally, withinthis framework, we find that a deposit insurance scheme, by incor-porating the expectations of an increase in risk from larger bonuses,may under certain conditions weaken shareholders’ control. In thiscase, the perverse correlation between executive bonus and risk isexacerbated.
3The model builds on Cerasi and Daltung (2007) in its version for banks,developed in Cerasi and Rochet (2014).
4The presence of a variable component in the compensation of executives mayrepresent a choice for shareholders. Here, however, we take this specific formof the managerial compensation as exogenously set, taking as a stylized fact theobservation that performance-based pay schemes are now standard for bank exec-utives. As a matter of fact, the empirical analysis closely follows this approach,measuring how changes in the variable compensation of bank executives affectbank performance.
244 International Journal of Central Banking June 2015
The empirical analysis is based on novel information on a panel oflarge banks in various countries for which executive compensation isobserved. We exploit the cross-sectional heterogeneity in managerialcompensation practices and financial regulation to study the impacton risk.5 We find support for the main predictions of the theoret-ical model by analyzing the relation between monetary incentivesprovided to CEOs in 2006 and banks’ return and risk during thefinancial crisis. We test whether the monetary incentives for execu-tives fixed before the financial crisis explain banks’ poor performanceand greater incurred risk during the financial crisis of 2007–8. Thereare two reasons for using the crisis for an experiment. First, thedesign of executive compensation schemes is pointed to, in publicdiscussion, as one of the main culprits in the increased risk takingthat public opinion blames for the crisis. This issue has been ana-lyzed in detail for the United States, notably by Fahlenbrach andStulz (2011), but except for Suntheim (2010), less work has beendone about other countries. Second, it is reasonable to assume thatwhen shareholders designed their CEOs’ contracts in the years pre-ceding the financial crisis, they did not anticipate the collapse ofthe financial system; the monetary incentives we find in 2006 werepresumably designed before that date. To summarize, the financialcrisis cannot be classified as an anticipated shock; on the contrary,it is likely that both financial market operators and bank managerswere unaware of the impending crisis. This thesis is supported bytwo facts: (i) average stock returns of banks were extremely highbefore the crisis;6 (ii) if they had anticipated the financial crisis,they should have sold their stock, but we find no statistically signif-icant change in the proportion of inside ownership of CEOs in oursample between the second quarter of 2005 or 2006 and the secondquarter of 2007.7
5We combine four sources of data: Capital IQ – People Intelligence by Stan-dard and Poor’s, Bankscope, Datastream, and the third wave of the World Bank’sBank Regulation and Supervision Survey; see section 4 for a detailed descriptionof the data-collection process.
6Furthermore, our regression analysis shows a negative correlation betweenstock returns in 2006 and performance during the crisis; this suggests that thebetter-performing banks in 2006 performed worse during the crisis.
7Insider holding is measured by the ratio of the number of restricted andunrestricted shares held by CEOs at the end of the second quarter of each year
Vol. 11 No. 3 CEO Compensation, Regulation, and Risk 245
In the empirical analysis, pay-for-performance sensitivity ofCEOs’ compensation is measured using information on cashbonuses and equity portfolios (the sum of the CEO’s shares andstock options). We distinguish between two measures of pay-for-performance sensitivity of equity portfolios: (i) the sensitivity ofCEOs’ stock-option portfolios to share prices (option delta) plus thedirect ownership of shares (ownership from shares and options); and(ii) the sensitivity of the stock-option portfolio to stock volatility(option vega). Finally, we measure bank performance as the buy-and-hold return and the standard deviation of stock returns overthe period 2007:Q3–2008:Q4.
For the entire sample, we find that greater pay-for-performancesensitivity at the end of 2006 does not appear to be related to eitherthe drop in stock returns or higher stock-price volatility during thefinancial crisis. This lack of evidence of a relation between variablecompensation and bank risk extends the empirical evidence on U.S.banks by Fahlenbrach and Stulz (2011) to banks outside the UnitedStates as well. This result is also consistent with the insights of ourmodel, namely that an increase in the managerial bonus has ambigu-ous effects on equilibrium risk; given that banks differ in governanceand in the regulatory framework, the negative and positive effects ofvariable compensation may be partially offsetting for the sample asa whole. However, starting from this negative result and followingthe insights of our model, we exploit bank heterogeneity and cross-country differences to split our sample along several lines, capturingfeatures of bank governance and regulation, to detect patterns in thecorrelation between the way executives are remunerated and bankrisk.
In particular, we find that CEOs’ equity incentives (ownershipfrom shares and options and option vega) were associated with worseperformance during the crisis by the banks where the shareholders’
to the total number of shares outstanding at the end of the year. The averageinsider holdings were 1.41 percent, 1.76 percent, and 1.38 percent at the end ofthe second quarter of 2005, 2006, and 2007, respectively. There is no statisticallysignificant change even excluding restricted shares. For the case of U.S. banks,similar evidence has been found by Fahlenbrach and Stulz (2011), while Cziraki(2014) found that only the executives of the banks most exposed to the housingmarket might possibly have foreseen the collapse starting in mid-2006.
246 International Journal of Central Banking June 2015
control of delegated managerial activities was relatively ineffectivecompared with the whole sample. By using different proxies for effi-cacy of control at both the bank and country level, we support thetheoretical prediction that weaker internal control combined withgreater pay-for-performance sensitivity in executive compensationmight explain increased risk taking.
Furthermore, we study the interaction between CEOs’ variablecompensation and measures of prudential regulation at the countrylevel, such as the presence of an explicit deposit insurance scheme8
and the difference between the actual capital at the bank level andthe minimum capital requirement defined by each country authorityin 2006.
The empirical evidence suggests that explicit deposit insurance,combined with our measures of variable compensation, may wellhave increased the risk appetite of insiders and resulted in worseperformance (either lower buy-and-hold returns or greater stock-return volatility) during the financial crisis. We do not find evidenceof interaction between CEOs’ variable compensation and capitalrequirements during the crisis.
The rest of the paper is organized as follows: the next sectionrelates this paper to the literature; section 3 presents our model;section 4 describes how we collected our data and provides somedescriptive statistics on the sample of banks and their CEOs’ com-pensation; section 5 analyzes the correlation between bank per-formance and CEO compensation in the whole sample; section 6studies the interaction between executive incentives and bank per-formance in different sub-samples, in order to capture differentaspects of financial regulation and bank governance; and section 7concludes.
8Following Demirguc-Kunt, Karacaovali, and Laeven (2005), explicit depositinsurance differs from implicit deposit insurance by the presence of a formal def-inition of the scheme in national banking laws; explicit deposit insurance variesamong countries in terms of the types of financial institution covered and theamount of coverage. In this paper we divide the countries into two groups, depend-ing on whether or not an explicit law applies to commercial banks; we furtherassume that the insurance is funded by a fair premium paid by the commercialbank. Although restrictive, this assumption appears to fit the application of thelaw in most countries.

Vol. 11 No. 3 CEO Compensation, Regulation, and Risk 247
2. Related Literature
In the wake of the recent financial crisis, there is a growing literatureon the relation between different aspects of corporate governance,executive compensation, and risk in banking and their interactionwith financial regulation. Let us define our paper relative to thevarious contributions of that literature.
Banking mainly involves liquidity provision and maturity trans-formation. Thanks to the existence of deposit insurance, deposits area cheap source of funding for banks, which explains why commercialbanks represent a special case of highly leveraged firms, as discussedin Dewatripont and Tirole (1999) and in the excellent reviews ofbank corporate governance by Becht, Bolton, and Roell (2011) andMehran, Morrison, and Shapiro (2011). The corporate finance liter-ature acknowledges the effect of leverage in altering the preferencesfor risk shifting and the conflict between shareholders and debthold-ers (Jensen and Meckling 1976). However, depositors, as they areinsured, are quite passive claimholders and do not oppose share-holders’ initiatives, as is shown extensively in Mehran, Morrison, andShapiro (2011). This explains why bank shareholders are successfulin aligning CEOs with their interests also in their taste for excessiverisk taking; see the good discussion in Bolton, Mehran, and Shapiro(2010). In our model the bank is leveraged, deposit insurance is inplace and the bank manager is remunerated according to a pay-for-performance scheme, and active shareholders may decide to inspectand possibly fire the top executive. In this context, increasing thevariable component of compensation might discourage shareholders’initiative and so heighten bank risk.
Seminal contributions by John and John (1993) and Berkovitz,Israel, and Spiegel (2000) focused on the relation between CEOs’variable compensation and bank leverage, while John, Saunders, andSenbet (2000) focused on CEOs’ compensation and regulation. Sev-eral more recent theoretical papers have studied how the design ofcompensation may affect risk taking in banks, with a view to sug-gesting how to redesign executive compensation so as to protect allthe stakeholders in banking; see, for instance, Benmelech, Kandel,and Veronesi (2010), Bolton, Mehran, and Shapiro (2010), John,Mehran, and Quian (2010), and Kolm, Laux, and Loranth (2014).Unlike these contributions, our own exercise is intended to determine
248 International Journal of Central Banking June 2015
how greater pay-for-performance sensitivity impacts risk taking indifferent corporate governance and regulatory settings. We do notseek to understand how close the actual remuneration is to the opti-mal remuneration but simply to gauge how a change in the level ofremuneration might affect risk taking.
Empirically, we contribute to the literature on the role of bankCEO compensation in shaping risk taking and how corporate gov-ernance and financial regulation interact with it.
We build upon Laeven and Levine (2009) and Gropp and Kohler(2010), who empirically analyze the interaction between corporategovernance and regulation and its effect on bank risk. In relationto the recent financial crisis, Beltratti and Stulz (2012) show thatshareholder-friendly boards have effectively aligned bank managerswith their interests at the expense of depositors. We complementthose studies by exploring a specific tool of corporate governance,namely executive compensation.
Our paper is also close in spirit to Fahlenbrach and Stulz (2011)and Guo, Jalal, and Khaksari (2014), who have empirically exploredthe relation between CEOs’ incentives and bank performance andrisk in the 2007–8 financial crisis for a cross-section of U.S. banks.They find that banks where CEOs’ monetary incentives were moreclosely aligned with shareholders’ interests did not perform better.While confirming this result as regards our entire sample, we alsofind a negative correlation between variable compensation and expost performance at banks with weaker governance and at banksin countries with explicit deposit insurance. In interpreting this evi-dence, we relate our findings to our model, where risk is endoge-nous and is shaped jointly by shareholders’ oversight and managerialmonetary incentives.
From a different perspective, Cheng, Hong, and Scheinkman(2010) assume that risk is an exogenous characteristic of the bank,together with productivity, and that risk-averse CEOs must be com-pensated with greater total remuneration when they are hired by ariskier bank. They find strong evidence of an effect of banks’ fun-damentals (risk and productivity) on total executive compensation,and weaker evidence of an effect on variable compensation. Theiranalysis challenges the interpretation of our empirical results, as therelation between ex post risk and ex ante CEO variable compensa-tion may be affected by a confounding factor such as ex ante risk

Vol. 11 No. 3 CEO Compensation, Regulation, and Risk 249
or productivity; we address this concern in the empirical settingby accounting for differences in fundamental productivity and riskacross banks.
Finally, Ellul and Yeramilli (2013) provide a first attempt to getinside the black box of the banks’ internal organization, studying theeffect of the risk-management function on risk in a sample of U.S.banks. Their analysis prompted us to examine the effect of exec-utive compensation schemes and the potential conflict with otherstakeholders.
3. The Model
Consider a bank holding a portfolio of size L0 of risky loans withperfectly correlated returns. Each loan returns R > 1, althoughloan losses � occur with probability p. Thus, the portfolio returns(R−�)L0 with probability p, and RL0 otherwise; the returns are fullyobservable by third parties. The bank collects funds from wealthydispersed investors whose alternative return on their capital is 1. Weassume that all agents are risk neutral.
At date 0, bank shareholders, who own capital E0, collectdeposits D0 and extend loans L0. Depositors are fully insured; hence,each unit of deposit bears zero risk premium.9 Given the presenceof the deposit insurance, the income of the loans portfolio is dividedas follows: when the portfolio is successful, it returns RL0, and whatis left, once depositors are repaid the promised amount D0, goes tobank shareholders; when loan losses are realized and the portfolioreturns (R − �)L0 < D0, all the income goes to the deposit insur-ance fund that repays depositors D0, which leaves bank sharehold-ers without any income. We will assume that the deposit insurancepremium is fully funded through taxpayers’ money and that bankshareholders do not internalize it.10 The amount of insured deposits
9A more realistic case is when the bank is funded by a mix of insured depositsand unsecured debt. In appendix 2 we discuss this case and show that when thegreat majority of debtholders are uninsured in equilibrium, the risk is identicalto that of a bank with a risk-sensitive deposit insurance premium charged to thebank.
10In the last sub-section we will discuss the case of a risk-sensitive depositinsurance with a fair premium charged on the balance sheet of the bank atdate 0.
250 International Journal of Central Banking June 2015
that the bank will be able to collect is given by the bank’s balancesheet at time 0, i.e.,
L0 = E0 + D0. (1)
We will assume in what follows that there is a capital ratio k imposedby the regulator requiring a minimum of capital for each unit ofloans, namely L0 ≤ E0/k.
Loans can be directly monitored by exerting an effort m ∈ [0, 1]at a private cost M
2 m2 with M ≥ 0 to reduce the probability oflosses from pH to pL. Assume that
R − pL� − M
2> 1 > R − pH�,
which implies that only monitored loans are worth financing. Whenloans are monitored, they have a positive net present value; hence,the size of the bank is limited by its minimum capital ratio.
We assume that shareholders delegate the task of monitoringloans to a bank manager. Because monitoring cannot be observedbut has a (private) cost, the bank manager might shirk this duty.To avoid this, shareholders can inspect the bank manager at ran-dom and also reward him with monetary incentives. We postponethe analysis of monetary incentives to the next sub-section and focusnow on the inspection technology. The shareholders can inspect theactivity of the bank manager with intensity s ∈ [0, 1] at a (private)cost C
2 s2 with C > 0. As a result of this inspection, shareholdersmight decide to fire the manager and replace him with an externalone (we explore this aspect later on).
The two efforts, the “internal” supervision by shareholders andthe activity of monitoring the portfolio of loans, cannot be observedby outsiders of the bank but are privately costly for the party incharge of it, causing a double moral hazard problem. However, thecombined impact of monitoring the loans and the internal super-vision affects the probability of losses p. The specific value of thisprobability must be derived from the equilibrium choices of effortof the bank manager and shareholders, as will subsequently becomeclear.
We may summarize the timing of events on three dates t =(0, 1, 2) as follows:
Vol. 11 No. 3 CEO Compensation, Regulation, and Risk 251
• At t = 0, bank shareholders with capital E0 collect insureddeposits D0 and lend L0 (limited by a capital ratio L0 ≤E0/k); they hire a manager to monitor loans.
• At t = 1, the bank manager might exert a monitoring effortwith intensity m to reduce expected loan losses; the bankshareholders inspect the manager with probability s; and insome cases, they decide to replace the incumbent managerwith an external one.
• At t = 2, the loans return a revenue, and the income is sharedamong the parties.
At the beginning of date 0, the managerial compensation is dis-closed to all third parties. Effort choices are not observable, whilereturns from projects are observable to outsiders. This timing ofevents implies that outsiders can observe the managerial compensa-tion but cannot infer the true effort choices of insiders. The model issolved backwards: equilibrium efforts and returns are computed fora given managerial compensation.
3.1 Bank Managerial Compensation
The bank manager, whose choice of effort responds to monetaryincentives, is offered a monetary compensation, the sum of a fixedsalary and a cash bonus on each loan. The fixed salary is set equal tozero for the sake of simplicity. In addition, the bank manager is paida cash bonus b ∈ [0, R) whenever the loan portfolio succeeds withoutlosses and whenever shareholders—as a result of inspection—decidenot to fire him.11 The bonus represents the variable part of themanagerial compensation and, given that it is tied to the good per-formance of the portfolio of loans, can be interpreted as a “pay-for-performance” scheme. Only conditional on the result of their inspec-tion, shareholders might decide to fire the incumbent bank manager.Whenever the incumbent bank manager is fired, a new manager ishired and, as a result, the probability of loan losses switches fromp to an average value φ ∈ (pL, pH). Because the new bank manager
11The decision to fire the bank manager is at the complete discretion of share-holders. This is in line with the empirical fact that managerial contracts areriskier than workers’ labor contracts. In particular, in the managerial contract,there is no need for a “good cause” to fire the employee.
252 International Journal of Central Banking June 2015
is offered the same managerial compensation, shareholders benefitfrom firing the incumbent bank manager only when—as a result ofinspection—they observe an effort level below that of an averageexternal manager.12 Therefore, to reduce loan losses, it is strictlypreferable to retain the incumbent manager. In conclusion, share-holders will not fire the incumbent manager unless they observe aneffort level below that of an average external manager.
The insiders of the bank, shareholders and the bank manager,choose their efforts non-cooperatively and simultaneously. The equi-librium concept applied here is Nash equilibrium in monitoring andinspection choices. To derive the equilibrium bank risk, we have tosolve for the efforts as a fixed point of the best reply functions.
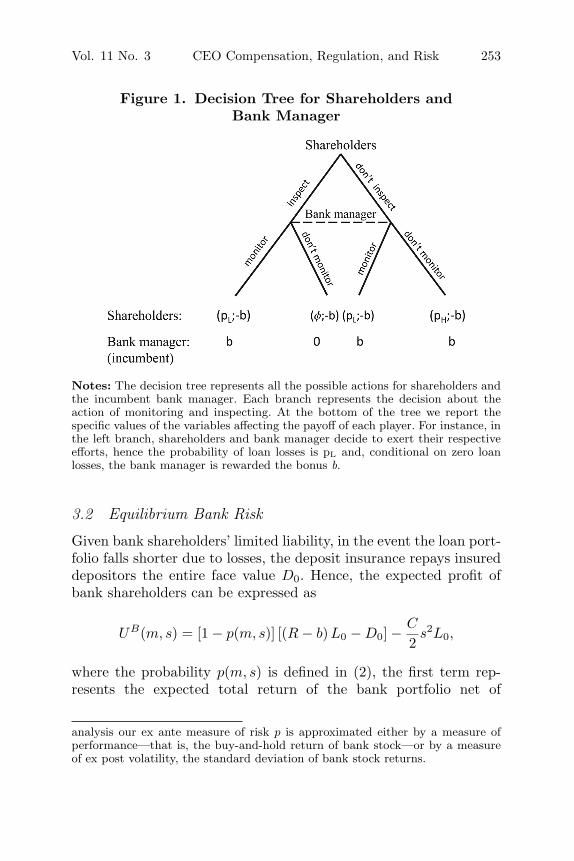
Figure 1 describes the actions of the insiders together with thevariables affecting their gross revenues for each different choice. Fromfigure 1 we can derive the probability of loan losses, taking intoaccount all the possible actions:
p(m, s) = mpL + (1 − m) [sφ + (1 − s)pH ]
= pL + (1 − m) [Δ − sΔφ] , (2)
where Δ ≡ pH −pL and Δφ ≡ pH −φ. The probability of losses is pL
when the bank manager exerts effort regardless of the shareholdereffort. Notice that inspection by shareholders is effective in reducingloan losses only if the external bank manager is more capable thanthe slacking incumbent manager, i.e., φ > pL.
The probability of loan losses p captures either a measure ofloans’ performance or a measure of the variance of the loan portfolioreturns.13
12This assumption guarantees that shareholders do not always fire the incum-bent bank manager, disregarding the outcome of the inspection, given that themanagerial effort is not observable from outsiders. After firing the incumbentmanager and hiring an external one, they reward the new manager with exactlythe same compensation scheme: thus, firing the old manager does not allow savingon the bonus payment.
13In the model when the bank manager or the shareholders exert a greater effortin monitoring the loan portfolio risk, p decreases. This corresponds to either anincrease in the mean value of the portfolio, R(1 − p), or a reduction of the vari-ance, Rp(1 − p), when p is smaller than 0.5, which seems a sensible restriction toadopt when loan losses are rare. However, our ex ante measure of risk p cannotbe observed and we must capture it with observable measures. In the empirical
Vol. 11 No. 3 CEO Compensation, Regulation, and Risk 253
Figure 1. Decision Tree for Shareholders andBank Manager
Notes: The decision tree represents all the possible actions for shareholders andthe incumbent bank manager. Each branch represents the decision about theaction of monitoring and inspecting. At the bottom of the tree we report thespecific values of the variables affecting the payoff of each player. For instance, inthe left branch, shareholders and bank manager decide to exert their respectiveefforts, hence the probability of loan losses is pL and, conditional on zero loanlosses, the bank manager is rewarded the bonus b.
3.2 Equilibrium Bank Risk
Given bank shareholders’ limited liability, in the event the loan port-folio falls shorter due to losses, the deposit insurance repays insureddepositors the entire face value D0. Hence, the expected profit ofbank shareholders can be expressed as
UB(m, s) = [1 − p(m, s)] [(R − b) L0 − D0] − C
2s2L0,
where the probability p(m, s) is defined in (2), the first term rep-resents the expected total return of the bank portfolio net of
analysis our ex ante measure of risk p is approximated either by a measure ofperformance—that is, the buy-and-hold return of bank stock—or by a measureof ex post volatility, the standard deviation of bank stock returns.
254 International Journal of Central Banking June 2015
managerial bonus and repayment to depositors, and the second termis the shareholders’ inspection cost.
The best reply function of shareholders in terms of inspectionintensity s is the solution to
∂UB
∂s= (1 − m)Δφ
[(R − b) − D0
L0
]− Cs = 0 (3)
for each level of bank manager’s monitoring m, where the amountof deposits D0, the size of the loan portfolio L0, and the managerialbonus b are all taken as given.
Equation (3) indicates that, for a given bonus and amount ofdeposits, the benefit of inspecting depends negatively upon the man-agerial effort: a greater managerial effort improves the probability ofsuccess of the project without costs for shareholders, while inspec-tion entails a positive private cost. The shareholders prefer the bankmanager to be the one to exert the effort to save their private costof inspection. Hence, because of this free-riding problem, there issubstitutability between the two efforts.
For given managerial compensation, the expected utility of theincumbent bank manager is
UM (m, s) = [1 − q(m, s)] bL0 − M
2m2L0,
where 1 − q(m, s) ≡ 1 − p(m, s) − s(1 − m)(1 − φ) is the probabilitythat the bank manager will cash the bonus. The bank manager earnsthe bonus with probability [1 − p(s, m)] unless he is fired with prob-ability s(1−m). Notice that the probability of observing loan lossesis smaller than the probability of losing the bonus for the incumbentmanager, that is, p(m, s) − q(m, s) = −s(1 − m)(1 − φ) < 0. Theportfolio of loans could be successful, and in this case, the incum-bent bank manager does not pocket the bonus (because he is fired),and the bonus is paid to the new manager who has exerted themonitoring.
The best reply function of the bank manager in terms of moni-toring m is the solution to
∂UM
∂m= [Δ + s(1 − pH)] b − Mm = 0 (4)
Vol. 11 No. 3 CEO Compensation, Regulation, and Risk 255
for each intensity of inspection by shareholders s, where the manage-rial bonus b is given. Equation (4) indicates that, for a given bonus,the monitoring effort of the bank manager increases with the inspec-tion of shareholders: a larger probability of inspection increases thethreat of being fired and thus induces a greater managerial effort.
Shareholders and bank manager choose simultaneously and non-cooperatively their efforts at date 1. We characterize the mixed-strategy Nash equilibrium of the game in the following proposition:
Proposition 1. When the lending size is limited by the capital ratiok such that L0 ≤ E0/k and there is a deposit insurance funded withpublic money, the monitoring intensity m of the bank manager, theinspection of shareholders s, and the probability of loan losses p arethe solution to the following system of equations:
(1 − m)A − Cs = 0 (5)
[Δ + s(1 − pH)] b − mM = 0 (6)
p − pL − (1 − m)(Δ − sΔφ) = 0, (7)
with A ≡ Δφ [R − b − (1 − k)] .
Proof. See appendix 1.
We might capture bank risk with the ex ante probability of loanlosses p; therefore, we can perform some meaningful comparative sta-tic exercises around the equilibrium values (p, s, m). For instance, wecan study the impact of a larger capital ratio k, as well as measuresof ex post profitability such as R and cost of shareholders’ control C,on equilibrium bank risk. In particular, it is possible to demonstratethe following result:
Proposition 2. The probability of loan losses p decreases with alarger capital ratio k and with a smaller inspection cost by share-holders C.
Proof. See appendix 1.
The model predicts that a larger capital ratio reduces the exante risk of the bank. The intuition is the following: a larger capital
256 International Journal of Central Banking June 2015
ratio, a larger k, reduces the need for external funds from depos-itors for a given size of the bank L0. This increases the marginalrevenue of shareholders and improves their incentives to inspect thebank manager. This has a positive effect on managerial monitoringand on the overall expected return of the portfolio of loans. Withthe same logic, a smaller inspection cost by shareholders, a lower C,causes the opposite effect by decreasing the marginal cost of inter-nal supervision. In the empirical analysis, we measure both effects,exploiting the cross-country variation of our sample. On the onehand, we measure the effect of different capital ratios, and on theother hand, we compare regulatory systems with different intensitiesof external supervision that affect the cost of internal control.
Finally, within our model we can study the effect of a largermanagerial bonus on the risk of the bank.
Proposition 3. A larger managerial bonus b has a negative effect onthe intensity of inspection s of shareholders, while it might improvethe monitoring effort m of the bank manager. Overall, a larger bonushas an uncertain effect on the probability of loan losses p.
Proof. See appendix 1.
The ambiguity of the impact of the managerial bonus on bankrisk derives from the complex interaction of monetary incentives setto reward the bank manager with shareholders’ incentives. As a mat-ter of fact, the efforts of the two insiders, shareholders and the bankmanager, are substitutes. Shareholders’ incentives might deteriorateas a consequence of paying a larger bonus. The stake retained byshareholders when paying a larger bonus is smaller (effect throughb) and their inspection is less effective if the manager behaves (effectthrough (1 − m)); thus, ceteris paribus, in equation (3) the mar-ginal benefit of inspection is smaller. However, a larger bonus hasa positive impact on the monitoring effort of the bank manager.The overall effect on the equilibrium probability of loan losses pis the result of these two opposite forces: an increased manager-ial effort due to the larger monetary incentive of the bonus and areduced internal control by shareholders. This explains the uncer-tainty of the sign of the effect on risk when increasing the managerialbonus.
Vol. 11 No. 3 CEO Compensation, Regulation, and Risk 257
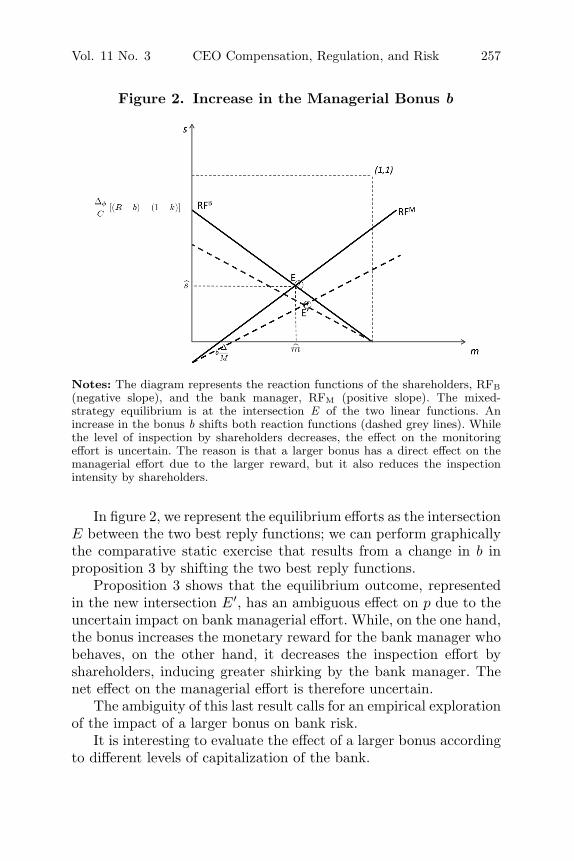
Figure 2. Increase in the Managerial Bonus b
Notes: The diagram represents the reaction functions of the shareholders, RFB(negative slope), and the bank manager, RFM (positive slope). The mixed-strategy equilibrium is at the intersection E of the two linear functions. Anincrease in the bonus b shifts both reaction functions (dashed grey lines). Whilethe level of inspection by shareholders decreases, the effect on the monitoringeffort is uncertain. The reason is that a larger bonus has a direct effect on themanagerial effort due to the larger reward, but it also reduces the inspectionintensity by shareholders.
In figure 2, we represent the equilibrium efforts as the intersectionE between the two best reply functions; we can perform graphicallythe comparative static exercise that results from a change in b inproposition 3 by shifting the two best reply functions.
Proposition 3 shows that the equilibrium outcome, representedin the new intersection E′, has an ambiguous effect on p due to theuncertain impact on bank managerial effort. While, on the one hand,the bonus increases the monetary reward for the bank manager whobehaves, on the other hand, it decreases the inspection effort byshareholders, inducing greater shirking by the bank manager. Thenet effect on the managerial effort is therefore uncertain.
The ambiguity of this last result calls for an empirical explorationof the impact of a larger bonus on bank risk.
It is interesting to evaluate the effect of a larger bonus accordingto different levels of capitalization of the bank.
258 International Journal of Central Banking June 2015
Proposition 4. In a bank with a larger capital ratio k, a largerbonus b is more effective in reducing the probability of loan losses p.
Proof. See appendix 1.
In appendix 3 we provide some numerical simulations to illustratethe results in propositions 3 and 4.
3.3 Risk-Sensitive Deposit Insurance
We now relax the assumption of a deposit insurance funded withtaxpayers’ money. When the deposit insurance premium is chargedto the bank at date 0, there is an additional countervailing effectdue to the expected impact of a larger managerial bonus on the riskthrough the deposit insurance premium.14
Assume that the bank shareholders pay a fair premium at date0 to the deposit insurance to refund depositors for the expectedshortfalls on the face value of their deposits, that is,
π0 = p(m, s) [D0 − (R − �)L0] . (8)
Now the bank’s balance sheet at date 0 is given by
E0 + D0 = π0 + L0. (9)
All the rest of the model is unchanged. Now the equilibrium is thefollowing:
Proposition 5. When the lending size is limited by the capital ratiok such that L0 ≤ E0/k and the deposit insurance premium chargedon the bank is fair, the monitoring intensity m of the bank manager,the inspecting effort of shareholders s, and the probability of loanlosses p are the solution to the following system of equations:
(1 − k) − (R − p�) + (1 − p)[b + Ω
]= 0 (10)
14In appendix 2, we indicate that this case is perfectly equivalent to that of abank funded mainly with unsecured debt. Our model can therefore be exploitedto discuss the effect of a greater managerial bonus with different degrees of marketdiscipline.
Vol. 11 No. 3 CEO Compensation, Regulation, and Risk 259
[Δ + s(1 − pH)] b − mM = 0 (11)
p − pL − (1 − m) (Δ − sΔφ) = 0, (12)
with Ω ≡ Cs(1−m)Δφ
.
Proof. Assume that conditions (3) and (4) are binding; after substi-tuting the fair premium (8) into (9), we derive the equations (10)and (11). Adding the definition of probability (12), we derive the sys-tem of equations (10)–(12), which determines the equilibrium values(p, s, m). Notice that this system is non-linear and therefore cannotbe solved explicitly.
The effect of a change in the level of the bonus on the prob-ability of loan losses p is based on the result in proposition 6 inappendix 1. When the overall effect of a larger bonus is positive, arisk-sensitive deposit insurance premium changes, reflecting a lowerriskiness; therefore, the stake of revenues from loans retained byshareholders increases, improving their marginal benefit of inspec-tion. This initiates a virtuous circle by which the negative effecton the inspection of shareholders is reduced. Hence, an increase inmanagerial bonus can be even more beneficial. However, when alarger bonus increases bank risk, a risk-sensitive deposit insurancepremium might exacerbate the negative effect: a risk-sensitive pre-mium reacts to the increase in risk by reducing the stake of revenuesfrom loans retained by shareholders, and this creates a further disin-centive to their inspecting effort. The overall negative effect on riskmight be even larger with a risk-sensitive deposit insurance. Thisis why, in the empirical analysis, we measure the effect of a largermanagerial compensation by taking into account the cross-countryheterogeneity derived from the different institutional arrangementsconcerning deposit insurance.
4. Data Sources
In this paper, we contribute to the empirical literature with a newdatabase by matching four different sources of data. The final objec-tive is to build a panel of large banks from several countries whereeach single observation is a CEO and his bank. In particular, wecombine information at the bank level (such as accounting records
260 International Journal of Central Banking June 2015
information) with information on CEO compensation, for differentyears and for different countries. To link these data, absent directlinkages between accounting records and CEO compensation data,we merged observations from two different sources: Bankscope15 andCapital IQ – People Intelligence.16 From Capital IQ, we initiallyselected all commercial banks, savings institutions (SIC codes 6020,6021, 6029, and 6036), and bank holding companies (BHCs, withSIC code 6719) for which the compensation of CEOs was avail-able for at least one year within the period 2005–9; from BHCswe excluded banks for which the primary specialization is brokerageand financial services (SIC codes 6162, 6199, 6200, and 6211). Wethen matched these selected banks with the top ten largest publiclylisted banks for each country; the largest banks have been ranked interms of total assets and have been selected each year from 2005 to2009. Following this repeated selection process (every year start-ing from 2005 to 2009), we discarded a bank if it was observedin the pre-crisis years but disappeared during the crisis because ofmergers and acquisitions or insolvency. Then, we extracted infor-mation from Datastream about stock returns and equity prices atdaily and weekly frequency in the years from 2005 to 2009. Finally,we added the indicators on financial regulation at the country levelfollowing Caprio, Laeven, and Levine (2007), who derived the infor-mation from the third wave of the World Bank’s Bank Regulationand Supervision Survey.17 In conclusion, we obtain a sample of the116 largest banks from twenty-six countries.18 Not surprisingly, themajority of observations belong to countries where the disclosureof managerial compensation is mandatory (as, for example, in theUnited States).
15Bankscope is a directory and financial reporting service on 30,000 banksworldwide provided by Bureau van Dijk. It provides standardized reports, ratings,and ownership data as well as financial analysis functions.
16Capital IQ – People Intelligence is a database provided by Standard andPoor’s on the profiles of public and private firms worldwide, including financials,officers and directors, ownership, advisory relationships, transactions, securities,key developments, estimates, key documents, credit ratings, and filings.
17We present a list and a detailed description of our variables of interest inappendix 4.
18We present the final list of banks and countries in table 10 in appendix 5.
Vol. 11 No. 3 CEO Compensation, Regulation, and Risk 261
4.1 Descriptive Statistics
In the next two sub-sections, we provide summary statistics for oursample of banks and the way their CEOs are remunerated. In par-ticular, in the following sub-section, we examine banks’ accountingstatements at the end of 2006 and their performance in the laterperiod October 2007–December 2008; in the subsequent sub-sectionwe examine summary statistics of CEO compensation and equityownership measured at the end of 2006.
4.1.1 Banks
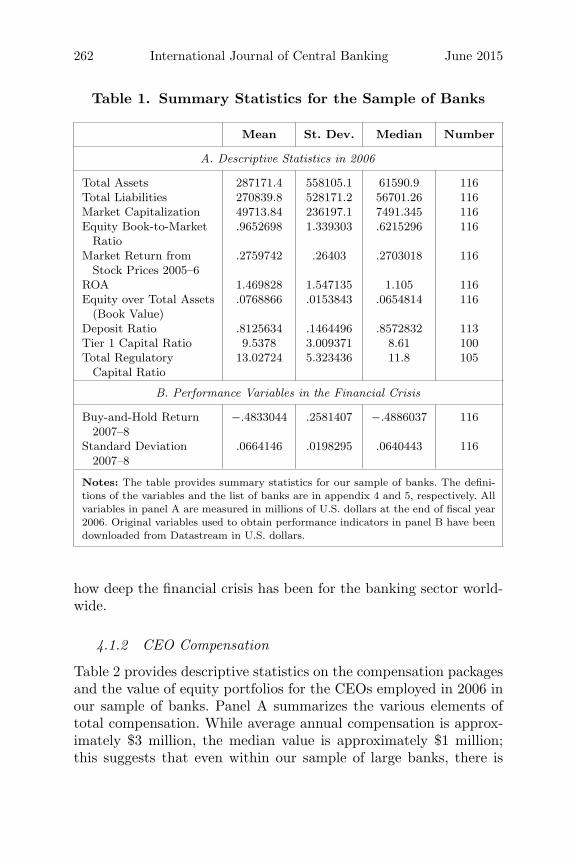
Table 1 provides the descriptive statistics for our sample of 116 largebanks (all variables are in U.S. dollars). The value of total assets isin fact significantly larger compared to related papers that focuson U.S. banks—as, for instance, Fahlenbrach and Stulz (2011). Oursample is comparable to the sample in Beltratti and Stulz (2012),although we have fewer observations because compensation variablesare not available for all banks due to the lack of mandatory disclosurerules. While sample size may represent a limit for the external valid-ity of the empirical analysis, focusing on the largest banks has theadvantage of enhancing their comparability. As argued by Laevenand Levine (2009), the largest groups tend to better comply withinternational accounting standards.
The average and median equity book-to-market ratio are smallerthan 1; this indicates that banks were potentially growing in 2006.This evidence, combined with a positive average market stock returnfrom stock prices between 2005 and 2006 of about 27 percent, sug-gests that the huge drop in stock returns from mid-2007 was, atleast to some extent, unexpected even at the end of 2006. Tier 1 andtotal regulatory capital ratios are not observed for all banks in oursample. The mean value of the total regulatory capital ratio sug-gests that banks in 2006 had capital, on average, above the requiredminimum of Basel I. We will include tier 1 capital ratio as a con-trol variable in our regression analysis, given its importance for theevaluation of bank stability for supervisory authorities—althoughwe lack the information on its value for more than 10 percent of thebanks in our sample. The average buy-and-hold return in the period2007:Q3–2008:Q4 was approximately −48 percent; this underlines
262 International Journal of Central Banking June 2015
Table 1. Summary Statistics for the Sample of Banks
Mean St. Dev. Median Number
A. Descriptive Statistics in 2006
Total Assets 287171.4 558105.1 61590.9 116Total Liabilities 270839.8 528171.2 56701.26 116Market Capitalization 49713.84 236197.1 7491.345 116Equity Book-to-Market
Ratio.9652698 1.339303 .6215296 116
Market Return fromStock Prices 2005–6
.2759742 .26403 .2703018 116
ROA 1.469828 1.547135 1.105 116Equity over Total Assets
(Book Value).0768866 .0153843 .0654814 116
Deposit Ratio .8125634 .1464496 .8572832 113Tier 1 Capital Ratio 9.5378 3.009371 8.61 100Total Regulatory
Capital Ratio13.02724 5.323436 11.8 105
B. Performance Variables in the Financial Crisis
Buy-and-Hold Return2007–8
−.4833044 .2581407 −.4886037 116
Standard Deviation2007–8
.0664146 .0198295 .0640443 116
Notes: The table provides summary statistics for our sample of banks. The defini-tions of the variables and the list of banks are in appendix 4 and 5, respectively. Allvariables in panel A are measured in millions of U.S. dollars at the end of fiscal year2006. Original variables used to obtain performance indicators in panel B have beendownloaded from Datastream in U.S. dollars.
how deep the financial crisis has been for the banking sector world-wide.
4.1.2 CEO Compensation
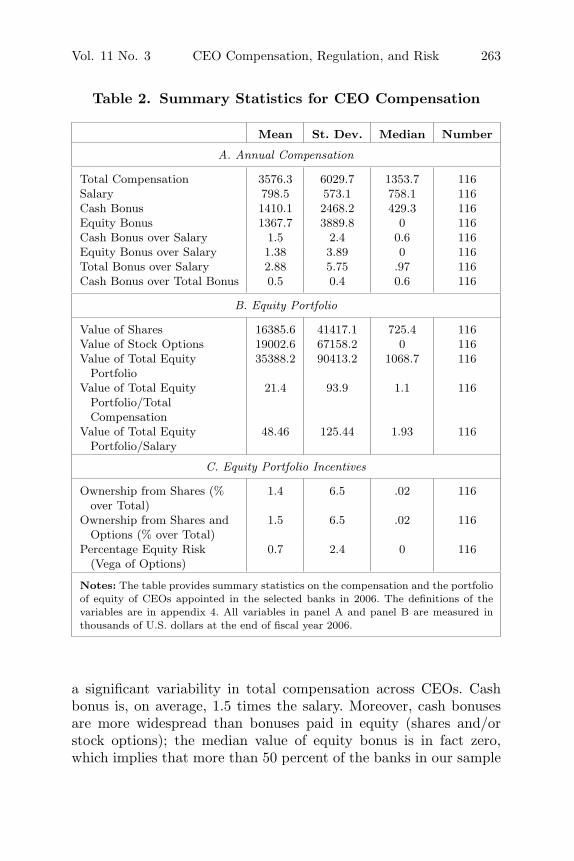
Table 2 provides descriptive statistics on the compensation packagesand the value of equity portfolios for the CEOs employed in 2006 inour sample of banks. Panel A summarizes the various elements oftotal compensation. While average annual compensation is approx-imately $3 million, the median value is approximately $1 million;this suggests that even within our sample of large banks, there is
Vol. 11 No. 3 CEO Compensation, Regulation, and Risk 263
Table 2. Summary Statistics for CEO Compensation
Mean St. Dev. Median Number
A. Annual Compensation
Total Compensation 3576.3 6029.7 1353.7 116Salary 798.5 573.1 758.1 116Cash Bonus 1410.1 2468.2 429.3 116Equity Bonus 1367.7 3889.8 0 116Cash Bonus over Salary 1.5 2.4 0.6 116Equity Bonus over Salary 1.38 3.89 0 116Total Bonus over Salary 2.88 5.75 .97 116Cash Bonus over Total Bonus 0.5 0.4 0.6 116
B. Equity Portfolio
Value of Shares 16385.6 41417.1 725.4 116Value of Stock Options 19002.6 67158.2 0 116Value of Total Equity
Portfolio35388.2 90413.2 1068.7 116
Value of Total EquityPortfolio/TotalCompensation
21.4 93.9 1.1 116
Value of Total EquityPortfolio/Salary
48.46 125.44 1.93 116
C. Equity Portfolio Incentives
Ownership from Shares (%over Total)
1.4 6.5 .02 116
Ownership from Shares andOptions (% over Total)
1.5 6.5 .02 116
Percentage Equity Risk(Vega of Options)
0.7 2.4 0 116
Notes: The table provides summary statistics on the compensation and the portfolioof equity of CEOs appointed in the selected banks in 2006. The definitions of thevariables are in appendix 4. All variables in panel A and panel B are measured inthousands of U.S. dollars at the end of fiscal year 2006.
a significant variability in total compensation across CEOs. Cashbonus is, on average, 1.5 times the salary. Moreover, cash bonusesare more widespread than bonuses paid in equity (shares and/orstock options); the median value of equity bonus is in fact zero,which implies that more than 50 percent of the banks in our sample
264 International Journal of Central Banking June 2015
did not award any stock and/or option in 2006 to their CEOs. PanelB summarizes the statistics on the equity portfolio of CEOs. Equityportfolio is the sum of shares (restricted and unrestricted) and stockoptions held by each CEO at the end of 2006. The average valueof the equity portfolio was $35 million. The median value of shares(restricted and unrestricted) was approximately $725,000 at the endof 2006. Panel C summarizes some of the variables that will be usedin the empirical analysis; they measure the sensitivity of the valueof equity portfolio to changes in returns and risk of banks’ shareprices. As for the stock options, following Core and Guay’s (2002)approximation, we distinguish between the sensitivity of CEO stock-option portfolios to share prices (option delta) and the sensitivityto volatility of stocks (option vega). The reason is that while Guay(1999) finds that firm equity risk is positively related to the con-vexity of the monetary incentives provided to their CEOs, Coles,Naveen, and Naveen (2006) find that the stock-return volatility ofrisky investments is positively affected by the deltas and vegas cal-culated on managers’ options. We finally define the ownership fromshares and stock options as the sum of option delta and direct insiderownership from shares.19
The figures on the average value of ownership from shares andstock options in our data indicate that a CEO would gain an addi-tional 1.4 percent in the value of his equity portfolio for a 1 percentincrease in stock prices, while the value of percentage equity risk(the vega weighted for all options) means that a CEO would see anincrease of 0.7 percent in his stock-options wealth for a 1 percentincrease in volatility of stock prices.
5. Financial Crisis and CEO Compensation
In this section, we analyze how the variables related to CEO mon-etary incentives in the pre-crisis year affected the performance ofbanks during the financial crisis. Following the structure and thepredictions of the model, in the empirical analysis, we assumethat shareholders were not expecting the evolution of their bankperformance in the financial crisis at the time when they set the
19See appendix 4 for a detailed definition of the variables used in the empiricalanalysis.
Vol. 11 No. 3 CEO Compensation, Regulation, and Risk 265
compensation schemes before the collapse. Consequently, we run thefollowing OLS regression:
Yi,07−08 = α + βV Ci,2006 + γControlsi,2006 + εi,07−08, (13)
where the dependent variable Yi,07−08 is either buy-and-hold return(BHR, hereafter) of each bank stock price or standard deviation(SD, hereafter) of stock returns in the period 2007:Q3–2008:Q4. Wedecided to exclude the first two quarters of 2009 when computingthese variables because bank returns in this last part of the recessionmay have been affected by national recovery policies.20 On the right-hand side of equation (13), we measure CEO monetary incentives byusing different measures of variable compensation in 2006, V Ci,2006.Following related literature on the effect of variable compensation onrisk (Benmelech, Kandel, and Veronesi 2010), we consider separatelymeasures of shorter-term incentives given by annual cash compen-sation and measures of longer-term incentives given by the equityportfolio of CEOs. Short-term incentives are measured by cash bonusover salary in 2006. Equity incentives are measured by the own-ership from shares and options and by the percentage equity riskevaluated in 2006. In the theoretical section of the paper, we havedemonstrated that the risk of the bank arises endogenously fromthe strategic interaction between managers, whose effort depends onvariable compensation, and the shareholders, whose effort dependson the capital structure of the bank; consequently, to isolate theeffect of variable compensation on risk, it is important that ourempirical results adequately control for bank characteristics thatshape shareholder incentives. In our regression analysis, we will addvariables at the bank level to control for size (the log of market cap-italization), for leverage (measured by equity to total asset), and forcapital adequacy and liquidity (tier 1 capital ratio). When analyzingthe determinants of risk taking of a bank, it is also important to con-trol for measures of productivity because the literature acknowledgesthat risk and productivity are endogenously determined (Hughes
20As a consequence, we do not conform to National Bureau of EconomicResearch dates of the Great Recession, namely 2007:Q3–2009:Q2. However, asa robustness check, we repeated the analysis by including the first and the sec-ond quarter of 2009 in the measure of BHR and SD. The results, not included inthe current version, are substantially unchanged.
266 International Journal of Central Banking June 2015
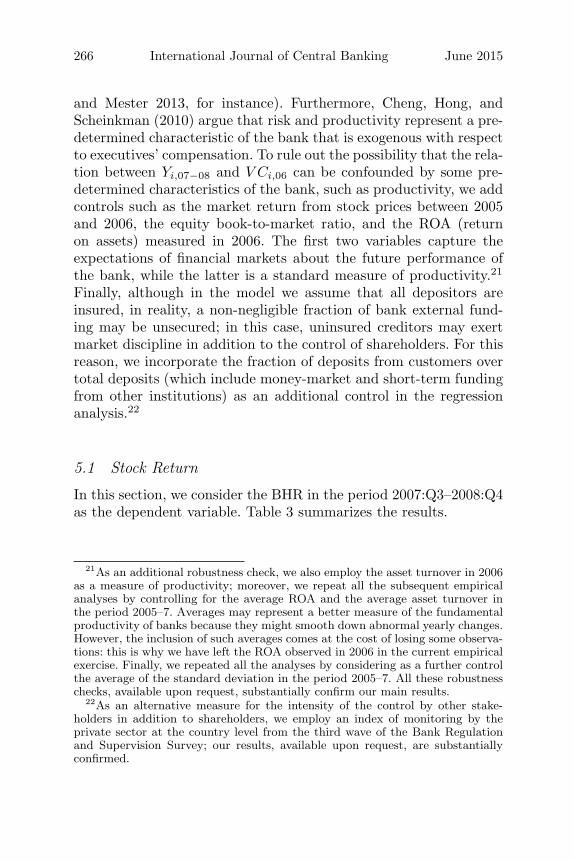
and Mester 2013, for instance). Furthermore, Cheng, Hong, andScheinkman (2010) argue that risk and productivity represent a pre-determined characteristic of the bank that is exogenous with respectto executives’ compensation. To rule out the possibility that the rela-tion between Yi,07−08 and V Ci,06 can be confounded by some pre-determined characteristics of the bank, such as productivity, we addcontrols such as the market return from stock prices between 2005and 2006, the equity book-to-market ratio, and the ROA (returnon assets) measured in 2006. The first two variables capture theexpectations of financial markets about the future performance ofthe bank, while the latter is a standard measure of productivity.21
Finally, although in the model we assume that all depositors areinsured, in reality, a non-negligible fraction of bank external fund-ing may be unsecured; in this case, uninsured creditors may exertmarket discipline in addition to the control of shareholders. For thisreason, we incorporate the fraction of deposits from customers overtotal deposits (which include money-market and short-term fundingfrom other institutions) as an additional control in the regressionanalysis.22
5.1 Stock Return
In this section, we consider the BHR in the period 2007:Q3–2008:Q4as the dependent variable. Table 3 summarizes the results.
21As an additional robustness check, we also employ the asset turnover in 2006as a measure of productivity; moreover, we repeat all the subsequent empiricalanalyses by controlling for the average ROA and the average asset turnover inthe period 2005–7. Averages may represent a better measure of the fundamentalproductivity of banks because they might smooth down abnormal yearly changes.However, the inclusion of such averages comes at the cost of losing some observa-tions: this is why we have left the ROA observed in 2006 in the current empiricalexercise. Finally, we repeated all the analyses by considering as a further controlthe average of the standard deviation in the period 2005–7. All these robustnesschecks, available upon request, substantially confirm our main results.
22As an alternative measure for the intensity of the control by other stake-holders in addition to shareholders, we employ an index of monitoring by theprivate sector at the country level from the third wave of the Bank Regulationand Supervision Survey; our results, available upon request, are substantiallyconfirmed.
Vol. 11 No. 3 CEO Compensation, Regulation, and Risk 267
Tab
le3.
Reg
ress
ion
Anal
ysi
s:B
uy-a
nd-H
old
Ret
urn
s20
07:Q
3–20
08:Q
4
Dep
enden
tV
aria
ble
:B
HR
(1)
(2)
(3)
(4)
(5)
Cas
hB
onus
over
Sala
ry−
0.00
752
−0.
0026
1−
0.00
439
−0.
0069
9−
0.00
0348
(0.0
105)
(0.0
112)
(0.0
122)
(0.0
115)
(0.0
118)
Ow
ners
hip
from
Shar
es0.
333
0.24
2−
0.18
3−
0.31
3−
0.44
0an
dO
ptio
ns(0
.386
)(0
.403
)(0
.296
)(0
.295
)(0
.329
)Per
cent
age
Equ
ity
Ris
k−
1.32
4−
1.12
0−
1.72
3∗−
1.72
6−
1.64
3(0
.963
)(0
.963
)(0
.951
)(1
.061
)(1
.092
)Log
ofM
arke
t−
0.01
10−
0.01
46−
0.00
0000
413
0.00
905
Cap
ital
izat
ion
(0.0
110)
(0.0
152)
(0.0
189)
(0.0
170)
Equ
ity
Boo
k-to
-Mar
ket
−0.
431∗
∗−
0.04
33∗∗
−0.
0344
∗∗
Rat
io(0
.020
3)(0
.019
6)(0
.016
4)M
arke
tR
etur
n(2
005–
6)−
0.34
3∗∗∗
−0.
337∗
∗∗−
0.31
8∗∗∗
(0.0
942)
(0.0
857)
(0.0
913)
RO
A0.
0075
80.
0033
50.
0270
(0.0
194)
(0.0
278)
(0.0
460)
Equ
ity
over
Tot
alA
sset
s0.
676
−0.
327
(Boo
kV
alue
)(0
.808
)(1
.088
)D
epos
itR
atio
0.45
9∗0.
663∗
∗∗
(0.2
72)
(0.2
08)
Tie
r1
Cap
ital
Rat
io0.
0185
∗
(0.0
107)
Con
stan
t−
0.46
8∗∗∗
−0.
382∗
∗∗−
0.21
4−
0.74
1∗∗
−1.
147∗
∗∗
(0.0
308)
(0.0
964)
(0.1
61)
(0.3
60)
(0.3
00)
N11
611
611
611
310
0A
dj.R
20.
006
0.00
50.
117
0.21
10.
316
Note
s:R
obus
tst
anda
rder
rors
are
inpa
rent
hese
s.*,
**,an
d**
*de
note
p<
0.10
,p
<0.
05,an
dp
<0.
01,re
spec
tive
ly.A
llco
vari
ates
are
mea
sure
din
U.S
.do
llars
atth
een
dof
fisca
lye
ar20
06.
268 International Journal of Central Banking June 2015
In column 1, we study the relation between the BHR of banksduring the financial crisis and three different components of the vari-able compensation of CEO remuneration. We use separate measuresof CEO monetary incentives to distinguish between short-run incen-tives (cash bonus over salary) and long-run incentives (the equityportfolio); within this second type, we distinguish between the own-ership from shares and options and the percentage equity risk. Atfirst glance, we find no direct relation between each single componentof the variable compensation and ex post performance. In columns2–5, we analyze the effects of our measures of variable compensation,also controlling for variables at the bank level. In column 2, we con-trol for size; in column 3, we add measures of ex ante performanceand productivity; in column 4, we add a measure of leverage andthe deposit ratio as additional controls; in column 5, we add the tier1 capital ratio.23 The results reveal that, while variable compensa-tion had no direct impact on BHR for the whole sample, banks withhigher stock returns and book-to-market ratios in 2006 performedsignificantly worse than other banks during the financial crisis; more-over, banks with higher tier 1 and banks that relied relatively moreon customer deposits performed better. These results are in line withthe findings of Fahlenbrach and Stulz (2011), although they focus ona sample of U.S. banks. In the next section, we will show how thisconclusion might be challenged by introducing variables aimed atcapturing the quality of bank governance and financial regulation.
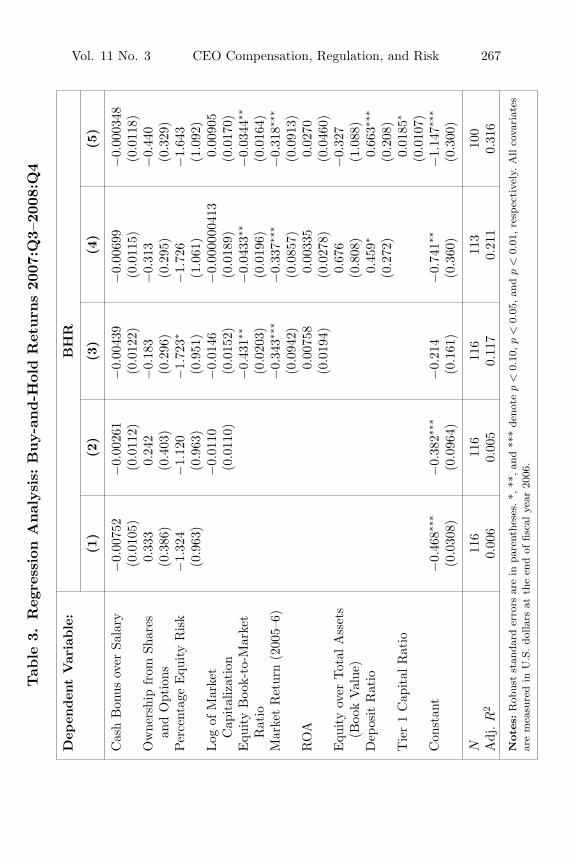
5.2 Risk Return
Now we simply replicate the previous analysis using the standarddeviation of stock returns as the dependent variable. The reason isthat the convexity of monetary incentives given to CEOs may affectnot only the average return of stocks of banks but also its risk (Coles,Naveen, and Naveen 2006). Results are in table 4.
The results in columns 1–4 indicate a statistically significanteffect of monetary incentives given by stock options on realized
23While we acknowledge the importance of this variable for the performanceof banks, we separately add it in the regression analysis, as it is not observed forapproximately 10 percent of banks in our sample.
Vol. 11 No. 3 CEO Compensation, Regulation, and Risk 269
Tab
le4.
Reg
ress
ion
Anal
ysi
s:Sta
ndar
dD
evia
tion
2007
:Q3–
2008
:Q4
Dep
enden
tV
aria
ble
:SD
(1)
(2)
(3)
(4)
(5)
Cas
hB
onus
over
Sala
ry0.
0006
02−
0.00
0100
00.
0007
670.
0007
950.
0006
02(0
.000
707)
(0.0
0075
3)(0
.000
868)
(0.0
0077
9)(0
.000
790)
Ow
ners
hip
from
Shar
es−
0.04
81∗∗
∗−
0.03
50∗∗
∗−
0.03
46∗∗
∗−
0.02
37∗∗
−0.
0129
and
Opt
ions
(0.0
100)
(0.0
109)
(0.0
125)
(0.0
109)
(0.0
126)
Per
cent
age
Equ
ity
Ris
k0.
174∗
0.14
40.
190∗
∗0.
154∗
0.16
3∗∗
(0.0
972)
(0.0
963)
(0.0
957)
(0.0
797)
(0.0
772)
Log
ofM
arke
t0.
0015
8∗−
0.00
108
−0.
0017
3−
0.00
105
Cap
ital
izat
ion
(0.0
0085
7)(0
.001
29)
(0.0
0120
)(0
.001
02)
Equ
ity
Boo
k-to
-Mar
ket
−0.
0043
7∗∗∗
−0.
0038
0∗∗∗
−0.
0031
6∗∗∗
Rat
io(0
.001
36)
(0.0
0103
)(0
.000
975)
Mar
ket
Ret
urn
(200
5–6)
0.01
54∗∗
∗0.
0153
∗∗∗
0.02
12∗∗
∗
(0.0
0581
)(0
.004
65)
(0.0
0457
)R
OA
−0.
0023
1∗∗
−0.
0033
9−
0.00
586∗
∗
(0.0
0115
)(0
.002
58)
(0.0
0279
)E
quity
over
Tot
alA
sset
s0.
0453
0.05
35(B
ook
Val
ue)
(0.0
608)
(0.0
871)
Dep
osit
Rat
io−
0.04
04∗∗
∗−
0.03
56∗∗
(0.0
132)
(0.0
147)
Tie
r1
Cap
ital
Rat
io−
0.00
0004
09(0
.000
702)
Con
stan
t0.
0651
∗∗∗
0.05
27∗∗
∗0.
0770
∗∗∗
0.11
2∗∗∗
0.10
1∗∗∗
(0.0
0214
)(0
.007
24)
(0.0
136)
(0.0
203)
(0.0
190)
N11
611
611
611
310
0A
dj.R
20.
060
0.07
70.
163
0.24
20.
279
Note
s:R
obus
tst
anda
rder
rors
are
inpa
rent
hese
s.*,
**,an
d**
*de
note
p<
0.10
,p
<0.
05,an
dp
<0.
01,re
spec
tive
ly.A
llco
vari
ates
are
mea
sure
din
U.S
.do
llars
atth
een
dof
fisca
lye
ar20
06.
270 International Journal of Central Banking June 2015
volatility of bank stock returns during the financial crisis. In partic-ular, ownership from shares and options and the percentage equityrisk affected the volatility of stock returns in two opposite directions.While the first is associated with a smaller volatility, the second isassociated with a higher one. However, the effect of these variablesbecomes weaker in terms of statistical significance in column 5 whenwe add the tier 1 as an additional control. This last result calls for afurther exploration of the relation between capital requirements andvariable compensation.
6. The Effect of Financial Regulation
The evidence provided in the previous section is coherent withproposition 3 of our model: variable compensation may have anambiguous effect on risk taking depending upon the incentives ofbank managers and shareholders, which ultimately depend uponthe regulatory environment and the relative efficiency of monitoringover inspecting activities; coherently, in our whole sample, we donot find any direct effects of variable compensation on performance.Our interpretation is that the potential positive effects of a largervariable compensation have been, to some extent, counterbalancedby their negative effects; as a result, we do not find a direct effectof the variable compensation of CEOs on return and risk. However,this result does not prevent the possibility that variable compensa-tion may have significantly impacted the performance of banks onlyunder certain regulatory/institutional conditions. The scope of thenext analysis is precisely to explore the interaction between regula-tion and variable compensation on ex post performance, under theguidance of the insights from the theoretical section. In particular,we present additional empirical analysis to address three main the-oretical predictions: (i) weaker control by shareholders, combinedwith variable compensation, might increase the risk-taking attitudeof bank managers; (ii) when variable compensation has a negativeeffect on the risk of banks, a risk-sensitive deposit insurance premiummight exacerbate its negative effect; for this reason, we will exploitdifferences in the institutional arrangements with regard to depositinsurance at the country level; and (iii) higher capital requirementsmay reduce risk-taking incentives by insiders.
Vol. 11 No. 3 CEO Compensation, Regulation, and Risk 271
6.1 The Effect of Shareholders’ Control
Let us study the effects of CEO monetary incentives in contextsin which the efficiency and consequently the intensity of control byshareholders over bank managers is relatively stronger comparedwith the rest of the sample. For this purpose, we identify proxies forthe efficiency of control both at the bank and country level, intro-ducing measures of financial regulation. Following seminal contribu-tions in the corporate governance literature (Jensen and Meckling1976; Shleifer and Vishny 1986), we proxy the efficiency of controlby ownership concentration in the bank. The main hypothesis isthat in banks with lower ownership concentration, dispersed share-holders have less power and fewer incentives to control managerialbehavior due to the greater marginal cost compared with the bene-fit. We measure ownership concentration as the sum of the shares ofthe largest three shareholders (C3 index) in 2006, and we examinehow ownership concentration interacts with variable compensationin shaping the risk of individual banks. We split the sample into twosub-samples, according to whether the value of the C3 index is below(greater cost of inspection by shareholders, due to share dispersion)or above the median and explore if there is a significant differencein the average compensation schemes adopted in the two groups ofbanks. Evidence from table 5 indicates that banks with lower own-ership concentration were significantly bigger (total assets measuredat the end of 2006) and awarded significantly larger bonuses (bothin form of cash and equity) to their CEOs in 2006.
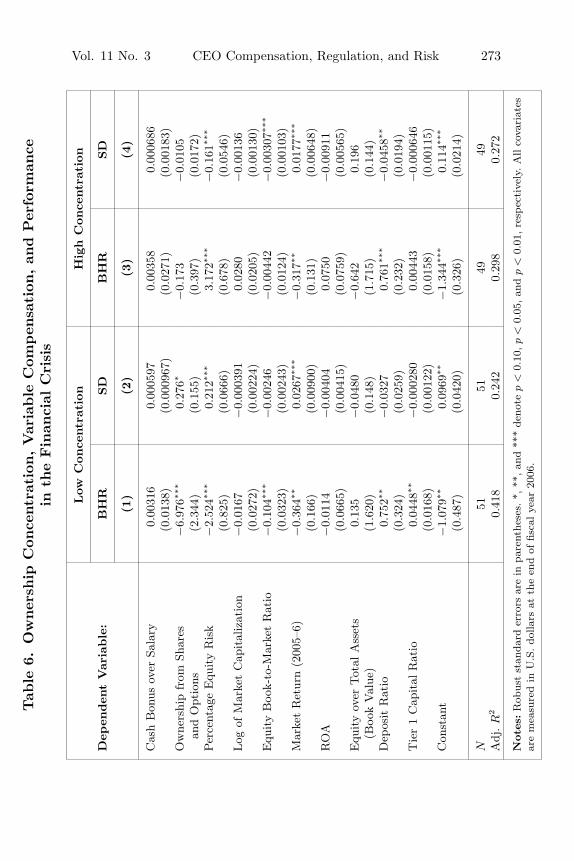
To study if this difference in compensation structure hasimpacted performance of banks during the financial crisis, we runa regression analysis similar to that in section 5 by splitting theoriginal sample into two sub-samples. Results are in table 6.
Columns 1 and 2 replicate the regression analysis of the full spec-ification in column 5 of tables 3 and 4 for the sub-sample of bankswith lower ownership concentration. Notice that we have fewer obser-vations in this analysis compared with table 5, as the inclusion oftier 1 as a regressor reduces the sample size. The analysis revealsthat, in banks with a lower ownership concentration, the larger theequity bonus (measured as either shares and stock-options holdingsor percentage equity risk), the worse the bank performance bothin terms of stock returns and volatility. Columns 3 and 4 follow a
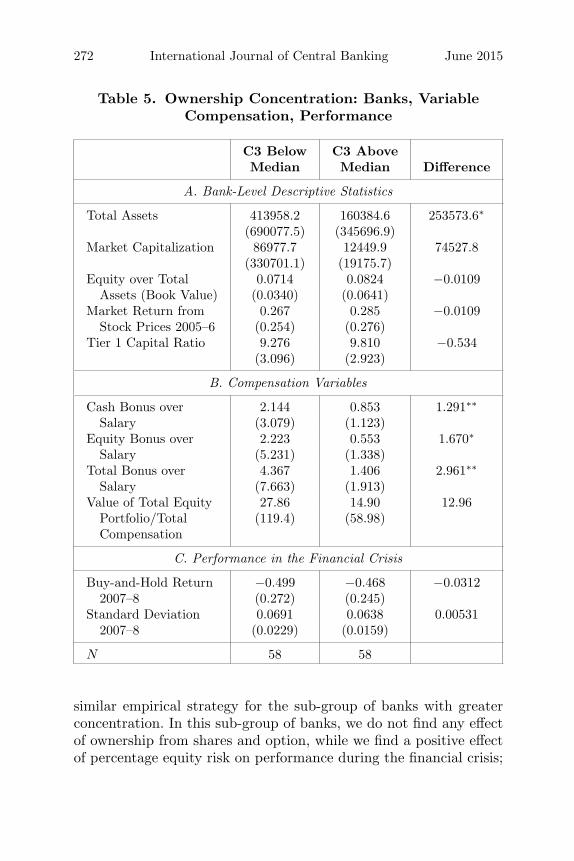
272 International Journal of Central Banking June 2015
Table 5. Ownership Concentration: Banks, VariableCompensation, Performance
C3 Below C3 AboveMedian Median Difference
A. Bank-Level Descriptive Statistics
Total Assets 413958.2 160384.6 253573.6∗
(690077.5) (345696.9)Market Capitalization 86977.7 12449.9 74527.8
(330701.1) (19175.7)Equity over Total 0.0714 0.0824 −0.0109
Assets (Book Value) (0.0340) (0.0641)Market Return from 0.267 0.285 −0.0109
Stock Prices 2005–6 (0.254) (0.276)Tier 1 Capital Ratio 9.276 9.810 −0.534
(3.096) (2.923)
B. Compensation Variables
Cash Bonus over 2.144 0.853 1.291∗∗
Salary (3.079) (1.123)Equity Bonus over 2.223 0.553 1.670∗
Salary (5.231) (1.338)Total Bonus over 4.367 1.406 2.961∗∗
Salary (7.663) (1.913)Value of Total Equity 27.86 14.90 12.96
Portfolio/Total (119.4) (58.98)Compensation
C. Performance in the Financial Crisis
Buy-and-Hold Return −0.499 −0.468 −0.03122007–8 (0.272) (0.245)
Standard Deviation 0.0691 0.0638 0.005312007–8 (0.0229) (0.0159)
N 58 58
similar empirical strategy for the sub-group of banks with greaterconcentration. In this sub-group of banks, we do not find any effectof ownership from shares and option, while we find a positive effectof percentage equity risk on performance during the financial crisis;
Vol. 11 No. 3 CEO Compensation, Regulation, and Risk 273
Tab
le6.
Ow
ner
ship
Con
centr
atio
n,V
aria
ble
Com
pen
sation
,an
dPer
form
ance
inth
eFin
anci
alC
risi
s
Low
Con
centr
atio
nH
igh
Con
centr
atio
n
Dep
enden
tV
aria
ble
:B
HR
SD
BH
RSD
(1)
(2)
(3)
(4)
Cas
hB
onus
over
Sala
ry0.
0031
60.
0005
970.
0035
80.
0006
86(0
.013
8)(0
.000
967)
(0.0
271)
(0.0
0183
)O
wne
rshi
pfr
omSh
ares
−6.
976∗∗
∗0.
276∗
−0.
173
−0.
0105
and
Opt
ions
(2.3
44)
(0.1
55)
(0.3
97)
(0.0
172)
Per
cent
age
Equ
ity
Ris
k−
2.52
4∗∗∗
0.21
2∗∗∗
3.17
2∗∗∗
−0.
161∗∗
∗
(0.8
25)
(0.0
666)
(0.6
78)
(0.0
546)
Log
ofM
arke
tC
apit
aliz
atio
n−
0.01
67−
0.00
0391
0.02
80−
0.00
136
(0.0
272)
(0.0
0224
)(0
.020
5)(0
.001
30)
Equ
ity
Boo
k-to
-Mar
ket
Rat
io−
0.10
4∗∗∗
−0.
0024
6−
0.00
442
−0.
0030
7∗∗∗
(0.0
323)
(0.0
0243
)(0
.012
4)(0
.001
03)
Mar
ket
Ret
urn
(200
5–6)
−0.
364∗∗
0.02
67∗∗
∗−
0.31
7∗∗0.
0177
∗∗∗
(0.1
66)
(0.0
0900
)(0
.131
)(0
.006
48)
RO
A−
0.01
14−
0.00
404
0.07
50−
0.00
911
(0.0
665)
(0.0
0415
)(0
.075
9)(0
.005
65)
Equ
ity
over
Tot
alA
sset
s0.
135
−0.
0480
−0.
642
0.19
6(B
ook
Val
ue)
(1.6
20)
(0.1
48)
(1.7
15)
(0.1
44)
Dep
osit
Rat
io0.
752∗∗
−0.
0327
0.76
1∗∗∗
−0.
0458
∗∗
(0.3
24)
(0.0
259)
(0.2
32)
(0.0
194)
Tie
r1
Cap
ital
Rat
io0.
0448
∗∗−
0.00
0280
0.00
443
−0.
0006
46(0
.016
8)(0
.001
22)
(0.0
158)
(0.0
0115
)C
onst
ant
−1.
079∗∗
0.09
69∗∗
−1.
344∗∗
∗0.
114∗∗
∗
(0.4
87)
(0.0
420)
(0.3
26)
(0.0
214)
N51
5149
49A
dj.R
20.
418
0.24
20.
298
0.27
2
Note
s:R
obus
tst
anda
rder
rors
are
inpa
rent
hese
s.*,
**,an
d**
*de
note
p<
0.10
,p
<0.
05,an
dp
<0.
01,re
spec
tive
ly.A
llco
vari
ates
are
mea
sure
din
U.S
.do
llars
atth
een
dof
fisca
lye
ar20
06.
274 International Journal of Central Banking June 2015
this is in fact associated with higher returns and lower volatility.24
These results support the prediction of the model. Greater variablecompensation, in the form of equity bonuses, has led to worse per-formance (lower returns and higher volatility) in banks with weakerinternal control by shareholders. This evidence is coherent with thefindings in Gropp and Kohler (2010) indicating that more widelyheld banks faced greater loan losses in the financial crisis. To checkthe robustness of this result, we replace C3 with other proxies forthe efficiency of supervision by exploiting some of the variables con-tained in the third wave of the World Bank’s Bank Regulation andSupervision Survey. In particular, we use two proxies at the countrylevel: (i) an index of restrictions on bank activities; (ii) an index ofsupervisory power of bank supervisory authorities. Our hypothesis isthat, on the one hand, restrictions on bank activities by the financialauthority reduce managerial slack and thus lead to higher efficiency;on the other hand, greater power of bank supervisory authoritiesmakes the ex ante cost of bank manager misbehavior larger fromthe shareholder point of view, thus inducing greater internal con-trol. We split the sample of banks into two sub-samples according towhether the values of those indices are above or below the median.Results (not reported in the current version, but available uponrequest) indicate that, in the group of countries where the restric-tions on bank activities were below the median, a greater variablecompensation (in particular, equity portfolio incentives) is related toworse performance (measured by using either stock return or stan-dard deviation). In the other sub-group we don’t find any effectof variable compensation. A similar result is obtained for banks incountries where the supervisory authority is less powerful. All theseempirical findings seem to indicate that weaker supervision (dueto higher internal shareholder costs), combined with higher pay-for-performance sensitivity in CEO compensation schemes, mightexplain the higher risk in banks.
6.2 Deposit Insurance
Theoretical insights from the version of our model that incorpo-rates a risk-sensitive deposit insurance mechanism imply that, when
24These results are robust to the inclusion of an alternative measure of banksize, such as total assets, that replaces market capitalization.
Vol. 11 No. 3 CEO Compensation, Regulation, and Risk 275
the variable compensation reduces risk, the existence of an explicitinsurance premium is beneficial. The opposite is true, however, whenhigher variable compensation implies higher risk incentives for insid-ers. Again, these results call for an empirical test of the predictionsof the model. In this sub-section, we analyze the interaction betweendeposit insurance and variable compensation on risk in banks. Tothis purpose, we divide our initial sample of banks into two groups:those banks based in countries where an explicit deposit insurancearrangement was in place in 2006 and those in countries withoutit (which we label as countries with implicit deposit insurance sys-tems). As a first step, we check if there is a significant differencein the average compensation schemes adopted in the two groups ofbanks. Evidence in table 7 reveals that the group of banks withexplicit deposit insurance has rewarded more equity bonus to theirCEOs; however, the small sample size of the other group does notmake the statistical comparison reliable.
Keeping this sample limitation in mind, we test if the interactionof explicit deposit insurance with the compensation structure has animpact on the performance of banks during the financial crisis. Whiledisplaying the results also for the other sub-sample for the sake ofcompleteness, we are aware that the small sample size reduces ourconfidence in the statistical significance of the results. We employ aregression analysis similar in spirit to the previous section. Resultsare in table 8.
Columns 3 and 4 replicate the regression analysis of the full spec-ification in column 5 of tables 3 and 4 for the sub-sample of banksbased in countries with explicit deposit insurance. Results in col-umn 3 suggest that banks that provided higher equity incentives totheir CEOs (both ownership from shares and options and percent-age equity risk) are associated with worse performance in terms ofstock returns during the financial crisis. Results in column 4 sug-gest, instead, that only percentage equity risk can be associatedwith higher volatility. Taken together, the theoretical insights andempirical results suggest that explicit deposit insurance, combinedwith variable compensation schemes, increased the risk attitude ofshareholders and bank managers and resulted in worse performanceduring the financial crisis.
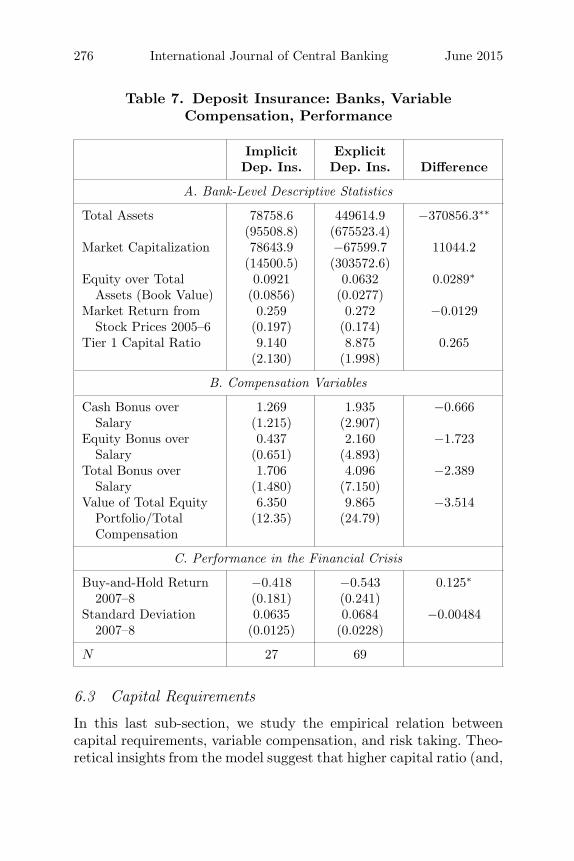
276 International Journal of Central Banking June 2015
Table 7. Deposit Insurance: Banks, VariableCompensation, Performance
Implicit ExplicitDep. Ins. Dep. Ins. Difference
A. Bank-Level Descriptive Statistics
Total Assets 78758.6 449614.9 −370856.3∗∗
(95508.8) (675523.4)Market Capitalization 78643.9 −67599.7 11044.2
(14500.5) (303572.6)Equity over Total 0.0921 0.0632 0.0289∗
Assets (Book Value) (0.0856) (0.0277)Market Return from 0.259 0.272 −0.0129
Stock Prices 2005–6 (0.197) (0.174)Tier 1 Capital Ratio 9.140 8.875 0.265
(2.130) (1.998)
B. Compensation Variables
Cash Bonus over 1.269 1.935 −0.666Salary (1.215) (2.907)
Equity Bonus over 0.437 2.160 −1.723Salary (0.651) (4.893)
Total Bonus over 1.706 4.096 −2.389Salary (1.480) (7.150)
Value of Total Equity 6.350 9.865 −3.514Portfolio/Total (12.35) (24.79)Compensation
C. Performance in the Financial Crisis
Buy-and-Hold Return −0.418 −0.543 0.125∗
2007–8 (0.181) (0.241)Standard Deviation 0.0635 0.0684 −0.00484
2007–8 (0.0125) (0.0228)
N 27 69
6.3 Capital Requirements
In this last sub-section, we study the empirical relation betweencapital requirements, variable compensation, and risk taking. Theo-retical insights from the model suggest that higher capital ratio (and,
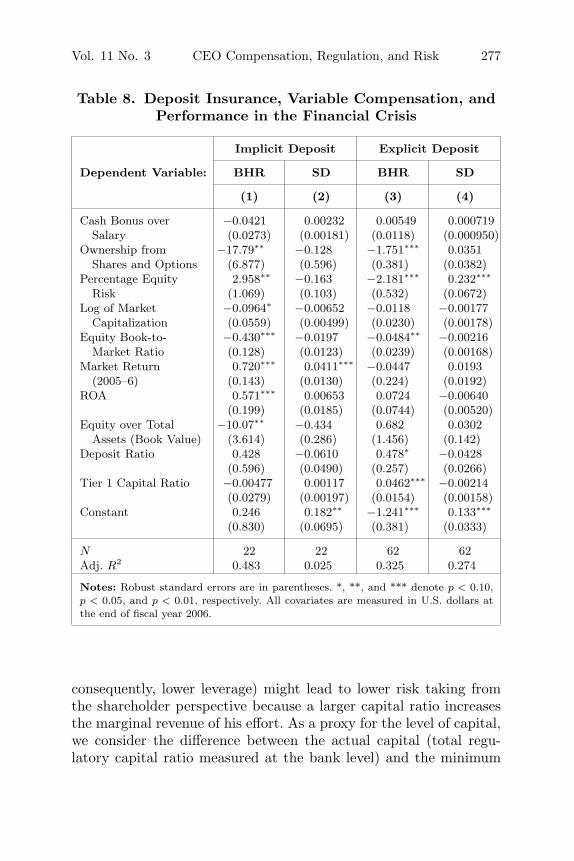
Vol. 11 No. 3 CEO Compensation, Regulation, and Risk 277
Table 8. Deposit Insurance, Variable Compensation, andPerformance in the Financial Crisis
Implicit Deposit Explicit Deposit
Dependent Variable: BHR SD BHR SD
(1) (2) (3) (4)
Cash Bonus over −0.0421 0.00232 0.00549 0.000719Salary (0.0273) (0.00181) (0.0118) (0.000950)
Ownership from −17.79∗∗ −0.128 −1.751∗∗∗ 0.0351Shares and Options (6.877) (0.596) (0.381) (0.0382)
Percentage Equity 2.958∗∗ −0.163 −2.181∗∗∗ 0.232∗∗∗
Risk (1.069) (0.103) (0.532) (0.0672)Log of Market −0.0964∗ −0.00652 −0.0118 −0.00177
Capitalization (0.0559) (0.00499) (0.0230) (0.00178)Equity Book-to- −0.430∗∗∗ −0.0197 −0.0484∗∗ −0.00216
Market Ratio (0.128) (0.0123) (0.0239) (0.00168)Market Return 0.720∗∗∗ 0.0411∗∗∗ −0.0447 0.0193
(2005–6) (0.143) (0.0130) (0.224) (0.0192)ROA 0.571∗∗∗ 0.00653 0.0724 −0.00640
(0.199) (0.0185) (0.0744) (0.00520)Equity over Total −10.07∗∗ −0.434 0.682 0.0302
Assets (Book Value) (3.614) (0.286) (1.456) (0.142)Deposit Ratio 0.428 −0.0610 0.478∗ −0.0428
(0.596) (0.0490) (0.257) (0.0266)Tier 1 Capital Ratio −0.00477 0.00117 0.0462∗∗∗ −0.00214
(0.0279) (0.00197) (0.0154) (0.00158)Constant 0.246 0.182∗∗ −1.241∗∗∗ 0.133∗∗∗
(0.830) (0.0695) (0.381) (0.0333)
N 22 22 62 62Adj. R2 0.483 0.025 0.325 0.274
Notes: Robust standard errors are in parentheses. *, **, and *** denote p < 0.10,p < 0.05, and p < 0.01, respectively. All covariates are measured in U.S. dollars atthe end of fiscal year 2006.
consequently, lower leverage) might lead to lower risk taking fromthe shareholder perspective because a larger capital ratio increasesthe marginal revenue of his effort. As a proxy for the level of capital,we consider the difference between the actual capital (total regu-latory capital ratio measured at the bank level) and the minimum

278 International Journal of Central Banking June 2015
Table 9. Distance between Actual and Required CapitalRequirements: Banks, Variable Compensation,
Performance
Distance DistanceBelow Median Above Median Difference
A. Bank-Level Descriptive Statistics
Total Assets 293935.2 332067.0 −38131.8(467886.3) (677072.6)
Market Capitalization 75052.6 34329.9 40722.7(346980.8) (62990.7)
Equity over Total Assets 0.0620 0.0887 −0.0267∗∗
(Book Value) (0.0262) (0.0631)Market Return from 0.291 0.266 0.0250
Stock Prices (0.233) (0.261)Tier 1 Capital Ratio 8.068 11.13 −3.061∗∗∗
(1.598) (3.366)
B. Compensation Variables
Cash Bonus over Salary 1.473 1.678 −0.205(2.553) (2.434)
Equity Bonus over 0.744 1.952 −1.208Salary (2.383) (4.616)
Total Bonus over Salary 2.217 3.630 −1.414(4.532) (6.711)
Value of Total Equity 14.44 31.21 −16.77Portfolio/Total (60.15) (125.5)Compensation
C. Performance in the Financial Crisis
Buy-and-Hold Return −0.543 −0.426 −0.117∗∗
2007–8 (0.223) (0.229)Standard Deviation 0.0675 0.0618 0.00572
2007–8 (0.0169) (0.0166)
N 52 53
capital requirement (defined by each country authority).25 We divideour sample of banks into two groups according to the value of thisdifference, one below and the another above the median. Evidencefrom the descriptive analysis in table 9 shows that there is not a
25The minimum required capital ratio has been collected directly from the thirdwave of the Bank Regulation and Supervision Survey (as described in appendix 4).Notice that about 80 percent of banks in our sample operate in countries wherethe required ratio is less than or equal to 8 percent.
Vol. 11 No. 3 CEO Compensation, Regulation, and Risk 279
significant difference in the balance sheet or CEO compensationvariables between the banks in the two groups; instead, we findthat more-capitalized banks performed relatively better during thefinancial crisis than poorly capitalized banks, confirming the baselineresults in section 5. Turning to the regression analysis, we do not findconsistent evidence that variable compensation affected return andrisk in the two sub-groups of banks; this result, which is perfectlycoherent with evidence found by Chesney, Stromberg, and Wagner(2010), Beltratti and Stulz (2012), and Demirguc-Kunt, Detragiache,and Merrouche (2013), suggests that shareholders in poorly capital-ized banks may have perfectly aligned their incentives with those oftheir CEOs to take more risk.
7. Conclusions
This paper contributes to the recent literature on the determi-nants of risk in banks. In particular, we analyze the impact ofCEOs’ variable compensation as well as that of corporate gover-nance and financial regulation. We set out a theoretical frameworkthat can illuminate the determinants of risk in banks when theagency conflicts between managers, shareholders, and depositors areimportant; and we test the model’s predictions with an analysis ofbanks’ performance during the financial crisis, using a novel data-base on banks in different countries. We can summarize the results asfollows:
• There is no evidence of an association between variable com-pensation and bank performance (measured as stock returnsand standard deviation of stock returns) for the entire sample.
• There is evidence of a correlation between variable compensa-tion and risk when we interact it with banks’ corporate gov-ernance arrangements and the financial regulatory frameworkin the country where the bank is located.
• CEOs’ monetary incentives are associated with lower stockreturns and higher volatility in banks where shareholders’

280 International Journal of Central Banking June 2015
control is weak—i.e., when ownership concentration is low—and where restrictions on banks’ activities and the power ofsupervisory authorities are relatively weaker.
• For banks in countries with explicit deposit insurance, anincrease in CEOs’ variable compensation is associated withworse performance and greater risk.
• Highly capitalized banks were more resilient during the finan-cial crisis; their stock returns dropped less and their standarddeviation was smaller.
This evidence offers substantial support for the indications ofour model. To our knowledge, the paper is one of the first model-assisted empirical studies of the interrelations between CEOs’ mon-etary incentives, financial regulation, and risk taking at banks in dif-ferent countries. The understanding of these interactions may haveimportant policy implications in the current debate about prudentialregulation.
Appendix 1. Computations and Proofs
Proof of Proposition 1
Assume that conditions (4) and (3) are binding; after substitutingthe balance sheet (1) into (3), we derive equations (5) and (6). Wecan solve this linear system of equations and derive the equilibriumvalues of s and (1 − m) as follows:
(1 − m) =(M − Δ.b)
M + AC (1 − pH)b
and
s =A
C(1 − m) =
A
C.
[(M − Δ.b)
M + AC (1 − pH)b
].
We need to assume M ≥ Δ.b in order to guarantee that the twoefforts, and thus the two probabilities, are positive. To derive therisk in equilibrium, i.e., equation (7), we simply substitute the twovalues s and (1 − m) into (2).
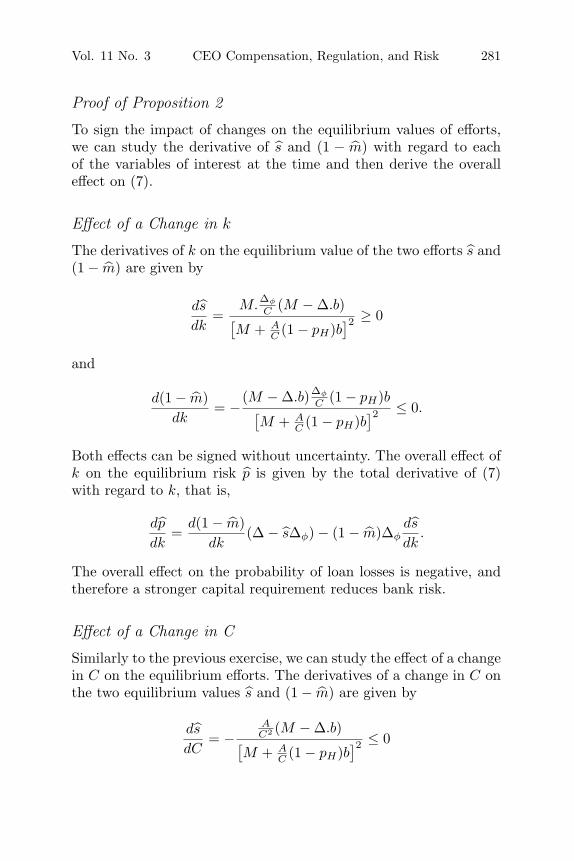
Vol. 11 No. 3 CEO Compensation, Regulation, and Risk 281
Proof of Proposition 2
To sign the impact of changes on the equilibrium values of efforts,we can study the derivative of s and (1 − m) with regard to eachof the variables of interest at the time and then derive the overalleffect on (7).
Effect of a Change in k
The derivatives of k on the equilibrium value of the two efforts s and(1 − m) are given by
ds
dk=
M.Δφ
C (M − Δ.b)[M + A
C (1 − pH)b]2 ≥ 0
and
d(1 − m)dk
= −(M − Δ.b)Δφ
C (1 − pH)b[M + A
C (1 − pH)b]2 ≤ 0.
Both effects can be signed without uncertainty. The overall effect ofk on the equilibrium risk p is given by the total derivative of (7)with regard to k, that is,
dp
dk=
d(1 − m)dk
(Δ − sΔφ) − (1 − m)Δφds
dk.
The overall effect on the probability of loan losses is negative, andtherefore a stronger capital requirement reduces bank risk.
Effect of a Change in C
Similarly to the previous exercise, we can study the effect of a changein C on the equilibrium efforts. The derivatives of a change in C onthe two equilibrium values s and (1 − m) are given by
ds
dC= −
AC2 (M − Δ.b)[
M + AC (1 − pH)b
]2 ≤ 0
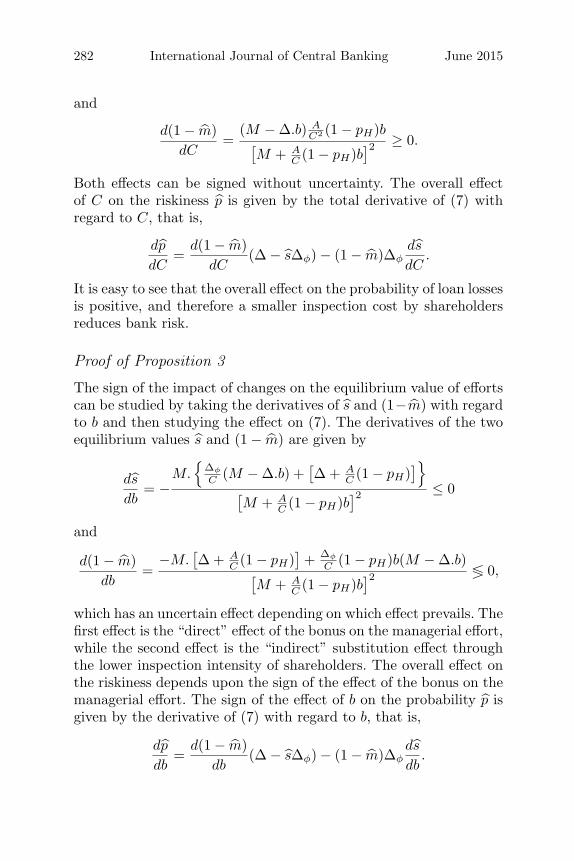
282 International Journal of Central Banking June 2015
and
d(1 − m)dC
=(M − Δ.b) A
C2 (1 − pH)b[M + A
C (1 − pH)b]2 ≥ 0.
Both effects can be signed without uncertainty. The overall effectof C on the riskiness p is given by the total derivative of (7) withregard to C, that is,
dp
dC=
d(1 − m)dC
(Δ − sΔφ) − (1 − m)Δφds
dC.
It is easy to see that the overall effect on the probability of loan lossesis positive, and therefore a smaller inspection cost by shareholdersreduces bank risk.
Proof of Proposition 3
The sign of the impact of changes on the equilibrium value of effortscan be studied by taking the derivatives of s and (1−m) with regardto b and then studying the effect on (7). The derivatives of the twoequilibrium values s and (1 − m) are given by
ds
db= −
M.{
Δφ
C (M − Δ.b) +[Δ + A
C (1 − pH)]}
[M + A
C (1 − pH)b]2 ≤ 0
and
d(1 − m)db
=−M.
[Δ + A
C (1 − pH)]+ Δφ
C (1 − pH)b(M − Δ.b)[M + A
C (1 − pH)b]2 ≶ 0,
which has an uncertain effect depending on which effect prevails. Thefirst effect is the “direct” effect of the bonus on the managerial effort,while the second effect is the “indirect” substitution effect throughthe lower inspection intensity of shareholders. The overall effect onthe riskiness depends upon the sign of the effect of the bonus on themanagerial effort. The sign of the effect of b on the probability p isgiven by the derivative of (7) with regard to b, that is,
dp
db=
d(1 − m)db
(Δ − sΔφ) − (1 − m)Δφds
db.
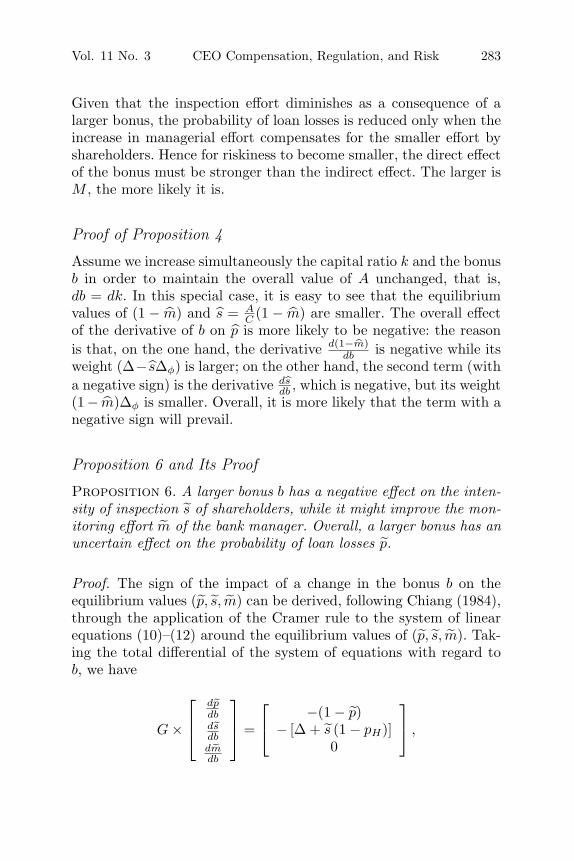
Vol. 11 No. 3 CEO Compensation, Regulation, and Risk 283
Given that the inspection effort diminishes as a consequence of alarger bonus, the probability of loan losses is reduced only when theincrease in managerial effort compensates for the smaller effort byshareholders. Hence for riskiness to become smaller, the direct effectof the bonus must be stronger than the indirect effect. The larger isM , the more likely it is.
Proof of Proposition 4
Assume we increase simultaneously the capital ratio k and the bonusb in order to maintain the overall value of A unchanged, that is,db = dk. In this special case, it is easy to see that the equilibriumvalues of (1 − m) and s = A
C (1 − m) are smaller. The overall effectof the derivative of b on p is more likely to be negative: the reasonis that, on the one hand, the derivative d(1−m)
db is negative while itsweight (Δ− sΔφ) is larger; on the other hand, the second term (witha negative sign) is the derivative ds
db , which is negative, but its weight(1 − m)Δφ is smaller. Overall, it is more likely that the term with anegative sign will prevail.
Proposition 6 and Its Proof
Proposition 6. A larger bonus b has a negative effect on the inten-sity of inspection s of shareholders, while it might improve the mon-itoring effort m of the bank manager. Overall, a larger bonus has anuncertain effect on the probability of loan losses p.
Proof. The sign of the impact of a change in the bonus b on theequilibrium values (p, s, m) can be derived, following Chiang (1984),through the application of the Cramer rule to the system of linearequations (10)–(12) around the equilibrium values of (p, s, m). Tak-ing the total differential of the system of equations with regard tob, we have
G ×
⎡⎢⎣dpdbdsdbdmdb
⎤⎥⎦ =
⎡⎣ −(1 − p)− [Δ + s (1 − pH)]
0
⎤⎦ ,

284 International Journal of Central Banking June 2015
where G is defined as
G =
⎡⎢⎣ −[(b − �) + Ω
]Ω (1−p)
s Ω (1−p)(1−m)
0 (1 − pH) b −M1 (1−m)Δφ (Δ−sΔφ)
⎤⎥⎦ .
The sign of the effect of b on the probability p is the ratio betweentwo determinants, i.e., dp
db = |G1||G| . Matrix G1 is the 3x3 matrix given
by G in which the first column is replaced by the vector on theright-hand side of the system of linear equations. The determinant|G1| is
(1 − p){
−[(1 − pH) b(Δ − sΔφ) + M(1−m)Δφ
]+
Ωs
[Δ + s (1 − pH)] [Δ − 2sΔφ]}
.
The sign of the effect is uncertain. Given that the determinant |G|,
−[(b − �)+Ω
] [(1 − pH) b(Δ−sΔφ) + M(1−m)Δφ
]− Ω(1−p)
s(1 − m)[M(1−m)+ (1 − pH) bs] ,
is negative, the overall sign of the effect depends upon |G1|. Theoverall effect is negative whenever |G1| is positive, and vice versa.The sign of the effect of b on the inspection s is the ratio between twodeterminants, i.e., ds
db = |G2||G| . Matrix G2 is the 3x3 matrix given by
G in which the second column is replaced by the vector on the right-hand side of the system of linear equations. Its determinant |G2|,[
(b − �) + Ω][Δ + s (1 − pH)] (Δ−sΔφ)
+ (1−p)
{M+
Ω(1 − m)
[Δ + s (1 − pH)]
},
is positive. Given that |G| < 0 and |G2| > 0, the overall sign ofthe effect is negative, that is, ds
db < 0. Finally, the sign of the effect
Vol. 11 No. 3 CEO Compensation, Regulation, and Risk 285
of b on the monitoring intensity m is the ratio between two deter-minants, i.e., dm
db = |G3||G| . Matrix G3 is the 3x3 matrix given by G in
which the third column is replaced by the vector on the right-handside of the system of linear equations. Its determinant |G3| is
− [Δ + s (1 − pH)]
{[(b − �) + Ω
](1 − m)Δφ + (1 − p)
Ωs
}+ (1−p) (1 − pH) b.
When the last term is not too large (small b), then |G3| < 0, andgiven that |G| < 0 the overall sign of the effect is positive, that is,dmdb > 0.
Appendix 2. Case with Unsecured Debt
Assume the bank is funded at date 0 with α% unsecured debt (unin-sured depositors) and (1 − α)% insured deposits with α ∈ [0, 1]. Wealso let the deposit insurance premium be charged on the bank fora proportion β ∈ [0, 1], where β = 0 captures the case of a premiumfunded with taxpayers’ money and β = 1 captures the risk-sensitivepremium charged directly to the bank. The balance sheet in thiscase is
E0 + αD0 + (1 − α)D0 = βπ0 + L0.
The returns of the portfolio of loans at date 2 must be dividedamong the different stakeholders of the bank in all possible states ofthe world. If the portfolio of loans returns RL0, then each insureddepositor is repaid D0, while unsecured debtholders receive D2and the bank manager is rewarded the bonus b. If the portfo-lio of loans returns (R − �) L0, then the deposit insurance repays(1 − α)D0 to insured depositors, while unsecured debtholders receivemax{0;(R − �)L0 − (1−α)D0} and the bank manager does not cashthe bonus. The fair deposit insurance premium is therefore defined as
π0 = p max {(1 − α)D0 − (R − �) L0; 0} .
The participation constraint for unsecured debtholders requires thattheir future revenue compensates their date 0 investment, i.e.,
(1 − p)D2 + p max {(R − �) L0 − (1 − α)D0; 0} = αD0. (14)
286 International Journal of Central Banking June 2015
The best reply function of bank shareholders is
∂UB
∂s= (1 − m)Δφ
[(R − b) − (1 − α)
D0
L0− D2
L0
]− Cs = 0. (15)
We have to distinguish between two cases.
CASE 1. (R − �) L0 ≤ (1 − α)D0.
In this case, the portfolio revenue is not sufficient to repay unse-cured debtholders, since insured depositors are the majority; there-fore, condition (14) becomes
D2
L0=
α
1 − p
D0
L0,
while the fair deposit insurance premium is
π0
L0= p
{(1 − α)
D0
L0− (R − �)
}.
After substituting those two expressions into the date 0 balancesheet, the best reply function (15) becomes
∂UB
∂s= (1 − m)Δφ
[(R − b) − [1 − p(1 − α)]
1 − p
[1 − k − βp (R − �)]1 − βp(1 − α)
]− Cs = 0.
When α → 0 (100 percent insured deposits), it is immediate toderive the two special sub-cases developed in the paper, that of adeposit insurance paid with taxpayers’ money (β = 0) and that ofa risk-sensitive deposit insurance premium charged directly to thebank (β = 1).
CASE 2. (R − �) L0 ≥ (1 − α)D0.
In this case, the portfolio revenue is high enough to repay some-thing to unsecured debtholders, since there are few insured deposi-tors; condition (14) becomes
D2
L0= α
D0
L0+
p
1 − p
[D0
L0− (R − �)
];
Vol. 11 No. 3 CEO Compensation, Regulation, and Risk 287
and the fair deposit insurance premium is null. After substitutingthese two values into the date 0 balance sheet, the best reply function(15) becomes
∂UB
∂s= (1 − m)Δφ
[(R − b) − [1 − k − p (R − �)]
1 − p
]− Cs = 0.
For any value of α, provided that it is large enough to fit case 2—as,for instance, α → 1 (100 percent unsecured debt)—this is equivalentto the case of a risk-sensitive deposit insurance charged at date 0directly on the bank balance sheet (i.e., β = 1).
Appendix 3. A Numerical Example
Here we provide some numerical simulations to gain insights on theo-retical propositions 3 and 4. We first fix the values of the parametersof the model as follows:
Parameter ValueR 2.5M 0.7pH 0.4pL 0.0φ 0.1
We select a grid of reasonable values for the other two parametersof interests, k and C. Finally, we plot the combinations of b and kfor which the derivative is zero, i.e.,
dp
db=
d(1 − m)db
(Δ − sΔφ) − (1 − m)Δφds
db= 0.
Then we repeat the exercise for different values of C. Figure 3 showsthe different combinations of bonus and capital ratio such that thederivative of the probability with regard to the bonus is zero. Thesenumerical results illustrate the result in proposition 2, namely thatthe overall effect of a larger bonus on the probability of loan lossesdepends upon a combination of k and C, since they affect boththe incentive of shareholders and of the bank manager. Notice that,
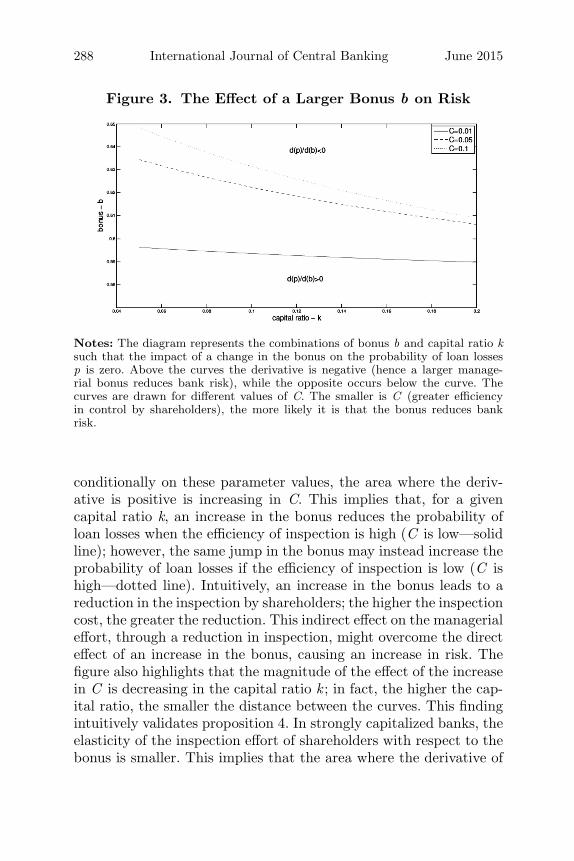
288 International Journal of Central Banking June 2015
Figure 3. The Effect of a Larger Bonus b on Risk
Notes: The diagram represents the combinations of bonus b and capital ratio ksuch that the impact of a change in the bonus on the probability of loan lossesp is zero. Above the curves the derivative is negative (hence a larger manage-rial bonus reduces bank risk), while the opposite occurs below the curve. Thecurves are drawn for different values of C. The smaller is C (greater efficiencyin control by shareholders), the more likely it is that the bonus reduces bankrisk.
conditionally on these parameter values, the area where the deriv-ative is positive is increasing in C. This implies that, for a givencapital ratio k, an increase in the bonus reduces the probability ofloan losses when the efficiency of inspection is high (C is low—solidline); however, the same jump in the bonus may instead increase theprobability of loan losses if the efficiency of inspection is low (C ishigh—dotted line). Intuitively, an increase in the bonus leads to areduction in the inspection by shareholders; the higher the inspectioncost, the greater the reduction. This indirect effect on the managerialeffort, through a reduction in inspection, might overcome the directeffect of an increase in the bonus, causing an increase in risk. Thefigure also highlights that the magnitude of the effect of the increasein C is decreasing in the capital ratio k ; in fact, the higher the cap-ital ratio, the smaller the distance between the curves. This findingintuitively validates proposition 4. In strongly capitalized banks, theelasticity of the inspection effort of shareholders with respect to thebonus is smaller. This implies that the area where the derivative of
Vol. 11 No. 3 CEO Compensation, Regulation, and Risk 289
the probability of loan losses with respect to the bonus is positiveshrinks for higher values of k ; the higher the value of C, the greaterthe reduction.
Appendix 4. Definition of Key Variables
Balance Sheet (Source: Bankscope)
• Total Assets: Total earning assets plus cash and due frombanks plus foreclosed real estate plus fixed assets plus good-will plus other intangibles plus current tax assets plus deferredtax plus discontinued operations plus other assets in 2006.
• Total Liabilities: Total interest-bearing liabilities plus fair-value portion of debt plus credit impairment reserves plusreserves for pension and other plus tax liabilities plus otherdeferred liabilities plus discontinued operations plus insuranceplus other non-interest-bearing liabilities in 2006.
• Market Capitalization: Total number of shares at the end of2006 multiplied by the price of shares at the end of 2006.
• Equity Book-to-Market Ratio: Total equity (common equityplus non-controlling interest plus securities revaluationreserves plus foreign exchange revaluation reserves plus otherrevaluation reserves in 2006) over market capitalization.
• Deposit Ratio: Total customer deposits (current plus savingsplus term deposits) over total deposits, money-market, andshort-term funding.
• Tier 1 Capital Ratio: A regulatory measure of capital ade-quacy, that is, the shareholder funds plus perpetual non-cumulative preference shares as a percentage of risk-weightedassets and off-balance-sheet risks measured under the Baselrules.
• Total Regulatory Capital Ratio: Total capital adequacy ratiounder the Basel rules. It measures tier 1 plus tier 2 capital,which includes subordinated debt, hybrid capital, loan lossreserves, and the valuation reserves as a percentage of risk-weighted assets and off-balance-sheet risks.
• ROA: Return on average asset (before tax).
290 International Journal of Central Banking June 2015
• Market Return from Stock Prices 2005–6: Share price at theend of 2006 plus dividend per share in 2006 minus the priceat the end of 2005, all over the price of shares at the end of2005.
• C3: The sum of the shares of the largest three shareholders.
Compensation (Source: Capital IQ – People Intelligence)
• Total Compensation: Salary plus cash bonus plus equity bonuspaid in 2006.
• Salary: Amount paid as fixed salary in 2006.• Cash Bonus: Amount paid in cash as bonus in 2006.• Equity Bonus: The value of bonus not paid in cash in 2006;
it sums up restricted stock awards, stock grant awards, andoption awards (the value of options).
• Total Bonus over Salary: Total bonus (cash bonus plus equitybonus) over salary.
• Value of Shares: Number of shares (unrestricted andrestricted) held by the CEO multiplied by the price of shareat the end of 2006.
• Value of Stock Options: The value of options calculated usingthe Black and Scholes formula; the exercise price and theshare price at the end of the year and the expiration yearis provided by Capital IQ. The risk-free interest rate is theten-year maturity interest rate on U.S. bonds (source: FederalReserve). The total number of options is given by the sum ofexercisable options, unexercisable options, and unearned andunexercised options (that have been excluded from the sum oftotal options).
• Value of Total Equity Portfolio: Value of shares plus value ofstock options.
• Ownership from Shares (% over Total): The ratio betweenthe number of shares held by the CEO (source: Capital IQ)and the total number of shares of the company (source: Data-stream) multiplied by 100.
• Ownership from Shares and Options (% over Total): Owner-ship from shares plus the delta-weighted options (see below)divided by the total number of shares outstanding.
Vol. 11 No. 3 CEO Compensation, Regulation, and Risk 291
• Delta-Weighted Options: The sum of each option held by theCEO at the end of 2006 multiplied by the delta of the respec-tive option (sensitivity of CEO’s option portfolio value toshare price calculated using the formula by Core and Guay2002).
• Percentage Equity Risk (Vega of Options): Sensitivity of theCEO’s option portfolio value to stock-return volatility. It is theweighted sum of the vegas of each option held by the CEO atthe end of 2006; the weights are determined by the number ofeach option award divided by the total number of options. Itis multiplied by 100.
Stock Returns (Source: Datastream)
• Buy-and-Hold Return 2007–8 (BHR): Buy-and-hold return onstock weekly returns over the period 2007:Q3–2008:Q4.
• Risk Return 2007–8 (SD): Standard deviation of weeklyreturns over the period 2007:Q3–2008:Q4.
Regulation (Source: Bank Regulation and Supervision Survey,Third Wave)
• Private Monitoring: An index of monitoring on the part of theprivate sector.
• Official: An index of the power of the commercial bank super-visory agency, including elements such as the rights of thesupervisor to meet with and demand information from audi-tors, to force a bank to change the internal organizationalstructure, to supersede the rights of shareholders, and to inter-vene in a bank.
• Deposit Insurance: Dummy variable equal to 1 if the countryhas an explicit deposit insurance.
• Restrict: An index of regulatory restrictions on the activitiesof banks, consisting, for example, of limitations on the abilityof banks to engage in securities market activities, insuranceactivities, and real estate activities, and to own non-financialfirms.
• Minimum Capital Requirement: This answers the survey ques-tion, What is the minimum capital-to-asset ratio requirement?
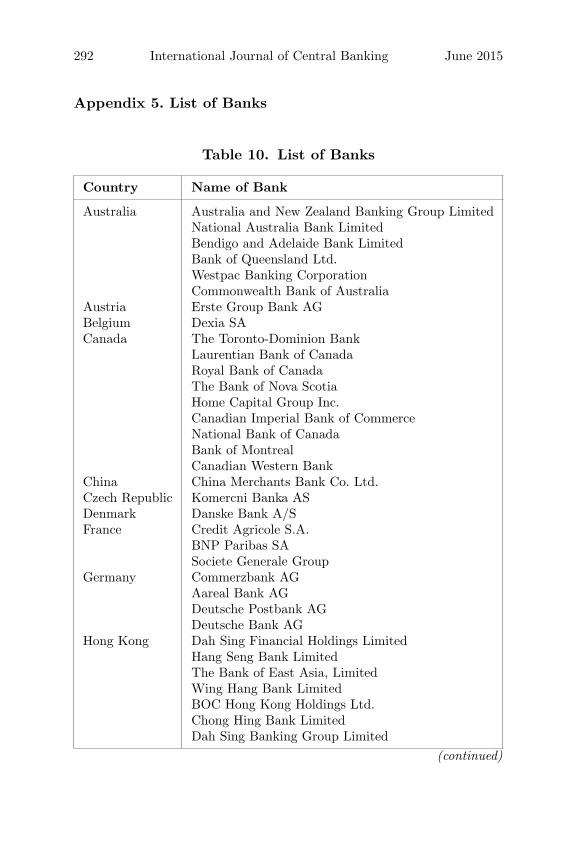
292 International Journal of Central Banking June 2015
Appendix 5. List of Banks
Table 10. List of Banks
Country Name of Bank
Australia Australia and New Zealand Banking Group LimitedNational Australia Bank LimitedBendigo and Adelaide Bank LimitedBank of Queensland Ltd.Westpac Banking CorporationCommonwealth Bank of Australia
Austria Erste Group Bank AGBelgium Dexia SACanada The Toronto-Dominion Bank
Laurentian Bank of CanadaRoyal Bank of CanadaThe Bank of Nova ScotiaHome Capital Group Inc.Canadian Imperial Bank of CommerceNational Bank of CanadaBank of MontrealCanadian Western Bank
China China Merchants Bank Co. Ltd.Czech Republic Komercni Banka ASDenmark Danske Bank A/SFrance Credit Agricole S.A.
BNP Paribas SASociete Generale Group
Germany Commerzbank AGAareal Bank AGDeutsche Postbank AGDeutsche Bank AG
Hong Kong Dah Sing Financial Holdings LimitedHang Seng Bank LimitedThe Bank of East Asia, LimitedWing Hang Bank LimitedBOC Hong Kong Holdings Ltd.Chong Hing Bank LimitedDah Sing Banking Group Limited
(continued)
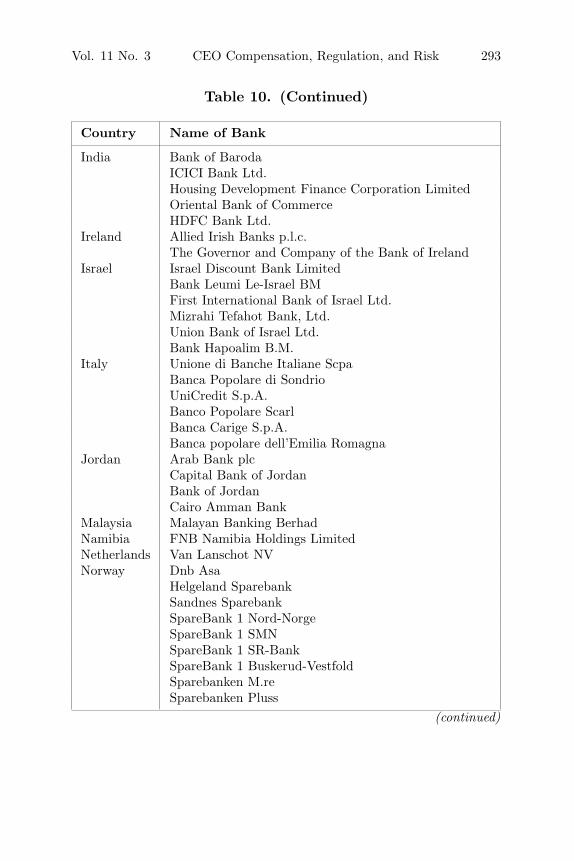
Vol. 11 No. 3 CEO Compensation, Regulation, and Risk 293
Table 10. (Continued)
Country Name of Bank
India Bank of BarodaICICI Bank Ltd.Housing Development Finance Corporation LimitedOriental Bank of CommerceHDFC Bank Ltd.
Ireland Allied Irish Banks p.l.c.The Governor and Company of the Bank of Ireland
Israel Israel Discount Bank LimitedBank Leumi Le-Israel BMFirst International Bank of Israel Ltd.Mizrahi Tefahot Bank, Ltd.Union Bank of Israel Ltd.Bank Hapoalim B.M.
Italy Unione di Banche Italiane ScpaBanca Popolare di SondrioUniCredit S.p.A.Banco Popolare ScarlBanca Carige S.p.A.Banca popolare dell’Emilia Romagna
Jordan Arab Bank plcCapital Bank of JordanBank of JordanCairo Amman Bank
Malaysia Malayan Banking BerhadNamibia FNB Namibia Holdings LimitedNetherlands Van Lanschot NVNorway Dnb Asa
Helgeland SparebankSandnes SparebankSpareBank 1 Nord-NorgeSpareBank 1 SMNSpareBank 1 SR-BankSpareBank 1 Buskerud-VestfoldSparebanken M.reSparebanken Pluss
(continued)
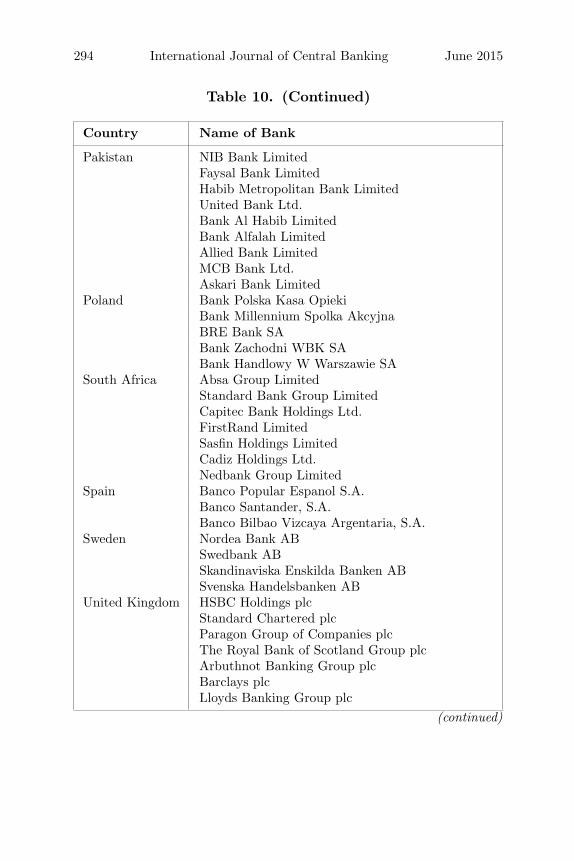
294 International Journal of Central Banking June 2015
Table 10. (Continued)
Country Name of Bank
Pakistan NIB Bank LimitedFaysal Bank LimitedHabib Metropolitan Bank LimitedUnited Bank Ltd.Bank Al Habib LimitedBank Alfalah LimitedAllied Bank LimitedMCB Bank Ltd.Askari Bank Limited
Poland Bank Polska Kasa OpiekiBank Millennium Spolka AkcyjnaBRE Bank SABank Zachodni WBK SABank Handlowy W Warszawie SA
South Africa Absa Group LimitedStandard Bank Group LimitedCapitec Bank Holdings Ltd.FirstRand LimitedSasfin Holdings LimitedCadiz Holdings Ltd.Nedbank Group Limited
Spain Banco Popular Espanol S.A.Banco Santander, S.A.Banco Bilbao Vizcaya Argentaria, S.A.
Sweden Nordea Bank ABSwedbank ABSkandinaviska Enskilda Banken ABSvenska Handelsbanken AB
United Kingdom HSBC Holdings plcStandard Chartered plcParagon Group of Companies plcThe Royal Bank of Scotland Group plcArbuthnot Banking Group plcBarclays plcLloyds Banking Group plc
(continued)
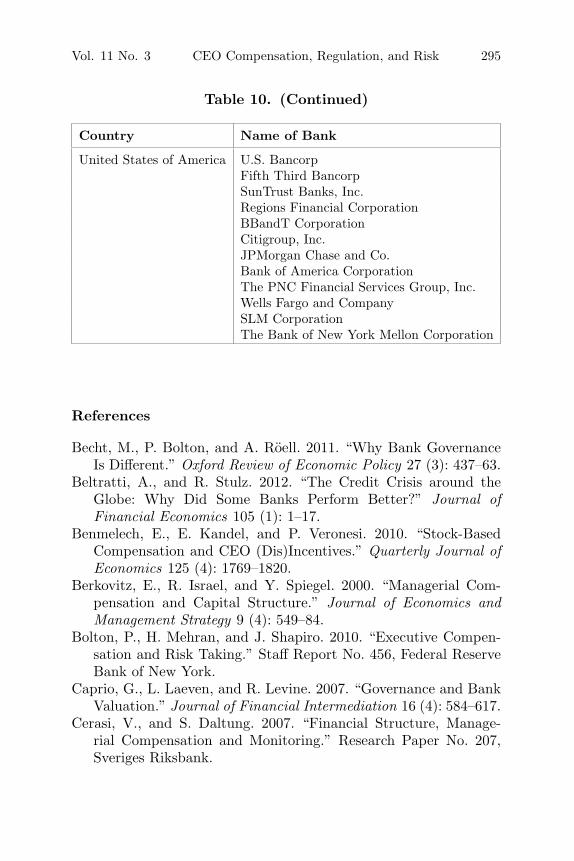
Vol. 11 No. 3 CEO Compensation, Regulation, and Risk 295
Table 10. (Continued)
Country Name of Bank
United States of America U.S. BancorpFifth Third BancorpSunTrust Banks, Inc.Regions Financial CorporationBBandT CorporationCitigroup, Inc.JPMorgan Chase and Co.Bank of America CorporationThe PNC Financial Services Group, Inc.Wells Fargo and CompanySLM CorporationThe Bank of New York Mellon Corporation
References
Becht, M., P. Bolton, and A. Roell. 2011. “Why Bank GovernanceIs Different.” Oxford Review of Economic Policy 27 (3): 437–63.
Beltratti, A., and R. Stulz. 2012. “The Credit Crisis around theGlobe: Why Did Some Banks Perform Better?” Journal ofFinancial Economics 105 (1): 1–17.
Benmelech, E., E. Kandel, and P. Veronesi. 2010. “Stock-BasedCompensation and CEO (Dis)Incentives.” Quarterly Journal ofEconomics 125 (4): 1769–1820.
Berkovitz, E., R. Israel, and Y. Spiegel. 2000. “Managerial Com-pensation and Capital Structure.” Journal of Economics andManagement Strategy 9 (4): 549–84.
Bolton, P., H. Mehran, and J. Shapiro. 2010. “Executive Compen-sation and Risk Taking.” Staff Report No. 456, Federal ReserveBank of New York.
Caprio, G., L. Laeven, and R. Levine. 2007. “Governance and BankValuation.” Journal of Financial Intermediation 16 (4): 584–617.
Cerasi, V., and S. Daltung. 2007. “Financial Structure, Manage-rial Compensation and Monitoring.” Research Paper No. 207,Sveriges Riksbank.
296 International Journal of Central Banking June 2015
Cerasi, V., and J. C. Rochet. 2014. “Rethinking the RegulatoryTreatment of Securitization.” Journal of Financial Stability 10(1): 20–31.
Cheng, H., H. Hong, and J. Scheinkman. 2010. “Yesterday’s Heroes:Compensation and Creative Risk Taking.” NBER Working PaperNo. 16176.
Chesney, M., J. Stromberg, and A. F. Wagner. 2010. “Risk-TakingIncentives, Governance, and Losses in the Financial Crisis.”Research Paper No. 10-18, Swiss Finance Institute.
Chiang, A. C. 1984. Fundamental Methods of Mathematical Econom-ics. London: McGraw-Hill International.
Coles, J., D. Naveen, and L. Naveen. 2006. “Managerial Incentivesand Risk-Taking.” Journal of Financial Economics 79 (2): 431–68.
Core, J., and W. Guay. 2002. “Estimating the Value of EmployeeStock Options Portfolios and Their Sensitivities to Price andVolatility.” Journal of Accounting Research 40 (3): 613–30.
Cziraki, P. 2014. “Trading by Bank Insiders Before and During the2007–2008 Financial Crisis.” Unpublished Manuscript. Availableat SSRN.
Demirguc-Kunt, A., E. Detragiache, and O. Merrouche. 2013. “BankCapital: Lessons from the Financial Crisis.” Journal of Money,Credit and Banking 45 (6): 1147–64.
Demirguc-Kunt, A., B. Karacaovali, and L. Laeven. 2005. “DepositInsurance around the World: A Comprehensive Database.” Pol-icy Research Working Paper No. 3628, World Bank.
Dewatripont, M., and J. Tirole. 1999. The Prudential Regulation ofBanks. Cambridge, MA: MIT Press.
Diamond, D., and R. Rajan. 2009. “The Credit Crisis: Conjec-tures about Causes and Remedies.” American Economic Review:Papers and Proceedings 99 (2): 606–10.
Ellul, A., and V. Yerramilli. 2013. “Stronger Risk Controls, LowerRisk: Evidence from U.S. Bank Holding Companies.” Journal ofFinance 68 (5): 1757–1803.
Fahlenbrach, R., and R. Stulz. 2011. “Bank CEO Incentives and theCredit Crisis.” Journal of Financial Economics 99 (1): 11–26.
Giannetti, M., and D. Metzger. 2013. “Compensation and Compe-tition for Talent: Talent Scarcity or Incentives?” UnpublishedManuscript. Available at SSRN.
Vol. 11 No. 3 CEO Compensation, Regulation, and Risk 297
Gropp, R., and M. Kohler. 2010. “Bank Owners or Bank Managers:Who Is Keen on Risk? Evidence from the Financial Crisis.” Dis-cussion Paper No. 10-013, ZEW Centre for European EconomicResearch.
Guay, W. R. 1999. “The Sensitivity of CEO Wealth to Equity Risk:An Analysis of the Magnitude and Determinants.” Journal ofFinancial Economics 53 (1): 43–71.
Guo, L., A. Jalal, and S. Khaksari. 2014. “Bank Executive Compen-sation Structure, Risk Taking and the Financial Crisis.” Forth-coming in Review of Quantitative Finance and Accounting.
Hughes, J. P., and L. Mester. 2013. “Who Said Large Banks Don’tExperience Scale Economies? Evidence from a Risk-Return-Driven Cost Function.” Journal of Financial Intermediation 22(4): 559–85.
Jensen, M., and W. H. Meckling. 1976. “Theory of the Firm: Man-agerial Behavior, Agency Costs and Ownership Structure.” Jour-nal of Financial Economics 3 (4): 305–60.
John, K., H. Mehran, and Y. Quian. 2010. “Outside Monitoringand CEO Compensation in the Banking Industry.” Journal ofCorporate Finance 16 (4): 383–99.
John, K., A. Saunders, and L. W. Senbet. 2000. “A Theory of BankRegulation and Management Compensation.” Review of Finan-cial Studies 13 (1): 95–125.
John, T. A., and K. John. 1993. “Top-Management Compensationand Capital Structure.” Journal of Finance 48 (3): 949–74.
Kolm, J., C. Laux, and G. Loranth. 2014. “Regulating Bank CEOCompensation and Active Boards.” Unpublished Manuscript.
Laeven, L., and R. Levine. 2009. “Bank Governance, Regulation andRisk Taking.” Journal of Financial Economics 93 (2): 259–75.
Mehran, H., A. Morrison, and J. Shapiro. 2011. “Corporate Gov-ernance and Banks: What Have We Learned from the FinancialCrisis?” Staff Report No. 502, Federal Reserve Bank of New York.
Shleifer, A., and R. Vishny. 1986. “Large Shareholders and Corpo-rate Control.” Journal of Political Economy 94 (3): 461–88.
Suntheim, F. 2010. “Managerial Compensation in the Financial Ser-vice Industry.” Unpublished Manuscript. Available at SSRN.