Embed Size (px)
Citation preview
CEO Involvement in theSelection of New Board Members:
An Empirical Analysis
ANIL SHIVDASANI and DAVID YERMACK*
ABSTRACT
We study whether CEO involvement in the selection of new directors inf luencesthe nature of appointments to the board. When the CEO serves on the nominatingcommittee or no nominating committee exists, firms appoint fewer independentoutside directors and more gray outsiders with conf licts of interest. Stock pricereactions to independent director appointments are significantly lower when theCEO is involved in director selection. Our evidence may illuminate a mechanismused by CEOs to reduce pressure from active monitoring, and we find a recenttrend of companies removing CEOs from involvement in director selection.
A BOARD OF DIRECTORS SERVES AS THE PIVOTAL mechanism for monitoring themanagers of a public corporation. Directors are voted into office by stock-holders and have a fiduciary responsibility to protect stockholders’ interests.Along with their legal duties of reviewing the corporation’s major plans andactions, directors are charged with selecting, compensating, evaluating, and,when appropriate, dismissing top managers.
A long-standing criticism of this process is that, in practice, directors arenot selected by stockholders but rather by the very managers they are sup-posed to oversee. Mace ~1971! discusses anecdotal evidence of CEOs exercis-ing authority in selecting candidates for the board, in effect hand-pickingnominees. Similarly, Lorsch and MacIver ~1989! report survey evidence in-dicating that CEOs wield major inf luence in selecting new board members.Tejada ~1997! presents a recent news account of an outside director of aprominent company being denied nomination for reelection after criticizingmanagement. Such allegations have led to proposals that boards choose di-rectors through nominating committees composed only of independent mem-bers of the board ~see, e.g., The Working Group on Corporate Governance~1991!!.
* Shivdasani is at the Kenan-Flagler Business School, University of North Carolina, ChapelHill, and Yermack is at the Stern School of Business, New York University. We appreciatehelpful comments from David Denis, Scott Harrington, Greg Niehaus, Tod Perry, Henri Ser-vaes, Clifford Smith, René Stulz, Sunil Wahal, Marc Zenner, an anonymous referee, and sem-inar participants at the University of North Carolina, the University of South Carolina, theUniversity of Oregon, Virginia Polytechnic Institute, and the American Finance Associationannual meeting, 1999. We thank Urs Peyer for capable research assistance. An earlier versionof this paper was titled “The Hand-Picked Board.”
THE JOURNAL OF FINANCE • VOL. LIV, NO. 5 • OCTOBER 1999
1829

Despite such views, prior research has not developed systematic evidenceon the extent to which CEOs are directly involved in selecting new directorsand whether such involvement affects the nature of directors elected to theboard. In this paper, we provide evidence on whether CEOs exert inf luenceon the selection of new directors and we test the hypothesis that when CEOsare involved in this process, directors predisposed to monitor the CEO areless likely to be appointed. We use a simple procedure to indicate CEO in-volvement in selecting new directors, defining a CEO as “involved” ~i! if theboard has a separate nominating committee and the CEO serves as a mem-ber or ~ii! if such a committee does not exist and directors are selected by theentire board including the CEO.
We examine the likelihood that appointees are independent outsiders, “gray”outsiders who have conf licts of interest, or corporate insiders. Based on re-sults from numerous recent studies, we expect independent outside directorsto be most predisposed to monitoring the CEO. Consistent with the hypoth-esis that nominees less likely to monitor are chosen when CEOs are involvedin the selection, we find that when the CEO is involved, firms appoint fewerindependent outside directors and more gray outsiders.
We study investor reactions to announcements of director appointments.We find that the market reaction to independent director appointments issignificantly negative when the CEO is involved in director selection, andwe find weak evidence of a positive reaction when CEOs are not involved.Cumulative abnormal stock returns for independent director appointmentsare significantly lower when the CEO is involved in director selection. Thesepatterns persist when we examine abnormal returns in a two-stage frame-work that accounts for the prior anticipation of such appointments.
Our research extends a growing empirical literature examining patternsof director appointments. Hermalin and Weisbach ~1988! study companies’decisions to appoint inside and outside directors and find that inside ap-pointments occur with greater frequency when CEOs approach expected re-tirement age and that outside appointments are more likely following poorfirm performance. Gilson ~1990! finds more appointments of bankers andmajor outside stockholders when firms experience financial distress. Simi-larly, Kaplan and Minton ~1994! study Japanese companies and find a greaterintensity of outside appointments when those firms perform poorly. Rosen-stein and Wyatt ~1990! find that stockholder reactions to announcements ofindependent director appointments are significantly positive. These studiesprovide some evidence of the factors that inf luence appointments of inde-pendent directors, but the role of the CEO in this process remains un-explored.
In addition to this empirical research, Hermalin and Weisbach ~1998! presenta model of the balance of power between the CEO and other directors. Theymodel the control of the firm as a bargaining game in which the CEO ne-gotiates with the board over the board’s degree of independence, among othervariables. The authors argue that such a framework can help explain cer-tain observed regularities about the composition and monitoring capabilities
1830 The Journal of Finance
of many boards. Our paper seeks to assess empirically their underlying as-sumptions that CEOs seek to acquire inf luence over the selection of newdirectors, and that directors chosen under these conditions contribute to de-terioration in the board’s monitoring of the CEO. Our results are consistentwith such a characterization of how board composition is determined.
Finally, we examine whether CEO involvement in the director selectionprocess is a persistent phenomenon over our sample period. We document anoverall trend away from CEO involvement in director selection in recent years.
The paper proceeds as follows. Section I describes our sample selectionand variable definitions. Section II analyses patterns of director appoint-ments, and Section III studies market reactions to appointments. Section IVdescribes other attributes of independent director appointees. Section V dis-cusses recent patterns in changes in CEO involvement status. Section VIconcludes.
I. Data Description and Sample Selection
We study director appointments during the three-year 1994 to 1996 periodby companies in the 1995 Fortune 500. We exclude private firms as well asfinancial and utility companies because firms in these industries typicallyhave very large boards that tend to be drawn from specific constituencies,especially major customers and local business leaders.1 We track appoint-ments over three years because many companies have classified boards onwhich directors serve staggered three-year terms, and we want to ensurethat during our sample period every board member’s candidacy is reviewedat least once. We read proxy statements filed by each firm in 1994, 1995,and 1996 in order to identify director appointments, a process that yields asample of 1,012 first-time appointments or nominations at 341 companiesduring 1,015 company-years ~a few firms contribute fewer than three yearsof data due to acquisitions in 1996 or initial public offerings in 1994!.
For each appointment, we classify the new director into one of the threecategories widely used in prior studies of boards. Inside directors ~246 ap-pointments, or 24 percent of our sample! are current employees of the firm.Outside directors fall into two categories. Gray outsiders ~107 appointments,11 percent! include retired employees, relatives of the CEO, and personswith disclosed conf licts of interest such as outside business dealings withthe company or interlocking director relationships with the CEO. Indepen-dent outsiders ~659 appointments, 65 percent! include all other nonemployeedirector appointees. We gather data about each new director’s age, occupa-tion, other directorships, stock ownership, any family relationships or inter-locked directorships with the CEO, and whether the appointment representsa board expansion or the replacement of an inside, gray, or independentretiring director. When two or more replacement appointments occur in a
1 We drop one other firm ~Nordstrom! because of a unique governance structure that in-cludes four co-CEOs, none of whom is a member of the board.
Involvement in the Selection of New Board Members 1831
single year, we assume that each new director takes the seat of the exitingdirector who has the same or, alternatively, the most similar classification inthe inside0gray0outside taxonomy.
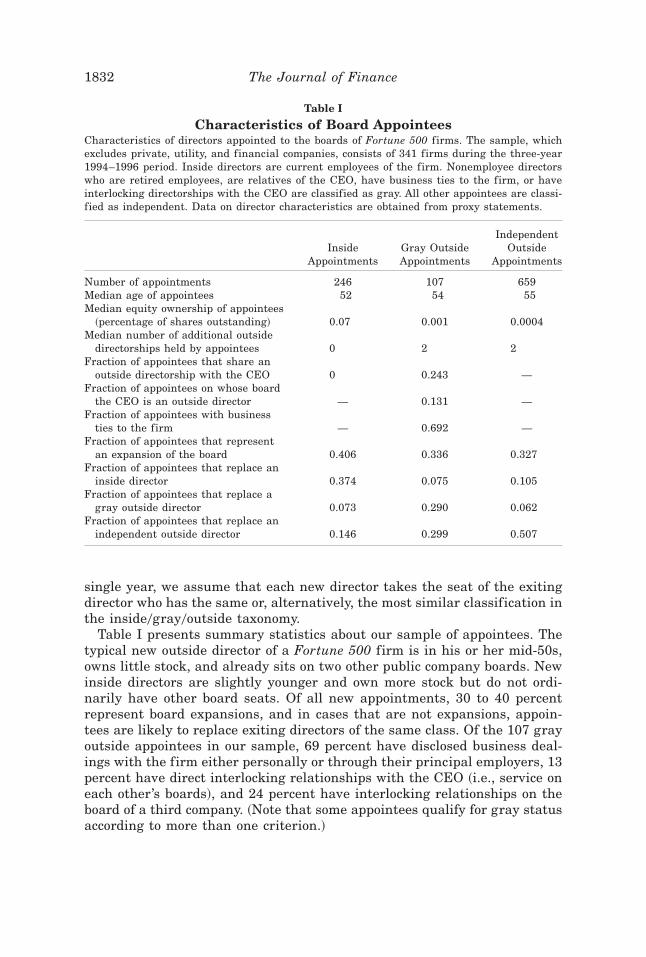
Table I presents summary statistics about our sample of appointees. Thetypical new outside director of a Fortune 500 firm is in his or her mid-50s,owns little stock, and already sits on two other public company boards. Newinside directors are slightly younger and own more stock but do not ordi-narily have other board seats. Of all new appointments, 30 to 40 percentrepresent board expansions, and in cases that are not expansions, appoin-tees are likely to replace exiting directors of the same class. Of the 107 grayoutside appointees in our sample, 69 percent have disclosed business deal-ings with the firm either personally or through their principal employers, 13percent have direct interlocking relationships with the CEO ~i.e., service oneach other’s boards!, and 24 percent have interlocking relationships on theboard of a third company. ~Note that some appointees qualify for gray statusaccording to more than one criterion.!
Table I
Characteristics of Board AppointeesCharacteristics of directors appointed to the boards of Fortune 500 firms. The sample, whichexcludes private, utility, and financial companies, consists of 341 firms during the three-year1994–1996 period. Inside directors are current employees of the firm. Nonemployee directorswho are retired employees, are relatives of the CEO, have business ties to the firm, or haveinterlocking directorships with the CEO are classified as gray. All other appointees are classi-fied as independent. Data on director characteristics are obtained from proxy statements.
InsideAppointments
Gray OutsideAppointments
IndependentOutside
Appointments
Number of appointments 246 107 659Median age of appointees 52 54 55Median equity ownership of appointees
~percentage of shares outstanding! 0.07 0.001 0.0004Median number of additional outside
directorships held by appointees 0 2 2Fraction of appointees that share an
outside directorship with the CEO 0 0.243 —Fraction of appointees on whose board
the CEO is an outside director — 0.131 —Fraction of appointees with business
ties to the firm — 0.692 —Fraction of appointees that represent
an expansion of the board 0.406 0.336 0.327Fraction of appointees that replace an
inside director 0.374 0.075 0.105Fraction of appointees that replace a
gray outside director 0.073 0.290 0.062Fraction of appointees that replace an
independent outside director 0.146 0.299 0.507
1832 The Journal of Finance
We merge our data for director appointments with a range of controlvariables gathered from proxy statements and Standard and Poor’sCOMPUSTAT. Certain variables describing the board of directors, includingboard size, the fraction of outside directors, board stock ownership, the frac-tion of outside directors appointed during the tenure of the current CEO,and the number of directorships held by all outside directors, are cumulatedfrom director-by-director data transcribed from proxy statements. Becauseof the effort required to compile this information for approximately 4,000individual directors, we collect these variables for each company in 1994 andrepeat the variable values for appointments in 1995 and 1996. Variablesrelating directly to each company’s CEO, including whether the CEO alsoserves as chairman of the board, the presence of a nominating committee,the CEO’s membership on the nominating committee, the CEO’s tenure inoffice, and the CEO’s stock ownership, are gathered every year.
Table II presents mean and median values for important characteristics ofour companies, their boards, and their CEOs. The typical board has approx-imately 11 directors, 46 percent of whom are independent outsiders and anadditional 26 percent of whom belong to the gray outsider category. Severalpotential explanations exist for why the percentage of independent directorsin the appointments sample is higher than the cross-sectional percentage ofindependent directors in our companies as of 1994. The difference could re-f lect more frequent turnover among independent directors or a recent ten-dency of boards to appoint more independent and fewer gray directors thanin the past. Alternatively, some independent outside directors may acquireconf licts of interest over time and move to gray status.
Among both groups of outside directors, stock ownership is quite small,and slightly less than half of all outside directors joined their boards duringthe tenure of the current CEO. More than three-fourths of the boards havenominating committees or similar groups charged with the selection of newdirectors. When a nominating committee exists, it includes the CEO aboutone-third of the time. Among other variables that might indicate strongCEO inf luence in corporate governance, Table II shows that CEOs own amean of 2.7 percent of their firms’ stock, though the median is much smaller,at 0.4 percent. In a large majority of firms, representing 84 percent of thesample, the CEO also serves as chairman of the board. Of the CEOs in ourFortune 500 sample, 18 percent either founded the company or belong to thefounding family. The table further shows that CEOs have an average tenureof more than eight years. We define an indicator variable for independentboards and set it equal to one if independent outside directors comprise themajority of the board. Table II shows that 40 percent of our sample firmshave independent boards according to this definition.
To identify whether the CEO has inf luence in the selection of new direc-tors, we create an indicator variable labeled “CEO involvement.” CEO in-volvement equals one in two situations: ~i! if the board has a nominatingcommittee and the committee includes the CEO, which occurs for 25 percentof our companies, or ~ii! if the board does not have a nominating committee
Involvement in the Selection of New Board Members 1833

~22 percent of our firms!, in which case the entire board including the CEOnominates new directors. Thus, we consider the CEO to be uninvolved if theboard has a nominating committee that excludes the CEO, which is the casefor 53 percent of the companies in our sample.
Table II
Summary Statistics for Firm Characteristicsand Board Composition
The sample consists of 341 publicly traded Fortune 500 firms, excluding those in the financialand utility industries, as of 1994. Inside directors are current employees of the firm. Nonem-ployee directors who are retired employees, are relatives of the CEO, have business ties to thefirm, or have interlocking directorships with the CEO are classified as gray. All other appoin-tees are classified as independent. Boards are classified as independent if independent direc-tors constitute a majority on the board. Data on ownership structure and board composition areobtained from proxy statements, and financial data are from COMPUSTAT. ROA is computedas the ratio of earnings before interest and taxes to total assets net of the median for all firmsin the same two-digit SIC code.
Variable Mean MedianStandardDeviation
Total assets ~$ million! 8,884.43 3,599.60 20,223.39Sales ~$ million! 8,830.57 4,332.35 13,959.85EBIT0total assets 0.170 0.156 0.123CEO tenure ~years! 8.22 6.00 8.12CEO ownership ~percentage of shares
outstanding! 2.70 0.40 7.57Firms with non-CEO chairman of the board 0.164 — —CEOs who belong to firm’s founding family 0.184 — —Outside directors appointed during current
CEO’s tenure 0.472 0.429 0.337Boards of directors that have a nominating
committee 0.775 — —Nominating committees with CEO as member 0.325 — —Board size 11.43 11.00 3.03Firms with an independent board 0.40 — —Fraction of the board that are gray outside
directors 0.258 0.250 0.158Fraction of the board that are independent
outside directors 0.456 0.462 0.190Ownership by gray outside directors
~percentage of shares! 1.03 0.01 7.12Ownership by independent outside directors
~percentage of shares! 0.01 0.0003 3.98Boards with a 5 percent blockholder who is
an independent outside director 0.047 — —Additional directorships held by gray outside
directors 2.14 2.00 1.829Additional directorships held by independent
outside directors 1.81 1.75 1.06
1834 The Journal of Finance

We suspect our variable indicating CEO involvement in director selectionis underinclusive, because many board nominating committees may solicitadvice from or simply ratify choices suggested by a CEO who is not a com-mittee member. Along these lines, the General Motors Board Guidelines onSignificant Corporate Governance Issues ~1994!, widely praised by share-holder activists, recommends that new directors be chosen by a committee ofoutside directors but “with the direct input from . . . the chief executive of-ficer.” If the CEO involvement variable is a conservative measure of theCEO’s role, our analysis may understate the inf luence of CEOs on the char-acteristics of new board members.
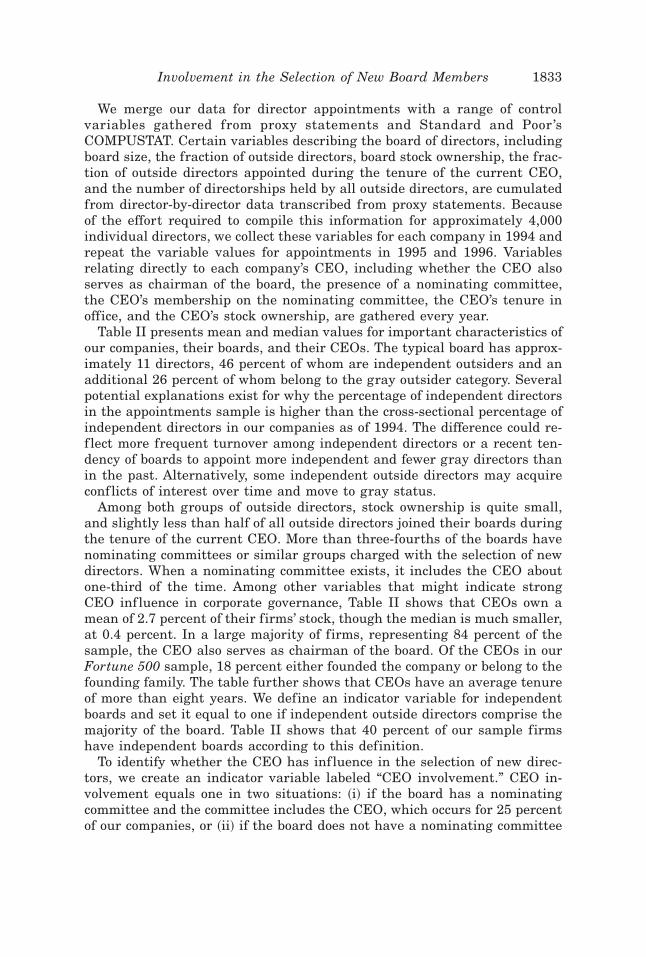
Table III presents a correlation matrix showing how CEO involvement isrelated to other important characteristics of the CEO, the board, and thecompany. The table highlights the importance of controlling for other vari-ables when analyzing the association between CEO involvement and char-acteristics of new directors. A CEO is more likely to be involved in directorappointments if he has several common indicators of power, including longtenure in office, high stock ownership, or membership in the company’s found-ing family, though this pattern fails to hold for the variable indicating thepresence of a non-CEO chairman of the board. Small boards, boards withouta majority of independent outside directors, and boards where no indepen-dent director is a major stockholder also have greater CEO involvement indirector selection. When company size is large, the CEO is also less likely tobe involved in nominating directors.
II. Board Composition and Director Status
We investigate whether CEO involvement affects the likelihood that newdirectors have independent outsider status. Numerous recent studies sug-gest that boards composed of a large fraction of independent outsiders mon-itor managers more effectively. Weisbach ~1988! shows outside-dominatedboards are more likely to remove poorly performing CEOs; Byrd and Hick-man ~1992! find higher bidder returns from tender offers when the boardhas a majority of independent directors; Brickley, Coles, and Terry ~1994!find more favorable announcement returns to poison pill adoptions; and Cot-ter, Shivdasani, and Zenner ~1997! find that acquisition targets realize largershareholder returns when they have independent boards. Although evidenceof the effect of independent directors on firm performance has been harderto detect ~see, e.g., Hermalin and Weisbach ~1991!, and Bhagat and Black~1996!!, Brickley and James ~1987! in a study of banking firms and Mayers,Shivdasani, and Smith ~1997! in a study of insurance firms document man-agerial perquisite consumption to be inversely related to the fraction of out-side directors on the board.
We consider directors to be independent if they are neither insiders ~corpo-rate officers! nor gray outsiders ~those who are retired insiders, relatives ofthe CEO, interlocked with the CEO on another board, or have other disclosedconflicts of interest!. We study both the cross-sectional association between CEO
Involvement in the Selection of New Board Members 1835
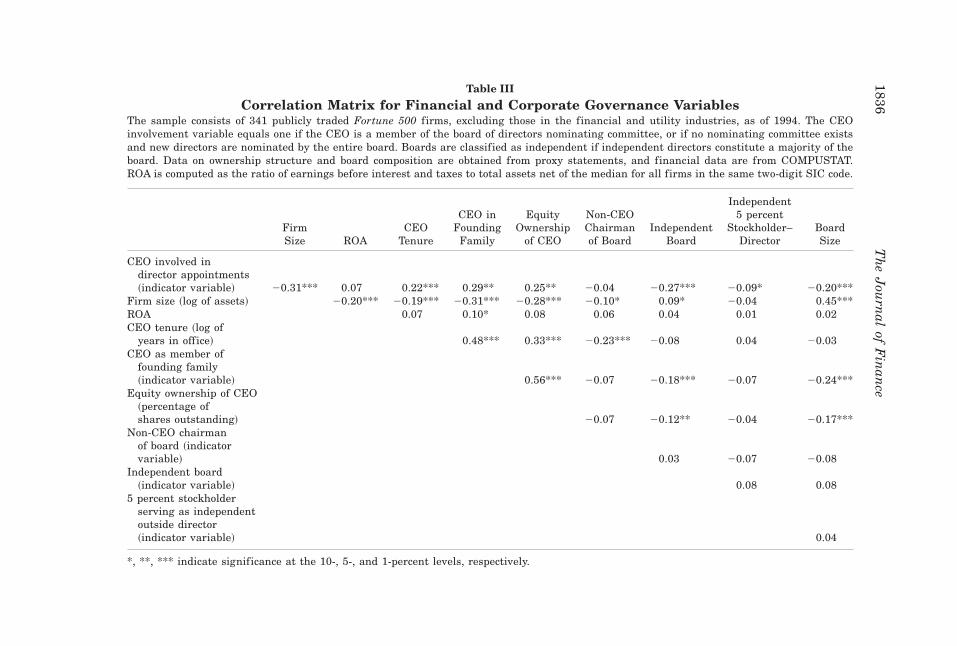
Table III
Correlation Matrix for Financial and Corporate Governance VariablesThe sample consists of 341 publicly traded Fortune 500 firms, excluding those in the financial and utility industries, as of 1994. The CEOinvolvement variable equals one if the CEO is a member of the board of directors nominating committee, or if no nominating committee existsand new directors are nominated by the entire board. Boards are classified as independent if independent directors constitute a majority of theboard. Data on ownership structure and board composition are obtained from proxy statements, and financial data are from COMPUSTAT.ROA is computed as the ratio of earnings before interest and taxes to total assets net of the median for all firms in the same two-digit SIC code.
FirmSize ROA
CEOTenure
CEO inFounding
Family
EquityOwnership
of CEO
Non-CEOChairmanof Board
IndependentBoard
Independent5 percent
Stockholder–Director
BoardSize
CEO involved indirector appointments~indicator variable! 20.31*** 0.07 0.22*** 0.29** 0.25** 20.04 20.27*** 20.09* 20.20***
Firm size ~log of assets! 20.20*** 20.19*** 20.31*** 20.28*** 20.10* 0.09* 20.04 0.45***ROA 0.07 0.10* 0.08 0.06 0.04 0.01 0.02CEO tenure ~log of
years in office! 0.48*** 0.33*** 20.23*** 20.08 0.04 20.03CEO as member of
founding family~indicator variable! 0.56*** 20.07 20.18*** 20.07 20.24***
Equity ownership of CEO~percentage ofshares outstanding! 20.07 20.12** 20.04 20.17***
Non-CEO chairmanof board ~indicatorvariable! 0.03 20.07 20.08
Independent board~indicator variable! 0.08 0.08
5 percent stockholderserving as independentoutside director~indicator variable! 0.04
*, **, *** indicate significance at the 10-, 5-, and 1-percent levels, respectively.
1836T
he
Jou
rnal
ofF
inan
ce

involvement and the fraction of directors in different categories, as well as theprobability that a new director has independent or gray status. We expect ouranalysis of new appointments to have greater statistical power than the cross-sectional model because cross-sectional patterns of board composition resultfrom the cumulation of many prior years of appointments. However, we stillexpect the cross-sectional model to provide insights into CEO inf luence, in partas a consistency check on our results for appointments, but also because datain Tables I and II raise the possibility that some directors change their statusafter being appointed. For example, an independent director might shift to thegray category as a result of being co-opted by a CEO who offers personal con-sulting fees or diverts company business to the outsider’s principal employeror because an interlocking directorship emerges from the CEO joining the boardof the independent director’s company.
A. Cross-Sectional Analysis of Board Composition
Table IV presents cross-sectional ordinary least squares models of the frac-tion of directors who have independent and gray status, using data for 1994.As an alternative specification, we also estimate a logit model for whetherthe board is independent.
We control for a number of factors, including firm size ~log of total assets!and the pretax return on assets over the prior year, measured as the ratio ofearnings before interest and taxes over assets, minus the median for all COM-PUSTAT firms in the same two-digit SIC code. We include controls for boardsize ~in a log specification, following Yermack ~1996!!, the fraction of outsidedirectors appointed during the tenure of the current CEO, an indicator vari-able for a non-CEO chairman of the board, and an indicator for the presenceof an independent director who is also a five percent stockholder. We also con-trol for several CEO characteristics, including the CEO’s fractional equity own-ership, the CEO’s tenure, an indicator for whether the CEO is near expectedretirement age ~between 62 and 66, following Hermalin and Weisbach ~1988!!,and an indicator for CEOs who belong to the company’s founding family.
Consistent with the hypothesis that involved CEOs select directors lesslikely to monitor them, the CEO involvement indicator in Table IV has anegative estimated coefficient in the regression model for the fraction of theboard that is independent, a positive estimate in the model for gray direc-tors, and a negative estimate in the logit model for the probability that theboard is independent. All three estimates are statistically significant, andall have large economic significance. The fraction of independent directors isestimated to be 13 percentage points lower than the mean of 46 percent ifthe CEO is involved in director selection, and the fraction of gray directorson the board is estimated to be five percentage points higher than the meanof 26 percent. The probability that a board is independent, based on an eval-uation of the partial derivatives of the logit likelihood function, increasesfrom 28 percent when the CEO is involved in the nomination process to55 percent if the CEO is not involved.
Involvement in the Selection of New Board Members 1837
Among the control variables included in the OLS models in Table IV, thepresence on the board of an independent five percent stockholder-directorappears especially important. When such a director is present, board com-position seems predisposed to stronger monitoring, with a higher fraction ofindependent outside directors and a lower fraction of gray outsiders.
Table IV
Cross-Sectional Estimates of Board CompositionRegression estimates of the fraction of independent directors and gray directors on the board.The sample includes all Fortune 500 firms, except for private, financial, and utility companies,during 1994. The involved CEO variable equals one if the CEO is a member of the board ofdirectors nominating committee, or if no nominating committee exists and new directors arenominated by the entire board. Inside directors are current employees of the firm. Nonemployeedirectors who are retired employees, are relatives of the CEO, have business ties to the firm, orhave interlocking directorships with the CEO are classified as gray. All other appointees areclassified as independent. Boards are classified as independent if independent directors con-stitute a majority of the board. Data on ownership structure and board composition is obtainedfrom proxy statements, and financial data are from COMPUSTAT. ROA is computed as theratio of earnings before interest and taxes to total assets net of the median for all firms in thesame two-digit SIC code. p-values appear in parentheses below each estimate.
Dependent Variable
Explanatory Variables
Fraction ofIndependent
Outside Directors~OLS!
Fraction ofGray Outside
Directors~OLS!
Probabilitythat Board IsIndependent
~Logit!
Intercept 0.36 0.02 0.66~0.00! ~0.86! ~0.59!
Involved CEO 20.13 0.05 21.16~0.00! ~0.01! ~0.00!
CEO tenure ~log, years in office! 20.03 0.02 20.14~0.10! ~0.38! ~0.59!
Equity ownership of CEO 20.23 0.05 0.66~fraction of outstanding shares! ~0.12! ~0.74! ~0.77!
Non-CEO chairman of board 20.05 20.03 20.39~indicator variable! ~0.07! ~0.25! ~0.28!
CEO as member of founding family 20.03 20.00 20.99~indicator variable! ~0.30! ~0.95! ~0.03!
CEO at retirement age ~indicator variable, 20.02 0.02 20.47CEO between 62 and 66! ~0.37! ~0.47! ~0.15!
5 percent blockholder who is an 0.11 20.08 0.89independent director ~indicator variable! ~0.01! ~0.06! ~0.12!
Fraction of outside directors appointed 0.09 20.04 0.38during tenure of current CEO ~0.05! ~0.40! ~0.55!
Log of board size 0.10 0.07 20.03~0.00! ~0.00! ~0.93!
Firm size ~log of total assets! 20.01 0.00 20.03~0.59! ~0.59! ~0.79!
ROA 0.03 20.01 1.13~0.67! ~0.89! ~0.21!
R2 ~pseudo R2 for logit models! 0.23 0.04 0.09Number of observations 336 336 336
1838 The Journal of Finance
B. Analysis of Board Appointments
Having studied the association between CEO involvement in director se-lection and cross-sectional patterns of board composition, we next analyzehow CEO involvement impacts changes in the board. We begin by simplycomparing the proportions of independent, gray, and outside appointmentsmade when the CEO is involved and is not involved. Our sample includes434 appointments made when the CEO is involved, including 253 indepen-dent outside directors ~58 percent!, 60 gray outsiders ~14 percent!, and 121insiders ~28 percent!. For boards with uninvolved CEOs, the 578 total ap-pointments include 406 independent outsiders ~70 percent!, 47 gray outsid-ers ~8 percent!, and 125 insiders ~22 percent!. The differences in proportionsare significant at the 0.1 percent, 2 percent, and 7 percent levels, respec-tively. This simple evidence is consistent with the idea that independentdirectors, who are more likely to monitor the CEO, are appointed less fre-quently when the CEO is involved in director selection.
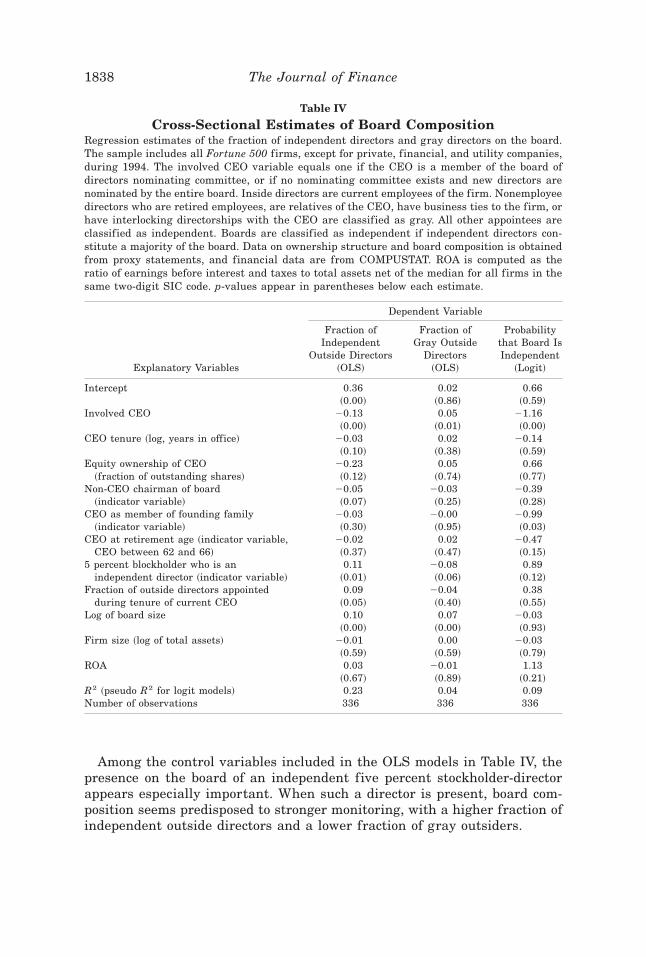
Table V presents logit analyses of appointments of independent and graydirectors. The first column of estimates is for a logit model with the depen-dent variable set equal to one if the appointee is an independent outsidedirector. The second column contains a similar model for the probability thatan appointee is a gray outsider. These two models are estimated over ourentire sample of appointments. As control variables, we include an indicatorvariable for whether the CEO is near retirement age, an indicator for whetherthe board is independent, indicators for the type of director replaced ~theseindicators equal zero for board expansions!, and controls for firm size andperformance. Although not included in the reported results, our inferencesare robust to inclusion of the full range of regressors from Table IV.
Consistent with the cross-sectional results, Table V indicates that CEOinvolvement is significantly associated with a greater incidence of gray ap-pointments and a lower incidence of independent appointments. Confirmingthe evidence in Table I, the estimates also indicate that appointees are sub-stantially more likely to replace retiring directors of the same category thandirectors from other categories. When the CEO is near retirement age, fewerappointees are independent or gray, ref lecting the tendency documented byHermalin and Weisbach ~1988! of these firms to appoint inside directors asa prelude to CEO succession.
Conditional on the board replacing a retiring independent outside direc-tor, we study the likelihood that the new appointee is a gray outsider, apattern that should imply deterioration in the board’s monitoring capacity. Alogit model of this choice appears in the third column of Table V, and theestimates exhibit a strong positive association between CEO involvement andthe probability that an independent director is replaced by a gray director.
The final column of Table V presents logit estimates for whether a newdirector appointment shifts the composition of the board from one that is notindependent to one that is. There are 58 such instances in our sample, 20 ofwhich occur when the CEO is involved. Consistent with the previous results,
Involvement in the Selection of New Board Members 1839
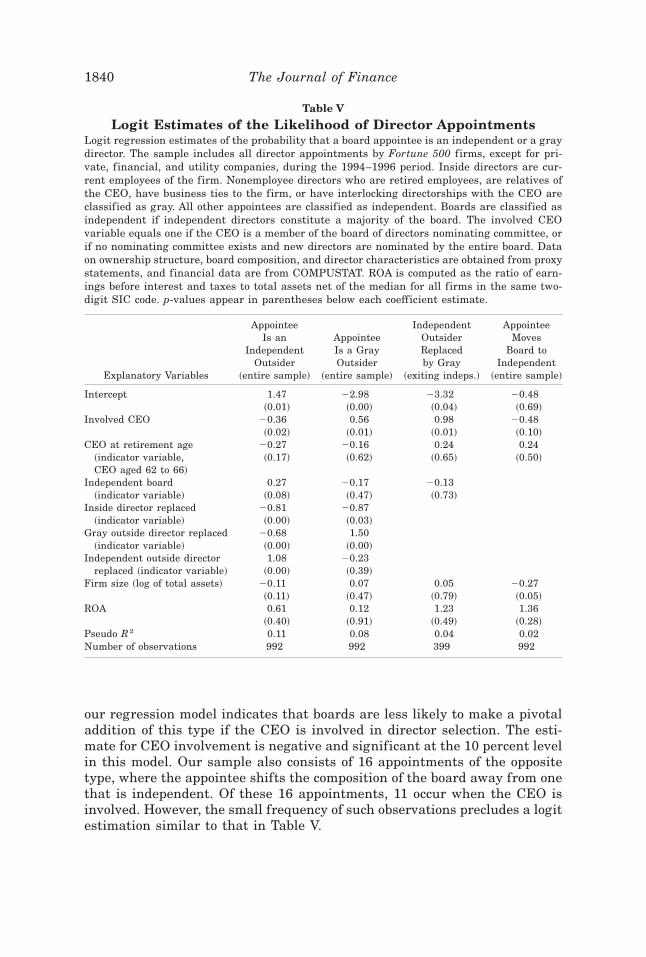
our regression model indicates that boards are less likely to make a pivotaladdition of this type if the CEO is involved in director selection. The esti-mate for CEO involvement is negative and significant at the 10 percent levelin this model. Our sample also consists of 16 appointments of the oppositetype, where the appointee shifts the composition of the board away from onethat is independent. Of these 16 appointments, 11 occur when the CEO isinvolved. However, the small frequency of such observations precludes a logitestimation similar to that in Table V.
Table V
Logit Estimates of the Likelihood of Director AppointmentsLogit regression estimates of the probability that a board appointee is an independent or a graydirector. The sample includes all director appointments by Fortune 500 firms, except for pri-vate, financial, and utility companies, during the 1994–1996 period. Inside directors are cur-rent employees of the firm. Nonemployee directors who are retired employees, are relatives ofthe CEO, have business ties to the firm, or have interlocking directorships with the CEO areclassified as gray. All other appointees are classified as independent. Boards are classified asindependent if independent directors constitute a majority of the board. The involved CEOvariable equals one if the CEO is a member of the board of directors nominating committee, orif no nominating committee exists and new directors are nominated by the entire board. Dataon ownership structure, board composition, and director characteristics are obtained from proxystatements, and financial data are from COMPUSTAT. ROA is computed as the ratio of earn-ings before interest and taxes to total assets net of the median for all firms in the same two-digit SIC code. p-values appear in parentheses below each coefficient estimate.
Explanatory Variables
AppointeeIs an
IndependentOutsider
~entire sample!
AppointeeIs a GrayOutsider
~entire sample!
IndependentOutsiderReplacedby Gray
~exiting indeps.!
AppointeeMoves
Board toIndependent
~entire sample!
Intercept 1.47 22.98 23.32 20.48~0.01! ~0.00! ~0.04! ~0.69!
Involved CEO 20.36 0.56 0.98 20.48~0.02! ~0.01! ~0.01! ~0.10!
CEO at retirement age 20.27 20.16 0.24 0.24~indicator variable,CEO aged 62 to 66!
~0.17! ~0.62! ~0.65! ~0.50!
Independent board 0.27 20.17 20.13~indicator variable! ~0.08! ~0.47! ~0.73!
Inside director replaced 20.81 20.87~indicator variable! ~0.00! ~0.03!
Gray outside director replaced 20.68 1.50~indicator variable! ~0.00! ~0.00!
Independent outside director 1.08 20.23replaced ~indicator variable! ~0.00! ~0.39!
Firm size ~log of total assets! 20.11 0.07 0.05 20.27~0.11! ~0.47! ~0.79! ~0.05!
ROA 0.61 0.12 1.23 1.36~0.40! ~0.91! ~0.49! ~0.28!
Pseudo R2 0.11 0.08 0.04 0.02Number of observations 992 992 399 992
1840 The Journal of Finance
To understand the economic significance of the effect of CEO involvement,we compute estimated probabilities by evaluating partial derivatives of thelogit models of Table V at the means for all variables. According to ourestimates, CEO involvement lowers the probability of an independent ap-pointment from 71 percent to 63 percent and raises the probability of a grayappointment from 7 percent to 12 percent. The likelihood that a gray out-sider replaces a departing independent rises from 5 percent to 13 percent.Finally, the probability that an appointee shifts the board’s composition toindependent drops from seven percent to four percent when the CEO is in-volved. The economic magnitude of these estimates implies that the effectsof CEO involvement on board composition are nontrivial.
Our analysis to this point has treated CEOs as involved in director selec-tion both when they serve on the nominating committee and when the firmhas no separate nominating committee. However, the relative degree of CEOinf luence may vary across these subgroups. For example, CEOs sitting on anominating committee may find it easier to wield inf luence over the smallernumber of individuals participating in director selection. It is equally pos-sible, however, that the presence of a separate committee indicates boardsthat attach special importance to director selection, in which cases CEOinf luence over appointments may be lower. To evaluate these possibilities,we reestimate our results including an interaction term that takes the valueone if the CEO is involved but the firm does not have a nominating committee.Coefficient estimates for this interaction term indicate that in firms with noseparate committee, independent outside directors are less likely and graydirectors are more likely to be appointed ~both significant at the 10 percentlevel!. However, such firms do not differ in the likelihood of gray appointeesreplacing independent incumbents, or the likelihood of appointments thatshift the composition of the board to a majority of independent directors.
A limitation of our analysis is the implicit assumption that CEO involve-ment is exogenous. In practice, the CEO’s power to select new directors mayemerge endogenously from negotiations with other board members over thebalance of power, as suggested by Hermalin and Weisbach ~1998!. In untab-ulated tests, we attempt to control for the endogeneity of CEO involvementwith a two-stage model in which the indicator for CEO involvement is re-placed by its predicted value. We follow the methodology of Kovenock andPhillips ~1997!, who estimate a similar two-stage model of plant closingsthat includes a first-stage logit estimation of the probability that a firmalters its capital structure.
We estimate a first-stage logit model of the likelihood of CEO involvementas a function of firm size and performance, CEO tenure, CEO stock owner-ship, CEO status as a chairman or firm founder, an indicator for expectedretirement age, board size, and the presence of an independent five percentstockholder-director. To account for the possibility that CEOs are more likelyto be involved when it is important to recruit gray or inside directors, wealso include as first-stage variables the average fraction of gray and inde-pendent directors on boards of firms in each two-digit SIC code using our
Involvement in the Selection of New Board Members 1841
sample firms. Finally, we include in the first-stage logit model an indicatorthat equals one if the CEO had been hired from outside the firm within theprior three years. New outside CEOs may receive authority to oversee di-rector selection as part of a mandate to “clean house” while restructuringthe firm, and outside CEOs may also be more likely to recruit gray directorswith whom they have had prior business relations.
Results from the first-stage model indicate that CEO involvement is neg-atively related to firm size and performance, and positively related to CEOtenure, CEO equity ownership, founder status, and the presence of a fivepercent independent director blockholder. CEOs hired from outside the firmwithin the prior three years are also more likely to have involvement status.Finally, CEO involvement is negatively related to the average fractions ofgray and independent directors for firms in the same industry.
Replicating the analysis of appointments in the two-stage framework, wefind the same sign and significance for the CEO involvement variable forthe first three models reported in Table V. For the probability that a newdirector represents a “pivotal” appointment that moves the board to becomemore than 50 percent independent, however, the estimate on CEO involve-ment, which was previously marginally significant, loses significance. Thebasic finding that involved CEOs are likely to appoint fewer independentand more gray directors thus appears to hold in a framework where CEOinvolvement is treated as endogenous.2
III. Investor Reactions to Appointments
The preceding tests indicate that involved CEOs are less likely to nomi-nate independent directors, but the tests do not tell us whether the attributesof independent nominees vary with CEO involvement. To assess differencesin the quality of independent director appointees, we study investor reac-tions to the announcement of each appointment. We compute cumulativeabnormal stock returns ~CARs! over a three-day period running from theday before the announcement until the day after, using standard event-study methodology ~Dodd and Warner ~1983!!. Market model parameters areestimated from one year of trading data preceding the event window.3 Weidentify announcement events by searching the LEXIS0NEXIS data re-trieval system for newspaper stories and press releases. We exclude an-nouncements where multiple directors are appointed on the same day inorder to construct mutually exclusive categories of independent, gray, andinside appointments. We also restrict the analysis to those appointments
2 In additional tests, we also explore whether outside CEOs are more likely than other CEOsto appoint fewer independent and more gray directors to the board. Estimating the modelsreported with an interaction term between CEO involvement and an indicator for outside CEOs,we are unable to find such a pattern.
3 If appointments are made following periods of poor performance, the market model param-eters may be biased. We repeat our analysis by using simple net-of-market stock returns in-stead of market model abnormal returns and find virtually no differences.
1842 The Journal of Finance
that were not first announced in the company’s proxy statement, a qualifi-cation met by about 76 percent of all appointments, in order to obtain dis-tinct announcement dates for appointments.
A. Univariate Analysis
Panel A of Table VI presents mean and median CARs for the 626 announce-ments of director appointments for which announcement dates and usablestock market data are available. For the set of all independent outside ap-pointments, we find that neither the mean nor median CAR is significantlydifferent from zero. This result is similar to that in Rosenstein and Wyatt~1990! who document a small and statistically insignificant stock-price re-action for outside director appointments in large firms. Given the evidenceon active monitoring by outside directors documented in prior studies, thissuggests that the decision to appoint an outside director may convey adverseinformation that offsets the positive effects of such appointments. For ex-ample, Hermalin and Weisbach ~1988! show that inside appointments tendto precede CEO retirements. The appointment of an outside director maysignal a diminished likelihood that the CEO plans to retire, news that mightmeet with unfavorable reactions in circumstances when the CEO is en-trenched or underperforming. Alternatively, since a large fraction of inde-pendent appointees in the sample replace a departing incumbent who wasalso independent, such appointments may not be expected to generate en-hanced monitoring benefits. Accordingly, it appears important to control forthe information content and the type of director replaced when studying themarket reaction to director announcements.
With these caveats in mind, we compare the CARs across subsamples ofCEO involvement before proceeding to a multivariate analysis. The CARsare significantly negative with magnitudes of 20.92 percent ~mean! and20.71 percent ~median! for independent appointments where the CEO isinvolved. In contrast, there is weak evidence of a positive CAR when theCEO is uninvolved in nominations. The mean CAR is 0.34 percent and sig-nificant at the 8 percent level using a t-test, but this pattern fails to hold forthe median. Both t-tests and Wilcoxon rank-sum tests indicate that the CARsare significantly lower for appointments where the CEO is involved com-pared to appointments without CEO involvement. One interpretation is thatindependent outsiders perceived to be of lower quality are chosen for boardseats if the CEO is involved in their selection. Alternatively, it is possiblethat these appointments convey a diminished likelihood of CEO turnover,which may be more disappointing news for firms with involved CEOs.
We study CARs for appointments of gray outside directors with resultsreported in the center of Table VI. Overall, we find that appointments ofgray directors lead to a significant negative stock price reaction. Across sub-samples of CEO involvement, however, no significant difference in CARs forgray appointments exists. The negative average market reaction to grayappointees is consistent with several explanations. Such appointees could be
Involvement in the Selection of New Board Members 1843

Table VI
Cumulative Abnormal Returns for Announcements of Director AppointmentsThree-day cumulative abnormal returns ~CARs! associated with announcements of appointments of directors by Fortune 500 companies during the 1994–1996 period. Observations are excluded from the analysis if multiple appointments are announced on the same day. Inside directors are current employeesof the firm. Nonemployee directors who are retired employees, are relatives of the CEO, have business ties to the firm, or have interlocking directorshipswith the CEO are classified as gray. All other appointees are classified as independent. The involved CEO variable equals 1 if the CEO is a member of theboard of directors nominating committee, or if no nominating committee exists and new directors are nominated by the entire board. Data on directorcharacteristics and board composition are obtained from proxy statements. Two-stage CARs are computed by weighting the market model CARs by thereciprocal of ~1 2 p!, where p is the probability of director appointments of a given type, estimated as a function of CEO involvement, indicator variablesfor CEO retirement age, independent board, type of director replacement, firm size, and industry-adjusted return of assets ~ROA!. Numbers in parenthesesrepresent p-values from two-tailed tests using a t-test for means, and a Wilcoxon signed-rank test for medians.
Independent Appointees Gray Appointees Inside Appointees
MeanCAR
MedianCAR
Number ofObservations
MeanCAR
MedianCAR
Number ofObservations
MeanCAR
MedianCAR
Number ofObservations
Panel A: Market Model CARs
All appointments 20.0011 20.0010 373 20.0091 20.0056 40 20.0031 0.0002 82~0.53! ~0.30! ~0.05! ~0.06! ~0.55! ~0.53!
Appointments where CEO 20.0092 20.0071 133 20.0095 0.0041 18 0.0000 0.0018 40is involved ~0.00! ~0.00! ~0.30! ~0.64! ~0.99! ~0.99!
Appointments where CEO 0.0034 0.0006 240 20.0088 20.0092 22 20.0060 20.0014 42is not involved ~0.08! ~0.32! ~0.03! ~0.05! ~0.28! ~0.34!
t-statistic for difference 3.42 0.07 0.58in CARs ~0.00! ~0.95! ~0.56!
Wilcoxon Z statistic for 3.12 0.86 0.45difference in CARs ~0.00! ~0.39! ~0.65!
Panel B: Two-Stage CARs
All appointments 0.0013 20.0035 370 20.0095 20.0059 40 20.0022 0.0000 80~0.88! ~0.49! ~0.08! ~0.12! ~0.84! ~0.54!
Appointments where 20.0380 20.0186 131 20.0103 0.0055 18 0.0005 0.0042 38CEO is involved ~0.00! ~0.00! ~0.34! ~0.73! ~0.98! ~0.80!
Appointments where 0.0229 0.0028 239 20.0089 20.0099 22 20.0047 20.0034 42CEO is not involved ~0.05! ~0.20! ~0.05! ~0.09! ~0.56! ~0.51!
t-statistic for difference 3.51 0.12 0.22in CARs ~0.00! ~0.90! ~0.83!
Wilcoxon Z statistic for 3.02 0.69 0.04difference in CARs ~0.00! ~0.49! ~0.97!
1844T
he
Jou
rnal
ofF
inan
ce
viewed as less likely monitors, could signal that the CEO is less likely toretire, or could signal adverse information about the state of the firm if grayappointments often occur around periods of financial distress ~Gilson ~1990!!.The right columns of Table VI present results about investor reactions toinside director appointments. We find no significant reaction to these ap-pointments for the entire sample of 82 events, nor for either of the twosubsamples sorted by CEO involvement status.
A potential problem with our comparisons of CARs across subgroups de-fined by CEO involvement is that the CEO’s role in director selection ispublic information. In an informationally efficient market, one would expectinvestors’ expectations of low quality among future directors to be capital-ized in stock prices once they know whether the board has a nominatingcommittee and, if so, whether the CEO is a member. The negative CARs thatwe nevertheless observe when new independent directors are appointed withCEO involvement may be attributable to the resolution of uncertainty aboutthe timing or frequency of these appointments, and the data also seem con-sistent with a conjecture that involved CEOs appoint even lower qualityindependent directors than investors anticipate. Alternatively, independentappointments by involved CEOs may represent a larger surprise to the mar-ket, given its advance knowledge that such directors are less likely to beappointed when the CEO is involved.
In an attempt to evaluate the importance of prior anticipation across thetwo subsamples, we conduct a two-stage CAR analysis similar to that inKang and Shivdasani ~1996!.4 In the first stage, we estimate the likelihoodof an independent, gray, or inside director appointment for each firm-year inthe sample. These probabilities are estimated using the first two models inTable V and an equivalent model for inside appointments. We use the fore-cast probabilities of appointments from this procedure to adjust the marketmodel CARs by a factor of 10~1 2 p!, where p is the estimated probability ofeach type of appointment. Each adjusted CAR therefore represents an esti-mate of what the stock price reaction to the director appointment wouldhave been if the event were unanticipated. Comparison of such CARs acrosssubsamples by CEO involvement status should therefore be purged of biasarising from anticipation of appointments by investors.
The two-stage CARs, reported in Panel B of Table VI, provide strong sup-port for the proposition that differences in market model CARs across sub-samples sorted by CEO involvement are not caused by anticipation bias. Themagnitude and significance of the results for independent appointees wid-ens for the two-stage CARs compared to their market model counterparts.The inferences for appointments of gray and inside directors from marketmodel CARs are similarly robust to the two-stage procedure. We recognizepotential limitations of the two-stage CAR analysis. To the extent that the
4 A similar approach to account for prior anticipation appears in Bhagat and Jeffries ~1991!in the context of antitakeover amendments and in Chaplinsky and Hansen ~1993!, who examinedebt issues.
Involvement in the Selection of New Board Members 1845
first-stage models of board appointments are incorrectly specified, the prob-abilities of various types of appointments will be measured with error, re-ducing the precision of our second-stage tests. Though we have no reason toexpect that the first-stage models are biased, we experiment with numerousalternative specifications and obtain very similar results. Nonetheless, thetwo-stage CARs need to be interpreted with caution, and we report themprimarily as a robustness check.
B. Multivariate Analysis
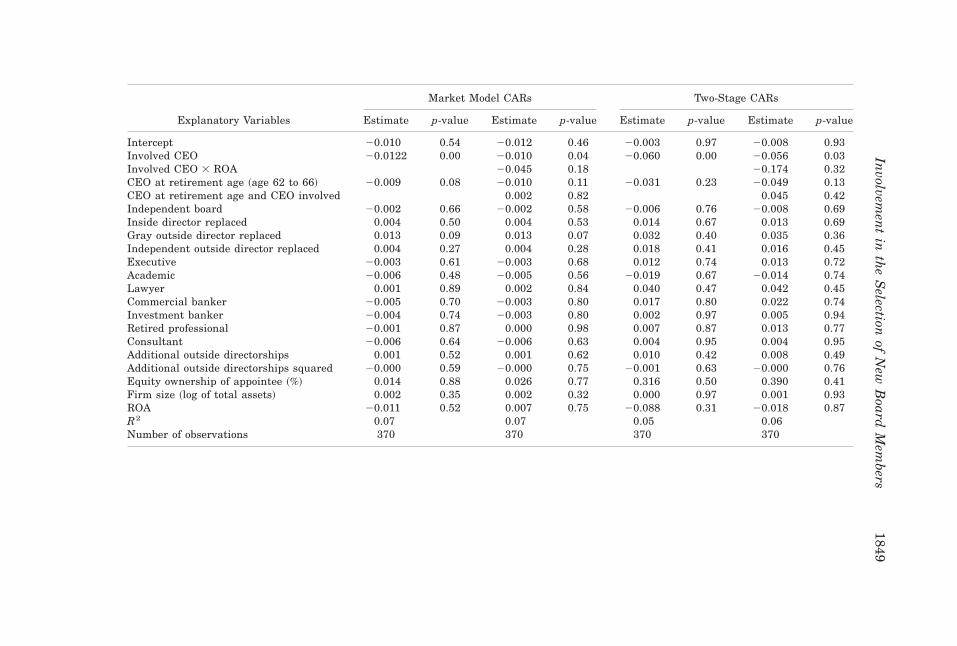
We conduct a multivariate analysis of market model CARs for announce-ments of independent appointments in Table VII. The regressions control forCEOs near retirement age to proxy for the market’s prior anticipation ofCEO retirement. Additional control variables include indicators for the typeof director replaced ~if any!, firm size, performance, indicator variables forappointees’ regular occupations, the number of other directorships held, andits square. Consistent with the univariate results, the CEO involvement in-dicator has a negative and statistically significant estimated association withinvestor reactions to independent board appointments. The coefficient esti-mate indicates that CARs are approximately 1.2 percent lower in these cases.
As discussed above, the CARs for independent outside appointments maybe confounded by the additional news conveyed about the likelihood of CEOturnover, which may be viewed particularly negatively when the CEO isinvolved. To evaluate this possibility, we include interaction terms with CEOinvolvement and two variables that proxy for the market’s prior anticipationof CEO retirement: the indicator for CEOs at expected retirement age andthe ROA variable for prior performance. As shown in the second column ofTable VII, interactions between these variables and CEO involvement arenot significantly related to CARs, and the coefficient on the CEO involve-ment variable is robust to their inclusion in the model. Thus, the associationbetween CEO involvement and the stock-price reaction to independent di-rector appointments does not appear to be driven by investors’ expectationsregarding CEO turnover.
In the third and fourth columns of Table VII, we present regression analy-sis of two-stage CARs calculated as described in the univariate analysis above.As was the case in Table VI, our results appear to strengthen after applyingthis adjustment to control for the ex ante expectation of an independentdirector appointment.
IV. Other Directorships and Stock Ownershipof Independent Appointees
Independent directors who have reputations as effective monitors mightbe recruited to serve on many boards, and researchers have therefore usedthe number of additional board seats as a measure of an individual director’squality. Kaplan and Reishus ~1990!, Gilson ~1990!, and Shivdasani ~1993!
1846 The Journal of Finance
present evidence supporting the idea that the number of directorships mayserve as an indicator of director reputation. However, institutional investorsand shareholder activists have recently questioned the effectiveness of di-rectors who serve on many boards. According to such criticisms, additionaldirectorships may reduce an individual’s monitoring capability as their avail-able time is spread thin. Some support for this view is found by Core, Holth-ausen, and Larcker ~1999!, who define directors to be “busy” if they serve onthree or more other boards if they are employed, and six or more boards ifthey are retired. Core et al. find that the presence of busy directors is pos-itively associated with measures of excess CEO compensation, suggestingthat such directors are less likely to engage in significant managerial mon-itoring than other directors who serve on fewer boards.
We investigate potential differences in the reputation of appointees bystudying the number of additional directorships held. Estimates of the as-sociation between CEO involvement and independent appointees’ other boardseats appear in the first two columns of Table VIII. Control variables aresimilar to those used in our other models. We also include indicator vari-ables for whether the new appointee is a current or former CEO of anotherfirm, because such persons are often in high demand as outside board mem-bers. The first column of Table VIII presents a Poisson maximum likelihoodmodel of the number of other board seats held by independent appointees.The model estimates indicate that involved CEOs are more likely to appointdirectors who serve on a large number of other boards. The second columnpresents a logit model of whether a new independent director fits the “busy”definition of Core et al. ~1999!. We find a positive association between “busy”appointments and CEO involvement, significant at the 5 percent level. Ifone believes that too many board seats indicate a director who is an indif-ferent or overtaxed monitor of top management, as suggested by investoractivists, then the data are consistent with an association between less valu-able appointments and CEO involvement. Given that the optimal number ofdirectorships is an unresolved issue, however, such an interpretation shouldbe viewed with caution.
We study the stock ownership of new independent directors, with the premisethat appointees with high stock ownership have stronger incentives to monitorthe CEO. However, appointments of directors with large stock ownership mayalso indicate external control pressures. If CEO involvement is positively as-sociated with poor corporate governance or CEO entrenchment, outside in-vestors may have incentives to purchase large amounts of stock and seek boardrepresentation with the hope of instituting reforms ~Shleifer and Vishny ~1986!!.
The right column of Table VIII presents Tobit estimates for a model withthe dependent variable equal to the fraction of outstanding shares held bynew independent directors. According to the first proxy statement filed aftertheir election or nomination, new independent outside directors generallyown very little stock, with 68 percent of our sample holding 1,000 shares orfewer and 25 percent owning no shares at all; the Tobit specification accom-modates this high incidence of zero ownership. The coefficient estimate for
Involvement in the Selection of New Board Members 1847
Table VII
Multivariate Analysis of Cumulative Abnormal Returns for Independent AppointmentsOrdinary least squares regression estimates of the three-day cumulative return ~CAR! associated with announcements of inde-pendent director appointments to the board. The sample includes independent director appointments by Fortune 500 firms,except for private, financial, and utility companies, during the 1994–1996 period. Observations are excluded from the analysisif multiple appointments are announced on the same day. Inside directors are current employees of the firm. Nonemployeedirectors who are retired employees, are relatives of the CEO, have business ties to the firm, or have interlocking directorshipswith the CEO are classified as gray. All other appointees are classified as independent. Boards are classified as independent ifindependent directors constitute a majority of the board. The involved CEO variable equals one if the CEO is a member of theboard of directors nominating committee, or if no nominating committee exists and new directors are nominated by the entireboard. Two-stage CARs are computed by weighting the market model CARs by the reciprocal of ~1 2 p!, where p is the probabilityof director appointments of a given type, estimated as a function of CEO involvement, indicator variables for CEO retirementage, independent board, type of director replacement, firm size, and industry-adjusted return of assets ~ROA!. Data on ownershipstructure, board composition, and director characteristics are obtained from proxy statements, and financial data are fromCOMPUSTAT. ROA is computed as the ratio of earnings before interest and taxes to total assets net of the median for all firmsin the same two-digit SIC code.
1848T
he
Jou
rnal
ofF
inan
ce
Market Model CARs Two-Stage CARs
Explanatory Variables Estimate p-value Estimate p-value Estimate p-value Estimate p-value
Intercept 20.010 0.54 20.012 0.46 20.003 0.97 20.008 0.93Involved CEO 20.0122 0.00 20.010 0.04 20.060 0.00 20.056 0.03Involved CEO 3 ROA 20.045 0.18 20.174 0.32CEO at retirement age ~age 62 to 66! 20.009 0.08 20.010 0.11 20.031 0.23 20.049 0.13CEO at retirement age and CEO involved 0.002 0.82 0.045 0.42Independent board 20.002 0.66 20.002 0.58 20.006 0.76 20.008 0.69Inside director replaced 0.004 0.50 0.004 0.53 0.014 0.67 0.013 0.69Gray outside director replaced 0.013 0.09 0.013 0.07 0.032 0.40 0.035 0.36Independent outside director replaced 0.004 0.27 0.004 0.28 0.018 0.41 0.016 0.45Executive 20.003 0.61 20.003 0.68 0.012 0.74 0.013 0.72Academic 20.006 0.48 20.005 0.56 20.019 0.67 20.014 0.74Lawyer 0.001 0.89 0.002 0.84 0.040 0.47 0.042 0.45Commercial banker 20.005 0.70 20.003 0.80 0.017 0.80 0.022 0.74Investment banker 20.004 0.74 20.003 0.80 0.002 0.97 0.005 0.94Retired professional 20.001 0.87 0.000 0.98 0.007 0.87 0.013 0.77Consultant 20.006 0.64 20.006 0.63 0.004 0.95 0.004 0.95Additional outside directorships 0.001 0.52 0.001 0.62 0.010 0.42 0.008 0.49Additional outside directorships squared 20.000 0.59 20.000 0.75 20.001 0.63 20.000 0.76Equity ownership of appointee ~%! 0.014 0.88 0.026 0.77 0.316 0.50 0.390 0.41Firm size ~log of total assets! 0.002 0.35 0.002 0.32 0.000 0.97 0.001 0.93ROA 20.011 0.52 0.007 0.75 20.088 0.31 20.018 0.87R2 0.07 0.07 0.05 0.06Number of observations 370 370 370 370
Involvem
ent
inth
eS
electionof
New
Board
Mem
bers1849

the CEO involvement variable in this model is positive but lacks statisticalsignificance. In unreported tests, we also estimate logit models of the prob-ability that appointees have ownership stakes of 0.1 percent, one percent,and five percent, under the premise that such major stockholder-director
Table VIII
Multivariate Analysis of Ownership and Directorshipsof Independent Appointees
Regression estimates of the number of additional outside directorships held and the equityownership of independent director appointees. The sample includes all independent directorappointments by Fortune 500 firms, except for private, financial, and utility companies, duringthe 1994–1996 period. Inside directors are current employees of the firm. Nonemployee direc-tors who are retired employees, are relatives of the CEO, have business ties to the firm, or haveinterlocking directorships with the CEO are classified as gray. All other appointees are classi-fied as independent. Boards are classified as independent if independent directors constitute amajority of the board. Appointees are considered to be “busy” if they are employed and serve onthree or more boards, or if they are retired and serve on six or more boards. The involved CEOvariable equals 1 if the CEO is a member of the board of directors nominating committee, or ifno nominating committee exists and new directors are nominated by the entire board. Data onownership structure, board composition, and director characteristics are obtained from proxystatements, and financial data are from COMPUSTAT. ROA is computed as the ratio of earn-ings before interest and taxes to total assets net of the median for all firms in the same two-digit SIC code. p-values appear below each estimate in parentheses.
Explanatory Variables
Number of OutsideDirectorships
~Poisson!
Appointee Is a“Busy” Director
~Logit!
Appointee’sOwnership ~%!
~Tobit!
Intercept 20.20 23.04 0.12~0.40! ~0.00! ~0.80!
Involved CEO 0.13 0.39 0.02~0.03! ~0.05! ~0.13!
CEO at retirement age ~indicator 20.08 20.22 20.01variable, CEO aged 62 to 66! ~0.36! ~0.43! ~0.46!
Independent board 0.00 0.11 20.01~indicator variable! ~0.95! ~0.57! ~0.52!
Inside director replaced 20.05 20.47 0.00~indicator variable! ~0.65! ~0.17! ~0.83!
Gray outside director 0.17 20.01 0.00replaced ~indicator variable! ~0.14! ~0.98! ~0.93!
Independent outside director 0.17 20.07 0.03replaced ~indicator variable! ~0.01! ~0.73! ~0.01!
Firm size ~log of total assets! 0.09 0.20 20.00~0.00! ~0.02! ~0.37!
ROA 0.04 0.09 20.04~0.89! ~0.92! ~0.40!
Appointee is CEO in another firm 0.17 0.85 20.01~0.00! ~0.00! ~0.20!
Appointee is a former CEO in 0.55 2.19 20.02another firm ~0.00! ~0.00! ~0.45!
Pseudo R2 0.02 0.07 0.04Number of observations 650 650 650
1850 The Journal of Finance

appointments are more likely to represent external control pressures. Thesetests also do not suggest significant differences in equity ownership by ap-pointees across CEO involvement status.
V. Changes in CEO Involvement Status
Evidence presented above suggests that when CEOs are involved in direc-tor selection, companies choose new directors who are less likely to monitoraggressively. This raises the question of why such involvement is widelyobserved. The evident importance of board characteristics in determiningwhether the CEO is involved suggests that it is not a straightforward devicefor CEO entrenchment. Rather, involved CEOs’ recruitment of more grayand fewer independent directors might be expected by the board but stilltolerated if some CEOs “earn” the right to choose their own monitors due tosuperior long-term performance, high personal stock ownership, member-ship in the company’s founding family, or other personal or company attributes.We find that CEOs hired from outside the firm are also more likely to haveinf luence over director selection, an outcome probably anticipated by theboards who elect those CEOs. A question that deserves further attention isunder what circumstances CEO inf luence over director selection representsan optimal governance arrangement.
If those instances of CEO involvement that we observe in our sample rep-resent optimal governance arrangements for certain classes of companies,we might expect them to persist in those firms over time. The overall trendfor our sample is clearly toward less CEO involvement. Of our 341 compa-nies, 39 changed the CEO’s involvement status during our three-year sam-ple period, and a large majority ~32 of the 39! shifted an involved CEO touninvolved status. Changes in CEO status from involved to uninvolved oc-curred contemporaneously with episodes of CEO turnover in 11 of the 32cases. The 34.4 percent frequency of CEO turnover in this subsample issignificantly greater than the 6.8 percent rate of CEO turnover for the re-maining firms where CEO involvement does not change. This supports ar-guments advanced by Hermalin and Weisbach ~1998! that CEOs acquirepower in director selection over time. Thus, newly appointed CEOs should beless likely to have involvement status. However, a large fraction of changesin involvement status also occurs in the absence of CEO turnover. We readnews stories and proxy statements to understand other reasons for changesin CEO involvement. Public disclosures of such changes are rare, and onlyone company, the scandal-plagued Archer Daniels Midland, made a publicannouncement of the shift of its CEO’s involvement status. In four otherinstances, proxy statements around the time of the change contained share-holder resolutions expressing dissatisfaction with the quality or compositionof the board but not directly addressing the issue of the CEO’s power toselect new directors. Thus, for some firms, changes in CEO involvementstatus appear to be the result of control changes or external pressure, butsuch forces do not appear to account for all changes.
Involvement in the Selection of New Board Members 1851
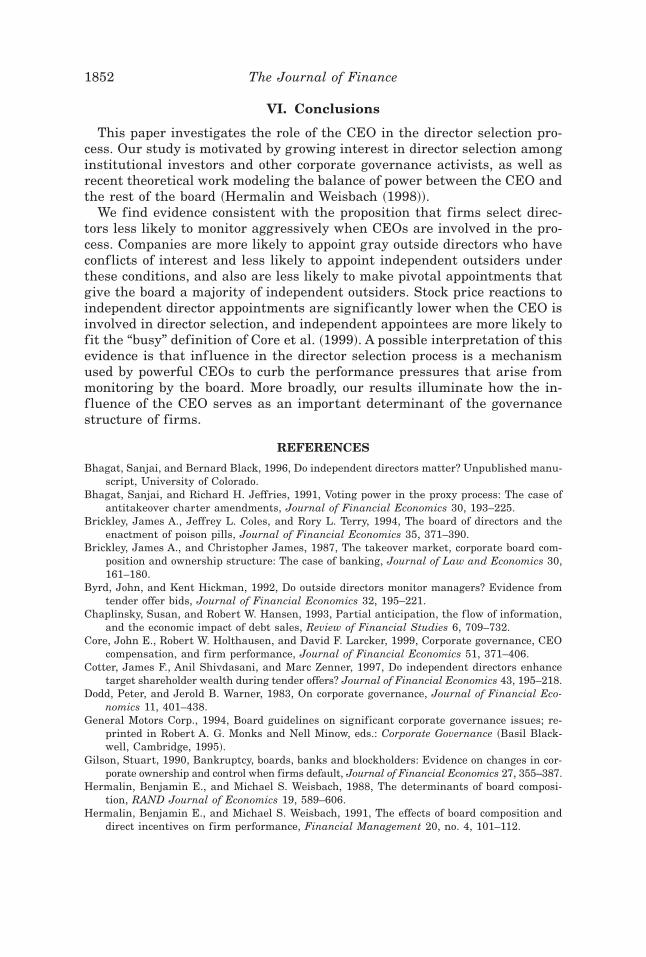
VI. Conclusions
This paper investigates the role of the CEO in the director selection pro-cess. Our study is motivated by growing interest in director selection amonginstitutional investors and other corporate governance activists, as well asrecent theoretical work modeling the balance of power between the CEO andthe rest of the board ~Hermalin and Weisbach ~1998!!.
We find evidence consistent with the proposition that firms select direc-tors less likely to monitor aggressively when CEOs are involved in the pro-cess. Companies are more likely to appoint gray outside directors who haveconf licts of interest and less likely to appoint independent outsiders underthese conditions, and also are less likely to make pivotal appointments thatgive the board a majority of independent outsiders. Stock price reactions toindependent director appointments are significantly lower when the CEO isinvolved in director selection, and independent appointees are more likely tofit the “busy” definition of Core et al. ~1999!. A possible interpretation of thisevidence is that inf luence in the director selection process is a mechanismused by powerful CEOs to curb the performance pressures that arise frommonitoring by the board. More broadly, our results illuminate how the in-f luence of the CEO serves as an important determinant of the governancestructure of firms.
REFERENCES
Bhagat, Sanjai, and Bernard Black, 1996, Do independent directors matter? Unpublished manu-script, University of Colorado.
Bhagat, Sanjai, and Richard H. Jeffries, 1991, Voting power in the proxy process: The case ofantitakeover charter amendments, Journal of Financial Economics 30, 193–225.
Brickley, James A., Jeffrey L. Coles, and Rory L. Terry, 1994, The board of directors and theenactment of poison pills, Journal of Financial Economics 35, 371–390.
Brickley, James A., and Christopher James, 1987, The takeover market, corporate board com-position and ownership structure: The case of banking, Journal of Law and Economics 30,161–180.
Byrd, John, and Kent Hickman, 1992, Do outside directors monitor managers? Evidence fromtender offer bids, Journal of Financial Economics 32, 195–221.
Chaplinsky, Susan, and Robert W. Hansen, 1993, Partial anticipation, the f low of information,and the economic impact of debt sales, Review of Financial Studies 6, 709–732.
Core, John E., Robert W. Holthausen, and David F. Larcker, 1999, Corporate governance, CEOcompensation, and firm performance, Journal of Financial Economics 51, 371–406.
Cotter, James F., Anil Shivdasani, and Marc Zenner, 1997, Do independent directors enhancetarget shareholder wealth during tender offers? Journal of Financial Economics 43, 195–218.
Dodd, Peter, and Jerold B. Warner, 1983, On corporate governance, Journal of Financial Eco-nomics 11, 401–438.
General Motors Corp., 1994, Board guidelines on significant corporate governance issues; re-printed in Robert A. G. Monks and Nell Minow, eds.: Corporate Governance ~Basil Black-well, Cambridge, 1995!.
Gilson, Stuart, 1990, Bankruptcy, boards, banks and blockholders: Evidence on changes in cor-porate ownership and control when firms default, Journal of Financial Economics 27, 355–387.
Hermalin, Benjamin E., and Michael S. Weisbach, 1988, The determinants of board composi-tion, RAND Journal of Economics 19, 589–606.
Hermalin, Benjamin E., and Michael S. Weisbach, 1991, The effects of board composition anddirect incentives on firm performance, Financial Management 20, no. 4, 101–112.
1852 The Journal of Finance
Hermalin, Benjamin E., and Michael S. Weisbach, 1997, Endogenously chosen boards of direc-tors and their monitoring of the CEO, American Economic Review 88, 96–118.
Kang, Jun-Koo, and Anil Shivdasani, 1996, Does the Japanese governance system enhanceshareholder wealth? Evidence from stock-price effects of top management turnover, Reviewof Financial Studies 9, 1061–1095.
Kaplan, Steven N., and Bernadette A. Minton, 1994, Appointments of outsiders to Japaneseboards: Determinants and implications for managers, Journal of Financial Economics 36,225–258.
Kaplan, Steven N., and David Reishus, 1990, Outside directorships and corporate performance,Journal of Financial Economics 27, 389–410.
Kovenock, Dan, and Gordon M. Phillips, 1997, Capital structure and product market behavior:An examination of plant exit and investment decisions, Review of Financial Studies 10,767–803.
Lorsch, Jay L., and Elizabeth M. MacIver, 1989. Pawns or Potentates? The Reality of America’sCorporate Boards ~Harvard Business School Press, Boston!.
Mace, Myles L., 1971. Directors: Myth and Reality ~Harvard Business School Press, Boston!.Mayers, David, Anil Shivdasani, and Clifford W. Smith Jr., 1997, Board composition and cor-
porate control, Journal of Business 70, 33–62.Rosenstein, Stuart, and Jeffrey G. Wyatt, 1990, Outside directors, board independence, and
shareholder wealth, Journal of Financial Economics 26, 175–191.Shivdasani, Anil, 1993, Board composition, ownership structure and hostile takeovers, Journal
of Accounting and Economics 16, 167–198.Shleifer, Andrei, and Robert W. Vishny, 1986, Large shareholders and corporate control, Jour-
nal of Political Economy 94, 461–488.Tejada, Carlos, 1997, Longtime Tandy director quits board, says he was punished for faulting
CEO, Wall Street Journal, January 16.Weisbach, Michael, 1988, Outside directors and CEO turnover, Journal of Financial Economics
20, 431–460.The Working Group on Corporate Governance, 1991, A new compact for owners and directors;
reprinted in Robert A. G. Monks and Nell Minow, eds.: Corporate Governance ~Basil Black-well, Cambridge, 1995!.
Yermack, David, 1996, Higher market valuation of companies with a small board of directors,Journal of Financial Economics 40, 185–211.
Involvement in the Selection of New Board Members 1853