Embed Size (px)
Citation preview

Corporate Ownership & Control / Volume 15, Issue 1, Fall 2017 Continued - 1
265
CEO LONG-TERM INCENTIVE PAY IN MERGERS AND ACQUISITIONS
Randy Beavers*
*Seattle Pacific University, Seattle, USA
1. INTRODUCTION
Mergers and acquisitions are an important part of a firm’s future. When these transactions fail, as with CEO Carly Fiorina in 2005 with the HP-Compaq transaction, the CEO is sometimes fired and company value declines. Is there a way to prevent this from happening through executive compensation incentives? Specifically, could using long-term incentive pay reduce the risk involved in this type of investment?
Long-term incentive plans (LTIP) encompass 60% or more of a median S&P 500 CEO’s compensation package. In the United States during the early 1980s, firms with LTIP had higher ROE than those without them. By 1985, almost all large companies had LTIP (Leonard, 1990). LTIP had an increase in usage in 2004 after the passage of SFAS 123R, which incentivized firms to move from employee stock options (ESOs) to restricted stock and LTIP (Brown and Lee, 2011). These conditional company shares distribute in two parts. The CEO
receives half of the shares immediately, followed by the remainder three years later. The CEO receives this portion only if he remains with the company, and the company continues to exist. One of the main differences between deferred equity compensation and pension plans is what occurs in the event of bankruptcy. The CEO receives a percentage of his pension upon company bankruptcy, but the deferred equity compensation value becomes zero since the remaining portion of shares becomes worthless. Thus, it is important to investigate the effects of delayed stock and option grants, since the majority of the literature has focused on immediate stock and option compensation (Agrawal and Mandelker, 1987; Agrawal and Nagarajan, 1990; Mehran, 1995; Guay, 1999; Core and Guay, 1999, 2002; Coles et al., 2006).
To gain further insight as to how inside debt can affect CEO investment and financing policy, this paper analyzes the significant investment decisions reflected in domestic M&A transactions from 1996 to 2005 for a total of 17,668 firm-year observations. Specifically, this paper studies the likelihood of
Abstract
How to cite this paper: Beavers, R.
(2017). CEO long-term incentive pay in
mergers and acquisitions. Corporate
Ownership & Control, 15(1-1), 265-276.
http://doi.org/10.22495/cocv15i1c1p10
Copyright © 2017 The Authors
This work is licensed under the Creative
Commons Attribution-NonCommercial
4.0 International License (CC BY-NC 4.0).
http://creativecommons.org/licenses/by
-nc/4.0/
ISSN Online: 1810-3057
ISSN Print: 1727-9232
Received: 29.06.2017 Accepted: 30.09.2017
JEL Classification: G34, M12
DOI: 10.22495/cocv15i1c1p10
This paper analyzes the CEO incentives of inside debt in the form of deferred equity compensation in the context of M&A decisions. This study runs statistical regressions on the likelihood of a merger, whether the deal is diversifying, how much stock is used to pay for the deal, and the relative deal size controlling for CEO long-term incentive pay as the main variable of interest and including controls for firm characteristics, merger characteristics, industry, and year. This paper sheds light on LTIP effects before compensation changes occur after an M&A event. This study uses archival data from 1996 to 2005 for the United States with data collected from CRSP, Compustat, and SDC Platinum. This is one of the first studies to focus on the United States. When firms with higher levels of CEO long-term incentive pay decide to engage in an acquisition, those acquisitions are non-diversifying, relatively smaller deals, and are paid using a greater portion of stock. The evidence indicates that long-term incentive pay incentivizes CEOs to make less risky decisions for the benefit of debt holders and at the expense of shareholders. In addition, deals made are not necessarily diversifying as once believed. Keywords: Executive Compensation, Inside Debt, Acquisitions and Mergers, Risk Management, Long-Term Incentive Plans Acknowledgements: The author thanks participants at the 2012 University of Alabama finance graduate seminar, the 2013 Midwest Finance Association annual meeting, the 2014 Eastern Finance Association annual meeting, Anup Agrawal, David Cicero, Sherwood Clements, Doug Cook, Tom Downs, Maximiliano Gonzalez, Junsoo Lee, Thomas Lopez, Robert McLeod, Shawn Mobbs, Deborah Smith, Shane Underwood, and anonymous referees.
Corporate Ownership & Control / Volume 15, Issue 1, Fall 2017 Continued - 1
266
making an acquisition along with various aspects of the investment decision such as diversification, payment, and relative deal value to understand better the role of inside debt on the decision-making process of a CEO.
These findings contribute to the literature in several ways. First, this paper further extends the literature on the use of CEO inside debt in executive compensation (Sundaram and Yermack, 2007; Wei and Yermack, 2011). CEO inside debt is becoming a larger portion of compensation, which makes it important to better understand how it incentives CEOs and their risk taking actions. Second, this paper extends the definition of investing activities outside the scope of R&D and working capital (Agrawal and Mandelker, 1987; Rauh, 2006; Cassell et al., 2012) by using another type of investment: M&A, which provides additional data and a more in-depth look at specific decisions a CEO can make. Third, this paper contributes to our understanding of LTIP in the United States. Other studies have focused on LTIP in other countries, such as Canada (Bodolica et al., 2007), Germany (Hinerlich, 2014), Great Britain (Stathopoulos et al., 2004; Ozkan, 2011), and South Africa (Bussin and Blair, 2015). Finally, this paper ties together CEO incentives in M&A (Lehn and Zhao (2006)) by using CEO inside debt versus stock (see Core and Guay, 1999). The relative proportion of stock options and inside debt used to pay the CEO will affect his incentives and decision-making on important M&A decisions.
The remainder of the paper proceeds as follows: section two provides a literature review from which hypotheses are developed and proposed. Section three describes the data and methodology used to create results in section four. Section five concludes.
2. LITERATURE REVIEW AND HYPOTHESIS DEVELOPMENT
The literature on executive compensation has largely concentrated on equity holdings. Pay-for-performance incentives align managerial interests with shareholders (Jensen and Murphy, 1990; Mehran, 1995), although boards in charge of this compensation tend to be reactive rather than proactive when it comes to dealing with agency issues (Bodolica and Spraggon, 2009). However, in recent years, the literature has expanded to include CEO debt holdings, such as deferred compensation and pensions, otherwise known as inside debt. Changes in LTIP are significantly associated with claims of other stakeholders, including customers and employees (Arora and Alam, 2005). Edmans and Liu (2010) point out that a CEO compensation scheme contains both equity and debt and therefore it is important to recognize the incentives arising from the debt component of their compensation. Consequently, a manager’s personal leverage, defined as debt over equity holdings, can greatly affect firm risk. For example, empirically, Rauh (2006) finds firms with largely defined benefit pension obligations are constrained and choose to invest less due to this extensive debt burden. The resulting reduction in investments implies the firm has fewer opportunities to fail; thus, the firm risk is reduced.
Cassell et al. (2012) expand the literature by focusing on CEO decisions concerning investments and financing. They find that large debt holdings by the CEO will lead him to reduce the firm risk for two reasons. First, if the CEO’s inside debt is greater than the CEO’s equity holdings; the CEO has a reduced incentive to increase wealth via stocks and stock
options. Since the CEO can increase stock value by taking on higher risk in order to reap higher returns, when inside debt is greater than the equity incentives, the CEO has incentive to reduce risk rather than increase it. Second, increasing deferred compensation increases the incentive for the CEO to make decisions which will make the firm last after his retirement or departure in order for him to be fully compensated in later periods. Thus, the CEO will make decisions to reduce the likelihood of bankruptcy and to increase the long-run viability of the firm. Consistent with this, Cassell et al. (2012) find increases in CEO inside debt reduce stock return volatility, a measure of firm risk. Mergers and Acquisitions represent a specific firm investment that can be risk increasing (Langetieg, 1978; Malatesta, 1983; Asquith, 1983; Roll, 1986; Agrawal et al., 1992; Anderson and Mandelker, 1993; Loughran and Vijh, 1997; Mitchell and Stafford, 1998). If greater inside debt predisposes a CEO to avoid risky firm investments, then the CEO can view the M&A as too risky, despite the potential of it yielding positive NPV.
Hypothesis 1: CEO LTIP are negatively associated with the likelihood of an M&A.
The CEO of acquiring firms can target similar firms in the same industry with the intention to reduce risk by reducing market competition or to further enhance the company’s current operations. Morck, Shleifer, and Vishny (1990) find returns to bidding shareholders are lower when firms diversify due to the reduction in risk. Firms deciding to branch out into other industries take on integration risk and increase the risk of potential failure if the venture does not work well with the current synergies of the firm. Conversely, future firm performance as measured by stock returns is higher for firms who have a within-industry acquisition (Uysal, 2011). Thus, the CEO will choose targets that can be more easily integrated and that can enhance the current operations of the company in the context of the acquiring firm’s current industry. This will lower the chance of firm bankruptcy and increase the likelihood his deferred compensation will be paid in the future.
Hypothesis 2: When firms with increasing levels of CEO LTIP decide to engage in an acquisition, those acquisitions are less likely to be diversifying.
Liquidity in the form of cash needs to be readily available for firms, especially for those with large debt obligations in the form of deferred compensation and pensions for executives. Thus, paying with cash or incurring additional debt to acquire a target is less attractive for CEOs with high inside debt and thus they likely prefer to acquire with stock in order to reduce the debt-to-equity ratio of the firm. This is an additional incentive for stock acquisitions beyond the stock being undervalued relative to the bidder (Shleifer and Vishny, 2003). Not incurring debt and acquiring with stock provides the firm with more liquidity and a potentially better credit rating, which reduces bankruptcy risk. One could also argue about tax incentives, but executive compensation in the form of salary, qualified stock, LTIP, and bonuses paid after retirement have little effect on marginal tax rates due to equality concerns (Frydman and Molloy, 2009).
Hypothesis 3: The acquisition payment in stock increases as CEO LTIP increases.
Finally, the target firm size is also related to integration risk as smaller firms are easier to integrate than are larger firms. This immediate short-term risk may drive CEOs to choose a smaller target so as to not jeopardize the livelihood of the
Corporate Ownership & Control / Volume 15, Issue 1, Fall 2017 Continued - 1
267
firm, since acquiring a larger firm can lead to long-run sustainability concerns if integration fails.
Hypothesis 4: CEO LTIP is negatively associated with relative acquiring deal values.
3. DATA AND METHODOLOGY
Executive compensation is obtained from Execucomp. The data is screened for only CEOs using the ceoann variable. Company financials are from the CRSP/Compustat merged database provided by WRDS. Merger and acquisition data are from Thomson Reuters SDC Platinum. Governance and board controls are from Risk Metrics. The following restrictions minimize the dataset. The transactions are domestic (U.S.) only. The announcement date must occur between 1996 and 2005. The acquirer must have public status. The deal must be completed and unconditional. The percent of shares owned before (after) the transaction must be less than (equal to) 50% (100%). The percent of shares the acquirer seeks to own must be equal to 100%. The deal value must be greater than 10 million. Two-digit SIC codes 49 (utilities) and 60-67 (financial firms) are excluded due to government regulation restrictions, especially on debt and equity issues. The final sample results in 17,668 firm-year observations with 3,872 merger or acquisition transactions.
Note, the security of the CEO debt (whether the pension is funded or guaranteed) is not considered here due to lack of data. This may affect the CEO’s riskiness if the debt is guaranteed, irrespective of the firm’s future existence. If this were the case, it would be easier to take a greater risk on the equity side. This would increase instead of mitigating the agency cost of debt, which is one reason to defer compensation. Secured debt would bias against my finding significant results. In data available after
2006 due to the U.S. Securities and Exchange Commission adopting changes to disclosure requirements concerning the summary compensation table, additional information is provided concerning whether executive pensions are unfunded and unsecured, like supplemental executive retirement plans (SERPs), whether funds are funded and secured, like rank-and-file (RAF) plans, or other deferred compensation (ODC) that can be invested in stock and withdrawn before retirement (Anantharaman et al. 2014).
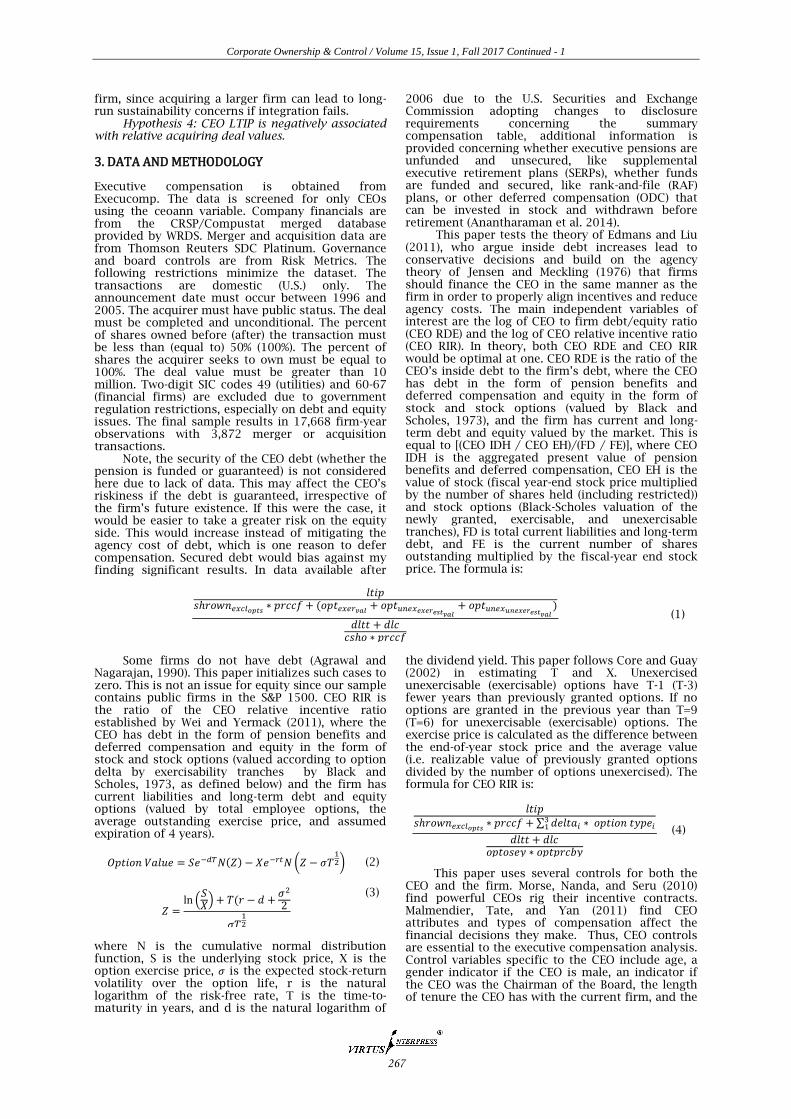
This paper tests the theory of Edmans and Liu (2011), who argue inside debt increases lead to conservative decisions and build on the agency theory of Jensen and Meckling (1976) that firms should finance the CEO in the same manner as the firm in order to properly align incentives and reduce agency costs. The main independent variables of interest are the log of CEO to firm debt/equity ratio (CEO RDE) and the log of CEO relative incentive ratio (CEO RIR). In theory, both CEO RDE and CEO RIR would be optimal at one. CEO RDE is the ratio of the CEO’s inside debt to the firm’s debt, where the CEO has debt in the form of pension benefits and deferred compensation and equity in the form of stock and stock options (valued by Black and Scholes, 1973), and the firm has current and long-term debt and equity valued by the market. This is equal to [(CEO IDH / CEO EH)/(FD / FE)], where CEO IDH is the aggregated present value of pension benefits and deferred compensation, CEO EH is the value of stock (fiscal year-end stock price multiplied by the number of shares held (including restricted)) and stock options (Black-Scholes valuation of the newly granted, exercisable, and unexercisable tranches), FD is total current liabilities and long-term debt, and FE is the current number of shares outstanding multiplied by the fiscal-year end stock price. The formula is:
(
)
(1)
Some firms do not have debt (Agrawal and
Nagarajan, 1990). This paper initializes such cases to zero. This is not an issue for equity since our sample contains public firms in the S&P 1500. CEO RIR is the ratio of the CEO relative incentive ratio established by Wei and Yermack (2011), where the CEO has debt in the form of pension benefits and deferred compensation and equity in the form of stock and stock options (valued according to option delta by exercisability tranches by Black and Scholes, 1973, as defined below) and the firm has current liabilities and long-term debt and equity options (valued by total employee options, the average outstanding exercise price, and assumed expiration of 4 years).
( ) ( ) (2)
n (
) (
2
(3)
where N is the cumulative normal distribution function, S is the underlying stock price, X is the option exercise price, is the expected stock-return volatility over the option life, r is the natural logarithm of the risk-free rate, T is the time-to-maturity in years, and d is the natural logarithm of
the dividend yield. This paper follows Core and Guay (2002) in estimating T and X. Unexercised unexercisable (exercisable) options have T-1 (T-3) fewer years than previously granted options. If no options are granted in the previous year than T=9 (T=6) for unexercisable (exercisable) options. The exercise price is calculated as the difference between the end-of-year stock price and the average value (i.e. realizable value of previously granted options divided by the number of options unexercised). The formula for CEO RIR is:
∑
(4)
This paper uses several controls for both the CEO and the firm. Morse, Nanda, and Seru (2010) find powerful CEOs rig their incentive contracts. Malmendier, Tate, and Yan (2011) find CEO attributes and types of compensation affect the financial decisions they make. Thus, CEO controls are essential to the executive compensation analysis. Control variables specific to the CEO include age, a gender indicator if the CEO is male, an indicator if the CEO was the Chairman of the Board, the length of tenure the CEO has with the current firm, and the
Corporate Ownership & Control / Volume 15, Issue 1, Fall 2017 Continued - 1
268
percent of shares the CEO owns (excluding options) relative to the entire market.
Carlson and Lazrak (2010) find a positive association between manager’s pay sensitivity in the form of cash to stock and the firm’s leverage ratios. Harford and Li (2007) find CEO wealth becomes insensitive to poor performance after a merger if board governance is weak. Control variables specific to the firm include a measure of size via the natural logarithm of assets, leverage defined as total firm debt scaled by total firm assets, contemporaneous and the lag of total shareholder return (including dividends), the G-index as a measure of governance (Gompers, Ishii, and Metrick, 2003), the age of the firm according to its IPO date, the board size, and the percentage of board members classified as independent from the firm. This paper uses Fama-French 48 industry classifications from Kenneth French’s website and year fixed effects to account for industry differences in valuation dispersion (Shleifer and Vishny, 2003).
Finally, merger variables include the value of the deal completed between the acquirer and target, the percentages of stock and cash used in the transaction, an indicator if the transaction is a merger of equals, an indicator if the target firm is private, public, or a subsidiary, interactions among public status and if the deal was completed completely in cash, an indicator if there were multiple bidders, an indicator if the target firm has
defensive provisions, an indicator if a tender offer is made, and an indicator if the M&A was unsolicited. The summary statistics are provided in Table 1.
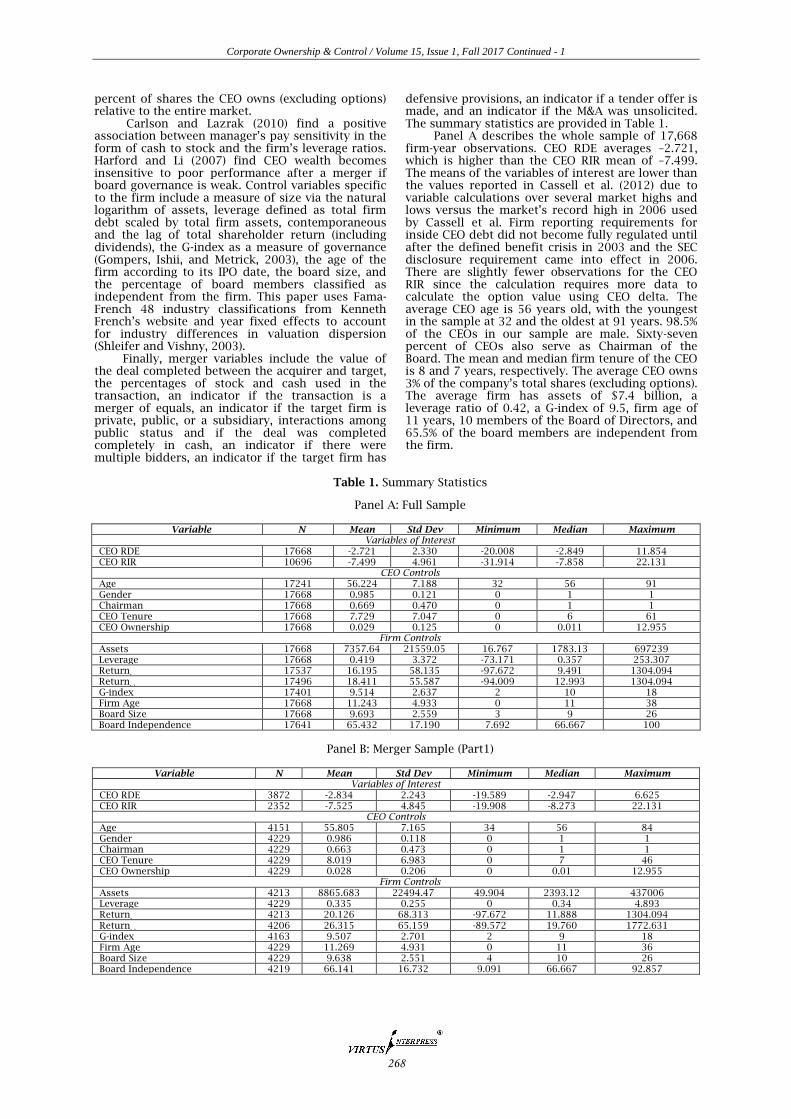
Panel A describes the whole sample of 17,668 firm-year observations. CEO RDE averages –2.721, which is higher than the CEO RIR mean of –7.499. The means of the variables of interest are lower than the values reported in Cassell et al. (2012) due to variable calculations over several market highs and lows versus the market’s record high in 2006 used by Cassell et al. Firm reporting requirements for inside CEO debt did not become fully regulated until after the defined benefit crisis in 2003 and the SEC disclosure requirement came into effect in 2006. There are slightly fewer observations for the CEO RIR since the calculation requires more data to calculate the option value using CEO delta. The average CEO age is 56 years old, with the youngest in the sample at 32 and the oldest at 91 years. 98.5% of the CEOs in our sample are male. Sixty-seven percent of CEOs also serve as Chairman of the Board. The mean and median firm tenure of the CEO is 8 and 7 years, respectively. The average CEO owns 3% of the company’s total shares (excluding options). The average firm has assets of $7.4 billion, a leverage ratio of 0.42, a G-index of 9.5, firm age of 11 years, 10 members of the Board of Directors, and 65.5% of the board members are independent from the firm.
Table 1. Summary Statistics
Panel A: Full Sample
Variable N Mean Std Dev Minimum Median Maximum Variables of Interest
CEO RDE 17668 -2.721 2.330 -20.008 -2.849 11.854 CEO RIR 10696 -7.499 4.961 -31.914 -7.858 22.131
CEO Controls Age 17241 56.224 7.188 32 56 91 Gender 17668 0.985 0.121 0 1 1 Chairman 17668 0.669 0.470 0 1 1 CEO Tenure 17668 7.729 7.047 0 6 61 CEO Ownership 17668 0.029 0.125 0 0.011 12.955
Firm Controls Assets 17668 7357.64 21559.05 16.767 1783.13 697239 Leverage 17668 0.419 3.372 -73.171 0.357 253.307 Return
t 17537 16.195 58.135 -97.672 9.491 1304.094
Returnt-1
17496 18.411 55.587 -94.009 12.993 1304.094 G-index 17401 9.514 2.637 2 10 18 Firm Age 17668 11.243 4.933 0 11 38 Board Size 17668 9.693 2.559 3 9 26 Board Independence 17641 65.432 17.190 7.692 66.667 100
Panel B: Merger Sample (Part1)
Variable N Mean Std Dev Minimum Median Maximum
Variables of Interest CEO RDE 3872 -2.834 2.243 -19.589 -2.947 6.625 CEO RIR 2352 -7.525 4.845 -19.908 -8.273 22.131
CEO Controls Age 4151 55.805 7.165 34 56 84 Gender 4229 0.986 0.118 0 1 1 Chairman 4229 0.663 0.473 0 1 1 CEO Tenure 4229 8.019 6.983 0 7 46 CEO Ownership 4229 0.028 0.206 0 0.01 12.955
Firm Controls Assets 4213 8865.683 22494.47 49.904 2393.12 437006 Leverage 4229 0.335 0.255 0 0.34 4.893 Return
t 4213 20.126 68.313 -97.672 11.888 1304.094
Returnt-1
4206 26.315 65.159 -89.572 19.760 1772.631 G-index 4163 9.507 2.701 2 9 18 Firm Age 4229 11.269 4.931 0 11 36 Board Size 4229 9.638 2.551 4 10 26 Board Independence 4219 66.141 16.732 9.091 66.667 92.857
Corporate Ownership & Control / Volume 15, Issue 1, Fall 2017 Continued - 1
269
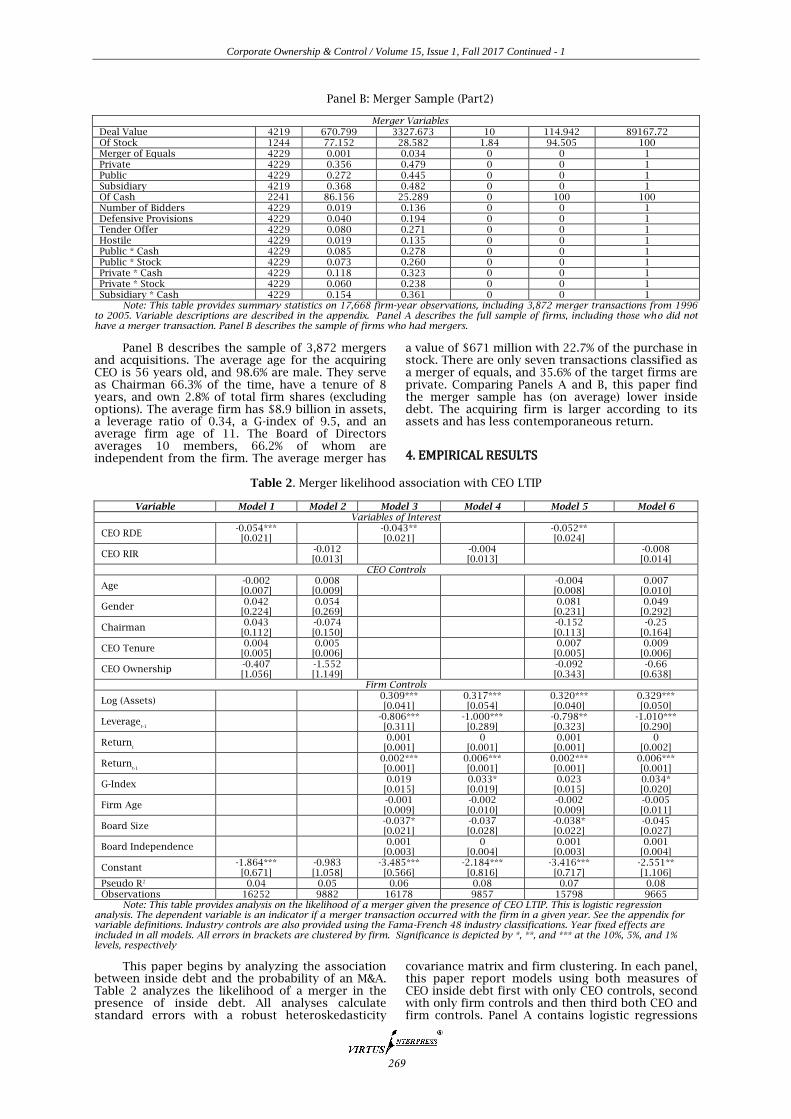
Panel B: Merger Sample (Part2)
Merger Variables Deal Value 4219 670.799 3327.673 10 114.942 89167.72 Of Stock 1244 77.152 28.582 1.84 94.505 100 Merger of Equals 4229 0.001 0.034 0 0 1 Private 4229 0.356 0.479 0 0 1 Public 4229 0.272 0.445 0 0 1 Subsidiary 4219 0.368 0.482 0 0 1 Of Cash 2241 86.156 25.289 0 100 100 Number of Bidders 4229 0.019 0.136 0 0 1 Defensive Provisions 4229 0.040 0.194 0 0 1 Tender Offer 4229 0.080 0.271 0 0 1 Hostile 4229 0.019 0.135 0 0 1 Public * Cash 4229 0.085 0.278 0 0 1 Public * Stock 4229 0.073 0.260 0 0 1 Private * Cash 4229 0.118 0.323 0 0 1 Private * Stock 4229 0.060 0.238 0 0 1 Subsidiary * Cash 4229 0.154 0.361 0 0 1
Note: This table provides summary statistics on 17,668 firm-year observations, including 3,872 merger transactions from 1996 to 2005. Variable descriptions are described in the appendix. Panel A describes the full sample of firms, including those who did not have a merger transaction. Panel B describes the sample of firms who had mergers.
Panel B describes the sample of 3,872 mergers and acquisitions. The average age for the acquiring CEO is 56 years old, and 98.6% are male. They serve as Chairman 66.3% of the time, have a tenure of 8 years, and own 2.8% of total firm shares (excluding options). The average firm has $8.9 billion in assets, a leverage ratio of 0.34, a G-index of 9.5, and an average firm age of 11. The Board of Directors averages 10 members, 66.2% of whom are independent from the firm. The average merger has
a value of $671 million with 22.7% of the purchase in stock. There are only seven transactions classified as a merger of equals, and 35.6% of the target firms are private. Comparing Panels A and B, this paper find the merger sample has (on average) lower inside debt. The acquiring firm is larger according to its assets and has less contemporaneous return.
4. EMPIRICAL RESULTS
Table 2. Merger likelihood association with CEO LTIP
Variable Model 1 Model 2 Model 3 Model 4 Model 5 Model 6 Variables of Interest
CEO RDE -0.054*** [0.021]
-0.043** [0.021]
-0.052** [0.024]
CEO RIR
-0.012 [0.013]
-0.004 [0.013]
-0.008 [0.014]
CEO Controls
Age -0.002 [0.007]
0.008 [0.009]
-0.004 [0.008]
0.007 [0.010]
Gender 0.042
[0.224] 0.054
[0.269] 0.081
[0.231] 0.049
[0.292]
Chairman 0.043
[0.112] -0.074 [0.150]
-0.152 [0.113]
-0.25 [0.164]
CEO Tenure 0.004
[0.005] 0.005
[0.006]
0.007 [0.005]
0.009 [0.006]
CEO Ownership -0.407 [1.056]
-1.552 [1.149]
-0.092 [0.343]
-0.66 [0.638]
Firm Controls
Log (Assets)
0.309*** [0.041]
0.317*** [0.054]
0.320*** [0.040]
0.329*** [0.050]
Leveraget-1
-0.806*** [0.311]
-1.000*** [0.289]
-0.798** [0.323]
-1.010*** [0.290]
Returnt
0.001
[0.001] 0
[0.001] 0.001
[0.001] 0
[0.002]
Returnt-1
0.002*** [0.001]
0.006*** [0.001]
0.002*** [0.001]
0.006*** [0.001]
G-Index
0.019 [0.015]
0.033* [0.019]
0.023 [0.015]
0.034* [0.020]
Firm Age
-0.001 [0.009]
-0.002 [0.010]
-0.002 [0.009]
-0.005 [0.011]
Board Size
-0.037* [0.021]
-0.037 [0.028]
-0.038* [0.022]
-0.045 [0.027]
Board Independence
0.001 [0.003]
0 [0.004]
0.001 [0.003]
0.001 [0.004]
Constant -1.864*** [0.671]
-0.983 [1.058]
-3.485*** [0.566]
-2.184*** [0.816]
-3.416*** [0.717]
-2.551** [1.106]
Pseudo R2 0.04 0.05 0.06 0.08 0.07 0.08 Observations 16252 9882 16178 9857 15798 9665
Note: This table provides analysis on the likelihood of a merger given the presence of CEO LTIP. This is logistic regression analysis. The dependent variable is an indicator if a merger transaction occurred with the firm in a given year. See the appendix for variable definitions. Industry controls are also provided using the Fama-French 48 industry classifications. Year fixed effects are included in all models. All errors in brackets are clustered by firm. Significance is depicted by *, **, and *** at the 10%, 5%, and 1% levels, respectively
This paper begins by analyzing the association between inside debt and the probability of an M&A. Table 2 analyzes the likelihood of a merger in the presence of inside debt. All analyses calculate standard errors with a robust heteroskedasticity
covariance matrix and firm clustering. In each panel, this paper report models using both measures of CEO inside debt first with only CEO controls, second with only firm controls and then third both CEO and firm controls. Panel A contains logistic regressions
Corporate Ownership & Control / Volume 15, Issue 1, Fall 2017 Continued - 1
270
of the full sample, where the dependent variable is an indicator if a merger occurred in the year. CEO RDE has a consistent and statistically negative coefficient in all models, which means higher CEO inside debt is associated with a lower probability of the firm initiating an acquisition. CEO RDE goes from -0.043 with only firm controls to -0.052 in the models with CEO controls only and both CEO and firm controls, respectively. CEO RIR is negative but statistically insignificant in all models. CEO RIR goes from -0.012 with only CEO controls to -0.004 with
only firm controls to -0.008 with both firm and CEO controls. The coefficient on Model 5 is interpreted as a 1 % increase in the standard deviation of the log of CEO RDE decreases the M&A propensity by 12.5%. Other controls indicate larger firms tend to acquire or merge less often than smaller size firms. Firms with higher shareholder returns in the current or previous year are more likely to acquire. Firms with more independent boards are more likely to engage in an M&A. In the full model with CEO RDE, 8 % of the variation is explained by the model.
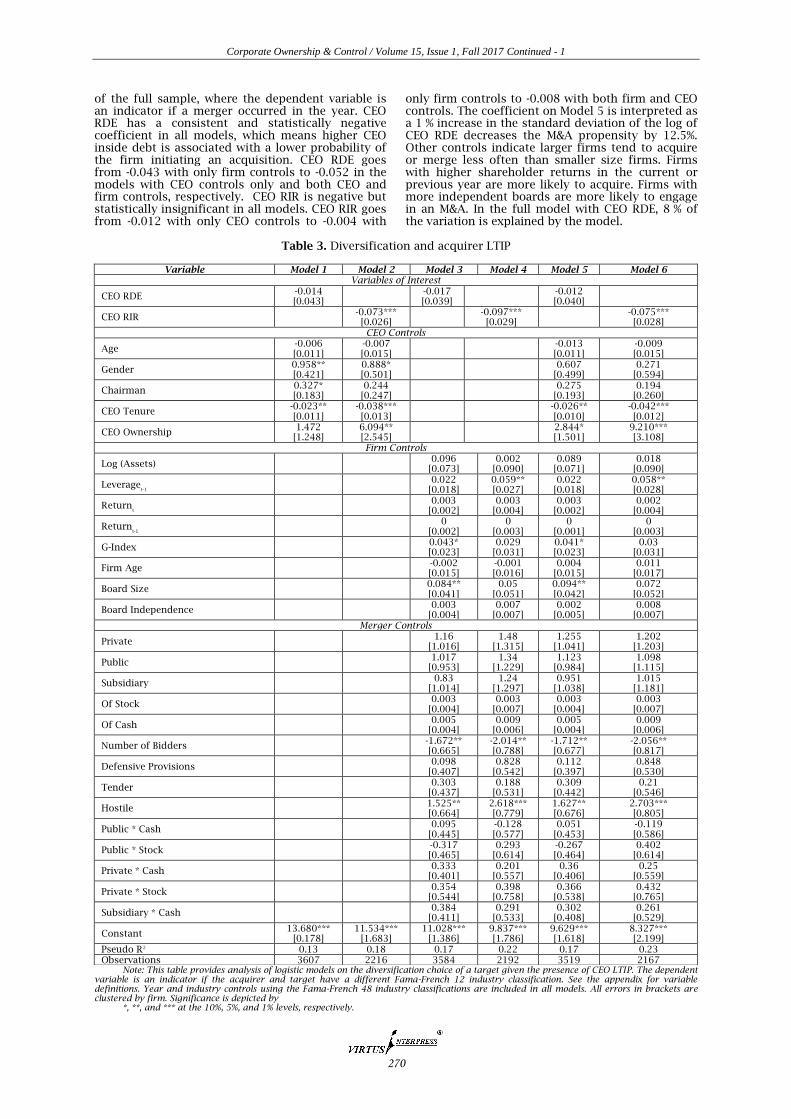
Table 3. Diversification and acquirer LTIP
Note: This table provides analysis of logistic models on the diversification choice of a target given the presence of CEO LTIP. The dependent variable is an indicator if the acquirer and target have a different Fama-French 12 industry classification. See the appendix for variable definitions. Year and industry controls using the Fama-French 48 industry classifications are included in all models. All errors in brackets are clustered by firm. Significance is depicted by
*, **, and *** at the 10%, 5%, and 1% levels, respectively.
Variable Model 1 Model 2 Model 3 Model 4 Model 5 Model 6 Variables of Interest
CEO RDE -0.014 [0.043]
-0.017 [0.039]
-0.012 [0.040]
CEO RIR
-0.073*** [0.026]
-0.097*** [0.029]
-0.075*** [0.028]
CEO Controls
Age -0.006 [0.011]
-0.007 [0.015]
-0.013 [0.011]
-0.009 [0.015]
Gender 0.958** [0.421]
0.888* [0.501]
0.607 [0.499]
0.271 [0.594]
Chairman 0.327* [0.183]
0.244 [0.247]
0.275 [0.193]
0.194 [0.260]
CEO Tenure -0.023** [0.011]
-0.038*** [0.013]
-0.026** [0.010]
-0.042*** [0.012]
CEO Ownership 1.472
[1.248] 6.094** [2.545]
2.844* [1.501]
9.210*** [3.108]
Firm Controls
Log (Assets)
0.096 [0.073]
0.002 [0.090]
0.089 [0.071]
0.018 [0.090]
Leveraget-1
0.022 [0.018]
0.059** [0.027]
0.022 [0.018]
0.058** [0.028]
Returnt
0.003
[0.002] 0.003
[0.004] 0.003
[0.002] 0.002
[0.004]
Returnt-1
0 [0.002]
0 [0.003]
0 [0.001]
0 [0.003]
G-Index
0.043* [0.023]
0.029 [0.031]
0.041* [0.023]
0.03 [0.031]
Firm Age
-0.002 [0.015]
-0.001 [0.016]
0.004 [0.015]
0.011 [0.017]
Board Size
0.084** [0.041]
0.05 [0.051]
0.094** [0.042]
0.072 [0.052]
Board Independence
0.003 [0.004]
0.007 [0.007]
0.002 [0.005]
0.008 [0.007]
Merger Controls
Private
1.16 [1.016]
1.48 [1.315]
1.255 [1.041]
1.202 [1.203]
Public
1.017 [0.953]
1.34 [1.229]
1.123 [0.984]
1.098 [1.115]
Subsidiary
0.83 [1.014]
1.24 [1.297]
0.951 [1.038]
1.015 [1.181]
Of Stock
0.003 [0.004]
0.003 [0.007]
0.003 [0.004]
0.003 [0.007]
Of Cash
0.005 [0.004]
0.009 [0.006]
0.005 [0.004]
0.009 [0.006]
Number of Bidders
-1.672** [0.665]
-2.014** [0.788]
-1.712** [0.677]
-2.056** [0.817]
Defensive Provisions
0.098 [0.407]
0.828 [0.542]
0.112 [0.397]
0.848 [0.530]
Tender
0.303 [0.437]
0.188 [0.531]
0.309 [0.442]
0.21 [0.546]
Hostile
1.525** [0.664]
2.618*** [0.779]
1.627** [0.676]
2.703*** [0.805]
Public * Cash
0.095 [0.445]
-0.128 [0.577]
0.051 [0.453]
-0.119 [0.586]
Public * Stock
-0.317 [0.465]
0.293 [0.614]
-0.267 [0.464]
0.402 [0.614]
Private * Cash
0.333 [0.401]
0.201 [0.557]
0.36 [0.406]
0.25 [0.559]
Private * Stock
0.354 [0.544]
0.398 [0.758]
0.366 [0.538]
0.432 [0.765]
Subsidiary * Cash
0.384 [0.411]
0.291 [0.533]
0.302 [0.408]
0.261 [0.529]
Constant 13.680***
[0.178] 11.534***
[1.683] 11.028***
[1.386] 9.837*** [1.786]
9.629*** [1.618]
8.327*** [2.199]
Pseudo R2 0.13 0.18 0.17 0.22 0.17 0.23 Observations 3607 2216 3584 2192 3519 2167
Corporate Ownership & Control / Volume 15, Issue 1, Fall 2017 Continued - 1
271
The next series of tests analyze specific merger decisions. Table 3 presents logistic regressions of diversification. The dependent variable is an indicator of diversification using two-digit SIC codes. If the acquiring firm and target firm have a different two-digit SIC code, the indicator becomes a one, zero otherwise. Independent variables are inside debt measures and controls pertaining to the CEO, firm, and the merger itself. The Pseudo-R2 of all regressions falls between 13 % and 23 %. This paper finds CEO RIR is negative and statistically significant at the 1 % level for all models. A one-percent increase in CEO RIR decreases the likelihood of diversification by 6.4 %. Thus, firms who pay their CEOs with more inside debt tend to err on the side
of synergy versus diversification in improving the firm through M&A investment. Firms with CEOs who have lower tenure and more ownership tend to diversify more. Firms with higher lagged leverage, a higher g-index, and more members on the board tend to choose targets with a different two-digit SIC. Acquirers tend to use less cash for diversifying mergers, and they choose subsidiaries to gain diversification benefits. In unreported results, this paper tests diversification using other measures, such as Fama-French 12 and 48 industry classifications, as well as one-digit, three-digit, and four-digit SIC codes. This paper finds similar results for CEO RDE using FF12 and CEO RIR using FF48, one-digit, three-digit, and four-digit SIC codes.
Table 4. Stock payment in the presence of CEO LTIP
Variable Model 1 Model 2 Model 3 Model 4 Model 5 Model 6
Variables of Interest
CEO RDE 7.692*** [1.018]
3.720*** [0.816]
6.235*** [0.866]
CEO RIR
-1.047** [0.469]
1.179*** [0.407]
1.106*** [0.394]
CEO Controls
Age -1.386*** [0.091]
-0.452*** [0.100]
0.632*** [0.082]
0.834*** [0.087]
Gender -4.88
[5.136] -26.363***
[5.765] 13.580***
[4.669] 1.883
[5.033]
Chairman -10.682**
[4.569] -17.706***
[5.263] -17.794***
[3.937] -36.054***
[4.320]
CEO Tenure 0.835*** [0.295]
0.851** [0.351]
0.911*** [0.245]
0.765*** [0.287]
CEO Ownership -7.407* [4.141]
-88.602** [43.550]
9.999*** [2.136]
194.970*** [26.808]
Firm Controls
Log (Assets)
-13.571*** [0.542]
-1.431** [0.560]
-13.545*** [0.562]
0.505 [0.563]
Leveraget-1
20.947** [8.270]
4.215 [3.246]
21.206** [8.433]
4.622 [4.365]
Returnt
-0.053*** [0.012]
-0.003 [0.041]
-0.045*** [0.012]
0.02 [0.040]
Returnt-1
0.224*** [0.018]
0.457*** [0.046]
0.238*** [0.019]
0.427*** [0.048]
G-Index
-1.344*** [0.425]
1.546*** [0.445]
-0.981** [0.439]
1.707*** [0.445]
Firm Age
1.321*** [0.303]
-0.017 [0.358]
0.864*** [0.317]
-0.325 [0.363]
Board Size
0.822* [0.425]
3.794*** [0.429]
0.822* [0.438]
4.162*** [0.428]
Board Independence
-0.339*** [0.062]
-0.439*** [0.068]
-0.223*** [0.065]
-0.192*** [0.068]
Merger Controls
Merger of Equals
206.619*** [7.154]
98.755*** [8.538]
216.099*** [7.266]
105.862*** [8.944]
Private
94.427*** [3.578]
555.064*** [3.444]
88.567*** [3.810]
548.918*** [3.637]
Public
223.531*** [3.416]
671.637*** [3.875]
222.126*** [3.586]
671.648*** [3.997]
Subsidiary
-1.24 [4.556]
481.653*** [5.728]
-5.99 [4.541]
476.030*** [5.394]
Number of Bidders
48.438*** [6.361]
75.176*** [7.138]
41.777*** [6.500]
76.515*** [7.137]
Defensive Provisions
79.213*** [3.761]
63.086*** [3.989]
75.995*** [3.806]
62.832*** [3.981]
Tender
-232.087*** [4.041]
-196.590*** [4.791]
-232.598*** [4.072]
-194.381*** [4.820]
Hostile
20.794*** [8.032]
24.941*** [8.974]
22.705*** [8.086]
21.137** [8.893]
Constant -932.899***
[5.175] -714.966***
[5.824] -695.363***
[4.512] -1,088.571***
[5.027] -746.446***
[4.704] -1,200.457***
[5.064] Pseudo R2 0.05 0.07 0.13 0.16 0.13 0.16 Observations 3607 2216 3584 2192 3519 2167
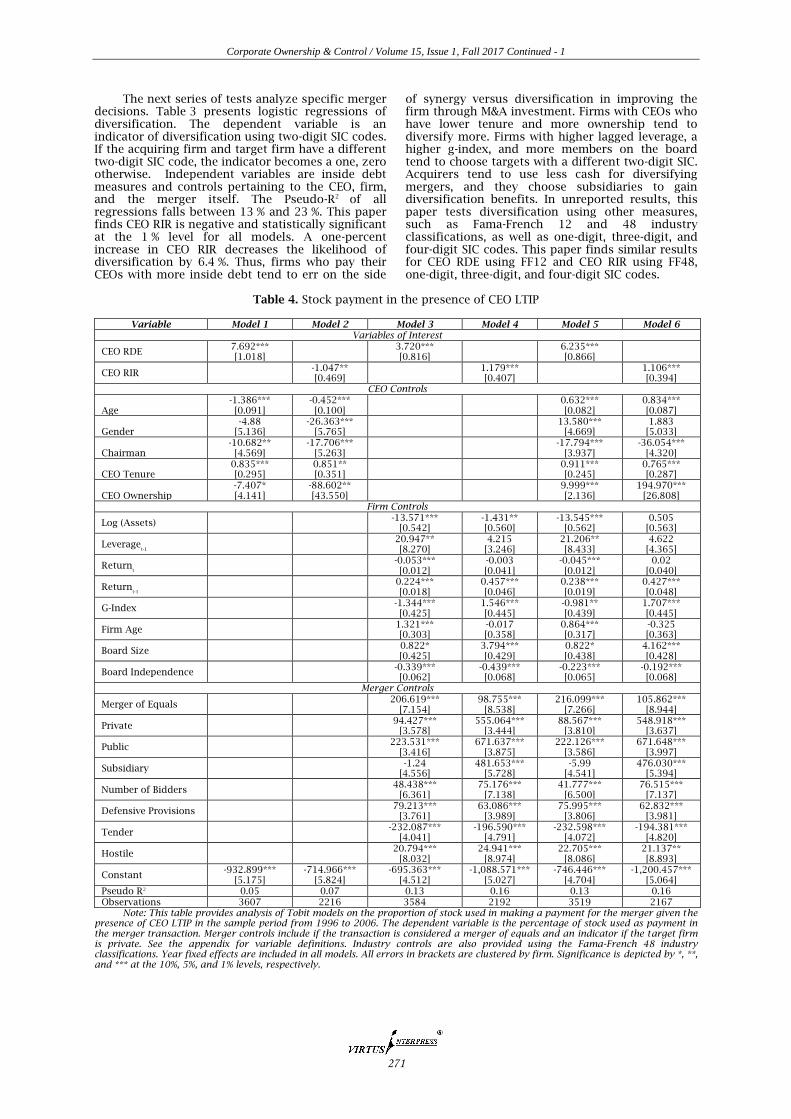
Note: This table provides analysis of Tobit models on the proportion of stock used in making a payment for the merger given the presence of CEO LTIP in the sample period from 1996 to 2006. The dependent variable is the percentage of stock used as payment in the merger transaction. Merger controls include if the transaction is considered a merger of equals and an indicator if the target firm is private. See the appendix for variable definitions. Industry controls are also provided using the Fama-French 48 industry classifications. Year fixed effects are included in all models. All errors in brackets are clustered by firm. Significance is depicted by *, **, and *** at the 10%, 5%, and 1% levels, respectively.
Corporate Ownership & Control / Volume 15, Issue 1, Fall 2017 Continued - 1
272
The next merger decision involves the proportion of acquisition payment in stock. Table 4 analyzes inside debt on the firm’s decisions of how to pay for the merger or acquisition using double-sided censored Tobit regressions since some firms cannot use stock due to a low supply or other firm constraints. The upper and lower limits are 100% and 0%, respectively. In this analysis, this paper does not include proportions of stock and cash or interactions between them and the public status indicators due to multicollinearity concerns. In the full specifications, this paper finds both CEO RDE and CEO RIR are statistically positive and significant at the 1 % level. A one-standard deviation increase in CEO RDE (CEO RIR) increases the proportion of stock used by 12.2 % (5.2 %). With respect to the full models, CEOs are more likely to use stock if they are older, male, not the Chairman, have more tenure, and own more stock in the company. Firms are more likely to use stock to pay for an M&A if lagged leverage is higher, the contemporaneous return is lower, lagged return is higher, board size is larger, and board independence is lower. Acquisitions are more likely to have stock payments if the M&A is a merger of equal, has more bidders and defensive provisions, and is considered hostile. The stock is used to acquiring private and subsidiary targets, whereas cash is preferred for public acquisitions.
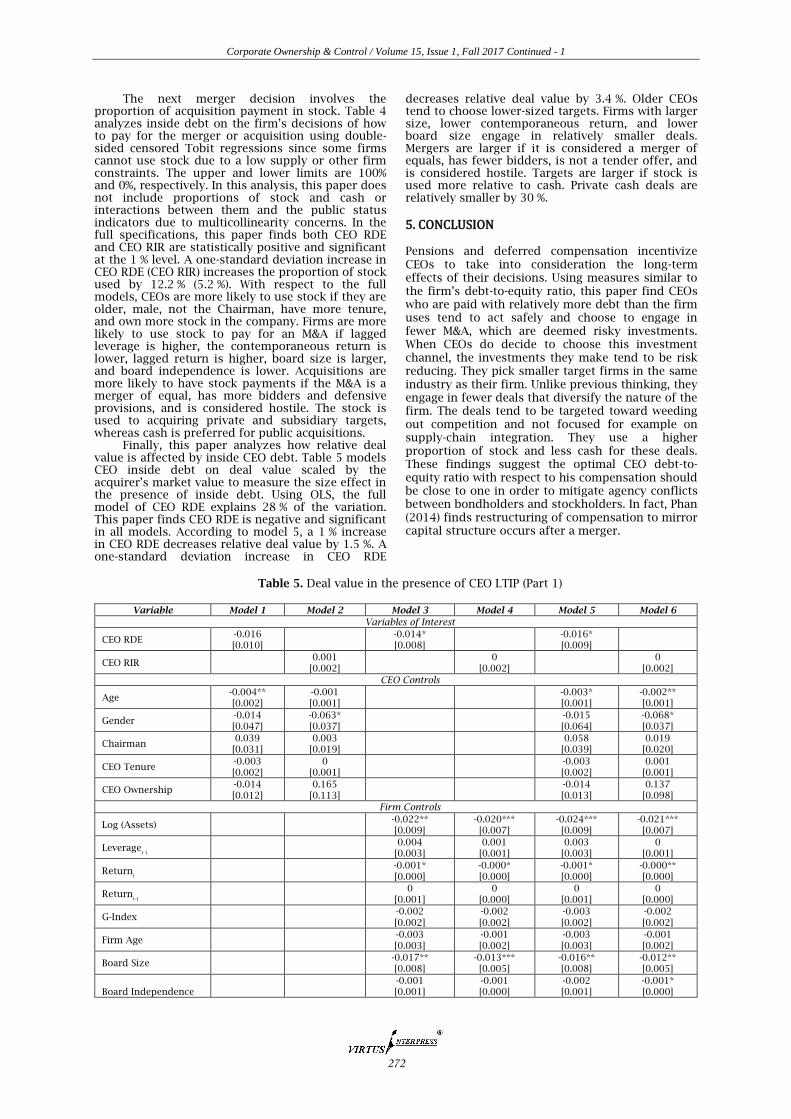
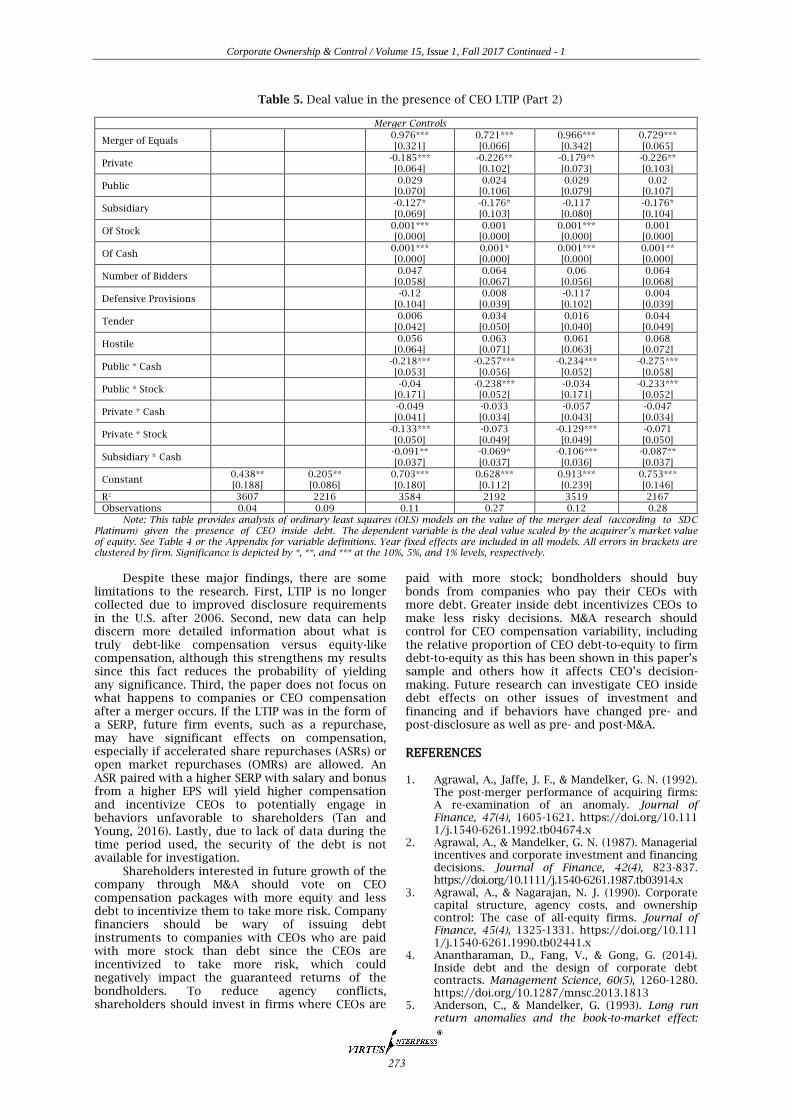
Finally, this paper analyzes how relative deal value is affected by inside CEO debt. Table 5 models CEO inside debt on deal value scaled by the acquirer’s market value to measure the size effect in the presence of inside debt. Using OLS, the full model of CEO RDE explains 28 % of the variation. This paper finds CEO RDE is negative and significant in all models. According to model 5, a 1 % increase in CEO RDE decreases relative deal value by 1.5 %. A one-standard deviation increase in CEO RDE
decreases relative deal value by 3.4 %. Older CEOs tend to choose lower-sized targets. Firms with larger size, lower contemporaneous return, and lower board size engage in relatively smaller deals. Mergers are larger if it is considered a merger of equals, has fewer bidders, is not a tender offer, and is considered hostile. Targets are larger if stock is used more relative to cash. Private cash deals are relatively smaller by 30 %.
5. CONCLUSION
Pensions and deferred compensation incentivize CEOs to take into consideration the long-term effects of their decisions. Using measures similar to the firm’s debt-to-equity ratio, this paper find CEOs who are paid with relatively more debt than the firm uses tend to act safely and choose to engage in fewer M&A, which are deemed risky investments. When CEOs do decide to choose this investment channel, the investments they make tend to be risk reducing. They pick smaller target firms in the same industry as their firm. Unlike previous thinking, they engage in fewer deals that diversify the nature of the firm. The deals tend to be targeted toward weeding out competition and not focused for example on supply-chain integration. They use a higher proportion of stock and less cash for these deals. These findings suggest the optimal CEO debt-to-equity ratio with respect to his compensation should be close to one in order to mitigate agency conflicts between bondholders and stockholders. In fact, Phan (2014) finds restructuring of compensation to mirror capital structure occurs after a merger.
Table 5. Deal value in the presence of CEO LTIP (Part 1)
Variable Model 1 Model 2 Model 3 Model 4 Model 5 Model 6
Variables of Interest
CEO RDE -0.016 [0.010]
-0.014* [0.008]
-0.016* [0.009]
CEO RIR
0.001
[0.002]
0
[0.002]
0
[0.002]
CEO Controls
Age -0.004** [0.002]
-0.001 [0.001]
-0.003* [0.001]
-0.002** [0.001]
Gender -0.014 [0.047]
-0.063* [0.037]
-0.015 [0.064]
-0.068* [0.037]
Chairman 0.039
[0.031] 0.003
[0.019] 0.058
[0.039] 0.019
[0.020]
CEO Tenure -0.003 [0.002]
0 [0.001]
-0.003 [0.002]
0.001 [0.001]
CEO Ownership -0.014 [0.012]
0.165 [0.113]
-0.014 [0.013]
0.137 [0.098]
Firm Controls
Log (Assets)
-0.022** [0.009]
-0.020*** [0.007]
-0.024*** [0.009]
-0.021*** [0.007]
Leveraget-1
0.004 [0.003]
0.001 [0.001]
0.003 [0.003]
0 [0.001]
Returnt
-0.001* [0.000]
-0.000* [0.000]
-0.001* [0.000]
-0.000** [0.000]
Returnt-1
0 [0.001]
0 [0.000]
0 [0.001]
0 [0.000]
G-Index
-0.002
[0.002]
-0.002
[0.002]
-0.003
[0.002]
-0.002
[0.002]
Firm Age
-0.003 [0.003]
-0.001 [0.002]
-0.003 [0.003]
-0.001 [0.002]
Board Size
-0.017** [0.008]
-0.013*** [0.005]
-0.016** [0.008]
-0.012** [0.005]
Board Independence
-0.001 [0.001]
-0.001 [0.000]
-0.002 [0.001]
-0.001* [0.000]
Corporate Ownership & Control / Volume 15, Issue 1, Fall 2017 Continued - 1
273
Table 5. Deal value in the presence of CEO LTIP (Part 2)
Merger Controls
Merger of Equals
0.976*** [0.321]
0.721*** [0.066]
0.966*** [0.342]
0.729*** [0.065]
Private
-0.185*** [0.064]
-0.226** [0.102]
-0.179** [0.073]
-0.226** [0.103]
Public
0.029 [0.070]
0.024 [0.106]
0.029 [0.079]
0.02 [0.107]
Subsidiary
-0.127* [0.069]
-0.176* [0.103]
-0.117 [0.080]
-0.176* [0.104]
Of Stock
0.001*** [0.000]
0.001 [0.000]
0.001*** [0.000]
0.001 [0.000]
Of Cash
0.001*** [0.000]
0.001* [0.000]
0.001*** [0.000]
0.001** [0.000]
Number of Bidders
0.047 [0.058]
0.064 [0.067]
0.06 [0.056]
0.064 [0.068]
Defensive Provisions
-0.12 [0.104]
0.008 [0.039]
-0.117 [0.102]
0.004 [0.039]
Tender
0.006 [0.042]
0.034 [0.050]
0.016 [0.040]
0.044 [0.049]
Hostile
0.056 [0.064]
0.063 [0.071]
0.061 [0.063]
0.068 [0.072]
Public * Cash
-0.218*** [0.053]
-0.257*** [0.056]
-0.234*** [0.052]
-0.275*** [0.058]
Public * Stock
-0.04 [0.171]
-0.238*** [0.052]
-0.034 [0.171]
-0.233*** [0.052]
Private * Cash
-0.049 [0.041]
-0.033 [0.034]
-0.057 [0.043]
-0.047 [0.034]
Private * Stock
-0.133*** [0.050]
-0.073 [0.049]
-0.129*** [0.049]
-0.071 [0.050]
Subsidiary * Cash
-0.091** [0.037]
-0.069* [0.037]
-0.106*** [0.036]
-0.087** [0.037]
Constant 0.438** [0.188]
0.205** [0.086]
0.703*** [0.180]
0.628*** [0.112]
0.913*** [0.239]
0.753*** [0.146]
R2 3607 2216 3584 2192 3519 2167
Observations 0.04 0.09 0.11 0.27 0.12 0.28
Note: This table provides analysis of ordinary least squares (OLS) models on the value of the merger deal (according to SDC Platinum) given the presence of CEO inside debt. The dependent variable is the deal value scaled by the acquirer’s market value of equity. See Table 4 or the Appendix for variable definitions. Year fixed effects are included in all models. All errors in brackets are clustered by firm. Significance is depicted by *, **, and *** at the 10%, 5%, and 1% levels, respectively.
Despite these major findings, there are some
limitations to the research. First, LTIP is no longer collected due to improved disclosure requirements in the U.S. after 2006. Second, new data can help discern more detailed information about what is truly debt-like compensation versus equity-like compensation, although this strengthens my results since this fact reduces the probability of yielding any significance. Third, the paper does not focus on what happens to companies or CEO compensation after a merger occurs. If the LTIP was in the form of a SERP, future firm events, such as a repurchase, may have significant effects on compensation, especially if accelerated share repurchases (ASRs) or open market repurchases (OMRs) are allowed. An ASR paired with a higher SERP with salary and bonus from a higher EPS will yield higher compensation and incentivize CEOs to potentially engage in behaviors unfavorable to shareholders (Tan and Young, 2016). Lastly, due to lack of data during the time period used, the security of the debt is not available for investigation.
Shareholders interested in future growth of the company through M&A should vote on CEO compensation packages with more equity and less debt to incentivize them to take more risk. Company financiers should be wary of issuing debt instruments to companies with CEOs who are paid with more stock than debt since the CEOs are incentivized to take more risk, which could negatively impact the guaranteed returns of the bondholders. To reduce agency conflicts, shareholders should invest in firms where CEOs are
paid with more stock; bondholders should buy bonds from companies who pay their CEOs with more debt. Greater inside debt incentivizes CEOs to make less risky decisions. M&A research should control for CEO compensation variability, including the relative proportion of CEO debt-to-equity to firm debt-to-equity as this has been shown in this paper’s sample and others how it affects CEO’s decision-making. Future research can investigate CEO inside debt effects on other issues of investment and financing and if behaviors have changed pre- and post-disclosure as well as pre- and post-M&A.
REFERENCES 1. Agrawal, A., Jaffe, J. F., & Mandelker, G. N. (1992).
The post-merger performance of acquiring firms: A re-examination of an anomaly. Journal of Finance, 47(4), 1605-1621. https://doi.org/10.111 1/j.1540-6261.1992.tb04674.x
2. Agrawal, A., & Mandelker, G. N. (1987). Managerial incentives and corporate investment and financing decisions. Journal of Finance, 42(4), 823-837. https://doi.org/10.1111/j.1540-6261.1987.tb03914.x
3. Agrawal, A., & Nagarajan, N. J. (1990). Corporate capital structure, agency costs, and ownership control: The case of all-equity firms. Journal of Finance, 45(4), 1325-1331. https://doi.org/10.111 1/j.1540-6261.1990.tb02441.x
4. Anantharaman, D., Fang, V., & Gong, G. (2014). Inside debt and the design of corporate debt contracts. Management Science, 60(5), 1260-1280. https://doi.org/10.1287/mnsc.2013.1813
5. Anderson, C., & Mandelker, G. (1993). Long run return anomalies and the book-to-market effect:
Corporate Ownership & Control / Volume 15, Issue 1, Fall 2017 Continued - 1
274
Evidence on mergers and IPOs. (Unpublished Working Paper). University of Pittsburgh
6. Arora, A., & Alam, P. (2005). CEO Compensation and stakeholders’ claims. Contemporary Accounting Research, 22(3), 519-547. https://doi.org /10.1506/8DLT-1RHN-WGBB-CHTM
7. Asquith, P. (1983). Merger bids, uncertainty, and stockholder returns. Journal of Financial Economics, 11(1-4), 51-83. https://doi.org/ 10.1016/0304-405X(83)90005-3
8. Bodolica, V., Magnan, M., & Spraggon, M. (2007). Merger and acquisition related determinants of executive compensation arrangements’ adoption. International Journal of Business Governance and Ethics, 3(4), 407-429. https://doi.org/10.1504 /IJBGE.2007.015209
9. Bodolica, V., & Spraggon, M. (2009). The implementation of special attributes of CEO compensation contracts around M&A transactions. Strategic Management Journal, 30(9), 985-1011. https://doi.org/10.1002/smj.779
10. Black, F., & Scholes, M. (1973). Pricing of options and corporate liabilities. Journal of Political Economy, 81, 637-654. https://doi.org/10.1086 /260062
11. Brown, L., & Lee, Y. (2011). Changes in option-based compensation around the issuance of SFAS 123R. Journal of Business Finance and Accounting, 38 (9-10), 1053-1095. https://doi.org/10.1111 /j.1468-5957.2011.02247.x
12. Bussin, M., & Blair, C. (2015). Financial indicators of company performance in different industries that affect CEO remuneration in South Africa. South African Journal of Economic and Management Sciences, N.S., 18(4), 534-550.
13. Carlson, M., & Lazrak, A. (2010). Leverage choice and credit spreads when managers risk shift. Journal of Finance, 65(6), 2323-2362. https://doi.org/10.1111/j.1540-6261.2010.01617.x
14. Cassell, C. A., Huang, S. X., Manuel Sanchez, J., & Stuart, M. D. (2012). Seeking safety: The relation between CEO inside debt holdings and the riskiness of firm investment and financial policies. Journal of Financial Economics, 103(3), 588-610. https://doi.org/10.1016/j.jfineco.2011.10.008
15. Coles, J. L., Daniel, N. D., & Naveen, L. (2006). Managerial incentives and risk-taking. Journal of Financial Economics, 79(2), 431-468. https://doi.org /10.1016/j.jfineco.2004.09.004
16. Core, J., & Guay, W. (2002). Estimating the value of employee stock option portfolios and their sensitivities to price and volatility. Journal of Accounting Research, 40(3), 613-630. https://doi.org/10.1111/1475-679X.00064
17. Core, J., & Guay, W. (1999). The use of equity grants to manage optimal equity incentive levels. Journal of Accounting and Economics, 28(2), 151-184. https://doi.org/10.1016/S0165-4101(99)00019-1
18. Edmans, A., Gabaix, X., & Landier, A. (2009). A multiplicative model of optimal CEO incentives in market equilibrium. Review of Financial Studies, 22 (12), 4881-4917. https://doi.org/10.1093/rfs/hhn 117
19. Edmans, A., & Liu, Q. (2011). Inside debt. Review of Finance, 15(1), 75-102. https://doi.org/10.1093/ rof/rfq008
20. Frydman, C., & Molloy, R. (2009). Does tax policy affect executive compensation? Evidence from postwar tax reforms. Board of Governors of the Federal Reserve System (U.S.). Finance and Economics Discussion Series, 2009-30. 1-37.
21. Gompers, P., Ishii, J., & Metrick, A. (2003). Corporate governance and equity prices. The
Quarterly Journal of Economics, 1, 107. https://doi.org/10.1162/00335530360535162
22. Grant, J., Markarian, G., & Parbonetti, A. (2009). CEO risk-related incentives and income smoothing. Contemporary Accounting Research, 26(4), 1029-1065. https://doi.org/10.1506/car. 26.4.2
23. Guay, W. R. (1999). The sensitivity of CEO wealth to equity risk: An analysis of the magnitude and determinants. Journal of Financial Economics, 53(1), 43-71. https://doi.org/10.1016/S0304-405 X(99)00016-1
24. Harford, J. (1999). Corporate cash reserves and acquisitions. Journal of Finance, 54(6), 1969-1997. https://doi.org/10.1111/0022-1082.00179
25. Harford, J., & Li, K. (2007). Decoupling CEO wealth and firm performance: The case of acquiring CEOs. Journal of Finance, 62(2), 917-949. https://doi.org/10.1111/j.1540-6261.2007.01227.x
26. Hinderlich, B. (2014). Incentives – Effectiveness and Efficiency. Journal of Governance and Regulation, 3(1), 7-27. https://doi.org/10.22495/ jgr_v3_i1_p1
27. Jensen, M. C., & Meckling, W. H. (1976). Theory of the firm: Managerial behavior, agency costs and ownership structure. Journal of Financial Economics, 3(4), 305-360. https://doi.org/10.1016/ 0304-405X(76)90026-X
28. Jensen, M. C., & Murphy, K. J. (1990). Performance pay and top-management incentives. Journal of Political Economy, 98(2), 225-264. https://doi.org/ 10.1086/261677
29. Langetieg, T. C. (1978). An application of a three-factor performance index to measure stockholder gains from merger. Journal of Financial Economics, 6(4), 365-383. https://doi.org/10.1016/0304-405X(78)90010-7
30. Lehn, K. M., & Zhao, M. (2006). CEO turnover after acquisitions: Are bad bidders fired? Journal of Finance, 61(4), 1759-1811. https://doi.org/ 10.1111/j.1540-6261.2006.00889.x
31. Leonard, J. S. (1990). Executive pay and firm performance. Industrial and Labor Relations Review, 43(3), 13-29. https://doi.org/10.2307/ 2523569
32. Lin, C., Officer, M. S., & Shen, B. (2017). Managerial risk-taking incentives and merger decisions. Retrieved from SSRN: https://ssrn.com/ abstract= 2233826. http://dx.doi.org/10.2139/ssrn.2233826
33. Liu, Y., Mauer, D. C., & Zhang, Y. (2012). Merger decisions and inside debt. Retrieved from SSRN: https://ssrn.com/abstract=2170895. http://dx.doi.org/10.2139/ssrn.2170895
34. Liu, Y., Mauer, D. C., & Zhang, Y. (2014). Firm cash holdings and CEO inside debt. Journal of Banking and Finance, 42(1), 83-100. https://doi.org /10.1016/j.jbankfin.2014.01.031
35. Loughran, T., & Vijh, A. M. (1997). Do long‐term shareholders benefit from corporate acquisitions? The Journal of Finance, 52(5), 1765-1790. https://doi.org/10.1111/j.1540-6261.1997.tb02741.x
36. Malatesta, P. (1983). The wealth effect of merger activity and the objective functions of merging firms. Journal of Financial Economics, 11(1-4), 155-181, https://EconPapers.repec.org/RePEc:eee:jfine c:v:11:y:1983:i:1-4:p:155-181.
37. Malmendier, U., Tate, G., & Yan, J. (2011). Overconfidence and early-life experiences: the effect of managerial traits on corporate financial policies. Journal of Finance, 66(5), 1687-1733. https://doi.org/10.1111/j.1540-6261.2011.01685.x
38. Mann, H. B., & Whitney, D. R. (1947). On a test of whether one of two random variables is stochastically larger than the other. The Annals of
Corporate Ownership & Control / Volume 15, Issue 1, Fall 2017 Continued - 1
275
Mathematical Statistics, (1), 50-60. https://doi.org /10.1214/aoms/1177730491
39. Mehran, H. (1995). Executive compensation structure, ownership, and firm performance. Journal of Financial Economics, 38(2), 163-184. https://doi.org/10.1016/0304-405X(94)00809-F
40. Mitchell, M. L., & Stafford, E. (2000). Managerial decisions and long-term stock price performance. Journal of Business, 73(3), 287-329. https://doi.org/ 10.1086/209645
41. Morck, R., Shleifer, A., & Vishny, R.W. (1990). Do managerial objectives drive bad acquisitions? Journal of Finance, 45(1), 31-48. https://doi.org/10.1111/j.1540-6261.1990.tb05079.x
42. Morse, A., Nanda, V., & Seru, A. (2011). Are incentive contracts rigged by powerful CEOs? Journal of Finance, 66(5), 1779-1821. https://doi.org/10.1111/j.1540-6261.2011.01687.x
43. Ozkan, N. (2011). CEO compensation and firm performance: An empirical investigation of UK panel data. European Financial Management, 17(2), 260-285. https://doi.org/10.1111/j.1468-036X.2009.00511.x
44. Pearson, K. (1900). X. On the criterion that a given system of deviations from the probable in the case of a correlated system of variables is such that it can be reasonably supposed to have arisen from random sampling. The London, Edinburgh, and Dublin Philosophical Magazine and Journal of Science, 50(302), 157-175.
45. Phan, H. (2014). Inside debt and mergers and acquisitions. Journal of Financial and Quantitative Analysis, 49(5-6), 1365-1401. https://doi.org/ 10.1017/S0022109014000593
46. Rauh, J. D. (2006). Investment and financing constraints: Evidence from the funding of corporate pension plans. Journal of Finance, 61(1), 33-71. https://doi.org/10.1111/j.1540-6261.2006. 00829.x
47. Roll, R. (1986). The hubris hypothesis of corporate takeovers. Journal of Business, 59(2), 197-216. https://doi.org/10.1086/296325
48. Shleifer, A., & Vishny, R.W. (2003). Stock market driven acquisitions. Journal of Financial Economics, 70(3), 295-311. https://doi.org/ 10.1016 /S0304-405X(03)00211-3
49. Stathopoulos, K., Espenlaub, S., & Walker, M. (2004). U.K. executive compensation practices: New economy versus old economy. Journal of Management Accounting Research, 16, 57-92. https://doi.org/10.2308/jmar.2004.16.1.57
50. Sundaram, R. K., & Yermack, D. L. (2007). Pay me later: Inside debt and its role in managerial compensation. Journal of Finance, 62(4), 1551-1588. https://doi.org/10.1111/j.1540-6261.2007. 01251.x
51. Tan, C., & Young, S. (2016). Share repurchase choice and executive pension compensation. Journal of Management Accounting Research, 28(1), 127-149. https://doi.org/10.2308/jmar-51280
52. Uysal, V. B. (2011). Deviation from the target capital structure and acquisition choices. Journal of Financial Economics, 102(3), 602-620. https://doi.org/10.1016/j.jfineco.2010.11.007
53. Wei, C., & Yermack, D. (2011). Investor reactions to CEOs' inside debt incentives. Review of Financial Studies, 24(11), 3813-3840. https://doi.org/ 10.1093/rfs/hhr028
Corporate Ownership & Control / Volume 15, Issue 1, Fall 2017 Continued - 1
276
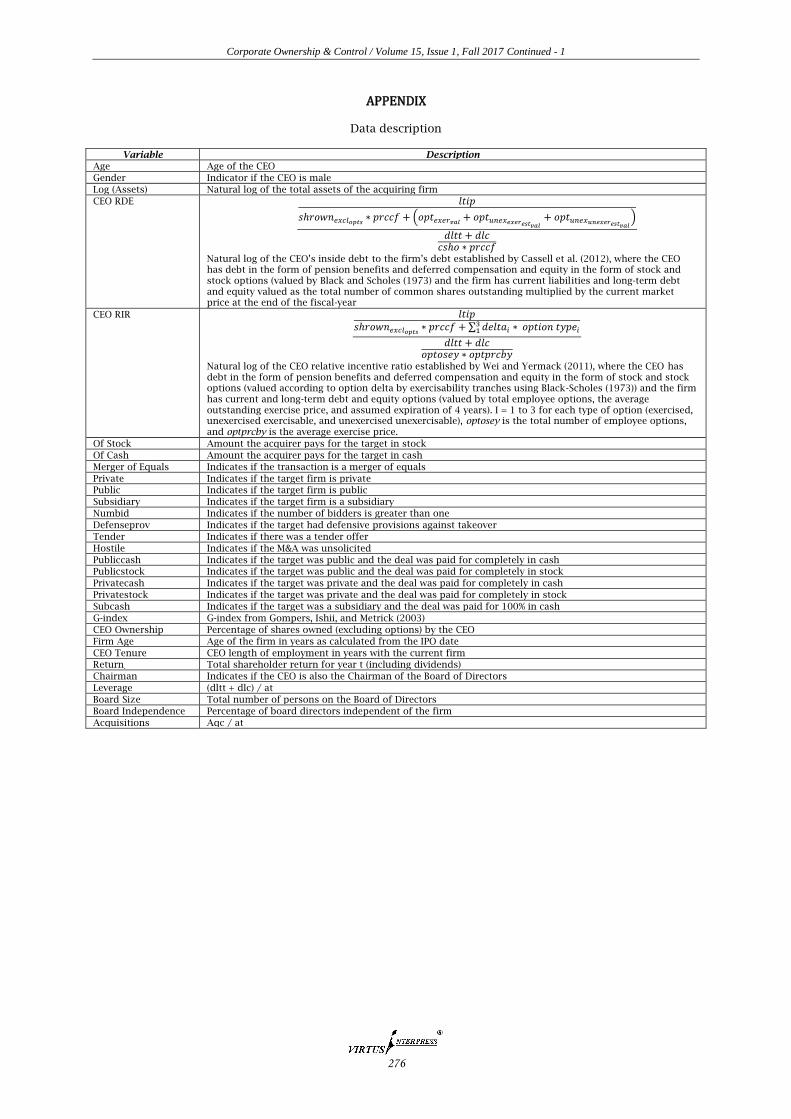
APPENDIX
Data description
Variable Description
Age Age of the CEO
Gender Indicator if the CEO is male
Log (Assets) Natural log of the total assets of the acquiring firm
CEO RDE
(
)
Natural log of the CEO’s inside debt to the firm’s debt established by Cassell et al. (2012), where the CEO has debt in the form of pension benefits and deferred compensation and equity in the form of stock and stock options (valued by Black and Scholes (1973) and the firm has current liabilities and long-term debt and equity valued as the total number of common shares outstanding multiplied by the current market price at the end of the fiscal-year
CEO RIR ∑
Natural log of the CEO relative incentive ratio established by Wei and Yermack (2011), where the CEO has debt in the form of pension benefits and deferred compensation and equity in the form of stock and stock options (valued according to option delta by exercisability tranches using Black-Scholes (1973)) and the firm has current and long-term debt and equity options (valued by total employee options, the average outstanding exercise price, and assumed expiration of 4 years). I = 1 to 3 for each type of option (exercised, unexercised exercisable, and unexercised unexercisable), optosey is the total number of employee options, and optprcby is the average exercise price.
Of Stock Amount the acquirer pays for the target in stock
Of Cash Amount the acquirer pays for the target in cash
Merger of Equals Indicates if the transaction is a merger of equals
Private Indicates if the target firm is private
Public Indicates if the target firm is public
Subsidiary Indicates if the target firm is a subsidiary
Numbid Indicates if the number of bidders is greater than one
Defenseprov Indicates if the target had defensive provisions against takeover
Tender Indicates if there was a tender offer
Hostile Indicates if the M&A was unsolicited
Publiccash Indicates if the target was public and the deal was paid for completely in cash
Publicstock Indicates if the target was public and the deal was paid for completely in stock
Privatecash Indicates if the target was private and the deal was paid for completely in cash
Privatestock Indicates if the target was private and the deal was paid for completely in stock
Subcash Indicates if the target was a subsidiary and the deal was paid for 100% in cash
G-index G-index from Gompers, Ishii, and Metrick (2003)
CEO Ownership Percentage of shares owned (excluding options) by the CEO
Firm Age Age of the firm in years as calculated from the IPO date
CEO Tenure CEO length of employment in years with the current firm
Returnt Total shareholder return for year t (including dividends)
Chairman Indicates if the CEO is also the Chairman of the Board of Directors
Leverage (dltt + dlc) / at
Board Size Total number of persons on the Board of Directors
Board Independence Percentage of board directors independent of the firm
Acquisitions Aqc / at