Embed Size (px)
Citation preview

1
CEO Overconfidence:
An Alternative Explanation for Corporate Financing Decisions
Valeria Fedyk1
May 2014
Department of Economics Stanford University, Stanford, CA 94305
Under the direction of Prof. Levin
Abstract:
In the well-established trade-off capital structure model, a rational CEO chooses to issue debt and equity depending on the costs and benefits of each. In this model, the optimal amount of debt and equity financing occurs when the dead-weight costs of bankruptcy exactly offset the tax saving benefits of debt. However, this rational decision-making theory does not provide an adequate explanation for empirical findings that companies often deviate from the presumably optimal levels of debt and equity issuance. As an alternative explanation for these capital structures, we examine the additional impact that CEO overconfidence appears to have on financing decisions. In order to measure overconfidence of CEOs, we employ a measure based on the percentage of optimistic press coverage a CEO receives relative to the percentage of optimistic press coverage that the company itself receives. We then gather data on net debt issuance and net equity issuance under the governance of each CEO, and regress these financing decisions on our measure of CEO overconfidence. We find weak evidence that what we term overconfident CEOs deem equity financing relatively more expensive than debt financing, and thereby maintain higher than expected leverage ratios. We focus our data analysis on financing decision data from the decade 1997-2007, and examine capital structure decisions arising from CEO overconfidence in conjunction with differentials by industry and the effects of the dividend tax cuts from the 2003 Jobs and Growth Tax Relief Reconciliation Act.
1 I’m grateful for the help and support of Professor of Economics at Stanford University Dr. Jon Levin, who guided
this research and provided invaluable suggestions along the way. I would also like to thank Stanford’s Economics
Professor Marcelo Clerici-Arias for valuable discussions and to the Stanford University HUME Writing Center for
providing stylistic guidance for academic literature. Finally, I’m indebted to my family, for supporting me through
this project. The help, guidance, and support of each of these individuals and organization have been invaluable in
generating the final product.

2
1. INTRODUCTION
1.1 Trade-off Theory and Pecking Order Theory for Capital Structure Decisions
The division between cash, equity, and debt portions in financing decisions has
traditionally been explained by two theories, the trade-off theory and the pecking order theory.
After Modigliani and Miller showed that the capital structure of a firm does not affect its value
under absence of taxes, risk, bankruptcy costs, and asymmetric information assumptions,
practical applications of this theory proved that the assumptions did not hold in the real world
and set the stage for a new explanation that took these variables into account.2
One such theory is the trade-off theory, which states that debt is a cheaper source of
financing because of tax deductibility but becomes more expensive through increased leverage,
which increases the financial risk of the firm that must service debt regularly (unlike equity).
Consequently, the trade-off theory states that the optimal division between debt and equity
financing for a firm is to balance the lower average cost of capital with the increased financial
risk brought on by debt financing.
A second theory often used to explains firms’ financing decisions is the so-called pecking
order theory. This theory bases itself on the fact that company executives typically want to send
positive signals about the firm and keep as much control over it as possible, in which case the
preferred method of financing would be internally through retained earnings followed by debt
financing and lastly by equity financing.3 The theory rests on the presumptions that debt issuance
sends a market signal that the firm is confident in its ability to service debt regularly while equity
issuance sends a market signal that the firm may be overvalued, potentially leading to a share
price drop.
However, both the trade-off theory and the pecking-order theory focus on direct benefits
of debt and equity financing while failing to consider personal managerial traits of CEOs that
may be affecting these decisions. In seeking to address the effects of these personal managerial
characteristics, Malmendier, Tate, and Yan (2011) construct proxies for overconfidence, military
2 The Modigliani-Miller Theorem. The New Palgrave Dictionary of Economics. Anne P. Villamil, University of
Illinois. 3 Frank, Murray Z., and Vidhan K. Goyal. "Capital structure decisions: which factors are reliably important?" Financial Management 38.1 (2009): 1-37.

3
experience, and living during the Depression and discover that these characteristics are partially
responsible for the financing choices executives undertake. 4 While their data focuses on
investment decisions between 1980 and 1994, we look to see how overconfidence motivations
have or have not continued to influence financing decisions in the more recent decade 1997-2007,
and in particular take into account the effects of different industries and the 2003 dividend tax
cut act on corporate financing decisions.
The examination of CEO overconfidence has not been limited to its effect on corporate
investment and financing decisions. In their research on mergers and acquisitions, Malmendier
and Tate (2003) show that the number of such endeavors increases with managerial
overconfidence, due to the overconfident CEOs’ misguided beliefs that they will be able to
generate abnormally high returns from the acquired companies.5 As a result, the market typically
responds negatively to such takeover bids, especially when these bids are undertaken by
overconfident CEOs. In line with the results discussed above regarding overconfident CEOs’
preference for internal financing and debt financing over equity financing, most mergers and
acquisitions by overconfident CEOs also occur in companies with substantial cash or untapped
debt capacity.
This study regarding mergers and acquisitions is conducted over the same period of data
for the period 1980-1994, which in our paper we supplement by considering the more recent
decade 1997-2007. However, since we do not consider numbers of mergers and acquisitions
directly, our results regarding financing decisions are insufficient to provide a clear view of
whether, and if so how, CEO overconfidence influences company mergers and acquisitions
decisions. Nevertheless, given the direct link between debt/equity financing preferences and the
likelihood of merger and acquisition engagement, it would be a very relevant extension to our
paper. We discuss possible directions for further research on this topic in our concluding section.
In an alternative direction, CEO overconfidence has also been linked to dividend
payments. As will be discussed more in depth in the fourth section, dividend rates play a large
role both in attracting investors and in making equity financing more or less lucrative for the
company. The 2003 Jobs and Growth Tax Relief Reconciliation Act that relaxed dividend taxes,
4 Malmendier, Ulrike, Geoffrey Tate, and Jon Yan. "Overconfidence and early-life experiences: the effect of
managerial traits on corporate financial policies." The Journal of Finance 66.5 (2011): 1687-1733. 5 Malmendier, Ulrike, and Geoffrey Tate. "Who makes acquisitions? CEO overconfidence and the market's reaction." Journal of Financial Economics 89.1 (2008): 20-43.

4
for instance, altered company equity financing preferences by making the company’s equity
appear more lucrative to investors, which in turn generated more demand and led to increased
equity issuance by the company. The described effect has been supported by empirical research
in a number of studies, among them by Chetty and Saez (2005), who document a 20 percent
increase in the annual dividend payments immediately following the dividend income tax cut
enacted in 2003. Deshmukh, Goel, and Howe (2009), meanwhile, demonstrate a link between
dividend payout and CEO overconfidence, in accord with the intuitive prediction that CEOs
overestimate the value of their equity sans dividends and consequently end up paying out lower
dividend levels than their peers at comparable companies.6 We take into account the 2003 Jobs
and Growth Tax Relief Reconciliation Act in our data analysis to ensure that it does not create a
bias in our calculated effects of CEO overconfidence on financing decisions.
The proposed links between CEO overconfidence and corporate attributes extend far
beyond, linking CEO overconfidence with such company characteristics as innovation. Galasso
and Simcoe (2011), for instance, show that overconfident CEOs are more apt to lead their
companies in a new technological direction, as measured by citation-weighted patent counts.7
This conclusion is supported by Hirshleifer, Low, and Toeh (2012), who demonstrate that
overconfident CEOs do obtain more patents and patent citations for the company, though this
success is somewhat limited to companies within innovative industries so that overconfident
CEOs work best when exploiting innovative growth opportunities.
Once again, the first of these studies relates back to the Forbes 500 sample over the years
1980-1994 while the second truncates data at 2003, another reason we decide to consider more
recent data for the decade 1997-2007. While these papers provide a very interesting link between
CEO overconfidence and a company attribute that may not be immediately intuitively associated
with it, the papers are also forced to deal with the hardly quantifiable notion of innovation.
Although patents are a numerical measure that we would certainly expect to positively correlate
with the “innovation” of a company, there are many other aspects such as a company’s culture,
employee composition, and product innovation that we would also expect to be inherent to an
innovative company.
6 Deshmukh, Sanjay, Anand M. Goel, and Keith M. Howe. "CEO overconfidence and dividend policy." Journal of
Financial Intermediation 22.3 (2013): 440-463. 7 Galasso, Alberto, and Timothy S. Simcoe. "CEO overconfidence and innovation." Management Science 57.8 (2011): 1469-1484.

5
In essence, this same difficulty of measuring a qualitative attribute is present in our paper
and all those concerning CEO overconfidence research discussed above, since overconfidence
itself can only be measured through a proxy. Nevertheless, debt and equity or mergers and
acquisitions data for public companies are easily available, easily verifiable, and easily
quantifiable. Since the same cannot be said about innovation and other qualitative attributes, it is
much more difficult to form conclusions with a comparable level of certainty regarding how
overconfidence influences them. For this reason, since we already deviate from previous papers
by considering a later time period for our research, we choose to focus on the effects of
overconfidence on the more easily quantifiable and replicable debt and equity issuance data in
our paper. That is not to say, however, that the study of more recent data should not be extended
to other meaningful, albeit slightly less quantifiable, characteristics. A note on the engaging
nature of such potential future research follows in the conclusion.
1.2 Managerial Characteristics Approach
For our measure of CEO overconfidence, we construct a proxy based on an integral and
well-documented component: the portrayal of the CEO in the press. We take this measure
because it is a very individual and personal one. While financial statement analysis may yield a
more unilateral portrayal of a CEO’s decision-making style, press portrayal tends to describe the
CEO in a more multi-faceted way. Since we are looking for a personality trait, namely
overconfidence, press coverage – which includes both corporate and personal events in a Fortune
500 CEO’s life – should be a good measure of how overconfident a CEO appears to be in all
areas of life.
The press overconfidence measure is also a valid one because it does not come from a
single source but rather from a multitude of aggregated opinions, thus forming a buffer against
any single misrepresentative incidences. CEO representation in the media is additionally
important because it allows us to distinguish how others perceive an overconfident CEO in
relation to a typical rational CEO. In fact, to arrive at our final measure of CEO overconfidence
we actually consider both the optimistic press coverage for the CEO and the optimistic press
coverage for the CEO’s company in general, in order not to misinterpret positive company
performance and generally shared optimism for a CEO’s overconfidence.

6
We next turn to say a few words regarding existing measures for CEO overconfidence,
and why in our paper we decide to deal quantify it as described above. An interesting recent
study by Hayward, Rindova, and Pollock (2004) regarding precisely this measure of “press”
overconfidence showed that journalists typically attribute to a CEO characteristics that are either
unique to the CEO or recurring in the CEO’s behavior.8 Furthermore, the paper demonstrated
that CEOs are apt to internalize press representations of themselves, thereby perpetuating
characteristics attributed to them by the press. Though this presents a peculiar view of how CEOs
develop overconfidence, it nevertheless demonstrates a close link between actual CEO
overconfidence and the depiction of this overconfidence by the press.
We do note that from the above description, it is evident that there is likely some
overflow of company performance into press depiction of CEOs. There is indeed a possible
reverse causality problem, since instead of gleaning CEO characteristics from press about the
CEO, we may in actuality be gathering company characteristics. For this reason, as described in
more detail under our second section, we include a company optimistic press measure to control
for how the company itself, rather than the company and the CEO jointly, is presented by the
press.
We do not include CEO options holding data in our overconfidence measure, as done by
preceding papers on CEO overconfidence, because we believe this press measure to be
sufficiently indicative of the CEOs’ levels of overconfidence. While Hayward, Rindova, and
Pollock (2004) showed the strong link between press portrayal and CEO characteristics, no such
study (to the best knowledge of the authors) has been conducted regarding options holding and
CEO overconfidence. Holding options to expiration by the CEO can be simply indicative of a
different risk profile, improved or deteriorating current personal financial situation, insider
knowledge, or even a desire to signal confidence in the company when it may actually not be that
high; for these reasons, we do not include a measure of CEOs’ options exercise prices and
timeline in our measure for CEO overconfidence.
We describe the precise process of measuring CEO overconfidence via press in the
following section. In terms of results, we note two major effects of overconfident CEOs on firm
financing decisions. The first is that overconfident CEOs generally prefer to increase financing in
8 Hayward, Mathew LA, Violina P. Rindova, and Timothy G. Pollock. "Believing one's own press: The causes and
consequences of CEO celebrity." Strategic Management Journal 25.7 (2004): 637-653.
7
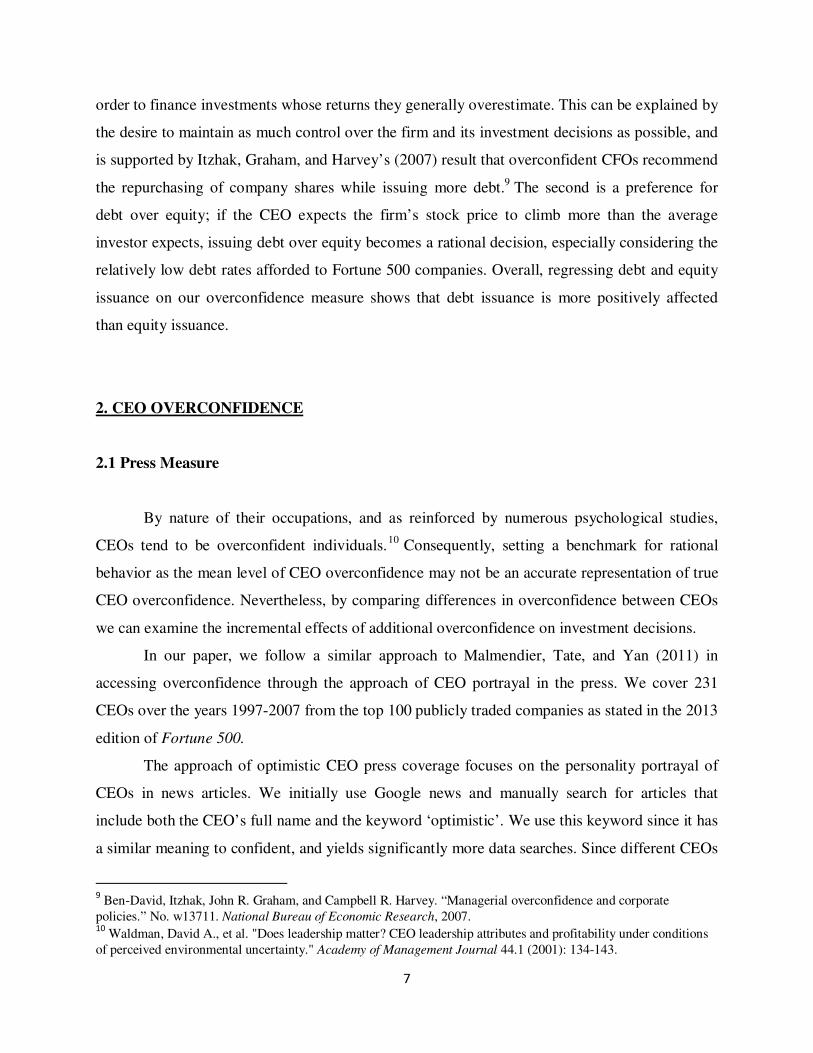
order to finance investments whose returns they generally overestimate. This can be explained by
the desire to maintain as much control over the firm and its investment decisions as possible, and
is supported by Itzhak, Graham, and Harvey’s (2007) result that overconfident CFOs recommend
the repurchasing of company shares while issuing more debt.9 The second is a preference for
debt over equity; if the CEO expects the firm’s stock price to climb more than the average
investor expects, issuing debt over equity becomes a rational decision, especially considering the
relatively low debt rates afforded to Fortune 500 companies. Overall, regressing debt and equity
issuance on our overconfidence measure shows that debt issuance is more positively affected
than equity issuance.
2. CEO OVERCONFIDENCE
2.1 Press Measure
By nature of their occupations, and as reinforced by numerous psychological studies,
CEOs tend to be overconfident individuals.10 Consequently, setting a benchmark for rational
behavior as the mean level of CEO overconfidence may not be an accurate representation of true
CEO overconfidence. Nevertheless, by comparing differences in overconfidence between CEOs
we can examine the incremental effects of additional overconfidence on investment decisions.
In our paper, we follow a similar approach to Malmendier, Tate, and Yan (2011) in
accessing overconfidence through the approach of CEO portrayal in the press. We cover 231
CEOs over the years 1997-2007 from the top 100 publicly traded companies as stated in the 2013
edition of Fortune 500.
The approach of optimistic CEO press coverage focuses on the personality portrayal of
CEOs in news articles. We initially use Google news and manually search for articles that
include both the CEO’s full name and the keyword ‘optimistic’. We use this keyword since it has
a similar meaning to confident, and yields significantly more data searches. Since different CEOs
9 Ben-David, Itzhak, John R. Graham, and Campbell R. Harvey. “Managerial overconfidence and corporate
policies.” No. w13711. National Bureau of Economic Research, 2007. 10
Waldman, David A., et al. "Does leadership matter? CEO leadership attributes and profitability under conditions
of perceived environmental uncertainty." Academy of Management Journal 44.1 (2001): 134-143.

8
enter office at different times, we do not limit our news search to a specific date span. However,
to ensure that the measures are consistent with each other we do standardize them by dividing the
total number of mentions of the CEO along with the ‘optimistic’ quality by the total number of
mentions of the CEO in the press. This way we arrive at a percentage of articles concerning a
particular CEO that refer to the CEO in a positive light. We try to limit cross-referencing
different individuals with CEOs of the same names by manual checking of the articles. Once we
calculate the percentage optimistic press variable for each CEO in our 100 company sample, we
regress financing decisions of the CEOs on this overconfidence variable.
While the Google News source of data provides a good benchmark for CEO optimism,
the archives are not extensive enough for our analysis of the decade 1997-2007, so we employ
news searches in the Lexis Nexis database as well. We corroborate our initial overconfidence
measures through a similar search process of optimistic press coverage for CEOs in the Lexis
Nexis database. While this database does go farther back, it sets a limit of 1,000 on the number
of search results, making it a sufficiently reliable source for lesser-known CEOs but an
inadequate one for popular CEOs with a significant number of press mentions. Consequently, we
keep our results for lesser-known CEOs as a new benchmark and move on to the ProQuest news
database.
The ProQuest news database is the one ultimately used in building our overconfidence
measure, but we double-check it for consistency with the Lexis Nexis measure. The measures
match up very closely (up to .5% difference) for most lesser-known CEOs, as expected.
There are a couple intricacies to consider with this method. First of all, many CEO names
are common ones that occur in the press not only in reference to the CEO of a given company
but also in reference to other individuals of that same name; in such cases, we need to separate
the relevant references from the non-relevant ones. We do so by searching the news articles in
ProQuest not only for the full name of the CEO, e.g. “Ronald Compton” for Aetna, but also for
that name plus a direct mention of the company name in the article, e.g. “Ronald Compton”
AND Aetna. In this way, we weed out unnecessary and irrelevant references to individuals of the
same name from our measure of a given CEO’s overconfidence.
A second difficulty arises when we consider that a given CEO may be referenced in the
press by a number of nicknames or different versions of his name. For instance, “James Dimon”
of J.P. Morgan may be most often referred to as “Jamie Dimon” whereas “Steven Jobs” of Apple

9
may most often be referred to as “Steve Jobs”. In such cases, we use our knowledge of famous
Fortune 100 CEO names to search for the most commonly used one, and rely on data to back up
these assumptions. If a given search yields an uncharacteristically low number of results (as
compared to other CEOs of similarly sized and well-known companies), then we verify that the
name used is the most common for that CEO and, in the case it is not, re-run our search using the
most common name. Even in the cases where two or more spellings of a name exist in more or
less the same amount of usage, using one version (and using the same version when run together
with the optimistic keyword) should not yield a wrong measure of overconfidence for that CEO,
since we were consistent with the chosen version of the name.
Finally, some companies have come into existence after 1997, making it impossible to
find mentions for the company names along with the CEO names of the predecessor companies.
In such cases, such as with Roger Deromedi of Kraft, which later spun off Mondelez
International, we need to individually research the histories of the companies and search for
optimistic mentions of the CEO with the predecessor company (otherwise, we arrive at 0
mentions for the CEO and the current name of the spun-off company). We take note to avoid any
such pitfalls by double-checking historical company information in all cases where number of
total press mentions for the CEO name and company name is less than 100. We proceed
similarly if the company had undergone a merger instead of a spin-off, as in the case of Conoco
Inc. and Phillips Petroleum Co. merging to ConocoPhillips within our data sample companies.
Once again, it is important to verify the historically relevant company for a CEO in a given time
period. We choose to verify so in cases where it is apparent that the current company name
alongside the CEO name does not yield many results; since the CEO was never actually the CEO
of the company as it goes by the current name, such cases are easy to identify and address as
necessary.
It is reassuring to see that while we see varying measures of overconfidence using our
press measure, the percent of optimistic press for any given CEO remains within the 0-10%
range for nearly all CEOs considered. This, in conjunction with our experience using Google
News and Nexis Lexis for the press measure, gives additional confidence that the measure is
robust and unlikely to provide misleading results for any CEO. To elaborate on the boundary
cases, we provide the table below of the top 5 most confident CEOs:

10
CEO Name
Company Industry # Press
Mentions
# Optimistic Press
Mentions
% Optimistic Press
Mentions
Robert Niblock
Lowe's Companies Inc.
Consumer Discretionary
813 70 8.61%
Robert Tillman
Lowe's Companies Inc.
Consumer Discretionary
272 18 6.62%
Leon Machiz
AVNET Inc. Telecommunications
Services 78 5 6.41%
Max Lukens
Baker Hughes Inc.
Energy 82 5 6.10%
Terry Lundgren
Macy's Consumer Staples 2362 135 5.72%
As can be gathered from the table, even the most confident CEOs have percentages of
optimistic press that lie within percents of each other. The same is true on the lower end of the
overconfidence spectrum; there are a number of CEOs at each gradation of a lower percent of
optimistic press mentions. We provide a visual of this with the table below, this time delving into
more detail to demonstrate how the CEO overconfidence measure is composed of both CEO
optimistic press coverage and company optimistic press coverage:
CEO Name
Co. Name Industry # Press # Opt. Press
% CEO Opt.
% Co. Opt.
% CEO Overconfidence
Joe Foster
Baker Huges Inc.
Energy 23 0 0.00% 1.92% -1.92%
Arthur Ryan
Prudential Financial
Inc. Financials 702 4 0.57% 2.31% -1.74%
Thomas Frist
HCA Holdings
Inc.
Health Care
1631 14 0.86% 2.35% -1.49%
Barrett Toan
Express Scripts Holding
Co.
Health Care
286 1 0.35% 1.81% -1.46%
Richard Clark
Merck & Co.
Health Care
613 5 0.82% 2.18% -1.36%

11
While it may induce doubts that certain “most overconfident” or “least overconfident”
CEOs by the press measure do not have much press in general, it is the nature of the media that
makes it impossible for all individuals to garner an equal amount of press attention. We hope that
any biases present in these small samples extend to large samples as well, and assume there
should be no reason that a CEO with a small amount of press should have either a larger or
smaller percentage of optimistic press than their more popular counterparts. The fact that almost
all CEOs considered have at least some number of press mentions that include the optimistic
keyword is a positive sign since then the correct ratio between optimistic press mentions and
total press mentions can still be preserved. We reiterate here that the ProQuest database used for
these overconfidence results has been the most extensive we could find; utilizing Google News
for the measure led to overwhelmingly more results with 0 optimistic articles found, while Lexis
Nexis reports led to gross overestimations of overconfidence for popular CEOs due to the
unsightly cap on total news articles. As a result, data gathered through the ProQuest database
was deemed most adequate for the purposes of this study, and the fact that all overconfidence
measures fall into a rather compact range supports that the measure is reliable.
2.2 Controlling for Company Performance
As discussed above, percentage of optimistic press, both intuitively and as has been
shown in practice (see cited works in introduction), has proven to be a valid method of
estimating CEO overconfidence in the real world. As discussed in the introduction, there have
even been papers noting the positive correlation and convergence of CEO overconfidence to
press depiction of the CEO. Nevertheless, as with all proxy methods of estimating a qualitative
characteristic, there are some caveats we need to consider.
First of all, overconfidence as measured by optimistic press mentions of CEOs often has,
by the very construction of this method, included the company name alongside the CEO name in
these optimistic mentions. However, we have insofar not separated how optimistic the company
itself is regarded by the general population from how optimistic the CEO considers it. Because of
the possibility of a company being considered optimistic by the public at large rather than only
by the CEO (which would yield an overly high estimation of CEO overconfidence if we only

12
consider how the CEO regards the company), we need to consider CEO confidence relative to
general confidence in the company. For example, in the technological sector many journalists
and financial analysts may choose to describe the company as optimistic simply due to the
quickly growing technological sector in which the firm operates, which could bias CEO
overconfidence upwards if we do not take this into account.
For this reason, we consider a second measure: strictly company specific optimistic press
percentage. To calculate this measure, we proceed similarly as to how we do above for the CEO
optimistic press mentions calculations. We first count the total number of times a company is
mentioned in the press. As in the case of CEO names, there are some intricacies with company
names that we do our best to overcome in as seamless a way as possible; for instance, companies
with generic names such as “Apple” or “Caterpillar” are searched in the database using the full
extension of the name, i.e. “Apple Corp.” and “Caterpillar Inc.”, to avoid ambiguity in reference
to the physical objects. We next count the number of times a company is mentioned alongside
the keyword “optimistic” in the press. Once the calculations of total press mentions and
optimistic press mentions for the company are created, the optimistic press mentions are divided
by total press mentions to arrive at the percentage of optimistic press mentions for the given
company.
Data for the averages of mentions under this method are summarized below:
Average Press
Mentions - Company
Average Optimistic Press
Mentions - Company
Average %
Optimistic -
Company
158,899 3,018 1.97%
Average Press
Mentions - CEO
Average Optimistic Press
Mentions - CEO
Average %
Optimistic - CEO
2,405 63 2.77%
Average % Overconfidence
0.80%
The measure of company percent optimistic press mentions above can be understood as
the confidence that the outside world, rather than the CEO, has in the company. The thousands of

13
articles or press that each company garners reflect the opinion of journalists, political figures,
investors and financial consultancy companies alike, thus creating an amalgamation of opinion
into an average confidence level in the company. The difference between this general level of
optimism and the level of optimism the CEO has yields our measure of CEO overconfidence -
essentially how much more confident in the company the CEO appears to be as compared to the
general population.
3. FINANCING DECISION MEASURE
In order to evaluate the effects of CEO overconfidence on the firm’s investment decisions,
we use Compustat’s North America – Annual Updates, Annual Snapshot database. We examine
the variables “new issues of common and preferred stock”, “retired issues of common and
preferred stock”, “new issues of long-term debt”, and “retired issues of long-term debt” to
calculate net change in outstanding stock and net change in outstanding long-term debt. These
measures of debt and equity issuance can then be regressed on the CEO overconfidence measure
described above to see whether and how CEO overconfidence affects corporate investment
decisions.
After documenting the measures for the net debt and equity issued by company, we
subdivide these by year in order to be able to next group the years by CEO. In this way, we
arrive at the net issuance of debt and equity by CEO. If a CEO change occurred in the first half
of the year, then we attribute the debt/equity issued during that year to the individual who was
CEO for the second half of the year; if a CEO change occurred in the second half of the year,
then we attribute the deb/equity issued during that year to the individual who was CEO for the
first half of the year. In this way, we attempt to group debt and equity disbursements with the
CEO most directly responsible for them (or most likely to have been responsible for them, due to
the long tenure that individual held as CEO).
A direct consequence of this approach is that we delete CEOs who were in office for less
than half a year from our analysis. These CEOs, often either incapable of handling their
responsibilities or simply acting as interim CEOs under extraordinary circumstances in the
company until a suitable CEO has been found, often do not wield as much power as well-

14
established CEOs. Furthermore, their financing decisions may often be either entirely absent or
more dictated by the current circumstances than by their personal preferences and characteristics.
We also note that several companies do not have data for all ten years of issuance – in
this case, we assume that no such issuance occurred. We are able to do so as the amount of such
instances is minimal and verifiable.
We also notice that there is a visible absence of equity financing in some corporations.
We explain this fact due to the status of these companies; as members of the Fortune 500, all of
these corporations were (especially in the generally optimistic, forward-looking period of the
1997-2007 decade that we examine) considered to be mostly risk-free and very unlikely to
undergo and experience default. As a result, debt financing included a very modest rate that most
corporations were more willing to incur rather than issuing equity and thereby giving up more
control of the company. To account for this lack of equity financing, we place our analysis more
heavily on the years and corporations where equity issuance and/or repurchases did take place in
order to gauge the effect of overconfidence on financing decisions.
Throughout our debt decision analysis, we also note a surprising fact that appears to
support our conclusion that overconfident CEOs issue more debt and that, more generally, CEO
personal characteristics have an important (and not wholly rationally explicable) effect on the
company’s financing decisions. This is an important sidestep from the traditionally held view
that financing decisions are entirely a result of rational decision-making and the trade-off
between debt, equity, and cash funding costs and benefits.
This particular fact is that for several companies, once management changes all of the
issuance of debt in preceding years under different management drops to 0. This occurs in
several companies out of the top 100 that we examine, most notably for the 1994-1999 J.P.
Morgan CEO Walter V. Shipley, 2000 Aetna CEO William H. Donaldson, and 2004-2007 Baker
Hughes Inc. CEO Chadwick C. Deaton CEO changes. Hackbarth (2008) shows a similar effect
when he considers how managerial traits from CEO to CEO create heterogeneity among
otherwise identical firms.11
Several intricacies arise, among them unique circumstances such as interim CEOs or joint
CEOs under mergers, such as in the case of Verizon Communication’s advent from GTE and
11
Hackbarth, Dirk. "Managerial traits and capital structure decisions." Journal of Financial and Quantitative
Analysis 43.04 (2008): 843-881.

15
Bell Atlantic, where Charles Lee and Ivan Seidenberg initially acted as co-CEOs of the company.
In such cases, if the interim CEO was in power for less than half a year we attribute the debt and
equity issuances during that time to other CEOs incumbent in that year. In the case of mergers
and acquisitions, we review the history of the company’s management to accurately decide
which CEO to attribute the debt or equity issuance of a given year to.
We also introduce the notions of normalized debt increase and normalized equity increase,
to be used in conjunction with our measure of CEO overconfidence and provide a more accurate
measure of its effects on debt and equity increase. We arrive at normalized debt increase, and
analogously normalized equity increase, by dividing the net debt increase for a given CEO by the
number of years this CEO was in office within our data range. This gives an annual average
increase or decrease in debt for that CEO. An analogous measure of normalized equity increase
is constructed. Average data for both debt and equity follow:
(data in Millions)
Average Net Debt
Increase
Normalized Debt
Increase
Average Net Equity
Increase
Normalized Equity
Increase
$6,478 $1,809 -$4,548 -$1,199
As can be seen from the above table, normalized debt and normalized equity increases
are of comparable absolute value, though Fortune 500 companies prefer to issue debt and
repurchase equity. We explain this intuitively as the well-known, well-established companies
being past their initial growth phase and thus relying more strongly on low-rate debt available to
them. In the past, debt financing for these companies came at a higher interest rate and therefore
equity financing was a more enticing option than it is now, which accounts for the companies’
preferences to repurchase their equity.

16
4. CAPITAL STRUCTURE IMPLICATIONS
4.1 Overview
The classical trade-off capital structure model assumes that a rational CEO would issue
debt and equity to the point of balance between the additional tax-deductibility benefit of debt
and the bankruptcy risk detriment of debt.
However, as discussed empirical evidence suggests that companies do not always adhere
to the aforementioned model. In our sample of CEOs for the 100 largest Fortune 500 companies,
for instance, the managerial characteristic of CEO overconfidence plays a role in the allocation
of financing between debt and equity. This is an important move in understanding corporations’
capital structures and better predicting whether a company would act in the interests of its
shareholders, since attributing part of the financing decisions to the overconfidence of CEOs and
measuring this overconfidence can lead us to predict future company financing decisions more
accurately.
4.2 Hypotheses for the Effects of an Overconfident CEO on Capital Structure Choices
As mentioned above, we note two major effects of overconfident CEOs on firm financing
decisions. The first is that overconfident CEOs generally prefer to raise more debt and equity in
order to finance investments they deem lucrative. They do so since they likely overestimate the
returns on such investments. The second effect observed is a preference for debt over equity; if
the CEO expects the firm’s stock price to climb more than the average investor expects, issuing
debt over equity becomes a rational decision.
Indeed, overconfident CEOs prefer not to issue equity as a means of financing because it
dilutes the claims of existing shareholders (including management and employees with employee
stock options, an important personal consideration). Consequently, we expect overconfident
CEOs to issue comparatively more debt as a percentage of their total financing needs.
However, there is an important consideration that minimizes the likelihood that
overconfident CEOs issue debt as well. If CEOs believe in the sturdiness and success of their

17
companies, they believe their issued debt to be close to risk-free, and are reluctant to pay higher
debt interest rates that take a higher probability of default or delayed payment into account.
From the above two points, it is evident that given no other motivations, overconfident
CEOs would prefer to issue less equity (in order not to dilute shareholders’ claims) and issue less
debt (in order not to pay what they consider to be overpriced interest rates that creditors demand).
In this scenario, then, overconfident CEOs would rely more heavily on accumulated cash to
finance any projects requiring financing. If the accumulated cash on reserve is not sufficient,
however (as it often is not), it becomes unclear whether overconfident CEOs would issue more
or less debt and equity than their average confidence peers. While we know we expect
overconfident CEOs to use debt financing more frequently than equity financing, the total
amount of either can be justifiably both more or less than the corresponding amounts issued by
CEOs of average confidence.
It thus becomes necessary to run our regressions of debt and equity issuance on the
overconfidence of CEOs, both to corroborate our theories regarding debt issuance preference and
to determine whether overconfident CEOs issue higher or lower levels of debt and equity on
average. We predict that because overconfident CEOs overestimate the returns to their
investments, they will still believe that the higher debt financing rates are justified as a necessary
stepping-stone to higher future cash flows from the investment. We believe that while the
overconfident CEOs may find the debt interest rates reasonably priced considering they
overestimate their investment returns, giving up shareholders’ claims via equity issuance may
still be a barrier overconfident CEOs are unlikely to overcome. Consequently, we predict that
overconfident CEOs will issue more debt than equity, and will issue more cumulative debt and
less cumulative equity than average confidence CEOs.
4.3 Public Issuance Needs
In order to form an unbiased and accurate opinion regarding how overconfidence affects
investment decisions, we must first account for the firm’s external financing needs. While it is
reasonable to propose that overconfident CEOs will have on average greater financing needs (or
at least, believe that they have higher financing needs) due to their misled beliefs regarding
higher returns on possible projects requiring financing, an even more overarching determinant of

18
financing needs would doubtlessly be the financial condition of the company, which would
include future stock analyst forecasts regarding future returns and performance, any outstanding
debt that needs to be refinanced, and similar financial characteristics of the company.
Consequently, in order to form an unbiased (or minimally biased) estimation of the effects of
CEO overconfidence on overall financing issuance, we need to account for the financing
issuance directly precipitated by the company’s financials.
4.4 Debt Effects
We first attempt to observe the effects of CEO overconfidence on the levels of debt
issued. In order to do this, we collect press optimism data on each of the 231 CEOs of the top
Fortune 500 companies, thereby constructing a measure of overconfidence for them, and regress
the levels of debt issued on this measure. As explained above, we aggregate the debt issued and
debt retired for each year that a certain individual acted as CEO for the company into a single
value of net debt issued or retired by that CEO. This is the net debt increase value, defined
NET_DEBT_INC in our model, that we use to generate normalized debt increase
(NORM_DEBT_INT) that we regress on CEO overconfidence, the percentage of optimistic
press mentions (NEWS_CEO_OPT). We arrive at the following results, summarized by the table
below:
19
where NORM_DEBT_INC refers to the normalized (average annual) net debt increase or
decrease for a CEO and NEWS_CEO_OPT is the percentage optimistic press for the CEO (one
way to measure CEO overconfidence) as explained above.
As can be seen from this table, there is a positive correlation between CEO
overconfidence and debt issuance. This result is entirely in line with our hypothesis, which
predicted that overconfident CEOs would overestimate the success and importance of the
projects they would like to finance, be reluctant to give up more control of the company for what
they consider an undervalued stock price by issuing more equity, and would therefore choose to
issue more debt relative to their less confident peers.
At the same time, it is important to note that this result is not completely conclusive due
to the lack of control variables and instrumental variables that are not yet present in the analysis
as well as the wide 95% confidence interval, which currently includes 0 (i.e. no significant effect
of overconfidence on debt issuance) in its range. We address the first of these two concerns
below, when we introduce industry control dummy variables to account for debt financing
variation not caused by CEO overconfidence.
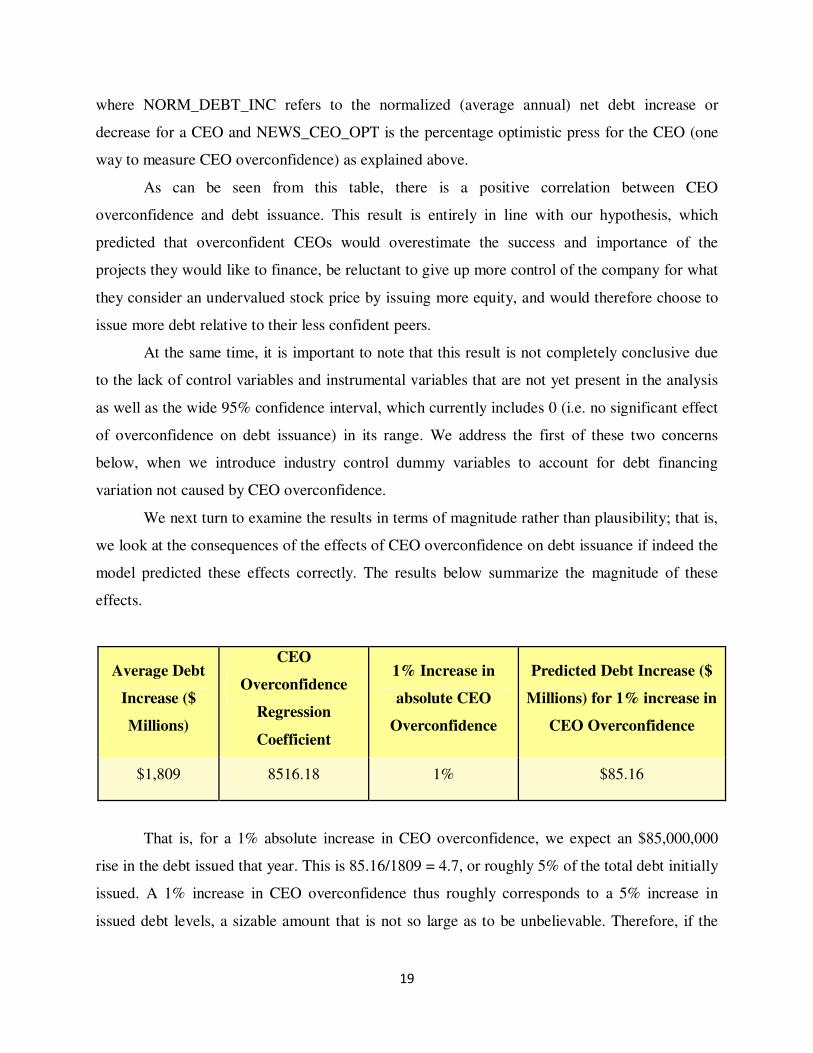
We next turn to examine the results in terms of magnitude rather than plausibility; that is,
we look at the consequences of the effects of CEO overconfidence on debt issuance if indeed the
model predicted these effects correctly. The results below summarize the magnitude of these
effects.
That is, for a 1% absolute increase in CEO overconfidence, we expect an $85,000,000
rise in the debt issued that year. This is 85.16/1809 = 4.7, or roughly 5% of the total debt initially
issued. A 1% increase in CEO overconfidence thus roughly corresponds to a 5% increase in
issued debt levels, a sizable amount that is not so large as to be unbelievable. Therefore, if the
Average Debt
Increase ($
Millions)
CEO
Overconfidence
Regression
Coefficient
1% Increase in
absolute CEO
Overconfidence
Predicted Debt Increase ($
Millions) for 1% increase in
CEO Overconfidence
$1,809 8516.18 1% $85.16

20
effects shown in the regression do hold true we see a large impact of CEO overconfidence on
corporate financing decisions each year. However, since there is a large leeway for the
coefficient on CEO overconfidence from the regression (as noted from the 95% confidence
interval), we are unable to make any such statement regarding CEO effects on debt issuance
levels with certainty.
4.5 Equity Effects
The second part of our direct analysis relates to how CEO overconfidence affects use of
equity for financing purposes. Once again, similarly to the debt case, we look at press optimism
as our measure of CEO overconfidence and this time consider the difference between the
issuance of common and preferred stock and the repurchase of common and preferred stock as
the net change in equity. In order to gather a unified measure of this net change in equity
financing for each CEO, we sum up the annual changes in issued and repurchased common and
preferred stock for the years that the CEO was incumbent at the company. We then regress this
net change in equity (denoted NET_EQ_INC in our data) on the press optimism measure of the
CEO (NEWS_OPT_PERC).
In this case, we predict the overconfident CEOs to be very reluctant to use equity as their
primary source of financing because they believe their stock price is significantly underpriced.
Consequently, for them it is not sensible to give up control of their company through stock at a
very low price, especially considering how much they expect their stock price to rise in the
future (since they expect their company to do very well). It makes much more sense for them to
leverage their access to debt markets, with rates that, although slightly higher than what they
would consider fair, are nonetheless quite low (especially so for a well-established, Fortune 500
company). We consider the results of our regression to see whether they support our hypothesis:

21
where NORM_EQ_INC refers to the normalized (average annual) net equity increase or decrease
for a CEO and NEWS_CEO_OPT is the percentage optimistic press for the CEO (one way to
measure CEO overconfidence).
As evidenced from the table above, equity issuance exhibits a much lower correlation
with CEO overconfidence than debt does. Once again, this is in line with our projections:
overconfident CEOs would rather access the debt markets because of their comparatively low
rates, and keep maximum possible control over a corporation they consider significantly
overvalued and with great (though for many, unforeseen) potential.
Once again, however, the results are not unilateral. Rather than an unequivocal negative
correlation, we notice a relatively weak positive one. In fact, 0 is well within the 95% confidence
interval for the coefficient on NEWS_OPT_PERC, and the probability that the coefficient is in
fact positive is high. Nevertheless, the weak low positive correlation is there and, even more
importantly, it is significantly lower than the coefficient on NEWS_OPT_PERC when
NET_DEBT_INC is run against it. That indicates a strong relative difference between debt
issuance and equity issuance for an overconfident CEO: an overconfident CEO prefers to issue
debt.
It is important not to limit our considerations to the confidence we have in the regression
coefficient but also to consider the effects this coefficient would have if it were indeed accurate.
Below we summarize the key statistics for the results:

22
Average
Equity
Increase ($
Millions)
CEO Overconfidence
Regression Coefficient
1% Increase in absolute
CEO Overconfidence
Predicted Equity
Increase ($ Millions)
for 1% increase in
CEO Overconfidence
-$1,199 239.1081 1% $2.39
As can be seen, a 1% absolute increase in CEO overconfidence leads to a $2.39 million
increase in debt issuance, which corresponds to 2.39/-1.199 = .199 or roughly 2% increase in
equity issuance. Since we initially expected CEOs to repurchase shares more than issue new ones
(because of the negative coefficient on average equity increase), this is a significant deviation
from expected behavior.
4.6 Accounting for Industry Differentials
While the data gathered indicates a large positive effect on debt issuance and slight
positive effect on equity issuance of overconfident CEOs, it is important to consider other factors
that may be partially responsible for these conclusions. In particular, due to the increased
prominence of certain industry sectors such as technology (nominally infrastructure technology
and telecommunications sectors in our data) and the decline of others such as auto manufacturing
in recent years (nominally consumer discretionary sector in our data) we sought to separate the
effects of industry on corporate financing decisions. For instance, it may be that CEOs of
technology corporations routinely issue more equity funding regardless of overconfidence.
While the two points regarding technology and auto sectors above remain in full-force
today and were very significantly impacted during and following the 08-09 financial crisis, some
different financing attributes between industry sectors were certainly in place well before then.
We note that our 1997-2007 decade data captures the 2000 dot com bust, for instance, as well as
the rise and prominence of the financial sector. Consequently, we add the dummy variables for
energy (EN), materials (MAT), industrials (IND), consumer discretionary (CONS_D), consumer
staples (CONS_S), health care (HLTH), financials (FIN), infrastructure technology (IT),
telecommunication services (TLCM), and utilities (UTIL) sectors to our regression.
23
The two regressions for the effects of CEO overconfidence on debt issuance and equity
issuance then become:
(1): NET_DEBT_INC = a1*NEWS_OPT_PERC + b1*EN + b2*MAT + b3*IND +
b4*CONS_D + b5*CONS_S + b6*HLTH + b7*FIN + b8*IT + b9*TLCM + b10*UTIL + c1
(2): NET_EQ_INC = a1*NEWS_OPT_PERC + b1*EN + b2*MAT + b3*IND +
b4*CONS_D + b5*CONS_S + b6*HLTH + b7*FIN + b8*IT + b9*TLCM + b10*UTIL + c1
Where a1 is the coefficient on the percent of optimistic press mentions for the CEO (our
measure of the CEO’s overconfidence) and the bi, i=1,..10 are the coefficients on the different
sectors into which the company may fall into, and c1 is the regression constant.
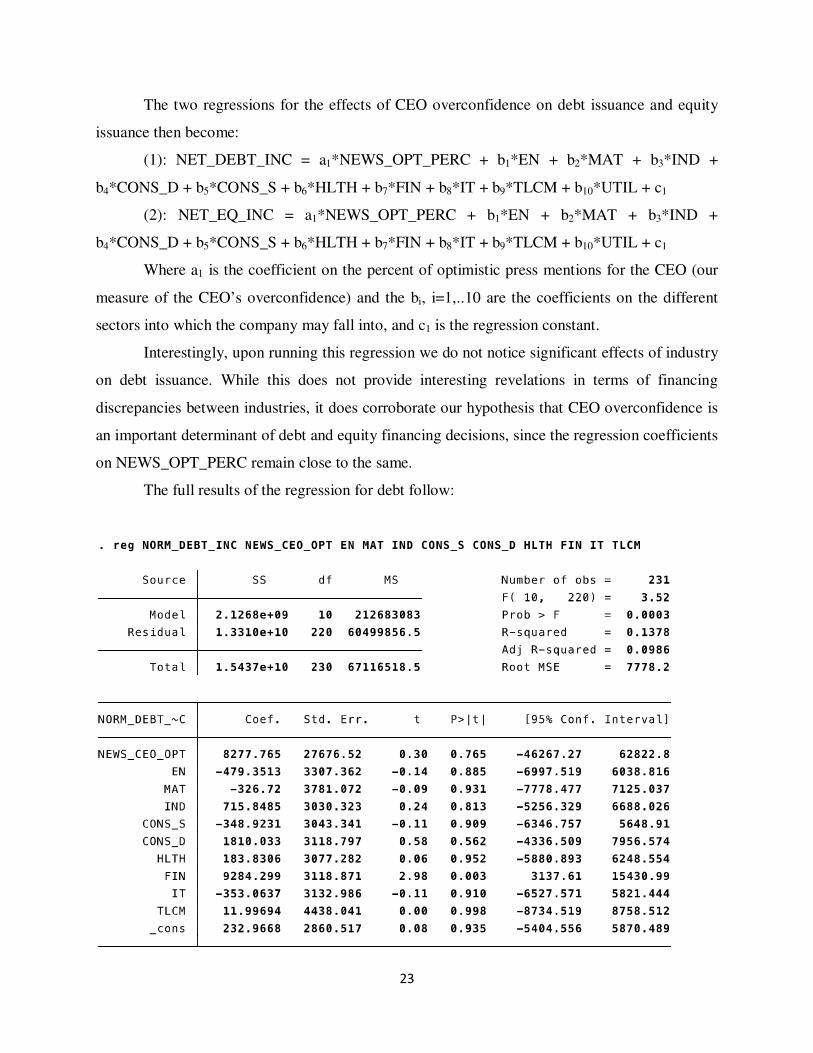
Interestingly, upon running this regression we do not notice significant effects of industry
on debt issuance. While this does not provide interesting revelations in terms of financing
discrepancies between industries, it does corroborate our hypothesis that CEO overconfidence is
an important determinant of debt and equity financing decisions, since the regression coefficients
on NEWS_OPT_PERC remain close to the same.
The full results of the regression for debt follow:
24
where NORM_DEBT_INC refers to the normalized (average annual) net debt increase or
decrease for a CEO, NEWS_CEO_OPT is the percentage optimistic press for the CEO (one way
to measure CEO overconfidence), EN is energy sector, MAT is a dummy for material sector,
IND is a dummy for industrials sector, CONS_S is a dummy for consumer staples sector,
CONS_D is a dummy for consumer discretionary sector, HLTH is a dummy for health care
sector, FIN is a dummy for financials sector, IT is a dummy for informationa technology sector,
and TLCM is a dummy for telecommunications sectors (note that UTIL, dummy for utilities
sector, is omitted in the above regression because it is collinear with the other industry sector
variables present).
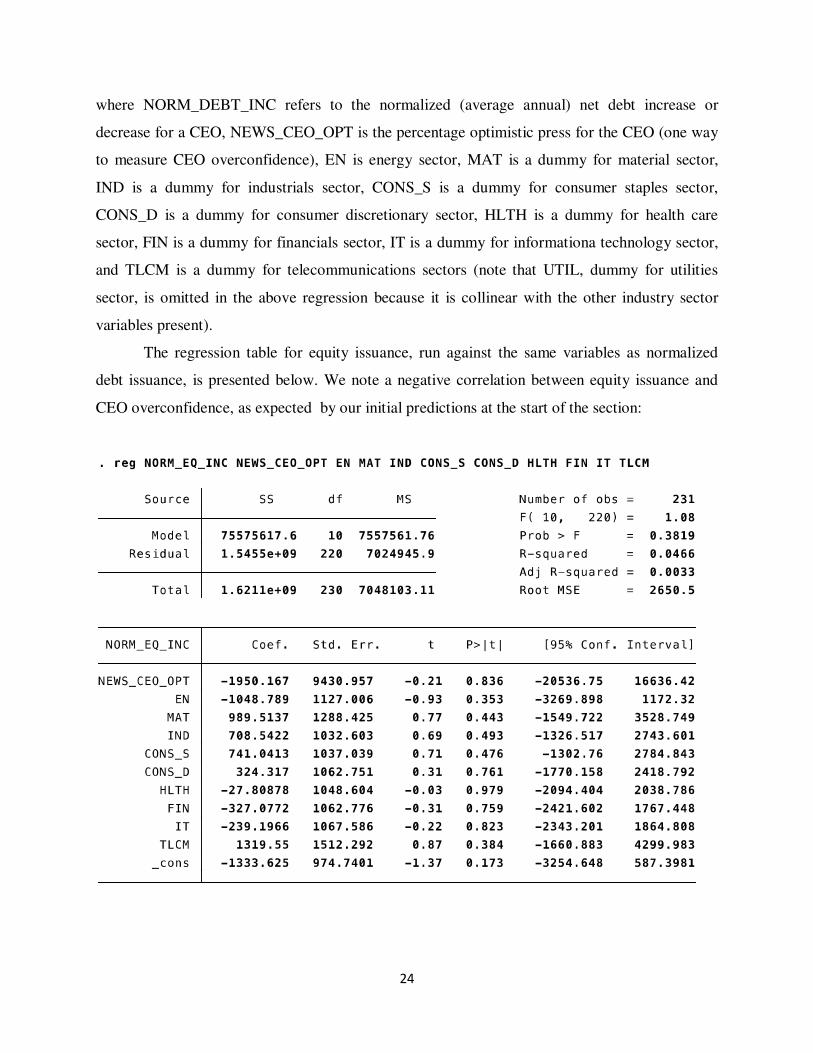
The regression table for equity issuance, run against the same variables as normalized
debt issuance, is presented below. We note a negative correlation between equity issuance and
CEO overconfidence, as expected by our initial predictions at the start of the section:

25
where NORM_EQ_INC refers to the normalized (average annual) net equity increase or decrease
for a CEO and the other variables have the same meanings as in the regression immediately
preceding this one.
From these results, it is evident that the financial sector and consumer discretionary
sector experience the strongest debt issuance trends, while materials, energy, and information
technology sectors experience the least. This can potentially be attributed to the rise of the
financial services industry through the late 90s and early 2000s, before the financial crisis of
2008-2009. Clearly, financial company CEOs and analysts alike were overconfident about the
industry. This is in line with our prediction that overconfident CEOs would choose to issue more
debt.
4.7 Tax Relief Act of 2003 Effects
While we distinguish between debt and equity financing decisions and run our
regressions taking into account dummy variables for company industries, one aspect we do not
consider is year fixed effects. Our reasons for this are two-fold. Firstly, with the limited sample
of Fortune 500 CEOs, our data would be very sparse and potentially less conclusive if we do not
consider all CEOs in one sample but rather break them apart year-by-year. Secondly, neither
people’s personal overconfidence nor corporate structure is likely to have changed significantly
over 10 years.
However, there is an important piece of legislation that should theoretically strongly
affect levels of equity issued, and which we therefore wish to consider in our analysis. This piece
of legislation, the Jobs and Growth Tax Relief Reconciliation Act of 2003, falls squarely within
our range of data and must therefore be taken as part of our analysis. We define a variable for
whether a given CEO operated mostly during the period of 2003 and beyond, as
2003_DIV_TAX_RELIEF. This variable is 1 if the average of the CEO’s start date year and end
date year is greater than 2003, and 0 otherwise. In effect, it is a dummy variable loosely
representing whether the CEO operated and made financing decisions once the law had been
passed.

26
The Jobs and Growth Tax Relief Reconciliation Act of 2003 itself is a piece of legislation
passed under the governance of President George W. Bush, with provisions for individual rate,
capital gains, dividends, and estate tax cuts taking effect in 2003 and set to expire in 2010 (the
provisions have since been renewed). In conjunction with the Economic Growth and Tax Relief
Reconciliation Act of 2001, this act forms part of the “Bush tax cuts”, and among other
provisions lowered taxes of income from dividends and capital gains. The capital gains tax
decreased from rates of 8%, 10%, and 20% to 5% and 15%, while taxes on qualified dividends,
which include most income from non-foreign corporations, were reduced to capital gains
levels.12
Various literature on the subject indicates predictable effects of the act on corporation’s
equity financing allocations. Brav, Graham, Campbell, and Michaely (2008) argue that there was
a temporary increase in dividend disbursements, though this increase was not long-lasting. In
fact, their data show that while dividend payments understandably increased immediately
following the dividend tax cut act, there was a large increase in share repurchases shortly
thereafter and surveyed CEOs claimed that the act had a very negligible effect on their decision-
making.13 Chetty and Saez (2004), meanwhile, also demonstrate a spike in dividend payments
immediately following the act, though they point out the spike is much more pronounced in firms
of certain characteristics, such as those with lower levels of forecasted growth or those with large
executive ownership and low levels of executive stock options outstanding.14 Since these papers
demonstrate a pronounced change in financing allocation between debt and equity following the
dividend tax cut act, we take this act into account as a control variable for the effects of
overconfidence on capital structure decisions.
12 Jobs and Growth Tax Relief Reconciliation Act (JGTRRA) of 2003 (PL 108-27) 13 Brav, Alon, John R. Graham, Campbell R. Harvey, and Roni Michaely. “The Effect of the May 2003 Dividend Tax Cut on Corporate Dividend Policy: Empirical and Survey Evidence.” National Tax Journal 61 (2008): 381-96. 14
Chetty, Raj and Emmanuel Saez. “Dividend Taxes and Corporate Behavior: Evidence from the 2003 Dividend Tax Cut.” NBER Working Paper No. 10841 (2004)

27
The results of our regression including this control variable are as follows:
Upon running our regression, however, we find support for Bray, Graham, Campbell, and
Michaely’s (2008) conclusion that the increase in dividends was short-lived, and was in fact
followed by a large increase in share repurchases. The 95% confidence interval for the
coefficient on _DIV_TAX_RELIEF in this case does not include 0, which indicates that there is
strong evidence the dividend tax act did not have large long-term positive effects on equity
issuance. Consequently, our results regarding the effects of overconfidence on equity issuance
for the decade 1997-2007 remain unchanged.

28
5. CONCLUSION
Traditional theory emphasizes economic costs and benefits such as tax deductibility for
justifying capital structure, but there has been observed stickiness in firms’ capital structure
decisions that cannot be completely explained through this trade-off analysis. In our paper, we
attempt to explain this discrepancy by addressing the effects of the personal managerial
characteristic of overconfidence on corporate investment decisions. We build on prior research
concerning the effects of CEO overconfidence on debt and equity issuance, as well as relate this
to research regarding how CEO overconfidence affects dividends or inspires innovation.
Most of the research for CEO overconfidence has insofar considered the period 1984-
1990; since this sample data range has become less relevant with the passing of decades, we turn
our research to determine whether CEO overconfidence effects on debt and equity issuance are
still present in the decade 1997-2007. Demonstrating whether or not this is the case would not
only enable these facts to be more relevant for present day investment decisions in companies
with overconfident CEOs, but also demonstrate that the effect is extendable from decade to
decade, supporting the belief that CEO overconfidence should be treated as an important variable
in financing models. In the case of a stronger positive correlation between CEO overconfidence
and equity rather than debt financing, meanwhile, we could potentially pave the way for ruling
out the possibility that CEO overconfidence is a strong indicator of corporate financing decisions
that overvalue debt and undervalue equity.
We build a proxy for CEO overconfidence through optimistic press coverage, and use
this measure for regressions of the net equity issued and net debt issued by each CEO. For our
sample of the top 231 CEOs from the top 100 Fortune 500 companies over the decade 1997-
2007, we find that the values of regression coefficients do suggest that overconfidence plays a
significant role in corporate financing decisions – a net increase in debt financing of 5% and net
increase in equity financing of .2% is determined by the regression. This demonstrates that if the
regression coefficients can be taken as given, overconfident CEOs prefer to issue debt over
equity, and issue significantly more debt and slightly more equity than less overconfident CEOs.
However, at the same time we experience a very tenuous link between CEO overconfidence and
debt and equity financing because of the high probability with which we are able to reject the
regression coefficient. We cannot conclude that this coefficient is nonzero for either debt or for

29
equity issuance; furthermore, the range for the 95% confidence intervals on these coefficients is
very large, even when we take industry dummy variables into account and consider whether the
Jobs and Growth Tax Relief Reconciliation Act may be affecting our results.
Consequently, we are unable to conclude with certainty that CEO overconfidence
influences corporate financing decisions during the time period of the incumbent CEO, and
ultimately our results show that the link between CEO overconfidence and financing decisions
may not be as clear-cut or widespread as previously imagined. While our results show a subtle
preference for debt over equity financing by overconfident CEOs, the fact that overconfidence as
a variable explains so little of the deviation for financing decisions among these CEOs leads to
the question of whether it is a significant determinant at all. To answer this question, we hope
and suggest to pursue further research on CEO overconfidence and financing decisions,
potentially considering different time periods from the two considered in previous research and
this paper, or focusing attention on CEOs of smaller rather than larger Fortune 500 companies
where the effects of managerial qualities may be more prominent and more directly transfer to
the company’s chosen financing strategy.
Alternative extensions, some influenced by the data observed in this paper, include the
effects of industry and legislature on corporate financing decisions. In practical models, new
legislature should always be taken into account (similarly to how the going discount rate is
always updated in pricing models) by changing the initial environment variables within which
the company is taken to initially operate. Similarly, from our data we have seen that industry
appears to be a strong determinant of the level of debt and equity issuance the company is
comfortable with; determining and testing the motivations for these industry differentials could
be an interesting addition to the existing literature on capital structure decisions. Finally, CEO
overconfidence itself could be extended to various other attributes, as has been done by the
literature mentioned in the introductory section regarding mergers and acquisitions and
innovation; managerial overconfidence is an important characteristic that has the potential to
explain many previously perplexing deviations from rationally predicted behavior, and we hope
to encourage further research concerning more recent time periods to help determine the
significance of these overconfidence effects.

30
REFERENCES Ataullah, Ali, Andrew Vivian, and Bin Xu. "Do Actions Speak Louder Than Words? Optimistic Disclosure Tone, Insider Trading and Capital Structure." Working paper (2013), Loughborough University Baker, Malcolm. "Capital market-driven corporate finance." Annual Review of Financial Economics 1.1 (2009): 181-205. Ben-David, Itzhak, John R. Graham, and Campbell R. Harvey. “Managerial overconfidence and corporate policies.” No. w13711. National Bureau of Economic Research (2007). Brav, Alon, John R. Graham, Campbell R. Harvey, and Roni Michaely. “The Effect of the May 2003 Dividend Tax Cut on Corporate Dividend Policy: Empirical and Survey Evidence.” National Tax Journal 61 (2008): 381-96. Campbell, T. Colin, et al. "CEO optimism and forced turnover." Journal of Financial Economics 101.3 (2011): 695-712. Chetty, Raj and Emmanuel Saez. “Dividend Taxes and Corporate Behavior: Evidence from the 2003 Dividend Tax Cut.” NBER Working Paper No. 10841 (2004) Deshmukh, Sanjay, Anand M. Goel, and Keith M. Howe. “CEO overconfidence and dividend policy.” No. 2009-06. Working Paper, Federal Reserve Bank of Chicago (2009). Elsas, Ralf, and David Florysiak. "Empirical capital structure research: New ideas, recent evidence, and methodological issues." Journal of Business Economics 6 (2008): 39-71. Fama, Eugene, and Kenneth French. “Testing trade-off and pecking order predictions about dividends and debt.” Review of Financial Studies 15 (2002): 1–33. Frank, Murray Z., and Vidhan K. Goyal. "Trade-off and pecking order theories of debt." Handbook of
Empirical Corporate Finance 2 (2005): 135-202. Galasso, Alberto, and Timothy S. Simcoe. "CEO overconfidence and innovation." Management Science 57.8 (2011): 1469-1484. Goel, Anand, and Anjan V. Thakor “Overconfidence, CEO selection, and corporate governance.” Journal
of Finance 63 (2008): 2737–2784. Hackbarth, Dirk. "Managerial traits and capital structure decisions." Journal of Financial and
Quantitative Analysis 43.04 (2008): 843-881. Hackbarth, Dirk. "Determinants of corporate borrowing: A behavioral perspective." Journal of Corporate
Finance 15.4 (2009): 389-411. Hayward, Mathew LA, Violina P. Rindova, and Timothy G. Pollock. "Believing one's own press: The causes and consequences of CEO celebrity." Strategic Management Journal 25.7 (2004): 637-653. Malmendier, Ulrike, and Geoffrey A. Tate. “CEO overconfidence and corporate investment.” Journal of
Finance 60 (2005): 2660–2700.

31
Malmendier, Ulrike, Geoffrey Tate, and Jon Yan. "Overconfidence and early‐life experiences: the effect of managerial traits on corporate financial policies." The Journal of Finance 66.5 (2011): 1687-1733. Malmendier, Ulrike, and Geoffrey Tate. "Who makes acquisitions? CEO overconfidence and the market's reaction." Journal of Financial Economics 89.1 (2008): 20-43. Frank, Murray Z., and Vidhan K. Goyal. "Capital structure decisions: which factors are reliably important?" Financial Management 38.1 (2009): 1-37. Villamil, Anne P. “The Modigliani-Miller Theorem.” The New Palgrave Dictionary of Economics. Palgrave Macmillan (2008) Waldman, David A., et al. "Does leadership matter? CEO leadership attributes and profitability under conditions of perceived environmental uncertainty." Academy of Management Journal 44.1 (2001): 134-143. Weisbach, Michael. “CEO turnover and the firm’s investment decisions.” Journal of Financial
Economics 37 (1995): 159–188.