Embed Size (px)
Citation preview

CEO Replacement in Turnaround Situations: Executive (Mis)fit and its Performance Implications
_______________
Guoli CHEN Donald C. HAMBRICK 2010/101/ST

CEO Replacement in Turnaround Situations: Executive (Mis)fit and
its Performance Implications
Guoli Chen*
Donald C. Hambrick**
Forthcoming at Organization Science
* Assistant Professor of Strategy at INSEAD, 1 Ayer Rajah Avenue 138676 Singapore
Ph: (65) 6799 5354 Fax: (65) 6799 5399 Email: [email protected] ** Smeal Chaired Professor of Management at Smeal College of Business, 414 Business
Building, The Pennsylvania State University University Park, PA 16802 Ph: (814) 863-0917 Fax: (814) 863-7261 Email: [email protected]
A Working Paper is the author’s intellectual property. It is intended as a means to promote research to interested readers. Its content should not be copied or hosted on any server without written permissionfrom [email protected] Click here to access the INSEAD Working Paper collection

1
CEO Replacement in Turnaround Situations: Executive (Mis)fit and Its Performance Implications
Abstract
Countering the widely-held view that CEO succession is generally beneficial in
turnaround situations, we adopt an executive fit/refit logic, proposing that the implications of
CEO replacement depend integrally on the incumbent’s degree of misfit and the successor’s
degree of fit to the contextual conditions at hand. Drawing from prior turnarounds research, we
identify several prominent forms of CEO fit/misfit that are especially germane for troubled
firms. In testing our hypotheses, we find substantial support for the fit/refit theory: Troubled
companies have substantially better performance to the extent that they replace incumbents who
are poorly suited to the conditions at hand, and when they appoint new CEOs who are well
matched to those conditions. Further reaffirming the fit/refit model, we find that CEO
replacement, per se, has no general effect on the improvement of troubled firms.

2
Research on chief executive officer (CEO) succession has evolved from an initial interest in
whether CEO replacement is generally beneficial or harmful to organizations (Guest 1962, Trow 1961), to
an emphasis on the contexts, or conditions, under which succession will have its most positive and
negative consequences (e.g., Karaevli 2007, Tushman and Rosenkopf 1996, Zhang and Rajagopalan
2004). Among the classes of firms studied, however, very little theoretical or empirical work has
pointedly considered the one setting where CEO replacement is especially prevalent and believed by
many to bring about improved performance: companies in turnaround situations, or established firms that
once performed satisfactorily, specifically in terms of profitability, but no longer do.1
Many turnaround experts see CEO replacement as an essential ingredient for business recovery
(Bibeault 1982, Hofer 1980, Kanter 2003), relying upon two main arguments: 1) poor performance is a
prima facie indication that incumbent leaders are not very effective, and 2) poor performance typically
necessitates major strategic and organizational changes, which incumbent CEOs are not inclined to
undertake. But, as noted, there is an absence of rigorous evidence that CEO succession is even
marginally helpful in turnaround situations.
The general literature on succession raises doubts about the benefits of CEO replacement,
showing that CEO turnover often causes trauma and imprudent changes which more than offset any
positive consequences (Carroll 1984, Haveman 1993). Firms in turnaround situations might especially
exhibit little improvement following CEO succession. The boards of such firms are often under pressure
to make prompt leadership changes, thus lacking deliberateness or care in such actions (Khurana 2002,
Zhang 2008). Boards of troubled companies are susceptible to seeing CEO replacement as a ceremonial
purging, in which the mere occurrence of succession is the important thing (Khurana 2002). And talented
incumbents, who may not be the source of their companies’ problems, may depart voluntarily due to
fatigue or wariness about their prospects (Semadini et al. 2008).
Doubts about any general benefits of CEO succession – even in troubled companies – can be
raised on logical grounds: For succession to bring about improved performance, the new CEO must be
3
better suited to the circumstances at hand than the predecessor. Simply changing the CEO for the sake of
change will not accomplish much. This is precisely the view taken by Finkelstein, Hambrick, and
Cannella (2009) in their portrayal of CEO succession as an occasion for boards to realign company
leadership with contextual conditions. According to Finkelstein et al’s “fit-drift/shift-refit” model, when
a board selects a new corporate leader, it has an opportunity to appoint a person whose competences fit
current and foreseeable contextual requirements. Over time, as contextual conditions drift (or possibly
radically shift), the CEO’s capabilities and mindset tend to become less suitable. Succession provides the
board a new opportunity to once again refit executive competencies to the altered context.
The fit/refit model provides a new vantage for considering the consequences of succession in
turnaround situations. Countering the view that CEO turnover, per se, is generally helpful for troubled
companies, we propose that the benefits of CEO replacement depend integrally on the attributes of the
two individuals involved: the incumbent’s degree of misfit and the successor’s degree of fit to the context
at hand. Consistent with prior research on organizational transformation and adaptation (e.g., Tushman
and Rosenkopf 1996, Virany et al. 1992, Volberda, 1999), the model highlights the importance of
alignment between managerial capabilities and contextual requirements. As such, it provides a corrective
to the assumption that incumbents in troubled companies are inherently unsuited for their positions and
that new CEOs will do better.
The challenge for scholars interested in applying fit/refit theory, as well as for boards who might
wish to use its insights, is in identifying, a priori, important attributes on which incumbents and potential
successors should be gauged. That is, the fit/refit model requires an a priori stipulation of contextual
conditions and the executive qualities most relevant for those conditions. To do this for companies in
turnaround situations, we followed a two-step process. We started by carefully reviewing the turnarounds
literature, ranging from early (e.g., Bibeault 1982, Hambrick and Schecter 1983, Hofer 1980, Robbins and
Pearce 1992, 1993, Pearce and Robbins 1993) to more recent works (e.g., Barker and Duhaime 1997,
Barker et al 2001, Burton et al 2003), to identify the most commonly-recurring prescriptions for

4
enhancing the chances of turnaround success. We were particularly interested in identifying “contingent
logics,” or “if/then prescriptions” (i.e., If a troubled company has a condition x, then it should emphasize
actions y to maximize chances of successful turnaround). It is only these types of contingent arguments
that allow us to specify certain forms of executive (mis)fit. As our second step, we narrowed to the subset
of prescriptions for which we could develop cogent arguments about the ideal CEO needed to fulfill, or
execute on, those normative premises.
This two-step process led us to three testable premises, which we develop below: 1) the more
severe a company’s losses, the more important it is for the CEO to be open to major change in general; 2)
the more severe the company’s losses, the more important it is for the CEO to be specifically oriented
toward, and adept at making, major cost and asset reductions; and 3) if the troubled firm is in a struggling
industry, it is important for the CEO to be cognitively unconstrained by the recipes of that industry.
Following the tradition of upper echelons research (Finkelstein et al. 2009), we conceptualized an
executive’s professional experience as reflective of one’s orientation.
These testable hypotheses do not encompass every possible contextual condition, or
corresponding executive characteristic, that might be relevant for companies in turnaround situations.
Collectively, however, they incorporate several of the most important conceptual elements that theorists
have used in models of the turnaround process: a) situation severity, or the criticality of the performance
shortfall; b) the cause of the problem (including industry problems, such as we feature); c) the role of
retrenchment, or asset/cost reductions, as part of the turnaround effort; and d) recovery, the degree to
which satisfactory performance is re-attained (e.g., Arogyaswamy et al. 1995, Hambrick and Schecter
1983, Pearce and Robbins 1993, Robbins and Pearce 1992).
Based on a sample of companies in turnaround situations, and with a comprehensive set of
controls, we find considerable support for our hypotheses. When boards of troubled companies remove
incumbents who are substantively mismatched for the contextual circumstances at hand, and when they
appoint new CEOs who are well matched to those conditions, the companies have greatly increased

5
chances of improvement. We find that CEO succession per se does not have any effect on subsequent
performance of troubled companies, further highlighting the importance of considering executive fit and
misfit rather than the mere occurrence of succession.
Theory and Hypotheses
Prior Literature on Consequences of CEO Replacement Under Poor Performance
Research bearing on the consequences of turnover in poorly performing organizations is distinctly
equivocal (Finkelstein et al. 2009). On one side is the conclusion that CEO replacement under poor
performance conditions amounts to ritualistic scapegoating. Because successions occur
disproportionately in low-performance situations, some studies show performance increases after
successions; but these improvements are due to regression-to-the-mean, and once prior performance is
controlled for, succession has no effect (Brown 1982, Khurana and Nohria 2000).
This “no effects” view is reinforced by literature on the “romance of leadership,” which asserts
that humans, in their quest for simple explanations for complex phenomena, tend to attribute extreme
organizational performance – either good or bad – to leaders (Meindl et al. 1985), but that such
attributions far exceed the amount of influence that top executives actually have on organizational
outcomes (Lieberson and O’Connor 1972). The “no-effects” view is also supported by evidence that
executive succession can carry substantial liabilities (e.g., Carroll 1984, Haveman and Khaire 2004), such
that any benefits of CEO succession are offset by its drawbacks.
The opposite perspective exists in the literature on managerial entrenchment (Boeker 1992, Denis
et al. 1997). Under this view, grounded in agency theory, CEO replacement needs to happen more often
than it does (Faleye 2007, Warner et al. 1988). Because of passive or coopted boards, incumbent CEOs
who have brought about their companies’ problems – or who are not equipped to solve the problems – are
often able to hold onto their jobs well beyond their point of adequacy (Weisbach 1988). Additionally,
prior research suggests that hiring new CEOs and executives has both symbolic and substantive effects,
for instance, to impress the market (Chen et al 2008, Warner et al 1988), to bring new resources and

6
different behavior patterns into the firm (Chen et al 2009, Shen and Cannella 2002), and to facilitate the
reconfiguration of organizational policies and strategies to adapt to the environment (Virany et al 1992).
The literature on business turnarounds explicitly asserts the desirability of CEO replacement in
troubled companies (Bibeault 1982, Castrogiovanni et al. 1992). According to this view, poor
performance is evidence of executive inadequacy; incumbents are unable or unwilling to make the major
changes necessary to fix struggling companies; and, beyond the need for substantively new directions,
there is the need to reassure stakeholders that changes are coming and that the company is in good hands
– a reassurance that is difficult for incumbents to convey (Barker et al. 2001, Hofer 1980). As evidence
of the importance of CEO replacement in turnaround situations, Bibeault (1982) reported that about three-
fourths of the troubled companies he studied had replaced their CEOs.
In sum, troubled companies tend to experience CEO replacement, but no reasonable prediction
can be made as to whether such successions are generally beneficial or not. Some – perhaps many –
successions amount to ceremonial acts, in which talented CEOs are fired or encouraged to leave, and their
successors merely possess the main qualification of being new. But some successions may indeed be
adaptive events, involving the removal of incumbents who are not well suited for the conditions at hand,
and the appointment of successors who have qualities that match the firm’s contextual circumstances.
Fit/Refit Model of CEO Succession
Finkelstein, Hambrick, and Cannella’s (2009) fit-drift/shift-refit model provides a basis for
predicting which CEO successions will have the most positive consequences. The fit/refit model rests on
two interconnected logics. First, executives have finite repertoires and context-specific capabilities. As
such, a given executive may be highly suited for one context but not for another (Gupta and Govindarajan
1984, Carpenter et al. 2001); an executive who is well suited to lead a firm during one period may be ill-
suited for the next period (Henderson et al. 2006, Miller and Shamsie 2001). Second, succession provides
a periodic occasion for firms to realign leadership qualifications with new contextual conditions (Barker
et al. 2001, Pfeffer and Salancik 1978).

7
According to the fit/refit model, when a board selects a new corporate leader, it has an
opportunity to appoint a person whose qualifications and expertise fit the contingencies that are currently
at hand (or imminent). As time passes, however, the CEO who initially fit the contextual requirements
will typically fit less well. This change may be due to the gradual drift, or radical shift, of contextual
conditions in directions that require capabilities other than those possessed by the incumbent (Miller
1991). It will be the rare executive who can transform his or her mindset and repertoire to match such
contextual changes, and therefore a misfit arises. When the incumbent is replaced, the board has an
opportunity to refit a new CEO’s competencies to the changed conditions facing the firm.
Although Finkelstein et al. imply that boards try to prudently take advantage of these realignment
opportunities, those authors acknowledge that successions often deviate from this ideal. They note that
some capable incumbents are scapegoated or depart voluntarily; and some new executives may not be
suitable, as board politics, cloning tendencies, or inappropriate attraction to colorful candidates may drive
the selection process (Khurana 2002, Zajac and Westphal 1996). We adopt this more liberal view of the
fit/refit model; thus, instead of envisioning that CEO successions generally involve the departure of
unsuitable incumbents and the selection of suitable successors, we propose that if CEO successions have
these features, there is an increased chance of favorable performance outcomes.
Specific Forms of Predecessor Misfit and Successor Fit
As we have discussed, the fit/refit logic has two discrete parts. On the one hand, replacement will
be beneficial to the extent that the incumbent is ill-suited to the contextual conditions facing the firm. If
the incumbent actually has the requisite qualities, but perhaps simply has had bad luck or been buffeted
by factors outside his or her control, there is little reason to expect that a new person would do any better.
But if the incumbent is lacking the qualities called for, then his or her departure, ceteris paribus,
heightens the chances of performance improvement. The second aspect of the fit/refit logic resides in the
qualities of the successor CEO and their alignment with contextual requirements. Executive replacement
will tend to be efficacious to the extent that the newly-appointed person has qualifications that align with

8
the contingencies at hand. Merely having a new CEO, but who lacks the specific orientation called for,
confers little chance for performance improvement.
Thus, in developing specific ideas about context-executive fit, we present a series of mirrored
pairs of hypotheses: one addresses the predecessor’s degree of misfit, and an accompanying one
addresses the successor’s degree of fit. It is useful to note the importance of separately specifying (and
empirically analyzing) the hypotheses about predecessor misfit and successor fit. Not all predecessors are
replaced; therefore the relevant assessment for predecessor misfit involves three considerations: What is
the context? What are the incumbent’s characteristics? And is the incumbent replaced? By comparison,
successors can only be assessed in those cases where replacement in fact has occurred (Thus, our
hypotheses regarding successor fit all carry the preface, “Given CEO replacement…”). Here, only two
conceptual elements are relevant: What is the context? And what are the successor’s characteristics?
We should emphasize that “context” enters into our theorizing at two levels. At the broad level,
constituting the boundary condition for our entire project, we only study firms in turnaround situations.
This type of framing is in keeping with the thrust of succession researchers to focus on specific classes of
firms (Carroll 1984, Haveman 1993), rather than attempting to theorize any universal succession effects.
As such, all of our hypotheses carry an implied preface, “In the context of a turnaround situation…”
At the narrower level, however, we consider more specific contextual conditions which firms in
turnaround situations face in varying degrees. From the literature on turnarounds, we examine how
performance severity (the gravity of the company’s problems) and industry problems (poor industry
profitability) impose certain imperatives on some troubled companies more than on others – in ways that
allow a priori predictions about preferred executive characteristics (e.g., Arogyaswamy et al. 1995,
Pearce and Robbins 1993). While well justified by the turnarounds literature, these contextual conditions
are not the only ones that might reasonably be considered. As such, our hypotheses illustrate the logic
and implications of CEO fit and misfit but do not constitute a comprehensive inventory of all possibilities.
Firm performance severity and CEO tenure/origin. Firms in turnaround situations vary in the

9
severity of their situations (e.g., Barker and Duhaime 1997, Hofer 1980, Pearce and Robbins 1993),
specifically the magnitudes of their losses. If a firm is experiencing only minor losses, refinements of the
current strategy may be most sensible. But, if the firm’s losses are severe, substantial changes are needed.
Severe performance shortfalls call for major transformations; fine-tuning will not yield a turnaround
(D’Aveni 1989, Tushman and Rosenkopf 1996).
As noted earlier, one of the main reasons CEO replacement is often seen as an essential ingredient
for troubled firms is that incumbents are seen as cognitively and socially committed to the status quo, and
only new leaders are able to undertake the requisite changes (Castrogiovanni et al. 1992). But we can
envision that incumbents vary in their commitment to the status quo; similarly, successors vary in the
degree to which their repertoires deviate from the status quo.
CEO tenure has been shown to be a major determinant of an executive’s disinclination to
consider or execute major changes (Barker and Mueller 2002, Miller and Shamsie 2001, Wiersema and
Bantel 1992). Longer-tenured CEOs have made more of an accumulated imprint on their firms, and it is
difficult for them to reverse past choices (Miller 1991); they have developed strong social commitments
within their firms (Simsek et al. 2005); and their paradigms are more rooted in the distant rather than the
more recent past (Hambrick and Fukutomi 1991). As such, long-tenured executives are often cognitively
constrained, possessing limited perspectives on alternatives (Hatum 2007, Miller and Shamsie 2001). As
evidence of these effects, studies have shown that executive tenure (either on the job or in the firm) is
associated with strategic persistence (Finkelstein and Hambrick 1990) and “commitment to the status
quo,” or an executive’s conviction that current strategies and policies will remain appropriate for the
future (Hambrick et al. 1993). As such, a long-tenured incumbent is ill-suited for the major changes
called for by severely poor performance; replacing the incumbent will tend to improve the chances of
successful turnaround.
Hypothesis 1: The interactive combination of severe losses, incumbent CEO’s tenure length, and CEO replacement will be positively associated with subsequent company performance.2

10
Correspondingly, performance severity has implications for the ideal profile of a new CEO.
Again, if performance is extremely poor, incremental changes will probably not be sufficient (Tushman
and Rosenkopf 1996). Such firms need the fresh perspective of an outsider, who will tend to be
cognitively and socially open to change (Shen and Cannella 2002). Although CEOs hired from outside
the company carry the drawback of limited understanding of their firms’ operations (e.g., Karaevli 2007),
they often provide the best chance for the requisite magnitude of change under extremely poor
performance. We expect that a company-outsider successor, without historical embeddedness with the
focal firm or its strategy, and thus with few social or cognitive constraints, is most likely to undertake the
major changes needed to reverse a severe performance.
Hypothesis 2: Given CEO replacement, the interactive combination of severe losses and a company-outsider successor will be positively associated with subsequent company performance.
Firm performance severity and throughput-oriented CEO. Turnaround scholars have
proposed a link between the severity of a firm’s losses and the degree to which cost and asset reductions,
or a retrenchment strategy, are essential for recovery (Arogyaswamy et al. 1995, Burton et al. 2003,
Robbins and Pearce 1992). The underlying logic is that if a troubled firm is operating substantially below
its break-even point, it is very difficult, if not impossible, to increase revenues enough to achieve a profit
position (Hofer 1980, Slatter 1984). Instead, it is only by reducing the breakeven point, by eliminating
costs and/or assets, that successful turnaround becomes feasible. In contrast, firms that are in less severe
situations, operating slightly below breakeven, have more flexibility in choosing either revenue-
generating or minor cost-cutting strategies to become profitable again.
Given that firms in deep trouble are in greater need of cost and/or asset reduction, CEOs who have
competencies in these domains represent the ideal fit. In this vein, we highlight the importance of an
executive’s functional experience, following prior research using background characteristics to represent
cognitive orientations (Hambrick and Mason 1984, Barker and Mueller 2002, Wiersema and Bantel 1992).
Executives who have been immersed in a particularly function will attend to certain information in

11
complex business situations and interpret that information in ways that suit their functional expertise
(Dearbon and Simon 1958). Thus, functional backgrounds provide a lens through which managers see
business problems and their solutions (Carpenter et al. 2004, Fligstein 1990). With the passage of time
and the accumulation of career successes in a given area, executives tend to develop a mode of thinking
and acting that is typical for that specific expertise (Schein 1968, Schneider 1987).
An executive whose primary experience has been in throughput-oriented functions (e.g.,
operations or accounting) tends to emphasize cost control, asset rationalization, and efficiency; these are
the approaches that the executive has become adept at and will tend to rely on to execute a turnaround.
By contrast, an executive with an output-oriented background (e.g., marketing, sales, or product
development) tends to emphasize revenue growth and market expansion as recovery strategies, which are
less appropriate for firms in deep trouble. Even if an output-oriented incumbent CEO were to recognize
the need for retrenchment, he or she might have great difficulty actually executing such a strategy,
because it differs from his or her core skills. Given that retrenchment is necessary for firms incurring
severe losses, incumbents who lack experience primarily in throughput functions will be ill-suited for the
requirements at hand. Replacing such executives should enhance chances of a successful turnaround.
Hypothesis 3: The interactive combination of severe losses, an incumbent lacking experience primarily in throughput functions, and CEO replacement will be positively associated with subsequent company performance.
Correspondingly, successor CEOs who have significant throughput-oriented experience will tend
to fit with the requirements imposed by severe performance; such executives will have the efficiency-
oriented expertise needed to enhance the chance of successful turnaround.
Hypothesis 4: Given CEO replacement, the interactive combination of severe losses and a successor with experience primarily in throughput functions will be positively associated with subsequent company performance.
Industry performance severity and CEO tenure/origin. Turnaround researchers have long
drawn a distinction between troubled firms that are in relatively healthy industries versus those that are in
struggling, low-profit industries (Arogyaswamy et al. 1995, Castrogiovanni et al 1992). For companies in

12
poorly performing industries, the challenge is to find creative ways to deviate from the conventions of
peer companies. The worse the industry’s health, the greater the call for strategic deviance from industry
norms. However, doing so is often difficult, as industries tend to develop entrenched paradigms which
participant firms – and their executives – come to take for granted (Spender 1989).
Just as a CEO’s tenure on the job tends to bring about a commitment to the company’s status quo,
so too does tenure in the industry bring about an adherence to the industry’s norms and mindsets
(Geletkanycz 1997, McDonald and Westphal 2003). For the troubled company in a struggling industry,
then, the chances are very slight that an incumbent CEO with long industry tenure will be able to design
and executive a strategy – or even expedient tactics – that deviate from industry practices. Thus:
Hypothesis 5: The interactive combination of industry performance severity, incumbent’s industry tenure length, and CEO replacement will be positively associated with subsequent company performance.
Correspondingly, a troubled firm in a struggling industry will benefit from having a new CEO
who has minimal commitments to the focal industry’s norms and practices —an industry outsider. Such
an executive provides fresh perspectives, new knowledge, and expertise to facilitate the requisite
departure from industry recipes (Hatum 2007, Zhang and Rajagopalan 2004). Thus:
Hypothesis 6: Given CEO replacement, the interactive combination of industry performance severity and an industry-outsider successor will be positively associated with subsequent company performance.
METHODS
Sample and Identification of Firms in Turnaround Situations
Since our aim was to study established firms that encountered turnaround situations, we drew our
sample from Standard and Poor’s 1500 index companies, in the years 1990 to 2003. We excluded
financial firms; and, to allow meaningful industry-level controls, we limited our sample to companies that
derived at least 70 percent of their revenues from their primary 3-digit SIC industry (Zhang and
Rajagopalan, 2004). From this set, we used data from COMPUSTAT to identify companies in
turnaround situations: those that had operating returns on equity (ROE, before extraordinary items)

13
greater than their cost of equity (COE) for at least two consecutive years in our sample period,
immediately followed by a year of operating losses (again, before extraordinary items).3 Thus, these were
companies that abruptly swung from satisfactory performance to very poor performance.
In keeping with prior studies, we drew our sample from listings of established companies,
excluding small and embryonic firms (Bibeault, 1982); and we stipulated multiple years of satisfactory
performance, as a way to confirm that the companies had been somewhat reliably high-performing (e.g.,
Robbins and Pearce 1992). Our requirement that satisfactory performance needed to be followed by
absolutely poor performance (an operating loss) is a criterion on which prior researchers have differed.
Some have stipulated that declining performance, regardless of absolute level, constitutes a turnaround
situation (e.g., Schendel et al. 1976,), while others have argued that performance needs to be below some
absolute threshold (e.g., Barker and Mone 1994, Hambrick and Schecter 1983). We adopted the latter
approach to ensure that we were sampling genuinely troubled firms, rather than simply stagnant or slowly
deteriorating firms. Our identification of turnaround firms without regard to industry profitability is also
a matter on which prior researchers have taken varying approaches (e.g., Barker and Duhaime 1997,
Robbins and Pearce 1992). Although our analyses comprehensively control for industry profitability (as
we shall discuss), we believe it is most logical to consider a firm that is incurring losses as in a turnaround
situation; regardless of industry conditions, the company cannot continue as it is.
Where our operationalization differs most appreciably from prior studies is that we did not
stipulate that sampled firms had to experience multiple years of poor or declining performance (Barker
and Duhaime 1997, Pearce and Robbins 1993) to qualify as being in a turnaround situation. We adopted
our approach to address some important issues relevant to our specific research question. Most notably,
our approach acknowledges that the incidence of CEO replacement increases sharply upon the very onset
of poor performance. In our sample, for instance, the rate of CEO departures in the first year of operating
losses was about double the typical rate of CEO turnover – probably reflecting a combination of well-
considered dismissals, scapegoating, and hastened voluntary exits. Our operationalization thus allows us

14
to address whether early departures, or which early departures, are helpful (or possibly harmful) for
abruptly troubled firms. Moreover, our approach allows us to consider the timing of CEO replacement in
troubled firms. If we were to examine only companies that had already experienced multiple years of
problems, we would be prevented from exploring whether swift CEO replacement, upon the onset of
initial problems, tends to arrest (or aggravate) the problem. More generally, by relaxing the stipulation
that a turnaround situation exists only after multiple years of poor performance, researchers have an
opportunity to pursue a new, important question: How might a company that plummets into losses
minimize the continuation or worsening of those losses?
We should further emphasize that our operationalization of a turnaround situation, requiring a
one-year swing from healthy profits to operating losses, does not mean that the problems confronting
these companies were minor or necessarily short-lived. Our criterion is more stringent than one of the
operationalizations used by Bibeault (1982) in his widely-noted book on turnarounds: a profit decline of
80 percent or more in a single year. About 73 percent of our sample had an Altman’s Z-score below 3.00
in the year of initial losses (Altman 1983), and thus faced considerable threat of bankruptcy, a criterion
sometimes used to identify firms in turnaround situations (Barker and Duhaime 1997). Moreover, the
seriousness of our companies’ situations is evidenced by their performance profiles four years after the
first onset of losses: only a third had re-attained profit levels above their cost of equity; another third were
making marginal profits; and a third were still incurring losses.
In sum, we examined a specific type of turnaround situation: established companies that abruptly
swung from satisfactory profits to losses.4 Applying the above criteria, we identified 223 firms in
turnaround situations. Treating the initial year of losses as Year 0, the median ROE of sample firms in
Years -2, -1, and 0 were .18, .17, and -.07, respectively. Median revenues of sample firms in Year 0 were
$1.3 billion, and the median age (as public companies) was 22 years.
Measurement of Subsequent Performance
We assessed a firm’s subsequent performance, or its degree of turnaround success, by examining

15
two measures: ROE and market-to-book value of common equity (MTB).5 ROE is an accounting-based
indicator; MTB captures market-based performance. We investigated firm performance at Years +2, +3,
and +4 (where Year 0 was the year of initial losses), a timeframe consistent with prior research on the
consequences of CEO succession (Karaevli 2007, Shen and Cannella 2002).
CEO Replacement and Fit/Misfit Variables
CEO replacement: We used the Execucomp and Factiva databases to identify whether and
when firms replaced their CEOs. We analyzed replacements occurring in Years 0 and +1. If there was
replacement in either of these years, we coded a “CEO replacement” dummy variable as a one. As a
control (described below), we also coded the timing of succession. In our sample of 223 firms, 98
replacements occurred during Years 0 and +1. This represents an annual rate of 22 percent, which is
double the incidence of CEO succession in major U.S. firms (Lucier et al. 2005).
To measure predecessor misfit and successor fit, we used the following component variables:
Firm performance severity: This was measured by reverse coding firm performance at Year 0,
i.e., the year when the firm entered its turnaround situation. The worse the ROE (or market-to-book ratio,
to correspond to the measures of subsequent performance), the more severe the performance crisis. This
variable also served to control for regression to the mean.
Industry performance severity: To test Hypotheses 5 and 6, which dealt with the degree of
performance severity in struggling industries, we first identified an industry as struggling if its median
ROE-COE spread was negative during all the years -2, -1 and 0. This three-year period was used to
ensure that industry problems were not temporary. Then, among the struggling industries, we reverse
coded industry median performance at Year 0 to measure industry performance severity. In turn, firms
that were in non-struggling industries were given industry performance severity scores of zero. All
indicators of industry performance were based on all the firms in the 3-digit industry in the
COMPUSTAT database, not just those in our sample.
Incumbent CEO’s tenure: This was measured by the number of years the incumbent had been

16
CEO in the focal firm. Data on employment histories were drawn from proxy statements, Dun and
Bradstreet’s Reference Book of Corporate Management, Capital IQ, and Standard and Poor’s Register of
Corporations, Directors, and Executives.
Incumbent’s industry tenure: This was the number of years the incumbent CEO had worked in
the focal firm’s primary industry (3-digit SIC).
Functional experience: A CEO’s primary functional background was that in which he or she
had the longest employment history. Following prior research, functional experience was categorized as
output (marketing, sales, and product development), throughput (operations, engineering, and accounting),
or other (law, consulting, finance, general management) (Hambrick and Mason 1984, Rajagopalan and
Datta 1996). Based on this categorization, a dummy variable – “non-throughput incumbent” – was coded
as one if the incumbent’s primary function was not throughput-oriented, and zero otherwise. Similarly, if
the successor CEO’s primary function was throughput-oriented, we coded the dummy variable,
“throughput-oriented successor,” as a one.
Company-outsider CEO: Consistent with prior research, we coded a dummy variable as a one if
the new CEO had less than two years’ tenure in the firm (Shen and Cannella 2002).
Industry-outsider CEO: This was measured as a dummy variable, coded as a one if the new
CEO was hired from a different industry (3-digit SIC).
Control Variables
Prior performance: Because a company’s performance prior to its problems could indicate its
fundamental strength, we included a variable, prior performance, which was measured as the company’s
average performance for Years -2 and -1 (either ROE or MTB, depending on the dependent variable).
Industry performance: We controlled for the median performance in the company’s primary
industry, both in Year 0 and in each subsequent year (Year +2, +3 and +4), to account for industry effects.
(Again, depending on the dependent variable, we use industry ROE or MTB in the corresponding models.)
Initial analyses revealed collinearity between industry median MTB in Year 0 and subsequent years.

17
Thus, we created an instrumental variable by regressing industry median MTB in Year 0 on median MTB
in subsequent years, and included the residuals in our models.6 To ease interpretation, untransformed
variables are used when reporting our descriptive statistics.
Firm characteristics: We also controlled for several firm characteristics, including firm age (the
log of the number of years a firm had been public), firm size (the log of sales), leverage ratio (total debt
divided by total assets), and liquidity ratio (the quick ratio).
Replacement year dummy: As noted, we analyzed CEO replacements that occurred in Years 0
or +1. To control for the potential effect of how early the CEO was replaced, we created a dummy
variable: replacement in Year 0 (coded as “1” if the replacement occurred in Year 0, and “0” otherwise).
Multiple replacement dummy: A few firms in our sample had an additional CEO change after
replacing their CEO in Years 0 or +1, probably indicating ongoing trauma (e.g., Allen et al. 1979); thus,
we included a dummy variable for such cases.
Later replacement: We included another control dummy variable – later replacement – to
account for the possibility that a firm might make a delayed change in its CEO. This dummy variable was
coded as “1” if a firm had no succession in Years 0 or +1 but did change its CEO in Years +2 or +3.
Incumbent’s talent: Even though all the companies in our sample were experiencing problems,
their incumbent CEOs varied greatly in their track records, i.e., their evidence of talent. To proxy for the
CEO’s talent level, we used a method developed by Bertrand and Mullainathan (2001) and Garvey and
Milbourn (2006). Focusing on the four years preceding the year of initial performance problems (Year 0),
we used up to 48 monthly return (depending on the incumbent’s start date) for each firm. We regressed
firm monthly raw stock returns on equally weighted industry stock returns (defined by SIC-3 digit codes)
and year dummies. Each firm’s average residual from this regression reflects the firm-specific element of
performance, which was used to proxy for the incumbent’s talent level.7 This control helps to account for
the possibility that the departure of a highly talented incumbent might be more damaging to a firm’s
prospects than the departure of a less talented incumbent. Indeed, in our analyses of incumbent misfit, we

18
included an interaction control variable: CEO replacement times incumbent talent.
Correction for endogeneity. To control for endogeneity, or the possibility that some conditions
particularly increase the likelihood of succession, we regressed CEO replacement on firm performance
(ROE in Year 0), leverage ratio, CEO characteristics (age, tenure and talent), agency conditions (e.g.,
outside director ratio, CEO ownership, CEO duality, institutional shareholders’ ownership) and industry
characteristics (e.g., industry performance severity, industry dynamism [a measure of five-year sales
volatility]). Based on this model, we calculated each firm’s likelihood of replacing its CEO, and included
the probability score as an endogeneity control in our second-stage analysis.8
Control for selection bias: In testing our successor fit hypotheses, we necessarily used the
subsample in which CEO replacement in fact occurred, representing a truncated distribution. To control
for potential selection bias, following prior research (e.g., Zajac and Westphal 1996), we used the
Heckman two-stage model (Heckman 1979). The first-stage model was the same as for endogeneity, but
a probit model predicting the likelihood of CEO replacement. Here we generated an inverse Mills ratio, a
probability density function which corrects for the estimation bias due to the truncated observations. This
inverse Mills ratio was then included in the second-stage analysis as an instrumental variable to correct
for any selection bias.
Estimation Methods
In estimating the effects of succession on subsequent performance, we adopted a multi-year
approach (examining Years +2, +3, and +4), rather than arbitrarily focusing on just one year. Because
each firm thus contributed three observations, we had 669 (223*3) firm-year observations in our analysis
of predecessor misfit, and 294 observations (98*3) in our analysis of successor fit. We included year
dummies in our models to indicate the specific year being assessed (Year +4 was omitted).
Because our panel data included repeated measures, and because some predictor variables were
time-invariant, we used random-effects regressions with robust standard errors (Greene 2003, Petersen
1993, Pfarrer et al. 2010).9 We used the coldiag command in Stata 10 to assess multicollinearity; none of
19
the condition statistics were high enough to cause concern (Belsley et al. 1980).
RESULTS
Table 1 presents descriptive statistics and correlations for all variables.
----- Insert Table 1 here -----
Predecessor Misfit
Table 2 reports results for our tests of the effects of predecessor misfit. Because we have two
performance measures, ROE and MTB, we present two sets of models. For each set, the first model
includes all controls as well as the component variables of all interactions. In these base models, two
results are particularly noteworthy. First, CEO replacement itself had no effect on subsequent
performance. At odds with the prescription of some turnaround experts (e.g., Bibealt 1982, Hofer 1980,
Kanter 2003), our sample of companies did not improve their prospects simply by changing their CEOs.
Second, and relatedly, the interaction of CEO replacement and incumbent talent was significantly
negatively associated with subsequent performance. Thus, replacing a relatively untalented CEO yielded
beneficial results, while replacing a talented CEO was harmful to subsequent performance.
----- Insert Table 2 here -----
In Models 2-4, we test each respective hypothesis by including relevant 2-way interactions, as
well as hypothesized 3-way interactions (context x predecessor characteristic x replacement; in bold). All
interactions were mean-centered. Model 5 includes all variables.
In support of Hypothesis 1, the combination of firm performance severity and long incumbent
tenure and CEO replacement was significant in its positive effect on performance (although only
marginally in the full model of MTB). There was also a significant negative effect for the 2-way
interaction between firm performance severity and incumbent’s CEO tenure. Thus, in cases of severe
performance troubles, having a long-tenured incumbent is generally harmful; replacing such a CEO is
helpful, on average. Figure 1a shows these effects graphically (assuming median values of all controls).

20
----- Insert Figure 1 here -----
We also found support for Hypothesis 3: the combination of firm performance severity and a non-
throughput incumbent and CEO replacement was positively associated with both forms of performance.
There was also a significant negative effect for the 2-way interaction between performance severity and a
non-throughput incumbent. Thus, when losses are severe, a non-throughput incumbent exerts a negative
effect on performance; replacing such a CEO tends to help performance. Figure 1b shows these results
graphically for ROE.
Finally, we found support for Hypothesis 5. The combination of industry performance severity
and incumbent’s long industry tenure and CEO replacement was positively associated with both forms of
performance. There were also two significant 2-way interactions: the interaction between industry
performance severity and CEO replacement, and the interaction between industry performance severity
and incumbent’s industry tenure (although this effect was not observed in the full ROE model). Thus,
CEO replacement is beneficial if the industry is deeply struggling, and this positive effect is amplified
when the replaced CEO is a long-term industry veteran. These results are portrayed in Figure 1c.
Successor Fit
Our results for successor fit are presented in Table 3. The models for successor fit differed from
those for predecessor misfit in two main ways. As noted earlier, we could only include those firms which
replaced their CEOs, and thus used a Heckman two-stage analysis to control for potential selection bias.
In addition, we included the predecessor misfit variables in our analysis. Thus, results in Table 3 show
the net influence of successor fit on subsequent performance, while controlling for the degree of
predecessor misfit. Model 1 includes all control and component variables; Models 2 to 4 add the
hypothesized successor fit 2-way interactions (bold) (mean-centered); and Model 5 is the full model.
----- Insert Table 3 here -----
To test Hypothesis 2, we examined the interaction between firm performance severity and
company-outsider successor (Model 2). Results were positive and significant for both ROE and MTB,

21
including in the full models. Thus, in cases of performance severity, company-outsider successors had an
improved chance (compared to insiders) of bringing performance improvement, supporting Hypothesis 2.
Figure 2a shows these results graphically for ROE.
----- Insert Figure 2 here -----
Model 3 included the interaction between firm performance severity and throughput-oriented
successor. We found positive and significant results for both ROE and MTB, including in the full Model
5. Thus, Hypotheses 4 was generally supported. Figure 2b portrays the ROE results graphically.
Finally, we examined another form of successor fit, as expressed in Hypothesis 6: industry
performance severity and a successor hired from another industry. Results in Model 4 show that this
interaction was positively significant both for ROE and MTB, and these significant results remained in
the full models (although only marginally for MTB). Thus, Hypothesis 6 was generally supported. The
ROE results are portrayed in Figure 2c.
DISCUSSION
Scholars have long sought to identify the general effect of CEO succession on organizational
performance, with largely null results. A more recent tradition has been to examine successions in certain
classes of firms – e.g., relatively young firms or firms in dynamic industries – a refinement which sheds
somewhat more light on the consequences of CEO replacement (e.g., Haveman and Khaire 2004,
Tushman and Rosenkopf 1996). But even these studies have stopped short of what may be the most
promising logic for predicting the consequences of CEO succession: Replacement will be efficacious to
the extent that the incumbent is poorly suited, and the new CEO is well suited, for the conditions at hand.
We pursued this logic, conducting an initial test of Finkelstein et al’s (2009) fit/refit model, which views
CEO succession as a periodic opportunity for boards to re-align leadership capabilities with contextual
conditions.
As a counterpoint to the common assertion that troubled companies benefit from CEO
replacement, we drew from the turnarounds literature to identify several forms of predecessor misfit and

22
successor fit. We found considerable support for the following propositions about CEO (mis)alignment
in turnaround situations: 1) if performance problems are severe, the company will benefit from replacing
a long-tenured CEO, and it will benefit from an outside successor; 2) If performance problems are severe,
the company will benefit from replacing a CEO who lacks throughput experience (for managing major
asset/cost rationalization), and it will benefit from appointing a successor who has such credentials; and 3)
if the industry performance problems are severe, the company will benefit from replacing a long-tenured
industry veteran, and it will benefit from hiring an industry-outsider.
Although other forms of CEO (mis)alignment could be envisioned, just our three pairs of
hypotheses allow a substantially improved understanding of turnaround success. The predecessor misfit
characteristics we examined added six percent to the explained variance of subsequent ROE (Table 2).
And for those firms that did replace their CEOs, the successor fit characteristics we examined added nine
percent to the explained variance of subsequent ROE (Table 3).
Further highlighting the importance of the fit/refit logic, we found that CEO replacement, per se,
had no effect on the subsequent performance of troubled companies. A less flattering interpretation is
that boards of turnaround companies are not, in the aggregate, very adept in their replacement decisions.
Boards may succumb to any number of well-known distortions in CEO hiring, including political
compromises (Cannella and Lubatkin 1993, Zajac and Westphal 1996), an undue emphasis on executive
charisma (Khurana 2002), or simply superstition that CEO replacement – in and of itself – is a cure-all,
regardless of who is leaving and who is arriving.
Combinations of Predecessor Misfit and Successor Fit
We purposely set up our hypotheses, and tests of them, so as to consider predecessor misfit and
successor fit as separate ceteris paribus conditions. However, the logic of the fit/refit model ultimately
envisions that succession will be most beneficial to the extent that the predecessor is unsuitable and the
successor is suitable, or that the new person is “better suited” than the old. This line of thought, in turn,
necessitates a focus on combinations of predecessor characteristics and successor characteristics, which is

23
analytically complex – essentially involving 4-way interactions – but tractable.
As an indication of how such a line of inquiry might progress in the future, we provide an
illustrative analysis of predecessor-successor combinations. We focus here on the logic behind
Hypotheses 1 and 2, the idea that severe performance problems call for the departure of a long-tenured
predecessor and the appointment of an outside successor. Drawing from our sub-sample of companies in
which succession occurred, we selected those that had the most severe losses in Year 0, using a median
split (ROE -.07). We then coded four succession conditions: 1) short-tenured predecessor (split at
median, seven years) and insider successor, 2) short-tenured predecessor and outsider successor; 3) long-
tenured predecessor and insider successor; and 4) long-tenured predecessor and outsider successor. The
first category is one in which the predecessor is not a misfit and the successor is not a fit; this
combination should accomplish the least in terms of performance improvement. The next two categories
(2 and 3) are cases in which either the predecessor is a misfit or the successor is a fit, but not both; these
combinations should have a moderate effect on performance. Finally, group 4 is those firms in which an
unsuitable CEO departs and a suitable one arrives; they should show the most improvement.
We then conducted similar regression analysis as described earlier, using ROE as the dependent
variable. We included all the controls in Model 1 of Table 3, as well as the predecessor-successor
combination dummies (omitting Category 1). Regression coefficients for the categories are presented in
the first column of Appendix 1. As expected, the coefficient for Category 4 (predecessor misfit and
successor fit) is significant and largest (.16, indicating a 16 percent ROE improvement relative to
Category 1, the omitted group). Groups 2 and 3, as expected, have moderate coefficients. In sum, this
limited analysis suggests that, under conditions of severe performance problems, the combined departure
of a long-tenured incumbent and appointment of an outsider is highly beneficial; at the other extreme,
departure of a short-tenured incumbent and appointment of an inside successor accomplishes the least.
It is beyond our scope to examine every combination, and such a discussion would quickly
become tedious. But this partial analysis indicates the promise in considering predecessor and successor
24
attributes in tandem, which may be an important new avenue for succession researchers.
Executive Actions in Turnaround Situations: An Illustrative Analysis
In line with most studies of CEO succession, we focused on company performance as our
dependent variable. However, one might reasonably ask how succession affects the actions of firms in
turnaround situations. We undertook a limited inquiry to illustrate how researchers might apply the
fit/refit model to predict post-succession executive behaviors.
Our illustrative analysis focused on the same context as reported in Appendix 1: those companies
that faced the most severe performance shortfalls in Year 0. Recall that prior literature suggests that the
most severe turnaround situations warrant the greatest amount of change, particularly aggressive
retrenchment (Hofer 1980, Pearce and Robbins 1994, Robbins and Pearce 1992, 1993); moreover, we
argued that long-term insiders would be least likely, and outsiders most likely, to make these changes.
As shown in Appendix 1, we examined how four distinct predecessor/successor combinations
were related to three types of actions commonly associated with retrenchment: changes in fixed assets,
changes in employee headcount, and changes in selling/general/administrative (SGA) expenses. We
again used random-effects regression, in which all control variables in Table 3, as well as the
predecessor/successor category dummies, were included (omitting Category 1). As expected, Category 4
– departure of a long-tenured predecessor and appointment of an outside successor – was associated with
the biggest cuts in fixed assets, employees, and SGA spending. Categories 2 and 3 exhibited various
intermediate patterns; and, by extension, Category 1 – the departure of a short-tenured predecessor and
appointment of an insider successor – brought about the smallest cuts.
Appendix 1 suggests a coherent theme: When a company faces a severe situation, requiring
major changes and especially retrenchment, the chances of these actions occurring – and of recovery – are
greatest when a long-tenured incumbent departs and an outsider arrives. Conversely, the chances of these
outcomes are slight when a short-tenured incumbent leaves and an insider successor is appointed. This
partial analysis further reaffirms the general logic of the fit/refit model, and it highlights the opportunity

25
for researchers to consider the actions that follow succession, as well as performance.
Limitations and Future Directions
As with any study, ours has limitations, which in turn suggest additional avenues for research.
First, in keeping with the recent trend among succession scholars to focus on specific classes of firms, we
purposely limited our scope to companies in turnaround situations. It would be highly fruitful for
researchers to apply and extend the fit/refit theory to other distinct classes of firms, possibly including
founder-led and rapid-growth companies.
Second, we focused on a limited set of predecessor misfit and successor fit conditions among
turnaround companies. While just these few forms of CEO (mis)alignment add substantially to
explaining subsequent performance of troubled firms, other forms might be considered. For example, a
company that has suffered severe ethical or legal lapses may benefit from a CEO who has legal or other
relevant expertise. Or a company with severely lagging product innovation might benefit from a CEO
who has technology or marketing expertise.
Third, we examined the effects of CEO replacement on subsequent performance, without fully
considering the intervening actions taken by the CEOs. Our illustrative post hoc analysis suggests the
promise of examining post-succession strategic behaviors.
Finally, we treated CEO replacement as having potentially uniform implications for all
companies, even though it is known that CEOs have more discretion in some settings than in others (e.g.,
Finkelstein and Boyd 1998). It might be, for instance, that our logic of CEO fit/refit would be most
strongly supported in high-discretion industries (high growth, differentiable products, not highly
regulated), but barely at all observed for companies in low-discretion industries.
Theoretical Implications and Summary
Our study has implications for multiple research streams, most notably upper-echelons theory.
We extend, to a new arena, the centrally important idea that executives have finite, bounded repertoires
(Henderson et al. 2006, Miller and Shamsie 2001), and that the value of a given executive’s repertoire

26
depends on the business context. Such ideas of executive “fit” have been applied in other ways, but not in
the study of CEO succession. We also extend the basic concept of executive fit to include its obverse,
“executive misfit.” Interestingly, when theorists apply the resource-based view to describe a firm’s
managers as key resources (Castanias and Helfat 1991), they rarely consider the possibility that
executives are sometimes liabilities for their firms, depending on the business context.
We also contribute to the literature on turnarounds. Our results indicate that CEO change, in
itself, accomplishes very little for such companies. We suspect that the conventional wisdom about CEO
replacement, coupled with the “romance of leadership” (Meindl et al. 1985), propel boards of troubled
companies to view replacement as a ritualistic act, instead of as an occasion to deliberately recalibrate the
company’s executive competencies with the conditions facing the firm, as envisioned in the fit/refit
model. We anticipate that some highly suitable CEOs – who may have substantial firm-specific expertise
and may have corrective measures underway – are unwisely forced out of troubled firms. And we
envision that some successors are hired simply because they represent a fresh face or possess colorful
qualities which may be largely irrelevant for the job that needs to be done (Khurana 2002). Our study
also provides indirect support for some propositions in earlier turnaround research, for instance the need
for retrenchment if the performance problem is severe (e.g., Hofer 1980, Pearce and Robbins 1994).
Finally, our study has implications for agency theory and governance research. Our results
suggest that CEO replacement decisions in troubled companies, on average, are not very efficacious; but
the departure of ill-suited incumbents and the hiring of well-suited successors help to bring about
improvement. The question then arises: Which boards get it right? Prior research has addressed how
governance conditions influence the likelihood of CEO departure (Boeker 1992), but few studies have
considered how boards differ in their inclinations to dismiss or hire “correctly” (Zhang 2008).
In sum, our study provides a foundation for additional inquires into the implications of CEO
replacement. More broadly, our project highlights the promise of extending the classic idea of executive

27
fit to the arena of CEO turnover, particularly by considering two individuals’ qualities: the predecessor’s
degree of misfit and the successor’s degree of fit for the conditions at hand.
Endnotes
1 Our definition is adapted from those in prior prominent works on turnarounds, including: “when performance declines and the survival of the firm is threatened” (Barker et al. 2001: 235) and “when a firm encounters multiple years of declining financial performance subsequent to a period of prosperity” (Pearce and Robbins 1993: 623). The performance thresholds vary in different studies, which we discuss in our method section. 2 It is important to emphasize that the fit/refit model allows no predictions about the main effects of these component variables, or of any two-way interactions, on performance. It is only the combination of context, incumbent attributes, and replacement that allows any cogent expectations. Still, our analysis will show the various main- and two-way effects. 3 Cost of equity was calculated as follows: COEit = Riskft + βit * Riskp, where Riskft is the risk-free rate for 1-year U.S. treasury bills in yeart; βit is the beta for the firmi in yeart estimated with its prior five-year monthly return data provided by CRSP database; and Riskp is the market risk premium, estimated at seven percent (Brealey and Myers 2000, Stewart 1991). While some studies have used return of investment (ROI) to operationalize turnaround situations, we wished to compare a firm’s ROE and COE to ensure that the firm’s return was above the cost of equity during the pre-turnaround period. 4 As a sensitivity test, we conducted our analyses on a subsample of firms that had two consecutive years of losses (instead of just one year), and the results were similar to what we report. Still, our findings may not apply for other conceptualizations of turnaround situations. 5 We also examined ROA, with results were very similar to what we report for ROE. 6 We also used the performance change in the focal industry as an alternative to address this issue. The results were similar to what we report here. 7 We cannot use this method to measure successor CEOs’ talents, because most successors were not previously CEOs of public companies. 8 Results of this endogeneity model are available from the authors. 9 An advantage of random effects models is that time invariant variables can be included, whereas in fixed effects models their effects are absorbed by the intercept. The random effects model enables us to control for within-firm variance, allowing between-firm comparisons (Petersen 1993) and limiting losses of observations that can lead to model convergence problems (Rao et al. 2000). A Hausman test based on models with time-varying variables that compared random to fixed effect models was insignificant, indicating that the random-effect approach was suitable (Hausman 1978, Greene 2003). As a robustness check, we also applied a generalized estimating equations (GEE) regression model, a method found suitable for panel data because it measures both within and between firm variance and generates robust estimates of standard errors (Ballinger 2004, Pfarrer et al. 2010). Our results in these different models remained consistent.
28
REFERENCES
Allen AP, Panian SK, Lotz RE. 1979. Managerial succession and organizational performance: A recalcitrant problem revisited. Admin. Sci. Quart. 24(2): 167-180
Altman EI. 1983. Corporate Financial Distress: A Complete Guide to Predicting and Avoiding Bankruptcy. Wiley: New York
Arogyaswamy K, Barker V, Yasai-Ardekani M. 1995. Firm turnarounds: an integrative two-stage model. J. Management 32: 493-525
Ballinger GA. 2004. Using generalized estimating equations for longitudinal data analysis. Organizational Research Methods 7: 127-150
Barker V, Duhaime I. 1997. Strategic change in the turnaround companies: Theory and empirical evidence. Strategic Management J 19(1): 13-38
Barker V, Mone M. 1994. Retrenchment: cause of turnaround or consequence of decline? Strategic Management J 15(5): 395-405
Barker VL, Mueller GC. 2002. CEO characteristics and firm R&D spending. Management Sci. 48(6): 782-801
Barker VL, Patterson PW, Mueller GC. 2001. Organizational causes and strategic consequences of the extent of top management team replacement during turnaround attempts. J. Management Studies 38(2): 235-269
Belsley DA, Kuh E, Welsch RE. 1980. Regression diagnostics: Identifying influential observations and sources of collinearity. John Wiley and Sons: Hoboken, NJ
Bertrand M, Mullainathan S. 2001. Are CEOS rewarded for luck? The ones without principals are. Quart. J. Econom. 116(3): 901-932
Bibeault DB. 1982. Corporate Turnaround: How Managers Turn Losers Into Winners. McGraw-Hill
Boeker W. 1992. Power and managerial dismissal: Scapegoating at the top. Admin. Sci. Quart. 37
Brealey RA, Meyers SC. 2002. Principles of corporate finance. McGraw-Hill Higher Education
Brown MC. 1982. Administrative succession and organizational performance: The succession effect. Admin. Sci. Quart. 27: 1-16
Burton GD, Ahlstrom D, Wan JC. 2003. Turnaround in east Asian firms: Evidence from ethnic overseas Chinese comunities. Strategic Management J. 24(6): 519-540
Cannella AA, Lubatkin MH. 1993. Succession as a sociopolitical process: Internal impediments to

29
outsider selection. Acad. Management J. 36(4): 763
Carpenter MA, Geletkanycz MA, Sanders WG. 2004. Upper echelons research revisited: Antecedents, elements, and consequences of top management team composition. J. Management 30: 749-778
Carpenter MA, Sanders WG, Gregersen HB. 2001. Bundling human capital with organizational context: The impact of international assignment experience on multinational firm performance and CEO pay. Acad. Management J. 44(3): 493-511
Carroll GR. 1984. Dynamics of publisher succession in newspaper organizations. Admin. Sci. Quart. 29(1): 93-113
Castanias R, Helfat C. 1991. Managerial resources and rents. J. Management 17(1): 155-172
Castrogiovanni G, Baliga B, Kidwell R. 1992. Curing sick businesses: Changing CEOs in turnaround efforts. Acad. Management Executives 6(3): 26-41
Chen G, Hambrick DC, Pollock, T. 2008. Puttin’on the ritz: Pre-IPO enlistment of prestigious affiliates as deadline-induced remediation. Acad. Management J. 51(5): 954-975
Chen G, Trenino LK, Hambrick DC. 2009. CEO elitist association: Toward a new understanding of an
executive behavioral pattern. Leadership Quart 20(3):316-328
D'Aveni RA. 1989. The aftermath of organizational decline: A longitudinal study of the strategic and managerial characteristics of declining firms. Acad. Management J. 32(3): 577-605
Dearborn DC, Simon HA. 1958. Selective perception: A note on the department identifications of executives. Sociometry 21: 140-144
Denis DJ, Denis DK, Sarin A. 1997. Ownership structure and top executive turnover. J. Financial Econom. 45(2): 193-221
Faleye O. 2007. Classified boards, firm value, and managerial entrenchment. J. Financial Econom. 83(2): 501-529
Finkelstein S, Boyd BK. 1998. How much does the CEO matter? The role of managerial discretion in the setting of CEO compensation. Acad. Management J. 41(2): 179-199
Finkelstein S, Hambrick DC. 1990. Top-management-team tenure and organizational outcomes: The moderating role of managerial discretion. Admin. Sci. Quart. 35: 484-503
Finkelstein S, Hambrick DC, Cannella AA. 2009. Strategic Leadership: Theory and Research on Executives, Top Management Teams, and Boards. Oxford
Fligstein N. 1990. The Transformation of Corporate Control. Harvard University Press: Cambridge, MA
Garvey G, Milbourn T. 2006. Asymmetric benchmarking in compensation: Executives are rewarded

30
for good luck but not penalized for bad. J. Financial Econom. 82(1): 197-225
Geletkanycz MA, Hambrick DC. 1997. The external ties of top executives: Implications for strategic choice and performance. Admin. Sci. Quart. 42: 654-681
Greene WH. 2003. Econometric Analysis (6th ed.). Prentice Hall
Guest R. 1962. Managerial succession in complex organizations. Amer. J. Sociol. 68: 47-56
Gupta A, Govindarajan V. 1984. Business Unit Strategy, Managerial Characteristics, and Business Unit Effectiveness at Strategy Implementation. Acad. Management J. 27(1): 25-41
Hambrick DC, Fukutomi GD. 1991. The seasons of a CEO's tenure. Acad. Management Rev. 16: 719-742
Hambrick DC, Geletkanycz MA, Fredrickson JW. 1993. Top executive commitment to the status quo: Some tests of its determinants. Strategic Management J. 14: 401-418
Hambrick DC, Mason P. 1984. Upper echelons: The organization as a reflection of its top managers. Acad. Management Rev. 2: 193-206
Hambrick DC, Schecter SM. 1983. Turnaround strategies for mature industrial-product business units. Acad. Management J. 26(2): 231-248
Hatum, A. 2007. Adaptation or expiration in family firms: organizational flexibility in emerging economies. Bodmin, Cornwall: MPG Books Ltd.
Haveman HA. 1993. Ghosts of managers past: Managerial succession and organizational mortality. Acad. Management J. 36(4): 864-881
Haveman HA, Khaire MV. 2004. Survival beyond succession? The contingent impact of founder succession on organizational failure. J. Business Venturing 19(3): 437-463
Heckman JJ. 1979. Sample selection bias as a specification error. Econometrica 47: 153-162
Henderson AD, Miller D, Hambrick DC. 2006. How quickly do CEOs become obsolete? Industry dynamism, CEO tenure and company performance. Strategic Management J. 27(5): 447-460
Hofer C. 1980. Turnaround strategies. Journal of Business Strategy 1: 19-31
Kanter RM. 2003. Leadership and the psychology of turnarounds. Harvard Bus. Rev. 81(6): 58-69
Karaevli A. 2007. Performance consequences of new CEO "outsiderness": Moderating effects of pre- and post-succession contexts. Strategic Management J. 28(7): 681-706
Khurana R. 2002. Searching for a Corporate Savior: The Irrational Quest for Charismatic CEOs. Princeton University Press

31
Khurana R, Nohria N. 2000. The performance consequences of CEO turnover. Manuscript (Draft) MIT Sloan and Harvard University
Lieberson S, O'Connor JF. 1972. Leadership and organizational performance: A study of large corporations. American Sociological Review 37(2): 117-130
Lucier C, Schuyt R, Tse E. 2005. CEO succession 2004: The world’s most prominent temp workers. . Strategy+ Business 39: 1-16
McDonald ML, Westphal JD. 2003. Getting by with the advice of their friends: CEOs' advice networks and firms' strategic responses to poor performance. Admin. Sci. Quart. 48: 1-32
Meindl JR, Ehrlich SB, Dukerich JM. 1985. The romance of leadership. Admin. Sci. Quart. 30: 521-551
Miller D. 1991. Stale in the saddle: CEO tenure and the match between organization and environment. Acad. Management J. 37(1): 34-52
Miller D, Shamsie J. 2001. Learning across the life cycle: Experimentation and performance among the Hollywood studio heads. Strategic Management J. 22(8): 725-745
Pearce JA, Robbins DK. 1993. Toward improved theory and research on business turnaround. J. Management 19(3): 613-636
Pearce JA, Robbins DK. 1994. Retrenchment remains the foundation of business turnaround. Strategic Management J. 15: 407-417
Petersen T. 1993. Recent advances in longitudinal methodology. Annual Review of Sociology 19: 425-454
Pfarrer MD, Pollock TG, Rindova VP. 2010. A tale of two assets: The effects of firm reputation and celebrity on earnings surprises and investors' reactions. Acad. Management J. In press
Pfeffer J, Salancik CR. 1978. The external control of organizations: A resource dependence perspective. Harper and Row: New York
Rajagopalan N, Datta DK. 1996. CEO characteristics: Does industry matter? Acad. Management J. 39(1): 197-215
Robbins DK, Pearce JA. 1992. Turnaround: Retrenchment and Recovery. Strategic Management J. 13(4): 287-309
Robbins DK, Pearce JA. 1993. Entrepreneurial retrenchment among small manufacturing firms. Journal of Business Venturing 8(4): 301-318
Schein EH. 1968. Attitude change during management education. Admin. Sci. Quart. 13: 601-621
Schendel D, Patton G, Riggs J. 1976. Corporate turnaround strategies: A study of profit decline and

32
recovery. Journal of General Management 3(3): 3-11
Schneider B. 1987. The people make the place. Personnel Psych. 40: 437-453
Semadeni M, Cannella AA, Fraser DR, Lee DS. 2008. Fight or flight: Managing stigma in executive careers. Strategic Management J. 29(5): 557-567
Shen W, Cannella AA. 2002. Revisiting the performance consequences of CEO succession: The impacts of successor type, postsuccession senior executive turnover, and departing CEO tenure. Acad. Management J. 45(4): 717-733
Simsek Z, Veiga JF, Lubatkin MH, Dino RN. 2005. Modeling the multilevel determinants of top management team behavioral integration. Acad. Management J. 48(1): 69-84
Slatter S. 1984. Corporat Recovery. Penguin Books: Harmandsworth, Middlesex, England
Spender JC. 1989. Industry Recipes: The Nature and Sources of Managerial Judgment. Oxford: Basil Blackwell
Trow DB. 1961. Executive succession in small companies. Admin. Sci. Quart. 6(2): 228-239
Tushman ML, Rosenkopf L. 1996. Executive succession, strategic reorientation, and performance growth: A longitudinal study in the U. S. cement industry. Management Sci. 42(7): 939-953
Virany B, Tushman ML, Romanelli E. 1992. Executive succession and organization outcomes in trubulent environments: An organizational learning approach. Organ. Sci. 3: 72-91
Volberda HW. 1999. Building the flexible firm: How to remain competitive Oxford University Press
Warner JB, Watts RL, Wruck KH. 1988. Stock prices and top management changes. J. Financial Econom. 20: 461-492
Weisbach MS. 1988. Outside directors and CEO turnover. J. Financial Econom. 20: 431-460
Wiersema MF, Bantel KA. 1992. Top management team demography and corporate strategic change. Acad. Management J. 35(1): 91-121
Zajac EJ, Westphal JD. 1996. Who shall succeed? How CEO/board preferences and power affect the choice of new CEOs. Acad. Management J. 39: 64-90
Zhang Y. 2008. Information asymmetry and the dismissal of newly appointed CEOs: An empirical investigation. Strategic Management J. 29(8): 859-872
Zhang Y, Rajagopalan N. 2004. When the known devil is better than an unknown god: An empirical study of the antecedents and consequences of relay CEO. Acad. Management J. 47(4) 483-500

33
Figure 1: Effects of Predecessor Misfit on Subsequent Performance (ROE), Under Conditions of CEO Replacement
Figure 1a
0.00
0.05
0.10
0.15
0.20
0.25
0.30
Lo w s everity in firm perf. (1 s .d. be lo w mean)
High s everity in firm perf (1 s .d. abo ve mean)
RO
E
Figure 1b
0.00
0.05
0.10
0.15
0.20
0.25
0.30
Lo w s everity in firm perf. (1 s .d. belo w mean)
High s everity in firm perf (1 s .d. abo ve mean)
RO
E
Figure 1c
0.00
0.05
0.10
0.15
0.20
0.25
0.30
Low severity inindustry perf. (1 s.d.
below mean)
High severity inindustry perf. (1 s.d.
above mean)
RO
E
Replaced incumbent with long industry tenure (1 s.d. above mean)
Replaced incumbent with short industry tenure (1 s.d. below mean)
Replaced incumbent with primary experience in non-throughput function
Replaced incumbent with primary experience in throughput function
Replaced incumbent with long CEO tenure (1 s.d. above mean)
Replaced incumbent with short CEO tenure (1 s.d. below mean)
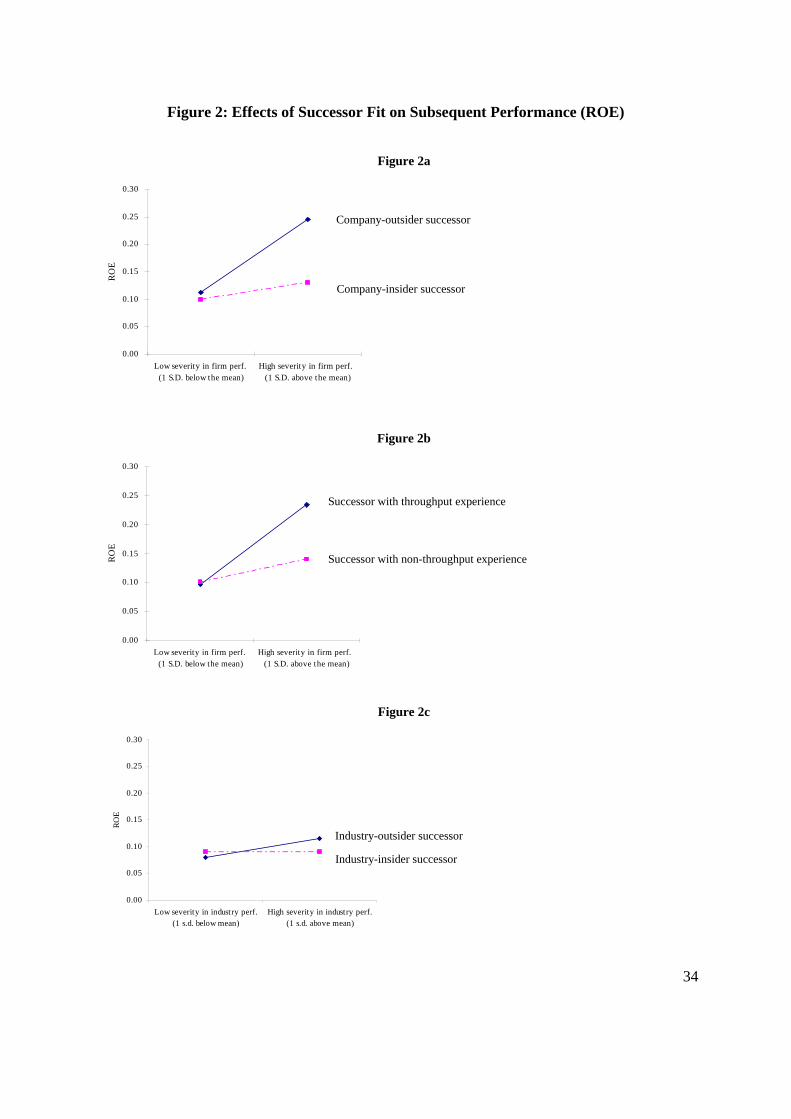
34
Figure 2: Effects of Successor Fit on Subsequent Performance (ROE)
Figure 2a
0.00
0.05
0.10
0.15
0.20
0.25
0.30
Low severity in firm perf. (1 S.D. below the mean)
High severity in firm perf. (1 S.D. above the mean)
RO
E
Figure 2b
0.00
0.05
0.10
0.15
0.20
0.25
0.30
Low severity in firm perf. (1 S.D. below the mean)
High severity in firm perf. (1 S.D. above the mean)
RO
E
Figure 2c
0.00
0.05
0.10
0.15
0.20
0.25
0.30
Low severity in industry perf.(1 s.d. below mean)
High severity in industry perf.(1 s.d. above mean)
RO
E
Industry-outsider successor
Industry-insider successor
Successor with throughput experience
Successor with non-throughput experience
Company-outsider successor
Company-insider successor

35
Table 1: Descriptive Statistics and Correlations a
Mean S.D. 1 2 3 4 5 6 7 8 9 10 11 12 13 14 15 16 17 18 19 20 21 22 23 24 25 26 27
1 ROE in Years -2 and -1 .19 .06
2 MTB in Years -2 and -1 1.69 1.26 .54
3 ROE in Year 0 (reverse- coded as firm perf severity)
-.14 .11 .01 .09
4 MTB in Year 0 (reverse-coded as firm perf severity)
1.14 .96 .48 .58 .13
5 Industry median ROE in Year 0
.06 .05 -.24 -.31 .07 .29
6 Industry median MTB in Year 0
1.03 .55 .33 .40 .12 .45 .38
7 Industry median ROE in subsequent years
.07 .07 .21 .35 .02 .36 .19 .33
8 Industry median MTB in subsequent years
1.13 .63 .28 .48 .09 .63 .33 .66 .37
9 Firm size b 8.11 3.59 .00 -.07 .05 .04 .02 -.01 .02 .02
10 Firm age b 3.21 2.92 -.05 -.29 -.02 -.18 .08 -.06 .14 -.20 .41
11 Leverage ratio 0.57 0.17 -.31 -.52 -.30 -.38 .13 -.17 .20 -.33 .33 .31
12 Liquidity ratio 1.42 0.94 .38 .39 .13 .32 -.20 .19 -.18 .29 .29 -.16 -.53
13 CEO replacement .44 .49 .12 .06 .02 .08 -.08 .11 -.04 .01 .08 .10 -.18 .29
14 CEO replacement during Year 0
.21 .41 -.06 -.03 .00 -.04 .10 -.01 .07 -.11 .00 .07 -.03 -.03 .34
15 Multiple CEO replacement .11 .31 .16 .10 .09 .02 .03 -.04 .01 -.04 .13 .15 -.08 .05 .44 .04
16 Later replacement .21 .36 -.16 -.13 .05 -.11 .19 -.24 .12 -.18 .16 .05 .18 -.29 -.39 .11 -.17
17 Incumbent’s talent -.01 .10 -.07 .00 -.01 .10 .02 .02 -.13 .15 .05 .11 -.08 .02 -.11 .00 .06 -.02
18 Control for selection bias .96 .24 -.01 .01 -.03 .10 -.01 .13 -.02 .09 -.12 -.19 .02 -.13 -.24 -.13 -.15 -.11 -.04
19 Control for endogeneity .39 .15 -.05 .01 .05 -.06 -.04 -.18 .01 -.07 .06 .13 -.04 .13 .31 .16 .14 .11 -.17 -.58
20 Industry performance severity -.01 .07 .18 .29 -.11 .16 -.48 .05 -.02 .20 -.07 -.17 -.20 .12 .01 -.01 -.00 -.01 -.02 -.01 .08
21 Non-throughput incumbent .70 .37 .04 .06 -.02 .03 .02 .05 -.02 -.07 .01 .09 .05 -.05 .00 .10 .08 .05 -.06 .16 -.17 -.21
22 Incumbent’s CEO tenure b 1.99 .68 -.01 .06 -.03 .05 .08 .01 -.05 .02 -.10 -.05 -.03 -.06 -.07 .03 -.16 .19 -.01 -.11 .03 .24 .13
23 Incumbent’s industry tenure b 2.55 .46 .02 .07 .00 .04 .06 .01 -.04 .01 -.05 -.01 -.06 .02 .11 .11 -.01 .22 -.01 -.16 .10 .27 .15 .63
24 Throughput-oriented successor
.37 .28 .16 .09 -.14 .09 -.02 .19 -.17 .00 .30 .11 -.12 .17 -.03 .07 -.05 .03 .09 -.12 .07 -.02 .04 .02 .02
25 Company-outsider successor
.36 .48 .02 .03 -.11 -.08 .03 .08 .06 .04 -.02 -.14 -.05 .03 .09 -.10 .12 -.09 .10 -.09 .02 .04 -.18 -.04 -.03 .11
26 Industry-outsider successor .09 .29 -.04 -.05 .01 -.14 .05 -.09 .20 .01 .05 -.07 .03 -.02 .04 -.03 .20 -.04 .07 -.03 .09 .00 -.15 -.11 -.10 .04 .62
27 ROE in subsequent years
.10 .19 .16 .14 -.07 .07 -.01 .13 .14 .06 .19 .20 .18 -.14 -.05 -.04 -.05 .04 -.01 .07 -.08 -.10 -.04 -.08 -.05 .13 .03 .04
28 MTB in subsequent years
1.23 .96 .43 .55 .07 .37 -.12 .41 -.24 .61 .03 -.10 -.30 .18 -.04 .00 .00 -.10 .11 .13 -.09 .08 -.01 -.02 -.04 .14 .06 -.05 .33
a. Correlations above .08 are significant at .05 level; N=669, except variables 22-24, for which N = 294 ; b Log-transformed
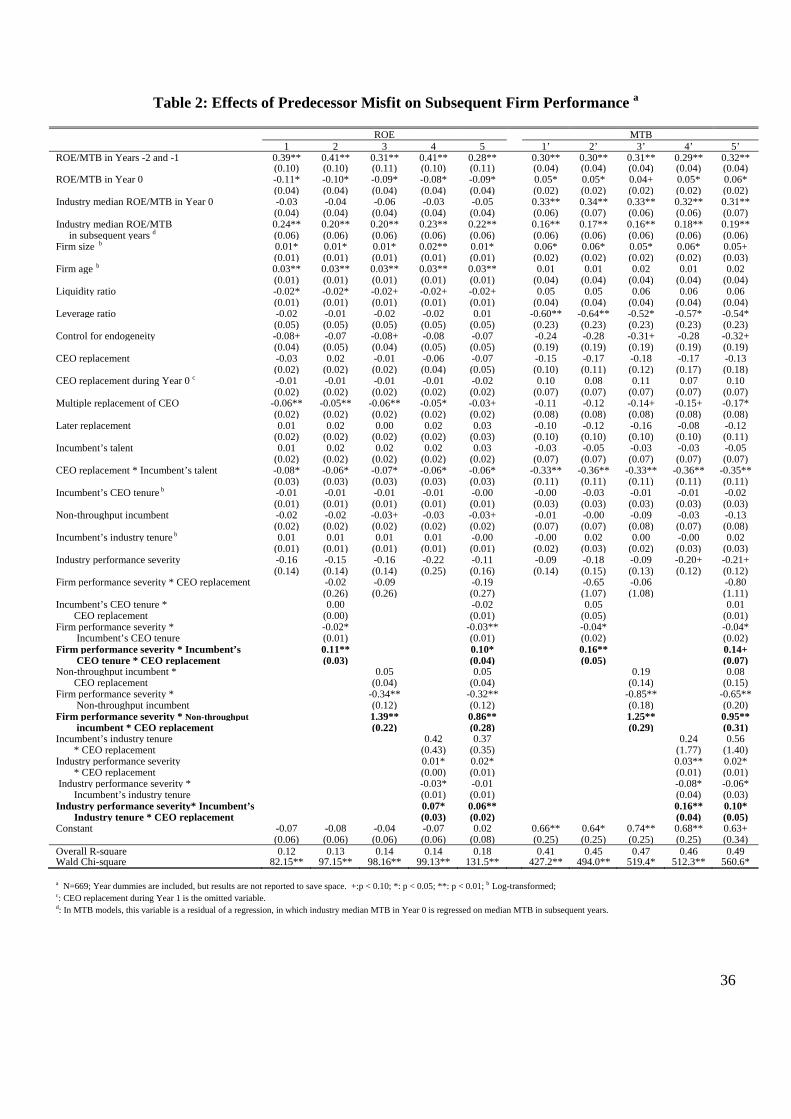
36
Table 2: Effects of Predecessor Misfit on Subsequent Firm Performance a
ROE MTB 1 2 3 4 5 1’ 2’ 3’ 4’ 5’
ROE/MTB in Years -2 and -1 0.39** 0.41** 0.31** 0.41** 0.28** 0.30** 0.30** 0.31** 0.29** 0.32** (0.10) (0.10) (0.11) (0.10) (0.11) (0.04) (0.04) (0.04) (0.04) (0.04)ROE/MTB in Year 0 -0.11* -0.10* -0.09* -0.08* -0.09* 0.05* 0.05* 0.04+ 0.05* 0.06* (0.04) (0.04) (0.04) (0.04) (0.04) (0.02) (0.02) (0.02) (0.02) (0.02)Industry median ROE/MTB in Year 0 -0.03 -0.04 -0.06 -0.03 -0.05 0.33** 0.34** 0.33** 0.32** 0.31** (0.04) (0.04) (0.04) (0.04) (0.04) (0.06) (0.07) (0.06) (0.06) (0.07)Industry median ROE/MTB 0.24** 0.20** 0.20** 0.23** 0.22** 0.16** 0.17** 0.16** 0.18** 0.19** in subsequent years d (0.06) (0.06) (0.06) (0.06) (0.06) (0.06) (0.06) (0.06) (0.06) (0.06)Firm size b 0.01* 0.01* 0.01* 0.02** 0.01* 0.06* 0.06* 0.05* 0.06* 0.05+ (0.01) (0.01) (0.01) (0.01) (0.01) (0.02) (0.02) (0.02) (0.02) (0.03)Firm age b 0.03** 0.03** 0.03** 0.03** 0.03** 0.01 0.01 0.02 0.01 0.02 (0.01) (0.01) (0.01) (0.01) (0.01) (0.04) (0.04) (0.04) (0.04) (0.04)Liquidity ratio -0.02* -0.02* -0.02+ -0.02+ -0.02+ 0.05 0.05 0.06 0.06 0.06 (0.01) (0.01) (0.01) (0.01) (0.01) (0.04) (0.04) (0.04) (0.04) (0.04)Leverage ratio -0.02 -0.01 -0.02 -0.02 0.01 -0.60** -0.64** -0.52* -0.57* -0.54* (0.05) (0.05) (0.05) (0.05) (0.05) (0.23) (0.23) (0.23) (0.23) (0.23)Control for endogeneity -0.08+ -0.07 -0.08+ -0.08 -0.07 -0.24 -0.28 -0.31+ -0.28 -0.32+ (0.04) (0.05) (0.04) (0.05) (0.05) (0.19) (0.19) (0.19) (0.19) (0.19)CEO replacement -0.03 0.02 -0.01 -0.06 -0.07 -0.15 -0.17 -0.18 -0.17 -0.13 (0.02) (0.02) (0.02) (0.04) (0.05) (0.10) (0.11) (0.12) (0.17) (0.18)CEO replacement during Year 0 c -0.01 -0.01 -0.01 -0.01 -0.02 0.10 0.08 0.11 0.07 0.10 (0.02) (0.02) (0.02) (0.02) (0.02) (0.07) (0.07) (0.07) (0.07) (0.07)Multiple replacement of CEO -0.06** -0.05** -0.06** -0.05* -0.03+ -0.11 -0.12 -0.14+ -0.15+ -0.17* (0.02) (0.02) (0.02) (0.02) (0.02) (0.08) (0.08) (0.08) (0.08) (0.08)Later replacement 0.01 0.02 0.00 0.02 0.03 -0.10 -0.12 -0.16 -0.08 -0.12 (0.02) (0.02) (0.02) (0.02) (0.03) (0.10) (0.10) (0.10) (0.10) (0.11)Incumbent’s talent 0.01 0.02 0.02 0.02 0.03 -0.03 -0.05 -0.03 -0.03 -0.05
(0.02) (0.02) (0.02) (0.02) (0.02) (0.07) (0.07) (0.07) (0.07) (0.07)CEO replacement * Incumbent’s talent -0.08* -0.06* -0.07* -0.06* -0.06* -0.33** -0.36** -0.33** -0.36** -0.35**
(0.03) (0.03) (0.03) (0.03) (0.03) (0.11) (0.11) (0.11) (0.11) (0.11)Incumbent’s CEO tenure b -0.01 -0.01 -0.01 -0.01 -0.00 -0.00 -0.03 -0.01 -0.01 -0.02 (0.01) (0.01) (0.01) (0.01) (0.01) (0.03) (0.03) (0.03) (0.03) (0.03)Non-throughput incumbent -0.02 -0.02 -0.03+ -0.03 -0.03+ -0.01 -0.00 -0.09 -0.03 -0.13 (0.02) (0.02) (0.02) (0.02) (0.02) (0.07) (0.07) (0.08) (0.07) (0.08)Incumbent’s industry tenure b 0.01 0.01 0.01 0.01 -0.00 -0.00 0.02 0.00 -0.00 0.02 (0.01) (0.01) (0.01) (0.01) (0.01) (0.02) (0.03) (0.02) (0.03) (0.03)Industry performance severity -0.16 -0.15 -0.16 -0.22 -0.11 -0.09 -0.18 -0.09 -0.20+ -0.21+ (0.14) (0.14) (0.14) (0.25) (0.16) (0.14) (0.15) (0.13) (0.12) (0.12)Firm performance severity * CEO replacement -0.02 -0.09 -0.19 -0.65 -0.06 -0.80 (0.26) (0.26) (0.27) (1.07) (1.08) (1.11)Incumbent’s CEO tenure * 0.00 -0.02 0.05 0.01 CEO replacement (0.00) (0.01) (0.05) (0.01)Firm performance severity * -0.02* -0.03** -0.04* -0.04* Incumbent’s CEO tenure (0.01) (0.01) (0.02) (0.02)Firm performance severity * Incumbent’s 0.11** 0.10* 0.16** 0.14+ CEO tenure * CEO replacement (0.03) (0.04) (0.05) (0.07)Non-throughput incumbent * 0.05 0.05 0.19 0.08 CEO replacement (0.04) (0.04) (0.14) (0.15)Firm performance severity * -0.34** -0.32** -0.85** -0.65** Non-throughput incumbent (0.12) (0.12) (0.18) (0.20)Firm performance severity * Non-throughput 1.39** 0.86** 1.25** 0.95** incumbent * CEO replacement (0.22) (0.28) (0.29) (0.31)Incumbent’s industry tenure 0.42 0.37 0.24 0.56 * CEO replacement (0.43) (0.35) (1.77) (1.40)Industry performance severity 0.01* 0.02* 0.03** 0.02* * CEO replacement (0.00) (0.01) (0.01) (0.01) Industry performance severity * -0.03* -0.01 -0.08* -0.06* Incumbent’s industry tenure (0.01) (0.01) (0.04) (0.03)Industry performance severity* Incumbent’s 0.07* 0.06** 0.16** 0.10*
Industry tenure * CEO replacement (0.03) (0.02) (0.04) (0.05)Constant -0.07 -0.08 -0.04 -0.07 0.02 0.66** 0.64* 0.74** 0.68** 0.63+
(0.06) (0.06) (0.06) (0.06) (0.08) (0.25) (0.25) (0.25) (0.25) (0.34)Overall R-square 0.12 0.13 0.14 0.14 0.18 0.41 0.45 0.47 0.46 0.49Wald Chi-square 82.15** 97.15** 98.16** 99.13** 131.5** 427.2** 494.0** 519.4* 512.3** 560.6* a N=669; Year dummies are included, but results are not reported to save space. +:p < 0.10; *: p < 0.05; **: p < 0.01; b Log-transformed; c: CEO replacement during Year 1 is the omitted variable. d: In MTB models, this variable is a residual of a regression, in which industry median MTB in Year 0 is regressed on median MTB in subsequent years.

37
Table 3: Effects of Successor Fit on Subsequent Firm Performance a
ROE MTB 1 2 3 4 5 1’ 2’ 3’ 4’ 5’ ROE/MTB in Year -2 and Year -1 0.55* 0.46* 0.43* 0.55+ 0.54+ 0.39** 0.37** 0.40** 0.39** 0.38** (0.20) (0.22) (0.21) (0.29) (0.29) (0.08) (0.08) (0.08) (0.08) (0.08) ROE/MTB in Year 0 -0.24* -0.38** -0.31* -0.22+ -0.22+ -0.09+ -0.09* -0.10* -0.10* -0.09+ (0.11) (0.14) (0.13) (0.12) (0.12) (0.05) (0.05) (0.05) (0.05) (0.05) Industry median ROE/MTB in Year 0 0.22 0.22 0.33 0.23 0.32 0.29** 0.33** 0.31** 0.32** 0.38** (0.25) (0.24) (0.25) (0.25) (0.25) (0.11) (0.11) (0.11) (0.11) (0.11) Industry median ROE/MTB in 0.36* 0.35* 0.35* 0.37* 0.36* 0.54** 0.56** 0.51** 0.53** 0.53** Subsequent years d (0.15) (0.15) (0.15) (0.15) (0.14) (0.12) (0.12) (0.12) (0.12) (0.12) Firm size b -0.03 -0.02 -0.02 -0.02 -0.02 -0.02 -0.04 -0.03 -0.04 -0.05 (0.02) (0.02) (0.02) (0.02) (0.02) (0.06) (0.06) (0.06) (0.06) (0.06) Firm age b 0.08** 0.08** 0.08** 0.08** 0.09** 0.05 0.08 0.04 0.05 0.10 (0.03) (0.03) (0.03) (0.03) (0.03) (0.09) (0.09) (0.09) (0.09) (0.10) Liquidity ratio -0.04+ -0.04+ -0.04* -0.04* -0.04* 0.10 0.10 0.11 0.11 0.10 (0.02) (0.02) (0.02) (0.02) (0.02) (0.07) (0.07) (0.07) (0.07) (0.07) Leverage ratio 0.05 0.06 0.03 0.04 0.03 -0.13* -0.34 -0.15+ -0.13+ -0.11+ (0.13) (0.13) (0.13) (0.13) (0.13) (0.06) (0.14) (0.08) (0.07) (0.06) Control for selection bias 0.22* 0.21* 0.23** 0.19* 0.19* 0.61* 0.63* 0.59* 0.65* 0.58* (0.08) (0.08) (0.08) (0.09) (0.09) (0.29) (0.29) (0.29) (0.29) (0.29) CEO replacement during Year 0 -0.05 -0.07+ -0.05 -0.05 -0.06 0.20 0.16 0.18 0.18 0.11 (0.04) (0.04) (0.04) (0.04) (0.04) (0.14) (0.12) (0.14) (0.13) (0.12) Multiple replacement of CEO -0.00 -0.01 -0.00 -0.02 -0.03 -0.48** -0.44** -0.48** -0.52** -0.45** (0.04) (0.04) (0.04) (0.04) (0.04) (0.13) (0.13) (0.13) (0.13) (0.13) Incumbent’s talent 0.02+ 0.02 0.02 0.02 0.01 0.23* 0.22* 0.22+ 0.24* 0.18 (0.01) (0.03) (0.03) (0.03) (0.03) (0.11) (0.11) (0.11) (0.11) (0.12) Industry performance severity -0.72 -0.61 -0.63 -0.64 -0.46 -1.29* -1.21* -1.44* -1.12* 1.13* (0.52) (0.52) (0.52) (0.52) (0.52) (0.66) (0.63) (0.71) (0.56) (0.51) Incumbent’s CEO tenure b -0.01 -0.00 -0.00 -0.01 -0.00 0.03 0.02 0.03 0.04 0.02 (0.02) (0.02) (0.02) (0.02) (0.02) (0.06) (0.06) (0.06) (0.06) (0.06) Non-throughput incumbent 0.10* 0.12* 0.12* 0.09+ 0.12* 0.23 0.28+ 0.23 0.26 0.34* (0.05) (0.05) (0.05) (0.05) (0.05) (0.16) (0.16) (0.16) (0.16) (0.16) Incumbent’s industry tenure b 0.01 0.01 0.01 0.02 0.01 -0.01 -0.00 -0.01 -0.02 -0.01 (0.02) (0.02) (0.02) (0.02) (0.02) (0.06) (0.06) (0.06) (0.06) (0.06) Firm performance severity * -0.05* -0.03 -0.06* -0.05* -0.04 -0.20* -0.19* -0.18* -0.20** -0.18* Incumbent’s CEO tenure (0.02) (0.03) (0.02) (0.02) (0.03) (0.08) (0.08) (0.08) (0.08) (0.08) Firm performance severity * -0.26 -0.67+ -0.44 -0.23 -0.79+ 0.54 0.34 1.00 0.97 1.02 Non-throughput incumbent (0.35) (0.38) (0.41) (0.36) (0.42) (1.13) (1.13) (1.17) (1.22) (1.16) Industry performance severity * -0.09** -0.09** -0.10** -0.09** -0.08** -0.31** -0.31** -0.27** -0.29** -0.20+ Incumbent’s industry tenure (0.03) (0.03) (0.03) (0.03) (0.03) (0.09) (0.09) (0.10) (0.09) (0.11) Company-outsider successor 0.06 0.07+ 0.07+ 0.07 0.06 0.12 0.11 0.11 0.11 0.09 (0.04) (0.04) (0.04) (0.04) (0.04) (0.14) (0.14) (0.14) (0.14) (0.13) Throughput-oriented successor 0.08+ 0.09* 0.04 0.07+ 0.05 0.22 0.26+ 0.22 0.23+ 0.29* (0.04) (0.04) (0.05) (0.04) (0.05) (0.13) (0.14) (0.13) (0.14) (0.13) Industry-outsider successor -0.05 -0.03 -0.06 0.02 0.02 -0.01 0.00 0.06 -0.11 0.17 (0.06) (0.06) (0.06) (0.07) (0.07) (0.18) (0.18) (0.19) (0.21) (0.20) Firm performance severity * 0.58* 0.52* 0.88* 0.70* Company-outsider successor (0.25) (0.26) (0.40) (0.32) Firm performance severity * 0.61* 0.45* 0.79* 0.65* Throughput-oriented successor (0.29) (0.21) (0.30) (0.32) Industry performance severity * 0.18** 0.12* 0.48* 0.32+ Industry-outsider successor (0.06) (0.05) (0.22) (0.18) Constant -0.51** -0.53** -0.50** -0.54** -0.55** -1.11+ -1.39* -0.95 -1.07+ -1.16+ (0.19) (0.19) (0.19) (0.19) (0.19) (0.60) (0.61) (0.61) (0.60) (0.63) Overall R-square 0.19 0.23 0.23 0.24 0.28 0.43 0.46 0.46 0.45 0.48 Wald Chi-square 63.10** 69.60** 69.95** 71.40** 89.73** 180.8** 195.9* 197.4** 191.5** 219.1**
a N=294; Year dummies are included, but results are not reported to save space; +:p < 0.10; *: p < 0.05; **: p < 0.01; b Log-transformed; c: CEO replacement during Year 1 is the omitted variable. The control variable of “later replacement” is dropped here because its value is consistently zero in the analysis of successor fit; d: In MTB models, this variable is a residual of a regression, in which industry median MTB in Year 0 is regressed on median MTB in subsequent years.

38
Appendix 1 CEO Replacement Under Conditions of Severe Performance Problems:
Illustrative Examination of Predecessor Misfit and Successor Fit Combinations
ROE ∆ Fixed Assets ∆ Headcount ∆ SGA
Category 1 (Short-tenured predecessor and insider successor combination)
Omitted Category Omitted Category Omitted Category Omitted Category
Category 2 (Short-tenured predecessor and outsider successor combination)
.07 -0.07* -0.02 -0.02
Category 3 (Long-tenured predecessor and insider successor combination)
.11* -0.01 0.04 -0.03+
Category 4 (Long-tenured predecessor and outsider successor combination)
.16** -0.08* -0.12* -0.04+
N=147; +p<0.10; *: p < 0.05; ** p < 0.01
Clarifying Notes:
1. The sample analyzed here consists of firms that had the most severe ROE performance in Year 0 (worse than -7.0%, the median for firms in which CEO succession occurred).
2. Short-tenured vs. long-tenured predecessors were determined by median split (7 years). 3. Shown in the cells are regression coefficients (and significance) for category dummy variables (Category 1 was the omitted variable). Not
shown are results for control variables, which include all those in Model 1 of Table 3. 4. For estimating ROE, pooled random-effects analysis of Years 2, 3, and 4 were conducted. 5. For estimating other dependent variables, pooled random-effects analysis of Years 1, 2, and 3 were conducted, where the dependent
variable was the percentage change relative to Year 0.