Embed Size (px)
Citation preview

ISSN 2042-2695
CEP Discussion Paper No 1182
December 2012
China's Pure Exporter Subsidies
Fabrice Defever and Alejandro Riaño
Abstract One third of Chinese exporters sell more than ninety percent of their production abroad. We argue that
this distinctive pattern is attributable to a wide range of subsidies that provide incentives to these
“pure exporters”. We propose a heterogeneous firm model in which firms exporting all their output
receive an ad-valorem sales subsidy. Using microdata on manufacturing firms matched with custom
transactions for the years 2000-2006, we measure sizable differences in productivity and paid taxes
between pure exporters and domestic firms and between pure and regular exporters, in line with the
predictions of our model. Embedding a pure-exporter subsidy in a two-country general equilibrium
environment, we show that this instrument is worse from a welfare standpoint than a standard export
subsidy, partly because it increases protection of the domestic market. A counterfactual analysis
suggests that eliminating these subsidies would result in a welfare gain for China comparable to
halving its trade costs.
Keywords: Trade policy; export subsidies; heterogeneous firms; China
JEL classifications: F12, F13, O47
This paper was produced as part of the Centre’s Globalisation Programme. The Centre for Economic
Performance is financed by the Economic and Social Research Council.
Acknowledgements We thank Daniel Bernhofen, Arnaud Costinot, Jason Garred, Eugenia Gonzalez, James Harrigan,
Kala Krishna, Petros Mavroidis, John Morrow, Doug Nelson, Veronica Rappoport, Luca Rubini,
Michele Ruta, and participants at the May 2012 GEP Workshop on International Trade, the June 2012
CAGE-CEP Workshop on Trade Policy in a Globalized World, the CEPII-GEP-Ifo Conference on
China and the World Economy, ETSG 2012 and the Fall 2012 Midwest International Trade Meetings
for helpful comments on an earlier version of this paper. We thank Zheng Wang and Zhihong Yu for
providing us with the firms' name concordance table between the NBS manufacturing survey and the
customs data. We thank Helen Durrant for editorial assistance. This paper has been previously
circulated with the title “Pure Exporter Subsidies: The Slow Reform of China's Trade Policy”. All
remaining errors are our own.
Fabrice Defever is a Research Associate of the Centre for Economic Performance, London
School of Economics, a Lecturer in Economics at the University of Nottingham and an Internal
Research Fellow of the Leverhulme Centre for Research on Globalisation and Economic Policy
(GEP). Alejandro Riaño is a Lecturer in Economics at the University of Nottingham. He is also an
internal research fellow at the Leverhulme Centre for Research on Globalisation and Economic Policy
(GEP) and the Centre for Finance, Credit and Macroeconomics (CFCM) and a research affiliate of
CESifo.
Published by
Centre for Economic Performance
London School of Economics and Political Science
Houghton Street
London WC2A 2AE
All rights reserved. No part of this publication may be reproduced, stored in a retrieval system or
transmitted in any form or by any means without the prior permission in writing of the publisher nor
be issued to the public or circulated in any form other than that in which it is published.
Requests for permission to reproduce any article or part of the Working Paper should be sent to the
editor at the above address.
F. Defever and A. Riaño, submitted 2012
“In certain zones, companies are apparently only allowed to locate when they enter obli-gations to export a certain minimum percentage amount of their production. [C]anChina please explain how such practices are compatible with the obligations resultingfrom the accession protocol [?]”
Questions by the European Communities with regard to China’s Transitional ReviewMechanism on Subsidy Practices. World Trade Organization, September 21, 2004.
1 Introduction
The exact nature of China’s export subsidies has always been murky. The fact that China’s trade
regime features a wide range of policies that favor firms producing almost exclusively for the
foreign market – which we refer to as “pure exporter subsidies” – is not widely appreciated. In
recent discussions at the World Trade Organization (WTO), the European Communities questioned
the case of the “Shanghai Foreign Investment Center”, where firms exporting the majority of their
production enjoy various preferential policies such as fiscal advantages, softer loans and priority
access to infrastructure and land. The WTO document also mentions that firms exporting more
than 70 percent of their production benefit from an exemption from local income tax and a reduction
on their corporate income tax rate.1 While the use of these types of subsidies is widespread across
developing countries, China has implemented them on an incredibly large scale over the last three
decades.2
We argue that this extensive use of pure exporter subsidies has resulted in an extraordinary
number of manufacturing firms in China exporting all or almost all of their production. Figure 1
presents the distribution of Chinese and French manufacturing exporters in terms of their export
intensity, i.e. the share of total sales accounted for by exports. Between 2000 and 2006, more
than a third of Chinese manufacturing exporters sold 90 percent or more of their output abroad. In
contrast, only 1.9 percent of French exporters display such high export intensity. Similarly, Bernard
et al. (2003) report a corresponding figure of 0.7 percent for exporters in the United States.
1Questions by the European Communities with regard to China’s Transitional Review Mechanism on Subsidiesand Countervailing Measures, 30 September 2003 (references G/SCM/Q2/CHN/5 and G/SCM/Q2/CHN/7).
2Other examples include India’s 100 percent export-oriented units, which enjoy no duties on imported capitalgoods and raw materials and are exempted of paying corporate income tax for their first 8 years of operation. Farole(2011, Table 3.5) documents minimum export share requirements, between 70 and 100 percent for firms enjoyingsimilar advantages in special economic zones in Bangladesh, Dominican Republic, Honduras, Ghana, Kenya, Senegaland Tanzania.
1

Figure 1: Export Intensity Distribution for Chinese and French Manufacturing Exporters
The figure depicts the kernel density of export intensity, defined as the share of exports intotal sales, for firms reporting a positive value of exports. Data for Chinese manufacturingexporters is for the period 2000-2006 and is described in detail in Section 4. Data on Frenchexporters are from the Enquete Annuelle Entreprises, SESSI, for the year 2000.
In this paper, we provide the first formal analysis of the economic implications of pure-exporter
subsidies. We propose a simple model in which heterogeneous firms may choose to operate as pure
exporters, selling all their output abroad in return for an ad-valorem sales subsidy. This modeling
approach seeks to encompass in a parsimonious way the myriad of policies favoring pure exporters,
which are described in detail in Section 2. We use matched customs and balance sheet data for the
period 2000-2006 to explore whether the mechanism highlighted in our model provides a suitable
explanation for the large number of firms exporting all their output. By identifying firms that
are more likely to benefit from pure-exporter subsidies, we find support for our model’s predictions
regarding the productivity and tax expenditure premia of pure exporters relative to other firms. We
then investigate the welfare effects of China’s unilateral use of a pure exporter subsidy in general
equilibrium. To highlight the distinct features of this policy instrument, we compare its implications
2

with those produced by a standard ad-valorem export subsidy, i.e. one that is not conditional on a
firm exporting all its output. We find the pure exporter subsidy to be more distorting and worse in
welfare terms than the standard export subsidy. By reducing the number of varieties available to
Chinese consumers, the former lessens competition in the domestic market and provides heightened
protection for the least efficient, domestically-oriented firms.
Our starting point is a partial equilibrium model in which firms choose to operate in one of
three different production regimes: domestic, regular or pure-exporter, based on their idiosyncratic
productivity. In the absence of subsidies, the most productive firms self-select become regular
exporters (i.e. selling both at home and abroad), intermediate-productivity firms serve only the
domestic market and the least productive firms exit the market, as in Melitz (2003). We show that
under these circumstances, a strictly positive subsidy is necessary to induce firms to become pure
exporters. Moreover, we find that when pure exporters start to arise, they do so in the middle
of the productivity distribution; more precisely, around the no-subsidy export productivity cutoff.
As a result, pure exporters exhibit an intermediate level of productivity between that of domestic
firms and that of regular exporters.
Although pure exporter subsidies are extremely difficult to observe in the data, we are able to
identify three types of firms likely to receive preferential treatment conditional on exporting most of
their production under the regulations effective between 2000 and 2006.3 These are foreign-invested
enterprises which benefit from a preferential treatment when exporting most of their production,
establishments devoted to export processing activities, and firms located in Free Trade Zones.
Altogether, these three types of firms account for 90 percent of the exporters in our data. Identifying
pure exporters as firms exporting more than 90 percent of their output, we provide evidence of a
higher prevalence of pure exporters within these three groups compared to the remaining group of
firms.
In line with the predictions from our model, we find that pure exporters present a 35.9 percent
productivity premium relative to domestic firms, but are 25.8 percent less productive than regular
3While China was required to notify the WTO of any subsidy under the provision of Article 1 of the Agreementon Subsidies and Countervailing Measures ahead of each year’s Transitional Review Mechanism, it only submittedtwo notifications in 2006 and 2011 after joining the WTO in 2001. Both notifications were deemed to be highlyincomplete, since they failed to state the level and annual amount spent in a large number of subsidies listed inthe notification. Additionally, there was no acknowledgement of any subsidies granted at sub-national, provincialand local level in either notification. See “Request from the United States to China,” October 11, 2011, referenceG/SCM/Q2/CHN/42.
3

exporters. Additionally, we also show that pure exporters’ corporate income tax, value-added tax
and sales tax outlays (as a share of their value-added) are significantly lower than those of domestic
firms and regular exporters. These differences hold despite the inclusion of a full set of prefecture-
city specific effects, which capture the various advantages received by firms located in Free Trade
Zones. By conducting a group-wise comparison among exporters, e.g. comparing pure and regular
foreign-owned exporters, we also show that our results concerning the productivity and tax premia
are not driven by the ownership or processing status of firms.
To investigate the economic implications of pure exporter subsidies, we embed our partial
equilibrium framework into a two-country general equilibrium model and calibrate it to match key
cross-sectional moments based on the firm-level data. We conduct a comparative statics exercise
with respect to the total expenditure on export subsidies, and to highlight the distinct features of the
pure exporter subsidy, we compare it to a regular export subsidy. For a given level of expenditure
in export subsidies, our comparison reveals that a pure-exporter subsidy provides protection for
domestic firms, whereas the standard export subsidy produces the opposite effect. By preventing
pure exporters from selling in the domestic market, the number of varieties sold in China falls,
driving up the domestic price index and lessening the degree of competition among firms in the
Chinese market. This in turn reduces the productivity threshold necessary for Chinese firms to
operate in the domestic market. A standard export subsidy on the other hand, allows exporters
to expand at the expense of the domestic firms, inducing exit at the lower end of the productivity
distribution.
A heavy reliance on encouraging exports while at the same time protecting the domestic market
has been a cornerstone of China’s transition into a market economy (Naughton, 2007). Since the
late 1970s, China has been characterized by a dualistic trade regime in which a system of export-
oriented enclaves coexist with a highly protected domestic economy; a situation that Feenstra (1998)
described as “one country, two systems.” Our paper shows how pure-exporter subsidies contribute
to this strategy by boosting exports while simultaneously decreasing domestic competition and
preventing the exit of the least productive firms. By hindering market selection, this trade policy
can also be interpreted as a means through which to pursue what Lau et al. (2000) referred to as a
“reform without losers,” thus enabling the Chinese government to gain the support of agents who
4

would not otherwise support a full market liberalization.4
The successive appeals by the European Union, the United States and other member countries at
the WTO has forced China to scrap several export support programs and preferential treatment for
its exporters.5 These developments naturally raise the question of what would be the consequences
of eliminating pure-exporter subsidies. To address this issue, we conduct a counterfactual policy
analysis in which we find that if China were to stop using pure-exporter subsidies it would experience
a welfare gain of approximately 3 percent (in terms of an increase in real income). This is equivalent
to the welfare improvement produced by halving bilateral transportation costs in a situation without
pure exporter subsidies. Conversely, the rest of the World would experience a welfare reduction of
1.15 percent.
Our model can also be used to evaluate the welfare consequences of trade liberalization in the
presence of pure exporter subsidies. In this scenario, the welfare gain due to a reduction in bilateral
trade costs is counteracted by the distortion arising from a larger number of pure exporters operating
in China. Following China’s accession to the WTO we observe a substantial rise in the share of
pure exporters, which increase from 30 to 40 percent of all manufacturing exporters between 2000
and 2006. In the context of our model, a 17 percent reduction in bilateral trade costs would result
in a similar rise in pure exporters, implying a welfare loss of 0.75 percent in China and a welfare
gain in the rest of the World of 1.44 percent relative to our calibrated benchmark equilibrium.
Our paper contributes to the growing body of research that quantifies the welfare and productiv-
ity gains resulting from China’s reforms mandated by its accession to the WTO (Bajona and Chu,
2010; Khandelwal et al., Forthcoming). Bajona and Chu (2010) study the welfare implications of
China’s reduction of subsidies to its state-owned sector as required by its accession protocol. They
find that decreasing the degree of dualism between the private and state-owned sector improves
resource allocation, resulting in a 1.5 percent welfare gain. In a similar vein, Khandelwal et al.
(Forthcoming) quantify the productivity gains arising from the removal of export licenses in the
4Another argument often used by policymakers to justify this policy is related to the existence of knowledgespillovers generated by the foreign multinationals. In Appendix B, we provide some evidence suggesting that thismight not be particularly important in the case of China.
5For instance, China modified its corporate tax law in January 2008, ending the preferential treatment of pure-exporting multinationals. The Famous Brands initiative, a large umbrella of export support programs which featuredseveral subsidies contingent on export performance, was introduced in 2005, disputed at the WTO in 2008 andabandoned in 2009. The auto export base program introduced in 2009, has already been challenged in 2012 by theObama Administration during the 2012 presidential election.
5

textiles and clothing sector. Their analysis reveals that a substantial share of this gain stems from
eliminating the inefficient allocation of licenses by the central government.
China’s becoming the workshop of the World and its implications for its trading partners have
been recently studied by Lu (2010), Hsieh and Ossa (2011) and di Giovanni et al. (2012). These
models emphasize the role of productivity differences across sectors in multi-country, multi-sector
environments. Lu’s calibration strategy is especially relevant for our work since it explicitly targets
the share of Chinese firms exporting all their output. However, Lu’s model hinges on the assumption
that exporters (at least in some sectors) are less productive than domestic firms, while recent
studies cast doubt on this assumption.6 Additionally, Lu focuses on technological differences across
sectors, whereas our paper emphasizes the role of trade policy in explaining the large number of pure
exporters in China. Our analysis of pure-exporter subsidies is also related to the literature studying
trade policy in a heterogeneous-firm environment (Chor, 2009; Demidova and Rodrıguez-Clare,
2009; Felbermayr et al., 2012) as well as to the body of work investigating the welfare implications
of export-processing zones and duty drawbacks (Hamada, 1974; Miyagiwa, 1986; Panagariya, 1992;
Ianchovichina, 2007).7
The rest of the paper is organized as follows. Section 2 provides an overview of Chinese policies
favoring pure exporters. Section 3 presents our partial equilibrium model and spells out the con-
ditions under which pure-exporter firms arise. Section 4 describes the data used in our empirical
analysis and shows how we take the predictions developed in Section 3 to the data. Section 5
presents our general equilibrium model of pure exporter subsidies. It also presents our comparative
statics exercise comparing the pure exporter subsidy to a standard ad-valorem export subsidy and
our counterfactual policy experiments. Section 6 concludes.
2 Overview of Policies Favoring Pure Exporters
In this section we provide a concise overview of different regulations, all of which aim to provide
incentives for firms to export all or most of their output. Three major groups of policies favoring
6Measuring productivity by Total Factor Productivity instead of value-added per worker as Lu does, our empiricalanalysis as well the studies by Dai et al. (2011) and Ma et al. (2011) show that Chinese exporters are more productivethan non-exporters.
7See Heid et al. (Forthcoming) for a recent contribution that quantifies the welfare impact of the rapid expansionof the maquiladora sector in Mexico in the presence of labor market frictions.
6

pure-exporters can be identified: the attraction of Foreign-Invested Enterprises (FIEs), the promo-
tion of Processing Trade Enterprises (PTEs) and the establishments of Free-Trade Zones (FTZs).
An online Appendix provides a translation of the specific legislations described below.
It is important to note that Free-Trade Zones and duty drawback schemes such as China’s
processing trade regime are not illegal per-se under the WTO agreements. However, if a measure
such as lower fiscal liability, is offered for the sole purpose of exporting, and more specifically sets
minimum export targets for companies such as the examples provided below, then it would violate
Article 3 of the ASCM and the Trade-Related Investment Measures (TRIMs) Agreement.8
Foreign-Invested Enterprises
Aimed at attracting foreign investment, the ‘twenty-two regulations’ established in 1986 defined an
‘export-oriented’ firm as a manufacturing enterprise whose export volume accounts for 50 percent or
above of its annual sales.9 Foreign-Invested Enterprises (FIEs) with an export intensity exceeding
such a threshold, benefit from preferential land-use policies, easier access to finance and exemptions
from industrial and commercial consolidated tax. Until 2001, being an export-oriented firm was
a requirement for foreign investments in China and FIEs had to specify their domestic sales ratio
by contract.10 Firms that did not comply with this requirement would face steep penalties. For
instance, FIEs that did not meet the targets set for export-oriented enterprises within three years
from the day when they began production were required to repay 60 percent of the tax refunded.11
After China’s accession to the WTO, the law of The People’s Republic of China on Foreign Capital
Enterprises revised in October 2000, lifted the requirement for FIEs to export the majority of their
production. Nevertheless, financial incentives conditional on export-intensity have remained in use
long after China entered the WTO.
The first paragraph of China’s corporate income tax law, promulgated in 1991 and effective
until 2008, stated that the ‘establishment of enterprises with foreign investment which export all
or the greater part of their production’ should be encouraged.12 The law stated that the standard
8We thank Petros Mavroidis and Luca Rubini for clarifying this point from a legal perspective.9‘Enforcement of the Provisions of the State Council on Encouraging Foreign Investment’, January 1, 1987.
10‘Circular of the Ministry of Foreign Trade and Economic Cooperation on Submission of Import and Export Plansfor Enterprises with Foreign Investment’, October 25, 2000.
11‘Corporate Income Tax Law of the People’s Republic of China’, 30 June 1991, Article 8.4.4.12‘Corporate Income Tax Law of the People’s Republic of China’, 9 April 1991, Basic Regulations. 8.1.
7

Table 1: Corporate Income Tax Rate, 1991 to 2008
National Special Coastal Yangtze and Pearl Industrialtax rate Economic Development Economic Parks∗
Zones Zones ZonesExport sales ratio
Foreign-Invested EnterprisesBelow 70% 30% 15% 24% 24% 15%Over 70% 15% 10% 10% 10% 10%
Production EnterprisesBelow 70% 30% 15% 15% 15% 15%Over 70% 30% 10% 10% 10% 10%
∗ Industrial Parks includes “Economic and Technological Development Zones”, “High-Technology Industrial Devel-opment Zones” and “Export Processing Zones.”
corporate income tax rates for Chinese-owned firms operating in China was 30 percent, however
FIEs exporting more than 70 percent of their production faced a lower income tax rate of just 15
percent. FIEs also enjoyed a preferential income tax rate of 15 percent if they were located in a
Free Trade Zone (FTZ) (or 24 percent in a costal zone). In these specific locations FIEs exporting
more than 70 percent of their production would see their income tax rate further reduced to 10
percent.13 Table 1 presents the statutory corporate income tax rates for different types of firms
between 1991 and 2008. As a result of several complaints by the European Union, the United
States and Canada at the WTO, China substantially modified its corporate income tax legislation
in January 2008. The new corporate tax rate of 25 percent applies equally to domestic and foreign
companies. Moreover, the fiscal advantages conditional on a firm’s export intensity have been
eliminated. A five-year transition period has been established so that the new tax law will be fully
operational after 2012.
The 1995 regulations ‘Guiding the Direction of Foreign Investment’ also incorporate restrictions
on local sales for FIEs. For instance, all foreign investment projects are classified into one of four
possible categories: encouraged, permitted, restricted and prohibited projects. Restricted projects
must be examined and approved by the relevant authorities. However, restricted projects that
export at least 70 percent of their total sales may be deemed as permitted.14,15 This rule still
13‘Corporate Income Tax Law of the People’s Republic of China’, 30 June 1991, Article 8.3.5.14‘Regulations for Guiding the Direction of Foreign Investment’, June 7, 1995, Article 11.15The first 10 listed products by the 1995 Catalogue for the Guidance of Foreign Investment Industries (in order
of appearance) are: machinery, assemblage of movements of digital watches and finished watches, bikes, knitting
8

applies today, even though China has substantially revised the list of restricted products after
joining the WTO. The 2002 regulation has introduced a new project category called ‘all-for export
projects’, which includes all projects that export 100 percent of their production. Such projects
are treated as encouraged projects automatically and therefore enjoy preferential treatment.16 For
instance, all-for export projects are entitled to a 20 percent refund of import duty and import
value-added tax.17
Processing Trade Enterprises
China established the legal framework for processing trade in 1979 under which inputs and com-
ponents needed for the production of goods for export were imported duty-free (Naughton, 1996).
Since the early 1990s, assembling and processing has consistently accounted for approximately 50
percent of China’s export volume. From a legal point of view, Processing Trade Enterprises (PTEs)
are production enterprises or factories established by business enterprises but with independent ac-
counting and their own business licence.
In practice, the strict administrative controls that characterize this export regime make it
difficult for firms to combine it with ordinary trade. For instance, enterprises engaged in processing
need to obtain a production capability certification as well as a processing trade approval certificate
granted by government authorities. PTEs also face a strict control over their domestic sales.
These enterprises are allowed to import inputs duty-free as long as they are not used for domestic
consumption. If any output is sold in the domestic market, firms must promptly pay the tariffs
and VAT on the imported materials. More importantly, they must obtain approval from both the
provincial commerce authorities and customs for an import licence. Failing to do so translates
into a penalty ranging from 30 to 100 percent of the declared value of the imported materials and
parts.18 As a consequence, the Hong Kong Trade Development Council (2009) reports that “most
traditional processing trade factories are still export-oriented, the share of domestic sales of these
machines and electric appliances: washing machines, refrigerators, freezers, tins.16‘Regulations for Guiding the Direction of Foreign Investment’, February 11, 2002.17‘General Administration of Customs and State Administration of Taxation’, 4 September 2002.18Hong Kong Trade Development Council (2003), ‘Guide to Doing Business in China’, Chapter on ‘Processing-
Trade’. Based on the circular concerning issuance of “Interim Measures on Administration of the Examinationand Approval of Processing Trade” and “Interim Measures on Administration of the Examination and Approvalof Domestic Sale of Bonded Materials and Parts Imported for Processing Trade”, Ministry of Foreign Trade andEconomic Cooperation (1999, WJMGF. No. 314 and No. 315).
9

factories is negligible.” To enjoy autonomy in domestic sales, a processing trade enterprise has to
change its registration and become a FIE, which requires it to temporarily stop their production for
a customs auditing. The consulting company Li & Fung Group (2012) estimates that “production
stoppage can take 9 to 12 months.” Furthermore, the transformation from PTE to FIE “involves
the work of more than 10 government departments” and might require a substantial tax repayment.
An additional advantage that PTEs enjoy is that they can import equipment provided by
a foreign client to be used in processing duty-free. To obtain this benefit, the PTE has to be
an independent factory devoted to export processing, in which case it exports 100 percent of its
production. If the PTE does not count with a processing-oriented facility, it needs to specify in the
terms of their processing trade contract that over 70 percent of its output must be exported.
Free Trade Zones
The third major element of China’s trade policy providing incentives for pure exporters is the
establishment of Free-Trade Zones (FTZs), externally-oriented enclaves designed to attract foreign
investors by means of streamlined regulations, tax concessions, duty-free imports of materials and
equipment used for exporting, among other allowances. Another crucial objective of the creation
of FTZs was to use them as “laboratories” where market-oriented policies would be evaluated
before their potential implementation in the rest of the economy. The Chinese government initially
designated four counties in Guangdong and Fujian provinces as FTZs, called Special Economic
Zones in 1979 as one of the components of Deng Xiaoping’s package of economic reforms aimed
at reintegrating China into the world economy. The following two decades would witness the
establishment of a large number of FTZs in cities located primarily along the coastal regions,
where a vast majority of China’s export-oriented industrial production is still located today.
FTZs provide additional incentives for pure exporters over and above the policies described in
previous sections. Foreign-Invested Enterprises (FIEs), Processing Trade Enterprises (PTEs) but
also Chinese-owned enterprises are encouraged to locate in these zones, in which several available
subsidies are granted conditional on firms satisfying certain export/sales ratio requirements. No-
tably, in all FTZs, such as the Special Economic Zones, Coastal Development Zones, Yangtze and
Pearl River Delta Economic Zones as well as some smaller industrial parks,19 where the corporate
19Industrial Parks includes “Economic and Technological Development Zones”, “High-Technology Industrial De-
10

income tax rate is already set at 15 percent, enterprises exporting more than 70 percent of their
production face a lower 10 percent corporate income tax rate, independently of their ownership
structure or trade regime.20
Since FTZs compete fiercely among themselves to attract FIEs, they have introduced additional
incentives aimed at export-oriented firms. For instance, Standard Chartered Bank (2007) reports
the case of Shenzhen city, China’s first special economic zone with a total area of 493 km2, where
firms that can prove they have paid all their value-added taxes on inputs and that export 100 percent
of their production qualify for a 5 percent sales cash subsidy. The Shenzhen Special Economic Zone
also reduces to half the “land use fee” charged on certified “enterprises-for-export”. Similarly, most
“Export Processing Zones” have strict requirements for firms’ domestic sales ratio – usually 30
percent of the total volume of sales. The first 15 pilots of this new type of zone were set up in 2000,
and their number has more than tripled in the last decade. The Chinese government seems keen
to experiment with new strategies to encourage firms exporting most of their production.
3 A Simple Model of Pure-Exporter Subsidies
Consider a world with two countries, China (c) and the rest of the World (f). Consumer preferences
are such that a producer of variety ω faces the following iso-elastic demand function in market i,
q(ω) = Aip(ω)−σ, i ∈ c, f, (1)
where p(ω) is the price of the variety ω, Ai is a measure of market size in country i and σ is
the elasticity of substitution between varieties. Production is carried out by monopolistically-
competitive firms using a linear technology with labor as the sole input,
q = ϕl, (2)
where ϕ is a firm-specific productivity index. Since each firm produces a unique variety, we can
index firms by their productivity level ϕ.
velopment Zones” and “Export Processing Zones”.20‘Corporate Income Tax Law of the People’s Republic of China’, 16 September 1991, Article 5.
11

A Chinese firm can choose between three potential modes of operation: (i) produce for the
domestic market alone, by paying a fixed cost fd, (ii) become a regular exporter selling both
domestically and abroad, by paying a fixed cost of exporting fx in addition to the fixed cost of
operating in the domestic market, fd, and (iii) become a pure exporter, a firm that exports all its
output, by paying the export fixed cost fx and receiving an ad-valorem subsidy s on its sales. We
assume that firms in the rest of the World can only operate domestically or as regular exporters.
Since the focus of this section is to study under which conditions firms choose to become pure
exporters, we focus on the problem faced by Chinese firms below.
Using equations (1) and (2), profit maximization yields the standard condition that a firm’s
output price is a constant markup over its marginal cost:
pc(ϕ) =σ
σ − 1
wcϕ,
p∗c(ϕ) = τpc(ϕ),
p∗cp(ϕ) =τ
1 + spc(ϕ),
where wc denotes the wage in China, pc(ϕ) the price charged by Chinese firms in the domestic
market, p∗c(ϕ) the price charged by regular exporters in the foreign market and p∗cp(ϕ), the price
charged by pure exporters. Both regular and pure exporters face an iceberg transportation cost
τ ≥ 1 when selling their output abroad.
Let k ∈ d, x, p index the three possible modes of production, domestic, regular and pure
exporter respectively. Then the maximum level of profits that a firm with productivity ϕ using
operation mode k can attain is given by,
πkc (ϕ, s) =
κAc(ϕ/wc)
σ−1 − fdwc, if k = d,
κ[Ac + τ1−σAf ](ϕ/wc)σ−1 − (fd + fx)wc, if k = x,
κ(1 + s)στ1−σAf (ϕ/wc)σ−1 − fxwc, if k = p,
(3)
where κ ≡ (σ − 1)σ−1σ−σ. Note that all fixed costs are denominated in units of labor.
In order for a Chinese firm with productivity ϕ to choose to operate under the pure-exporter
regime k = p, we need that πpc (ϕ, s) ≥ maxπdc (ϕ), πxc (ϕ), 0, or equivalently, that πpc (ϕ, s) ≥ πdc (ϕ),
12

πpc (ϕ, s) ≥ πxc (ϕ) and πpc (ϕ, s) ≥ 0 hold altogether. We can characterize this set of conditions by
making use of four different productivity cutoffs that define different combinations of productivity
and subsidy rates (ϕ, s) under which a firm is indifferent between two different production modes.
We start with the two standard cutoffs ϕ∗ and ϕ∗x that identify domestic firms and regular
exporters in the standard Melitz (2003) model in the absence of pure exporters,
ϕ∗ =
(wσc fdκAc
) 1σ−1
, (4)
ϕ∗x = τ
(wσc fxκAf
) 1σ−1
. (5)
These two cutoffs are respectively, the productivity level above which a Chinese firm would find it
profitable to produce for the domestic market alone ϕ : πdc (ϕ∗) = 0, and the productivity level
necessary for a firm to choose to become a regular exporter ϕ : πxc (ϕ∗x) = 0. In accordance with
the stylized fact that exporters tend to be more productive than domestic firms, we assume that
in a situation without pure-exporter subsidies, exporters are more productive than domestic firms
in China, i.e. we assume that (fd/fx) ≤ [Ac/(τ1−σAf )], which results in ϕ∗ ≤ ϕ∗x.
The assumption of selection-into-exporting for the most productive firms combined with the
fact that demand functions in both markets are iso-elastic, imply that in order for pure-exporters
to arise it is necessary that a strictly positive subsidy rate be offered. If s = 0, being a regular
exporter would always dominate being a pure-exporter, since regular exporters would attain the
same export profits as pure exporters without the need to sacrifice their domestic market. By
the same reasoning, firms for which export revenues are not sufficient to cover the fixed cost of
exporting fx would prefer operating domestically than being pure exporters.
We now define two additional cutoffs that arise in the presence of a pure-exporter subsidy. For
a given pure-exporter subsidy, s, define ϕ(s) as the productivity level at which a firm would be
indifferent between being a regular or a pure exporter, i. e. ϕ(s) = ϕ : πpc (ϕ, s) = πcx(ϕ). Thus,
ϕ(s) is given by,
ϕ(s) =
(wσc fd
κ(Ac − τ1−σAf [(1 + s)σ − 1])
) 1σ−1
. (6)
Inspection of (6) reveals that ϕ(s) is strictly increasing in s, with ϕ(0) = ϕ∗ and ϕ(smax1 ) → ∞,
with smax1 defined below. In order for a firm to choose to operate as a pure rather than a regular
13

exporter, it must be the case that the subsidy it receives is greater than the profits it could earn
in the domestic market. Thus, high productivity firms would require very high subsidy rates to be
swayed towards operating as pure exporters.
Similarly, let ϕ(s) be the productivity level such that a firm would be indifferent between selling
only in the domestic market and operating as a pure exporter. That is, ϕ(s) is defined implicitly
by ϕ(s) = ϕ : πpc (ϕ, s) = πdc (ϕ). This condition reads
ϕ(s) =
(wσc (fx − fd)
κ(τ1−σAf (1 + s)σ −Ac)
) 1σ−1
. (7)
Under the additional assumption that fx > fd, we can see that ϕ(s) is strictly decreasing in s
whenever s > smin, with smin defined below. Firms with productivity ϕ ∈ (ϕ∗, ϕ∗x) which would
prefer to operate domestically in the absence of pure-exporter subsidies, would find it profitable
to change their production mode if the additional revenue they receive because of the subsidy is
greater than the difference in fixed costs, fx − fd. Therefore, domestic firms with relatively high
productivity levels would require a lower subsidy to become pure-exporters. Figure 2 plots all the
different cutoffs in ϕ, s-space.
Grouping together all cutoffs (4)-(7), we can see that pure-exporters arise when s is such that
ϕ(s) ≤ ϕ(s). The minimum level of pure-exporter subsidy necessary for firms to choose the pure-
exporter operation mode, smin, is given by,
smin =
(1 +
Acτ1−σAf
− fdfx
) 1σ
− 1 > 0, (8)
moreover, Figure 2 shows that ϕ(smin) = ϕ(smin) = ϕ∗x. Therefore, when s ≥ smin, pure exporters
start to arise around the no-subsidy export cutoff, ϕ∗x. This implies that pure exporters would be
more productive than domestic firms, but less productive than regular exporters.
As s increases, the share of active firms operating as pure exporters increases as well, at the
expense of both domestic firms and regular exporters. In fact, if s were high enough, either domestic
firms or regular exporters would disappear. As noted above, let smax1 be the value of subsidy for
which ϕ(s)→∞, that is,
smax1 ≡
(1 +
Acτ1−σAf
) 1σ
− 1, (9)
14

Figure 2: Choice of Mode of Operation with Pure Exporters
pure exporters
exit
regular exporters
domestic Firms
meaning that no firm would find it profitable to be a regular exporter. If on the other hand, it
is the case that a very large pure-exporter subsidy stops firms from producing uniquely for the
domestic market, we can define smax2 as the subsidy value for which ϕ(smax
2 ) = ϕ∗, i.e.
smax2 ≡
(fxfd
Acτ1−σAf
) 1σ
− 1. (10)
Since we are interested in a situation in which we observe all three types of firms, domestic firms
together with pure and regular exporters, Proposition 1 summarizes the conditions under which we
would observe such an outcome.
Proposition 1 Assuming that (fd/fx) ≤ [Ac/(τ1−σAf )] and fd < fx, the three modes of produc-
tion k ∈d, p, x
coexist in the presence of a positive and sufficiently large pure-exporter subsidy
s, such that s ∈(smin,min smax
1 , smax2
). Firms with productivity ϕ ∈
[ϕ∗, ϕ(s)
)only operate
domestically, firms with productivity levels ϕ ∈[ϕ(s), ϕ(s)
)choose to operate as pure exporters,
and firms with ϕ ≥ ϕ(s) self-select into regular exporters.
15

A reduction in the iceberg transportation cost, τ , increases the share of pure exporters for
a given subsidy rate. Note that smin, the minimum subsidy necessary for the existence of pure
exporters, is increasing in τ . Furthermore, ϕ rises and ϕ falls following a reduction in τ . Thus,
the productivity range for which being a pure-exporter is the most profitable production mode for
a Chinese firm widens as trade costs fall. A similar result follows if the relative size of the foreign
market increases.
4 Data
Manufacturing Survey and Matched Data
We make use of the annual survey of Chinese manufacturing firms compiled by the National Bureau
of Statistics (NBS) for the years 2000 to 2006.21 The dataset consists of state-owned enterprises
and private firms with sales above five million Chinese Yuan and it contains detailed balance sheet
information as well as firms’ ownership status and total export sales. After cleaning up the data,
our final sample consists of 1,100,600 firm-year observations with 386,185 different firms.22
For the purposes of our empirical analysis, we define a pure exporter as a firm exporting more
than 90 percent of its production in a given year; a firm reporting a positive value of export sales
with an export intensity below 90 percent is classified as a regular exporter, and a domestic
firm is a firm that does not export at all in a given year. As can be seen in Columns 1 to 3 of Table
2, 105,543 observations are classified as pure exporter, accounting for 9.59 percent of our sample
and 34.37 percent of all exporters.
As discussed in Section 2, policies favoring pure exporters are primarily targeted at three groups
of firms: Foreign-invested Enterprises (FIEs), Processing Trade Enterprises (PTEs) and firms lo-
cated in Free-Trade Zones (FTZs). Although the NBS data allows us to identify firms’ ownership
structure, it does not allow us to distinguish PTEs because the survey does not record the value of
21Previous studies using this dataset include Hsieh and Klenow (2009).22To clean the data and rule out outliers we follow Brandt et al. (2012) and drop firms reporting less than 8
employees, or reporting missing or incoherent values for our key variables. We drop observations that report missing,null or negative values for total output, employment, intermediate inputs, fixed capital, value-added or if the ratiosexport/sales, value-added tax/value-added, output tax/output, income tax/value-added exceed one. We also excludefirms with the operating status recorded as ‘inactive’, ‘bankrupt’ or ‘closed’. We also use the industry concordancessuggested by Brandt et al. (2012) to insure a coherent and comparable classification over time. Finally, We alsodrop a small number of observations reporting zero exports in the manufacturing survey but showing positive exporttransactions in the custom data (presented below) in that particular year.
16

exports sold using different customs regimes. To obtain information about a firm’s reliance on pro-
cessing exports, we combine the NBS dataset with transaction-level customs data from the Chinese
General Administration of Customs.23 For each year, we follow Manova and Yu (2012) and match
the two datasets using firms’ names as a common variable, which results in approximately half of
the observations reporting a positive value of exports in the NBS sample being matched with the
customs records.24 While both datasets use different firm identifiers, a firm’s name is a reliable
match variable since, by law, two firms cannot have the same name in the same administrative re-
gion. Table 2 provides descriptive statistics for the two samples. Although matching both datasets
is a difficult task, it is reassuring that the share of pure exporters in the matched sample (Column
6) is almost identical to the one we find in the NBS data (Column 3).
Table 2: Summary Statistics
Manufacturing Survey, 2000-2006 Matched Data, 2000-2006
Number of Percentage among Number of Percentage amongobservations All firms Exporters only observations All firms Exporters only
Pure exporters 105,543 9.59 34.37 51,113 5.40 33.58Regular exporters 201,563 18.31 65.63 101,104 10.69 66.42Domestic firms 793,494 72.10 793,494 83.90
Total 1,100,600 100 100 945,711 100 100
For each matched firm we calculate the average share of exports sold under the processing
trade regime every year. We observe a strikingly bimodal distribution of firms’ export processing
share: 72.1 percent of firms use the processing regime for less than 10 percent of their exports,
whereas 15.5 percent sell more than 90 percent of their exports under this regime. Hence, we
define Processing Trade Enterprises (PTEs) as firms selling more than 90 percent of their exports
through the processing trade regime. In our definition, PTEs encompass both firms that export all
their output as well as firms selling domestically and using the processing regime to serve foreign
markets. We then proceed to identify Foreign-Invested Enterprises (FIEs) as firms with a positive
amount of foreign capital but that do not satisfy the criteria to be considered a PTE.
Although the NBS survey does not explicitly indicate whether a firm is located in a Free Trade
23See Manova and Zhang (2012) for a detailed description of this dataset.24Details of the matching procedure are described in detail in the appendix of Wang and Yu (Forthcoming).
17

Zone (FTZs), it does provides information about its administrative area of location. We use this
information to identify FTZs as prefecture-level cities promoted as Special Economic Zones, Coastal
Development Zones as well as the Yangtze and Pearl River Delta Economic Zones.25 Our definition
of FTZs abstracts from smaller industrial parks such as “Economic and Technological Development
Zones”, “New and High-Tech Industrial Development Zones” and “Export Processing Zones”, which
also benefit from preferential treatment. Many of these have been located along the coast within
prefecture-level cities already classified as a FTZ in our definition.26 Appendix A provides the exact
list of prefecture-cities included in our definition of FTZs.
Descriptive Statistics
Panel A of Table 3 presents the share of exporters across each category described above and also
according to whether or not firms are located in a FTZ. The main message from Panel A is that
approximately 90 percent of all Chinese manufacturing exporters face the possibility of receiving
preferential treatment, conditional on exporting all or most of their production. The last column
of the table reveals that 82.5 percent of exporters are located in a FTZ and thus can benefit from
preferential treatment available to pure exporters. Panel B of Table 3 shows the percentage of pure
exporters among all exporters across the different firm categories discussed above. It is also clear
from Table 3 that a substantial share of PTEs and FIEs are pure exporters (51.6 and 33.7 percent
of exporters in each group respectively). Finally, we observe that pure exporters, regardless of their
ownership status or the customs regime used to sell their output, are more likely to be located
within a FTZ.
25The Shanghai Economic area established in 1982 does not cover entirely the Shanghai prefecture, and notablydoes not include the city center of Shanghai. We make use of the firm postcode to exclude firms located in the citycenter from our definition of FTZ, i.e. postcode starting with ‘2000’.
26Using a “word search” on firms’ addresses, Schminke and van Biesebroeck (2011) report 891 new firms establishedin “Economic and Technological Development Zones” between 1999 and 2005, and 47 percent of them were locatedeither in the Yangtze or Pearl river Delta Economic zone, already accounted as a FTZ in our definition. Trackingfirms located in an “Export Processing Zone” in our data is easier since the custom data provides a special codingidentifying them. However, in 2006, only 166 firms can be classified as being located in any of these processing zones,and among them, 85 percent are located in a city which is already classified as a FTZ in our definition.
18

Table 3: Percentage of Exporters and Percentage of Pure Exporters by Firm Type and Location
Panel A: Percentage of Exporters
PTE FIE Neither TotalFIE nor PTE
In a FTZ 22.63 35.79 24.08 82.51Outside a FTZ 1.42 5.66 10.41 17.49
Total 24.06 41.45 34.49 100.00
Panel B: Percentage of Pure Exporters Among All Exporters
PTE FIE Neither AllFIE nor PTE Exporters
In a FTZ 52.63 34.67 22.49 36.04Outside a FTZ 35.56 27.85 16.85 21.93
All locations 51.62 33.74 20.79 33.58
Figure 3: Export Intensity Distribution by Firm Type and Location
Figure 3 shows the distribution of export intensity across the four groups of firms described in
Table 3. Pure exporters are more prevalent among PTEs, while FIEs and firms located in a FTZ
display a greater degree of bimodality. The distribution of export intensity for the residual group
of firms (i.e. exporters not located in a FTZ, which are neither PTEs nor FIEs) shows a majority
19

of firms selling a small share of their output abroad, the more common pattern documented for
manufacturing firms in other countries. Nevertheless, Figure 3 still displays a small hump in the
upper bound of the export-intensity distribution for this group of firms. One possible explanation
is that our definition of FTZs focuses on major areas, therefore excluding small industrial parks,
which might also provide preferential treatment for pure exporters.27 Additionally, the laws and
regulations that we consider in this paper exclude major sectoral and specific policies enacted at
the local level, such as the Famous Brands initiative or the auto export base program.
Figure 4 presents the geographical distribution of FTZs and the distribution of the share of
pure exporters among all exporting firms across prefecture-cities (by quartiles), where we have
excluded locations with fewer than 42 observations to avoid inaccuracies. It can be clearly seen
that pure-exporters are highly concentrated along coastal areas, the same places where FTZs have
been established.
To provide a sense of the change in the prevalence of pure exporters since China’s accession to
the WTO in 2001, Table 4 compares the share of pure exporters among all exporters in 2000 and
2006. Column 1 shows a dramatic increase in the share of pure-exporters after China joined the
WTO. Using our matched sample, Columns 2 to 5 of Table 4 show that the share of pure exporters
has increased across the board for the four types of firms considered. It is interesting to see that
being bound by the GATT/WTO rules disciplining the use of export subsidies has not reduced
the prevalence of pure exporters in China. This pattern is, however, consistent with our model
presented in Section 3, which suggests that trade liberalization (i.e. a reduction in the transport
cost τ) would increase the prevalence of pure exporters.
Table 4: Percentage of Pure Exporters Within the Group of Exporters, 2000 vs. 2006
Manufacturing Survey Matched Data
Year All Exporters FIEs PTEs Neither FIEs nor PTEsin a FTZ outside a FTZ
2000 30.36 32.23 52.28 19.25 12.402006 40.59 38.57 57.55 26.13 20.97
27Using a broader definition of Special Economic Zones, Wang (Forthcoming) identifies more than 80 percent ofall Chinese prefecture-cities as FTZs in 2006.
20

Figure 4: Free Trade Zones and Share of Exporting Firms Classified as Pure Exporters
Free Trade Zones Established Between 1979 and 2000
Quartiles of the Share of Pure Exporters
A detailed description of the Free Trade Zones is included in Appendix A.
21

Firm-level evidence
Productivity
To evaluate our prediction that pure-exporters should exhibit an intermediate level of productivity
greater than that of domestic firms but lower than that of regular exporters, we compute total
factor productivity (TFP) for each firm over the period 2000 to 2006 and for each of the 27 (2-
digit) sectors. We use the deflators computed by Brandt et al. (2012) to calculate real values for
intermediate inputs, capital and output.28 TFP, denoted ϕit, is estimated as the residual of a two-
factor Cobb-Douglas production function: Qit = λ0 +λKKit +λLLit +ϕit + εit, where Qit, Lit and
Kit denote firm i’s value-added before taxes, labor and capital stock respectively (all in logs), and
εit stands for measurement error in output. Real value added is obtained by subtracting the deflated
value of intermediate inputs used in production from the firm’s deflated output. As explained by
Feenstra et al. (2011), due to the importance of processing trade in China it is preferable to estimate
a valued-added than a gross output-based production function for Chinese firms. We calculate TFP
using both OLS and the semiparametric methodology proposed by Levinsohn and Petrin (2003)
(LP).
Using firms’ productivity as a dependent variable, Columns 1-3 of Table 5 present estimates
of the size and productivity premia of pure-exporters with respect to domestic firms and regular
exporters using the NBS data. We cluster the standard errors at the firm level to take care of
potential within-firm correlation over time. The upper panel of the Table uses domestic firms as
the comparison group while in the lower panel we compare pure and regular exporters. The full
set of prefecture-city fixed effects seeks to capture potential productivity differences arising from
a firm’s location in a FTZ, as well as differences in cities’ skill endowments, which might affect
firm-level productivity, see e.g. Cheng et al. (2012).
Column 1 of Table 5 shows that total sales of pure exporters are significantly higher than those
of domestic producers but smaller than those of regular exporters (both differences are significant
at 1 percent). Using the methodology proposed by Levinsohn and Petrin (2003), we find that pure
exporters are 35.9 percent more productive than domestic firms but 25.8 percent less productive
28Nominal values of output and capital are deflated using two-digit sectoral price indexes. The deflators areobtained from the system of national accounts of the Chinese Bureau of Statistics. The 2-digit intermediate inputdeflators have been computed using both output deflators and the 2002 Chinese input-output.
22

Table 5: Pure Exporters’ Productivity Premia Relative to Domestic Firms and Regular Exporters
Manufacturing Survey Matched Data
(1) (2) (3) (4) (5) (6)log Sales TFP LP TFP OLS log Sales TFP LP TFP OLS
Comparison group:All domestic firms All domestic firms
Pure exporter 0.467a 0.307a 0.011b
(0.007) (0.006) (0.005)× FIE 0.569a 0.395a 0.096a
(0.012) (0.010) (0.009)× PTE 0.972a 0.602a -0.017
(0.019) (0.015) (0.012)× Neither FIE 0.696a 0.445a 0.074a
or PTE (0.016) (0.013) (0.011)
Comparison group:All regular exporters Each type of regular exporter
Pure exporter -0.420a -0.299a -0.145a
(0.008) (0.006) (0.005)× FIE -0.624a -0.448a -0.206a
(0.014) (0.012) (0.010)× PTE -0.337a -0.286a -0.281a
(0.025) (0.020) (0.015)× Neither FIE -0.197a -0.155a -0.044a
or PTE (0.017) (0.014) (0.011)
Year fixed effects X X X X X XSector fixed effects X X X X X XPrefecture-city fixed effects X X X X X X
# Obs 1,100,600 1,100,600 1,100,600 945,711 945,711 945,711# firms 386,185 386,185 386,185 348,860 348,860 348,860R2 0.165 0.223 0.280 0.178 0.228 0.285
Robust standard error clustered at the firm level into brackets. a, b , c significantly different from0 at 1%, 5% and 10% level, respectively.
than regular exporters.29 Estimating productivity OLS results in the same productivity ranking,
but substantially smaller productivity premia. Overall, our results provide support for our theo-
retical prediction that pure exporters show an intermediate level of productivity, greater than that
of domestic firms but lower than that of regular exporters. All these results are also consistent
with the findings of Lu et al. (2011), who use various other productivity estimation methods and
a stricter definition of pure exporters, i.e. firms exporting exactly 100 percent of their output.
29We take exponents of the TFP coefficients in Column 2 of Table 5, to which we subtract one.
23

Moreover, our results imply that in line with the literature, e.g. Dai et al. (2011), Ma et al. (2011),
Chinese exporters (pure or regular) are more productive than non-exporters.
Using our matched sample allows us to estimate the productivity premium of different types of
pure exporters (namely FIEs and PTEs). Columns 4-6 of Table 5 present these results. The upper
panel of the Table uses domestic firms as a control group, and shows that all three types of pure
exporters are significantly more productive than domestic firms, with the exception of PTEs when
productivity is estimated using OLS (Column 6).30 In the lower panel we conduct a group-wise
comparison between pure and regular exporters, i.e. we compare pure and regular exporters that
are FIEs, pure and regular PTEs and so on. Our results show that for each type of firm regular
exporters are significantly larger and more productive than pure exporters.
Firm-level taxes
The NBS survey provides information on the value of different taxes paid by firms as reported in
their balance sheet. The three major taxes are on the firms’ income, value-added tax and sales.
Table 6 presents the difference in tax expenditure paid by pure exporters relative to other firms.
As in the previous section, the upper panel of the table uses domestic firms as a control group,
whereas the lower panel presents a group-wise comparison with regular exporters, controlling for
sector, year and province-city-specific effects. The full set of prefecture-city fixed effects intends to
capture any sort of preferential tax treatment common to all firms located in a FTZ. Additionally,
standard errors are clustered at the firm-level. The dependent variables used in Columns 1-3 are
respectively the income tax, value-added tax and sales tax outlay as a share of a firm’s value-added.
The coefficients reported in Table 6 can be interpreted as the difference in the share of value-
added devoted to the payment of each tax by pure exporters relative to the corresponding control
group. Moreover, by adding the coefficients, we obtain the overall difference (in percentage points)
of firms’ value-added spent on taxes. Domestic firms dedicate on average an additional 5.08 percent
(≈ 0.68 + 3.32 + 1.08) of their value-added to pay these taxes compared to pure exporters, while
regular exporters spend 2.52 percent (≈ 0.47+1.88+0.17) more. Columns 4-6 present the difference
30Estimating TFP using Olley and Pakes (1996) methodology, Dai et al. (2011) find PTEs’ productivity to be4 percent lower than that of domestic firms at a 10 percent significance level. This difference becomes larger andsignificant at 1 percent when calculating TFP by OLS. One major difference with our estimation is that Dai et al.obtain their TFP measure from a gross output production function. As noted above, following Feenstra et al. (2011),we prefer to use a value-added production function.
24

in tax expenditure by the three different type of pure exporters, i.e. PTEs, FIEs and the residual
group, compared to domestic firms and each type of regular exporter. Except when comparing the
sales tax outlay of pure and regular exporters that are FIEs where the coefficient is insignificant,
all the estimates indicate that pure exporters pay significantly less taxes than other firms.
Table 6: Pure Exporters’ Tax Expenditure Premia Relative to Domestic Firms and Regular Ex-porters
Comparison group: Domestic Firms
Manufacturing Survey Matched Data
(1) (2) (3) (4) (5) (6)Income tax VAT Sales tax Income tax VAT Sales tax
as share of value-added as share of value-added
Comparison group:All domestic firms All domestic Firms
Pure exporter -0.687a -3.325a -1.082a
(0.019) (0.042) (0.023)× FIE -1.110a -5.914a -2.095a
(0.036) (0.080) (0.033)× PTE -1.092a -8.621a -2.023a
(0.034) (0.072) (0.032)× Neither FIE -0.194a -3.239a -0.859a
or PTE (0.052) (0.102) (0.050)
Comparison group:All regular exporters Each type of regular exporter
Pure Exporters -0.471a -1.881a -0.171a
(0.020) (0.043) (0.023)× FIE -0.460a -3.497a -0.049
(0.041) (0.088) (0.039)× PTE -0.330a -4.299a -0.236a
(0.047) (0.103) (0.043)× Neither FIE -0.413a -0.501a -0.183a
or PTE (0.056) (0.107) (0.054)
Year fixed effects X X X X X XSector fixed effects X X X X X XPrefecture-city fixed effects X X X X X X
# Obs 1,100,600 1,100,600 1,100,600 945,711 945,711 945,711# firms 386,185 386,185 386,185 348,860 348,860 348,860R2 0.060 0.103 0.120 0.061 0.122 0.118
Robust standard error clustered at the firm level into brackets. a, b , c significantly different from0 at 1%, 5% and 10% level, respectively.
25

5 Economic Implications of Pure-Exporter Subsidies
In this section, we explore the general equilibrium consequences of using pure-exporter subsidies.
To do so, we embed the partial equilibrium model presented in Section 3 into a two-country gen-
eral equilibrium model in which China unilaterally provides a pure-exporter subsidy. In order to
highlight the distinct features of the pure-exporter subsidy, we conduct a comparative statics exer-
cise with respect to the level of expenditure in export subsidies, and compare our results to those
produced by a standard ad-valorem export subsidy.
Pure exporter subsidies in general equilibrium
We begin our presentation by providing the equilibrium conditions that close the model so that
aggregate demand, wages, and the mass of firms operating in each country will be determined
endogenously. Each country i = c, f , is inhabited by Li identical consumers, each supplying one
unit of labor inelastically. Preferences of the representative consumer in country i are given by,
Ui =
(∫ω∈Ω
q(ω)σ−1σ dω
) σσ−1
, i ∈ c, f, (11)
where Ωi is the set of varieties available for consumption in country i, q(ω) is the quantity consumed
of good ω and σ > 1 is the elasticity of substitution among varieties. The CES utility function
(11) results in an iso-elastic demand function in country i for variety ω like the one considered in
section 3,
q(ω) = Aip(ω)−σ, with Ai ≡ EiP σ−1i , (12)
where Ei and Pi denote aggregate expenditure and the ideal price index in country i respectively.
Firms need to incur an initial investment fe to learn their idiosyncratic productivity, drawn from
a Pareto distribution G(ϕ) = 1−ϕ−a, which is the same in both countries.31 After observing their
productivity realization, firms that decide to remain in the market choose their mode of operation
k ∈ d, p, x, although the pure-exporter mode of operation is only available in China. We assume
that every period firms exit the market with probability δ ∈ (0, 1). Therefore, the expected present
discounted value of a Chinese firm with productivity ϕ operating under production mode k is
31All fixed costs in both countries are denominated in units of labor.
26

vkc (ϕ) = maxkπkc (ϕ)/δ, with πkc (ϕ) as defined in Section 3, equation (3). Firms choose the mode
of production that maximizes their expected present discounted value. Firms in country i will
continue to enter the market until their expected present discounted value equals the entry cost,
∫vki (ϕ)dG(ϕ) = fewi, i ∈ c, f.
Letting Mei denote the mass of firms paying the entry cost in country i, and Mi the mass of
operating firms, we can write the labor market clearing condition in country i as follows,32
Mi
[∑k
∫lki (ϕ)dµi(ϕ)
]+Meife = Li, i ∈ c, f,
where µi(ϕ) is the ex-post distribution of operating firms across productivity levels in country i,
and lki (ϕ) is the optimal labor demand for a firm with productivity ϕ using production mode k in
country i.33 Price indices in each country are given by
Pc =
[ ∫pc(ϕ)1−σ(Mc −Mp
c )dµc(ϕ) +
∫p∗f (ϕ)1−σMx
f dµf (ϕ)
] 11−σ
,
Pf =
[ ∫pf (ϕ)1−σMfdµf (ϕ) +
∫p∗c(ϕ)1−σMx
c dµc(ϕ) +
∫p∗cp(ϕ)1−σMp
c dµc(ϕ)
] 11−σ
,
where Mki is the mass of operating firms using mode of operation k in country i.34 Notice that
the term (Mc −Mpc ) that appears in the price index for China denotes the mass of domestically-
produced varieties consumed in China, i.e. excluding the varieties produced by pure exporters. We
assume that the Chinese government levies lump-sum taxes from households in order to finance
the pure-exporter subsidy, and it runs a balanced budget:
Tc =s
1 + s
[∫rpc (ϕ)Mp
c dµc(ϕ)
],
where rpc (ϕ) denotes the after-subsidy revenue earned by a pure exporter with productivity ϕ and
32Both variables are linked through the steady-state condition pin,iMei = δMi, where pin,i is the probability ofsuccessful entry in country i.
33Note that lki (ϕ) also includes the amount of labor used to pay fixed costs.34Formally, Mk
i ≡ Mi
∫Iki (ϕ)dµi(ϕ), where Iki (ϕ) is an indicator function that takes the value of 1 if a firm with
productivity ϕ uses mode of operation k.
27

Tc is the aggregate tax collection in China.35 Since free entry implies that aggregate income spent
on entry costs, Meifewi, is exactly compensated by aggregate profits, Πi, aggregate expenditure in
country i is given by Ei = wiLi − Ti. Finally, the trade balance condition reads,
∫rxc (ϕ)Mx
c dµc(ϕ) +1
1 + s
∫rpc (ϕ)Mp
c dµc(ϕ) =
∫rxf (ϕ)Mx
f dµf (ϕ).
Taking the wage in the rest of the world, wf , as the numeraire, equilibrium in the model is char-
acterized by a vector of endogenous variables(Mh,Mf , Ph, Pf , Eh, Ef , wh
), such that the labor
market clearing, free entry and aggregate expenditure equations are satisfied in both countries and
the balanced trade condition holds.
Calibration
We solve the model presented above numerically, and use as our benchmark a scenario in which
both countries are identical in terms of their size and the vector of parameters faced by firms and
consumers. This means that if the pure-exporter subsidy s is small enough so that no firm chooses
to be a pure exporter in China, all equilibrium variables would be the same in both countries.
We set the elasticity of substitution, σ, equal to 3, the same value used by Hsieh and Ossa
(2011), which is close to the median of the estimates presented by Broda and Weinstein (2006)
for 3 and 5-digit industries in the United States. We assume that firms in both countries draw
their productivity from the same Pareto distribution with lower bound 1 and shape parameter a.
Following Helpman et al. (2004), we obtain a − (σ − 1) by regressing the log of the productivity
rank (ordering Chinese firms according to their TFP) on the log of firms’ productivity. Using the
NBS dataset, we obtain a coefficient of 0.76. Given our assumption that σ = 3, it implies a value of
a = 2.76.36 Because the product of the sunk entry cost, fe, and the probability of exiting, δ, simply
re-scales the mass of operating firms, we follow Bernard et al. (2007) and set these parameters to
2 and 0.025 respectively. Country sizes, as noted above, are identical and normalized to 1.
This leaves us with four parameters left to be calibrated, namely, the fixed costs associated
with domestic production and exporting, the iceberg transportation cost faced by exporters and
35Since we assume that the rest of the world is not conducting any trade policy, it is the case that Tf = 0.36In all our simulations we approximate G(ϕ) by a discrete distribution with 100,000 grid points.
28
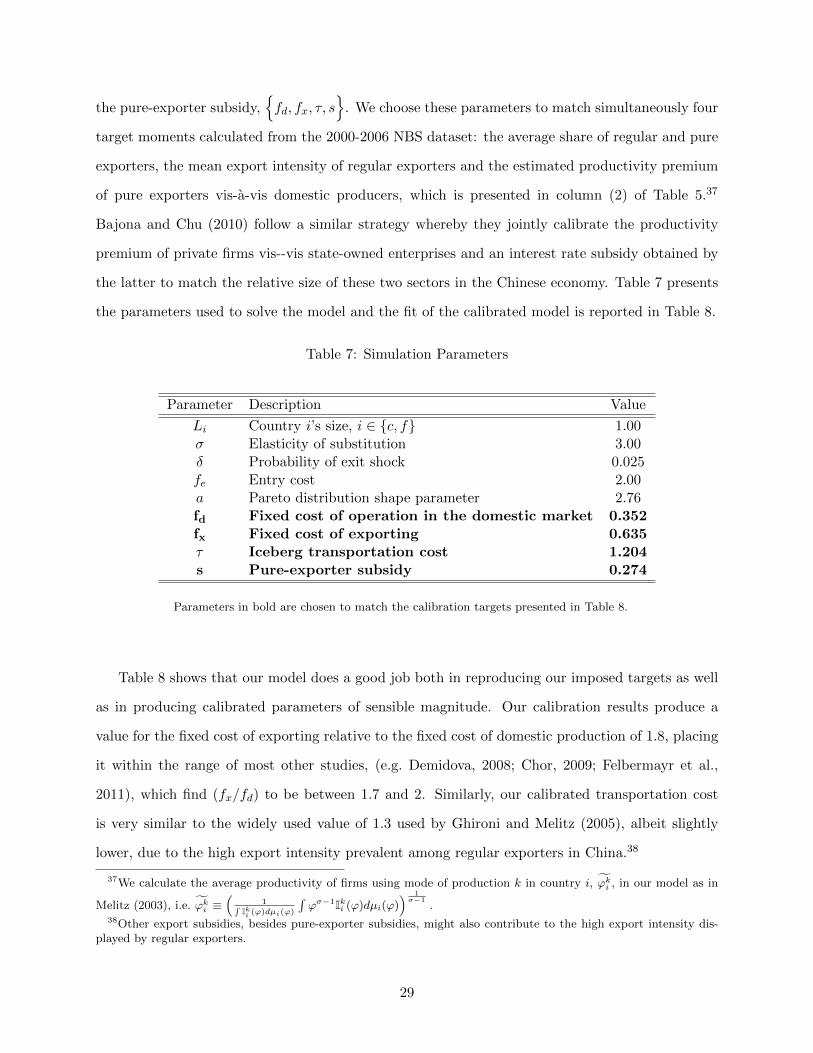
the pure-exporter subsidy,fd, fx, τ, s
. We choose these parameters to match simultaneously four
target moments calculated from the 2000-2006 NBS dataset: the average share of regular and pure
exporters, the mean export intensity of regular exporters and the estimated productivity premium
of pure exporters vis-a-vis domestic producers, which is presented in column (2) of Table 5.37
Bajona and Chu (2010) follow a similar strategy whereby they jointly calibrate the productivity
premium of private firms vis--vis state-owned enterprises and an interest rate subsidy obtained by
the latter to match the relative size of these two sectors in the Chinese economy. Table 7 presents
the parameters used to solve the model and the fit of the calibrated model is reported in Table 8.
Table 7: Simulation Parameters
Parameter Description Value
Li Country i’s size, i ∈ c, f 1.00σ Elasticity of substitution 3.00δ Probability of exit shock 0.025fe Entry cost 2.00a Pareto distribution shape parameter 2.76fd Fixed cost of operation in the domestic market 0.352fx Fixed cost of exporting 0.635τ Iceberg transportation cost 1.204s Pure-exporter subsidy 0.274
Parameters in bold are chosen to match the calibration targets presented in Table 8.
Table 8 shows that our model does a good job both in reproducing our imposed targets as well
as in producing calibrated parameters of sensible magnitude. Our calibration results produce a
value for the fixed cost of exporting relative to the fixed cost of domestic production of 1.8, placing
it within the range of most other studies, (e.g. Demidova, 2008; Chor, 2009; Felbermayr et al.,
2011), which find (fx/fd) to be between 1.7 and 2. Similarly, our calibrated transportation cost
is very similar to the widely used value of 1.3 used by Ghironi and Melitz (2005), albeit slightly
lower, due to the high export intensity prevalent among regular exporters in China.38
37We calculate the average productivity of firms using mode of production k in country i, ϕki , in our model as in
Melitz (2003), i.e. ϕki ≡(
1∫Iki (ϕ)dµi(ϕ)
∫ϕσ−1Iki (ϕ)dµi(ϕ)
) 1σ−1
.38Other export subsidies, besides pure-exporter subsidies, might also contribute to the high export intensity dis-
played by regular exporters.
29
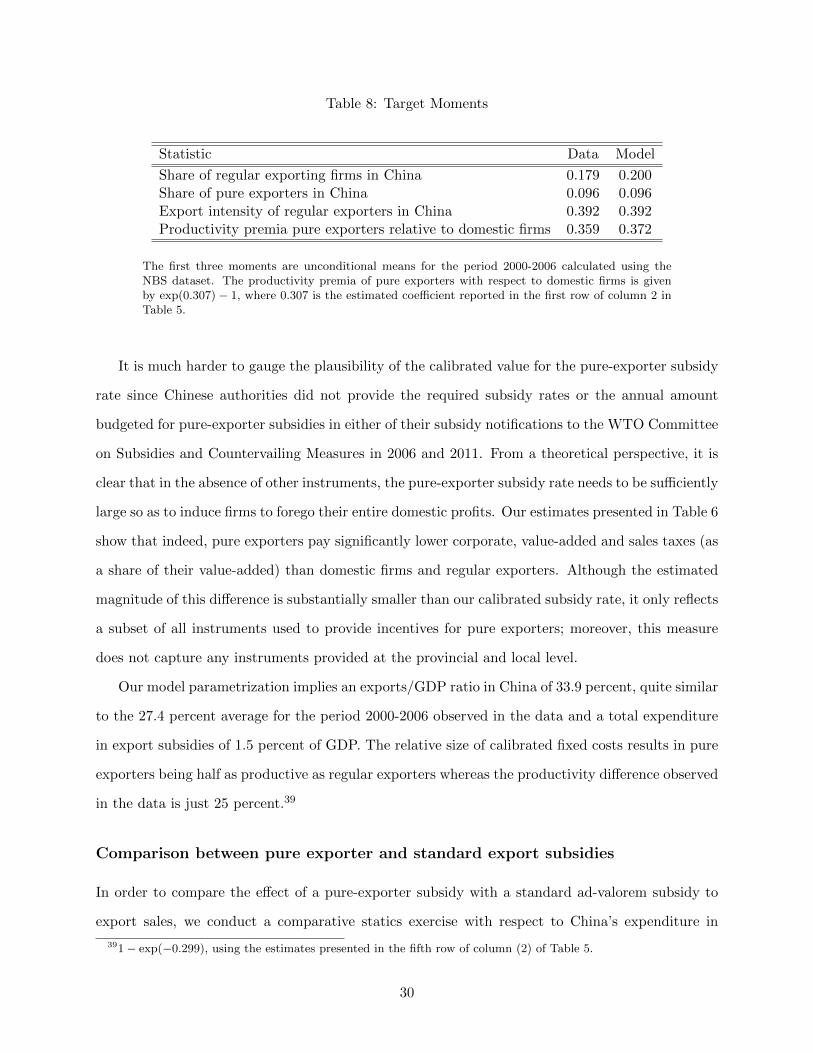
Table 8: Target Moments
Statistic Data Model
Share of regular exporting firms in China 0.179 0.200Share of pure exporters in China 0.096 0.096Export intensity of regular exporters in China 0.392 0.392Productivity premia pure exporters relative to domestic firms 0.359 0.372
The first three moments are unconditional means for the period 2000-2006 calculated using theNBS dataset. The productivity premia of pure exporters with respect to domestic firms is givenby exp(0.307) − 1, where 0.307 is the estimated coefficient reported in the first row of column 2 inTable 5.
It is much harder to gauge the plausibility of the calibrated value for the pure-exporter subsidy
rate since Chinese authorities did not provide the required subsidy rates or the annual amount
budgeted for pure-exporter subsidies in either of their subsidy notifications to the WTO Committee
on Subsidies and Countervailing Measures in 2006 and 2011. From a theoretical perspective, it is
clear that in the absence of other instruments, the pure-exporter subsidy rate needs to be sufficiently
large so as to induce firms to forego their entire domestic profits. Our estimates presented in Table 6
show that indeed, pure exporters pay significantly lower corporate, value-added and sales taxes (as
a share of their value-added) than domestic firms and regular exporters. Although the estimated
magnitude of this difference is substantially smaller than our calibrated subsidy rate, it only reflects
a subset of all instruments used to provide incentives for pure exporters; moreover, this measure
does not capture any instruments provided at the provincial and local level.
Our model parametrization implies an exports/GDP ratio in China of 33.9 percent, quite similar
to the 27.4 percent average for the period 2000-2006 observed in the data and a total expenditure
in export subsidies of 1.5 percent of GDP. The relative size of calibrated fixed costs results in pure
exporters being half as productive as regular exporters whereas the productivity difference observed
in the data is just 25 percent.39
Comparison between pure exporter and standard export subsidies
In order to compare the effect of a pure-exporter subsidy with a standard ad-valorem subsidy to
export sales, we conduct a comparative statics exercise with respect to China’s expenditure in
391 − exp(−0.299), using the estimates presented in the fifth row of column (2) of Table 5.
30

export subsidies. Since the pure-exporter subsidy is only used when the subsidy rate s is above
a threshold, the same level of expenditure in export subsidies results from a higher pure-exporter
subsidy rate relative to the standard export subsidy. Specifically, our calibrated pure-exporter
subsidy rate of 27.4 percent, which is received by 9.6 percent of all active firms results in the same
aggregate subsidy expenditure as a standard export subsidy rate of 4.53 enjoyed by all exporters,
which account for 29.6 percent of all active firms.
Figure 5 depicts the change in productivity cutoffs in China and the rest of the World in
response to an increase in export subsidy expenditure in China. Solid lines are used to depict the
variable of interest when a pure-exporter subsidy is in place while dashed lines are used in the
case of a standard export subsidy. We start our analysis with Panel B of Figure 5, which shows
how export cutoffs are affected in China. A higher pure-exporter subsidy increases the profitability
of becoming a pure exporter, increasing ϕ(s) and decreasing ϕ(s), previously defined in equations
(6) and (7). This creates a wedge around the no-subsidy export cutoff where pure exporters arise
following the same mechanism described in Section 3. In the case of standard export subsidy, the
export cutoff falls as the subsidy increases the profitability of exporting.40 Both types of subsidies
increase China’s aggregate exports relative to the laissez-faire equilibrium, but aggregate exports
are slightly larger when the pure-exporter subsidy is used.
Figure 5 shows that increasing the pure-exporter subsidy has the same qualitative effect on
the domestic and export cutoffs in the rest of the World as what follows from a higher standard
export subsidy. In both cases, Panel C reveals that tougher import competition driven by the rise
in Chinese exports reduces the profitability of domestic producers in the rest of the World, forcing
the least productive firms to exit and increasing the domestic production cutoff. A higher domestic
cutoff increases average productivity abroad, and in turn decreases the export cutoff in the rest of
the World and helps to restore balanced trade (see Panel D).
The most striking difference between the two types of subsidy can be seen in the response of
ϕ∗, the cutoff characterizing the decision of whether to operate or not for Chinese firms, shown
in Panel A of Figure 5. With a standard export subsidy, domestic firms in China face stronger
competition both from Chinese and foreign exporters, which forces the least productive firms to
40A detailed analysis of standard export subsidies in the context of a heterogeneous-firm model of trade can befound in Demidova and Rodrıguez-Clare (2009) and Felbermayr et al. (2012).
31

Figure 5: Comparative Statics - Productivity Cutoffs
A circle (square) denotes the equilibrium value for the variable of interest in China (rest of the World) using the calibrated parameters presented in Table 7 tosolve the model.
32

exit. This effect is manifest in a higher domestic cutoff. An increase in the pure-exporter subsidy
expenditure, however, produces the opposite effect. Since operating in the pure-exporter regime
requires firms to sell all their output in the foreign market alone, it follows that as the pure-
exporter subsidy increases, a larger set of varieties produced by Chinese firms with productivity
ϕ ∈ [ϕ(s), ϕ(s)], becomes unavailable to Chinese consumers. As more Chinese firms become pure
exporters, competition in the domestic market is relaxed, allowing the successful entry of less-
productive firms. This implies that the domestic cutoff in China falls, in contrast to what happens
when a standard export subsidy is used. Therefore, the pure-exporter subsidy allows China to
increase its aggregate exports while at the same time providing heightened protection to its domestic
firms.
Examining the mass of varieties consumed and produced in both countries also provides a clear
contrast between the two types of subsidies. As Figure 6 shows, although the use of pure-exporter
subsidies results in a greater number of varieties being manufactured in China (since more low-
productivity firms are now operating in China), the mass of varieties available for consumption
there falls. The opposite result occurs in the rest of the World. The standard export subsidy on
the other hand, results in fewer varieties being produced and consumed in both countries, although
the effect is stronger in China.
Similarly to the standard export subsidy, the pure-exporter subsidy has a negative effect on
China’s terms-of-trade.41 The Chinese government subsidizes the consumption of Chinese goods
by individuals abroad, while its own consumers buy relatively more expensive imported goods.
The negative impact of the pure-exporter subsidy on terms-of-trade is stronger than when the
standard export subsidy is in place, because the latter does not constrain the consumption basket
of Chinese consumers. Moreover, since a larger share of China’s exports is being conducted by pure
exporters receiving a substantially higher subsidy rate, China’s terms-of-trade deteriorate more
with a pure-exporter subsidy than with a standard export subsidy.
41Demidova and Rodrıguez-Clare (2009) show in a small economy environment with heterogeneous firms that aregular ad-valorem export subsidy has an ambiguous effect on the terms-of-trade.
33

Figure 6: Comparative Statics - Mass of Varieties Consumed and Produced
A circle (square) denotes the equilibrium value for the variable of interest in China (rest ofthe World) using the calibrated parameters presented in Table 7 to solve the model.
Welfare effects of eliminating pure exporter subsidies
Our analysis shows that a pure-exporter subsidy reduces overall welfare in the enacting country.
Moreover, for a given expenditure in export subsidies, the welfare loss produced by a pure-exporter
subsidy is greater than that caused by a standard export subsidy. Conversely, welfare in the
rest of the World improves more when China uses the pure-exporter subsidy (see Figure 7). In
summary, Chinese consumers get the raw end of the deal from the use of pure-exporter subsidies.
Their aggregate expenditure falls because they need to finance the subsidy, and additionally they
experience worse terms-of-trade, lower consumption variety and higher prices due to the protection
that the subsidy provides to low-productivity firms.
As scrutiny over China’s trade policy intensifies, it is quite timely to quantify the welfare
gains that would accrue to China if it were to stop using pure-exporter subsidies. Our calibrated
model indicates that China’s welfare would increase by 3.2 percent if pure-exporter subsidies were
eliminated. To put this magnitude in context, this welfare gain is equivalent to the improvement
34

Figure 7: Comparative Statics - Welfare
A circle (square) denotes the equilibrium value for the variable of interest in China (rest ofthe World) using the calibrated parameters presented in Table 7 to solve the model.
produced by halving the calibrated bilateral iceberg transportation cost from 20 to 10 percent in
a scenario without pure-exporter subsidies. From the perspective of the rest of the World, the
elimination of pure-exporter subsidies would produce a welfare reduction of 1.14 percent.
Trade liberalization with pure exporter subsidies
We conduct a second exercise using our calibrated model which confirms the insight provided by
our simple partial equilibrium model, that a reduction in the trade cost parameter τ increases
the share of pure exporters. From Table 4 we see that on average, the share of pure exporters
among all manufacturing exporters increased from 30 to 40 percent over our sample period. In the
context of our calibrated model, a 17 percent bilateral reduction in trade costs would replicate the
10 percentage point rise in the share of pure exporters. Following this trade liberalization, China
would experience a welfare loss of 0.75 percent while the rest of the World would enjoy a 1.44
percent welfare gain relative to our calibrated benchmark equilibrium.
35
6 Conclusion
China’s transition to become the world’s second largest trading economy over the last thirty years
has been nothing but breathtaking, spurring great interest on the economic reforms that made this
possible. In this paper, we document an important yet not widely appreciated element of China’s
trade policy whose economic implications have not been explored before, a heavy reliance on a wide
range of policies favoring firms that export the vast majority of their output.
We study the economic implications of these pure exporter subsidies in the context of a
heterogeneous-firm framework in which firms exporting all their output receive an ad-valorem sales
subsidy. Using a rich dataset of Chinese manufacturing firms for the period 2000-2006 matched
with export transactions data we provide empirical support for the predictions derived from our
model. Our findings show that pure-exporters receive a preferential tax treatment compared to
other firms, and also that they exhibit an intermediate level of productivity, greater than that of
domestic firms but lower than that of firms that sell both at home and abroad.
Turning to the general equilibrium implications of pure exporter subsidies, we show that their
use reduces welfare in China and is more deleterious than a standard ad-valorem export subsidy.
Since the former induces a set of firms to sell only abroad, it lessens competition in the domestic
market and provides heightened protection for low-productivity domestic firms. This feature might
explain the popularity of similar policies such as the establishment of export-processing zones across
a large number of developing countries.
A counterfactual policy analysis based in our calibrated model, indicates that China would
experience an increase in real income of more than 3 percent if it were to completely eliminate its
use of pure-exporter subsidies. This welfare gain is equivalent to that resulting from halving bilateral
trade costs in an environment without pure-exporter subsidies. However, our analysis shows that
conducting a trade liberalization reform while maintaining pure exporter subsidies would lead to a
welfare loss in China by increasing the number of firms choosing to be pure exporters. A bilateral
reduction in trade costs that is consistent with the observed increase in the share of pure exporters
between 2000 and 2006 results in a welfare loss for China of 0.75 percent.
36

References
Bajona, C. and T. Chu (2010): “Reforming State Owned Enterprises in China: Effects of WTOAccession,” Review of Economic Dynamics, 13, 800–823.
Bernard, A. B., J. Eaton, J. B. Jensen, and S. Kortum (2003): “Plants and Productivityin International Trade,” American Economic Review, 93, 1268–1290.
Bernard, A. B., S. J. Redding, and P. K. Schott (2007): “Comparative Advantage andHeterogeneous Firms,” Review of Economic Studies, 74, 31–66.
Brandt, L., J. van Biesebroeck, and Y. Zhang (2012): “Creative Accounting or Creative De-struction? Firm-level Productivity Growth in Chinese Manufacturing ?” Journal of DevelopmentEconomics, 97, 339–351.
Broda, C. and D. E. Weinstein (2006): “Globalization and the Gains from Variety,” TheQuarterly Journal of Economics, 121, 541–585.
Cheng, W., J. Morrow, and K. Tacharoen (2012): “Productivity as if Space Mattered: AnApplication to Factor Markets Across China,” Manuscript, London School of Economics.
Chor, D. (2009): “Subsidies for FDI: Implications From a Model with Heterogeneous Firms,”Journal of International Economics, 78, 113–125.
Dai, M., M. Maitra, and M. Yu (2011): “Unexceptional Exporter Performance in China? TheRole of Processing Trade,” Manuscript, Columbia University.
Demidova, S. (2008): “Productivity Improvements And Falling Trade Costs: Boon Or Bane?”International Economic Review, 49, 1437–1462.
Demidova, S. and A. Rodrıguez-Clare (2009): “Trade Policy Under Firm-level Heterogeneityin a Small Economy,” Journal of International Economics, 78, 100–112.
di Giovanni, J., A. A. Levchenko, and J. Zhang (2012): “The Global Welfare Impact ofChina: Trade Integration and Technological Change,” IMF Working Paper 12/79.
Farole, T. (2011): Special Economic Zones in Africa: Comparing Performance and Learningfrom Global Experience, Washinton DC: The World Bank.
Feenstra, R. C. (1998): “One Country, Two Systems: Implications of WTO Entry for China,”Manuscript, University of California, Davis.
Feenstra, R. C., Z. Li, and M. Yu (2011): “Exports and Credit Constraints Under IncompleteInformation: Theory and Evidence from China,” NBER Working Papers 16940.
Felbermayr, G., B. Jung, and M. Larch (2012): “Optimal Tariffs, Retaliation and the WelfareLoss from Tariff Wars in the Melitz Model,” Journal of International Economics, 89, 13–25.
Felbermayr, G., J. Prat, and H.-J. Schmerer (2011): “Globalization and Labor MarketOutcomes: Wage Bargaining, Search Frictions, and Firm Heterogeneity,” Journal of EconomicTheory, 146, 39–73.
Ghironi, F. and M. J. Melitz (2005): “International Trade and Macroeconomic Dynamics withHeterogeneous Firms,” The Quarterly Journal of Economics, 120, 865–915.
37

Hamada, K. (1974): “An Economic Analysis of the Duty Free Zone,” Journal of InternationalEconomics, 4, 225–241.
Heid, B., M. Larch, and A. Riano (Forthcoming): “The Rise of the Maquiladoras: A MixedBlessing,” Review of Development Economics.
Helpman, E., M. J. Melitz, and S. R. Yeaple (2004): “Export Versus FDI with HeterogeneousFirms,” American Economic Review, 94, 300–316.
Hong Kong Trade Development Council (2003): Guide to Doing Business in China, HK-TDC Business Edition, available at www.hktdc.com.
——— (2009): Turning from Export Processing to Domestic Sales, HKTDC Business Edition,available at www.hktdc.com.
Hsieh, C.-T. and P. J. Klenow (2009): “Misallocation and Manufacturing TFP in China andIndia,” The Quarterly Journal of Economics, 124, 1403–1448.
Hsieh, C.-T. and R. Ossa (2011): “A Global View of Productivity Growth in China,” NBERWorking Papers 16778, National Bureau of Economic Research.
Ianchovichina, E. (2007): “Are Duty Drawbacks on Exports Worth the Hassle?” CanadianJournal of Economics, 40, 881–913.
Khandelwal, A. K., P. K. Schott, and S.-J. Wei (Forthcoming): “Trade Liberalizationand Embedded Institutional Reform: Evidence from Chinese Exporters,” American EconomicReview.
Lau, L. J., Y. Qian, and G. Roland (2000): “Reform without Losers: An Interpretation ofChina’s Dual-Track Approach to Transition,” Journal of Political Economy, 108, 120–143.
Levinsohn, J. and A. Petrin (2003): “Estimating Production Functions Using Inputs to Controlfor Unobservables,” Review of Economic Studies, 70, 317–341.
Li & Fung Group (2012): What do Expert Say? Ten Highlights of Chinas Commercial Sector,2011-2012, Li & Fung Research Centre, available at www.funggroup.com.
Lu, D. (2010): “Exceptional Exporter Performance? Evidence from Chinese ManufacturingFirms,” Manuscript, University of Chicago.
Lu, J., Y. Lu, and Z. Tao (2011): “Pure Exporter: Theory and Evidence,” MPRA Paper 29966,University Library of Munich, Germany.
Ma, Y., H. Tang, and Y. Zhang (2011): “Factor Intensity, Product Switching, and Productivity:Evidence from Chinese Exporters,” Discussion Papers Series, Tufts University 0761.
Manova, K. and Z. Yu (2012): “Firms and Credit Constraints along the Value-Added Chain:Processing Trade in China,” Manuscript, Stanford University.
Manova, K. and Z. Zhang (2012): “Export Prices Across Firms and Destinations,” The Quar-terly Journal of Economics, 127, 379–436.
Melitz, M. (2003): “The Impact of Trade on Intra-Industry Reallocations and Aggregate Pro-ductivity,” Econometrica, 71, 1695–1725.
38

Miyagiwa, K. F. (1986): “A Reconsideration of the Welfare Economics of a Free-trade Zone,”Journal of International Economics, 21, 337–350.
Naughton, B. (1996): “China’s Emergence and Prospects as a Trading Nation,” Brookings Paperson Economic Activity, 27, 273–344.
——— (2007): The Chinese Economy: Transitions and Growth, Cambridge, MA: MIT Press.
Olley, G. S. and A. Pakes (1996): “The Dynamics of Productivity in the TelecommunicationsEquipment Industry,” Econometrica, 64, 1263–1297.
Panagariya, A. (1992): “Input Tariffs, Duty Drawbacks, and Tariff Reforms,” Journal of Inter-national Economics, 32, 131–147.
Schminke, A. and J. van Biesebroeck (2011): “Using Export Market Performance to EvaluateRegional Preferential Policies in China,” Center for Economic Studies Discussion Paper 11.33,Katholieke Universiteit Leuven.
Standard Chartered Bank (2007): “On the Ground, China,” Standard chartered researchpaper.
Wang, J. (Forthcoming): “The Economic Impact of Special Economic Zones: Evidence fromChinese Municipalities,” Journal of Development Economics.
Wang, Z. and Z. Yu (Forthcoming): “Trading Partners, Traded Products, and Firm Performance:Evidence from China’s Exporter-Importers,” The World Economy.
39

Appendix
A List of Free Trade Zones
A.1 Special Economic Zones
Special Economic Zones include the six prefectures: Haikou, Sanya, Shantou Shi, Shenzhen, Xia-men, Zhuhai and the entire province of Hainan.
A.2 Coastal Development Zones
Coastal Development Zones include the Shanghai Economic area established in 1982. This zonedoes not cover entirely the Shanghai prefecture, and notably does not include the city center ofShanghai. We make use of the firm postcode to exclude firms located in the city center from ourdefinition of FTZ, i.e. postcode starting with “2000”.
Coastal Development Zones also include the prefecture-cities of Anshan, Baoding, Beihai,Dalian, Dandong, Fuzhou, Guangzhou, Jinan, Langfang, Lianyungang, Nantong, Ningbo, Qing-dao, Qinhuangdao, Quanzhou, Shenyang, Shijiazhuang, Tianjin, Weifang, Wenzhou, Weihai, Yan-tai, Yingkou, Zhanjiang, Zhangzhou, Zibo.
A.3 Yangtze River Delta Economic Zone
Yangtze River Delta Economic Zone includes cities located in the Yangtze River Delta but alsosome cities located outside the area due to mutual economic development. In 1982, the Chinesegovernment set up the Shanghai Economic Area. Besides Shanghai, 4 cities in Jiangsu (Changzhou,Nantong, Suzhou, Wuxi) and 5 cities in Zhejiang (Hangzhou, Huzhou, Jiaxing, Ningbo, Shaoxing)were included. In 1992, a 14-city cooperative joint meeting was launched. Besides the previous10 cities, the members included Nanjing, Yangzhou and Zhenjiang in Jiangsu, and Zhoushan inZhejiang. In 1998, Taizhou became a new member.
A.4 Pearl River Delta Economic Zone
The boundaries of the Pearl River Delta as an economic zone differ from those associated withthe geographic boundaries of the delta. In 1985, the State Council designated the Pearl RiverDelta as an open economic zone. It contained three Special Economic Zones that were establishedearlier: Shantou, Shenzhen and Zhuhai. Other leading cities in the open zone are: Dongguan,Foshan, Guangzhou, Huizhou, Jiangmen and Zhongshan. ‘Peripheral’ cities that were declared opencities include: Chaozhou, Heyuan, Jieyang, Maoming, Meizhou, Qingyuan, Shanwei, Shaoguan,Yangjiang, Zhanjiang and Zhaoqing.
40

Appendix
B Spillovers from foreign affiliates
A recurring argument put forward by policy-makers in developing countries to rationalize subsidiesto export-oriented foreign affiliates is that the activities of these establishments generate knowledgespillovers that can be appropriated by domestic firms. Typically, these positive externalities areassociated with technology transfer, imitation of best practices, worker training and access to newmarkets, among other channels. Several pieces of evidence justify our choice to abstract from it inthe welfare calibration of our model.
Our data reveals that almost half of FIEs and more than half of PTES with foreign capital areowned by foreign investors from Hong Kong, Macao or Taiwan. Additionally, more than half ofFIEs and about a third of PTEs with foreign capital are joint ventures with a Chinese partner.These patterns provide strong evidence of “round tripping”, that is, the transfer of Chinese capitalto Hong Kong, Macau or Taiwan before being re-invested in foreign-invested and processing tradeenterprises as well as joint ventures. Thus, the scope for knowledge spillovers arising from thesetype of firms might be quite limited.
Perhaps more importantly, there is clear indication that there are other mechanisms in placebesides pure-exporter subsidies to attract technology-intensive firms to China. Laws and regu-lations such as the 2002 Provisions on Guiding Foreign Direct Investment for example, providepreferential treatment for foreign enterprises which are either technology-intensive or export allor the greater part of their production. As a result, foreign-investors seeking access to the Chi-nese market might choose to invest in R&D in order to qualify as technologically-intensive firms,whereas pure-exporters would tend to concentrate on labor-intensive activities with fewer incen-tives to adopt advanced technology. Table 9 presents the percentage of observations reporting apositive value of R&D in the NBS survey. Column 1 shows that the proportion of pure exportersreporting a positive level of expenditure in R&D is three times smaller than that among regularexporters. Similarly large differences in the share of firms reporting any R&D expenditure can alsobe identified in the matched data for all firm categories presented in Columns 2-5.
Table 9: Percentage of Observations Featuring Positive Expenditure in R&D
Manufacturing Survey Matched Data
Year All exporters FIEs PTEs Neither FIEs or PTEsin a FTZ outside a FTZ
Pure exporters 6.99 7.35 7.40 11.71 14.04Regular exporters 20.78 17.07 15.92 26.99 36.26
Finally, as discussed previously in Section 2, recall that pure-exporter subsidies are not onlytargeted to FIEs. Several laws and regulations governing private Chinese firms also provide pref-erential treatment for export-oriented firms. For instance, Chinese-owned firms located in a FTZalso benefit from a reduced corporate income tax of 10 percent if exporting more than 70 percentof their output.
41

China’s Pure Exporter Subsidies
By Fabrice Defever and Alejandro Riano
Laws and Regulations Favoring Pure Exporters
(Online Appendix - Not for Publication)
A Foreign-Invested Enterprises
Basic Regulations
Enforcement of the Provisions of the State Council on Encouraging Foreign Invest-ment, January 1, 1987, Official Reply (Cai Shui Wai Zi [118] 1987)“[A]n enterprise with foreign investment may not be recognized as export-oriented enterprises unlessthree conditions are simultaneously met. First, it must be an enterprise that produces products forexport. Second, its products are mainly for export and the annual value of exported products mustconstitute over 50 percent of its total production value in the same year. Third, foreign exchangeincome and expenses in the same year must be in balance or surplus.”Source and translation: Asian Legal Information Institute.http://www.asianlii.org/cn/legis/cen/laws/orotmofatsaotctpiteotpotscoefi1887
Circular of the Ministry of Foreign Trade and Economic Cooperation on Submis-sion of Import and Export Plans for Enterprises with Foreign Investment, October25, 2000(Wai Jing Mao Zi Tong Jin Han Zi [2000] No.768).“In order to ensure the continuity and stability of the production in foreign-invested enterprises[...] the authorities of foreign trade and economic co-operation shall formulate a complete planaccording to the business scopes, production scales and the ratio between domestic sale and exportin the contracts.”Source and translation: Asian Legal Information Institute.http://www.asianlii.org/cn/legis/cen/laws/cotmoftaecosoiaepfewfii20011453/
Corporate Income Tax Law of the People’s Republic of China, 30 June 1991, Ar-ticle 8.4.4 (GUO WU YUAN LING [85] 1991.6.30)“Where a newly established or expanded enterprise, in which a foreign investor makes reinvest-ment, fails to meet the standards of an export-oriented enterprise, or is no longer recognized as atechnologically advanced enterprise within three years after it goes into production or operation,the foreign investor shall pay back 60% of the tax refunded.”Source and translation: Kaisen Corporate Service Limited.http://www.by-cpa.com/html/news/20079/1058.html
Corporate Income Tax Law of the People’s Republic of China, 9 April 1991, BasicRegulations. 8.1 (ZHU XI LING [45] 1991.4.9)“The State shall, in accordance with its industrial policies, guide the orientation of foreign invest-ment and encourage the establishment of enterprises with foreign investment which adopt advancedtechnology and equipment and export all or the greater part of their production.”
42

Source and translation: Kaisen Corporate Service Limited.http://www.by-cpa.com/html/news/20079/1058.html
A.1 Corporate Income Tax
Corporate Income Tax Law of the People’s Republic of China, 30 June 1991, Article8.3.5 (GUO WU YUAN LING [85] 1991.6.30)“Export-oriented enterprises with foreign investment may, upon the expiration of the tax exemptionand reduction period as provided for in the Tax Law, enjoy a further 50% reduction in EnterpriseIncome Tax based on the rate stipulated by the Tax Law, if the value of their exported products ofthe year exceeds 70% of the total value of their products of the year. But for the Special EconomicZones and the Economic and Technological Development Zones and other export-oriented enter-prises where Enterprise Income Tax has already been reduced to 15% and the above requirementsare met, the Enterprise Income Tax shall be levied at 10%.”Source and translation: Kaisen Corporate Service Limited.http://www.by-cpa.com/html/news/20079/1058.html
A.2 Project types
A.2.1 1995 law relative to the Foreign investment project types:
“Regulations for Guiding the Direction of Foreign Investment” Approved by the StateCouncil on June 7, 1995, Article 11.“Restricted foreign investment projects (Group A) within the category provided in subparagraph1 of Article 6, may be deemed as permitted foreign investment projects, and not subject to therestriction of Article 9 of these provisions with approval, if the export sales of products amount toover 70 percent of the total sales of products.”Source and translation: Asian Legal Information Institute.http://www.asianlii.org/cn/legis/cen/laws/ipogfid604/
The Asian Legal Information Institute also provides the full list of restricted products. Thefirst 10 products listed (in order of appearance) are: Machinery, assemblage of movements of digitalwatches and finished watches, bikes, knitting machines, Electric appliances: washing machines,refrigerators, freezers, Tins.Source and translation: Asian Legal Information Institute.http://www.asianlii.org/cn/legis/cen/laws/ipogfid604/
A.2.2 Change of the 1995 law relative to the Foreign investment project types:
Regulations for Guiding the Direction of Foreign Investment, Approved by the StateCouncil on February 11, 2002“Article 9: [Encouraged projects] enjoy the preferential treatments according to the provisions ofthe relevant laws and administrative regulations[...]Article 10: The permitted projects with foreign investment of which the products are all directly ex-ported shall be regarded as the encouraged project with foreign investment; the restricted projectswith foreign investment of which the export sales accounts for more than 70% of their total amountof sales may be regarded as the permitted projects with foreign investment [...].”
43

Source and translation: Asian Legal Information Institute.http://www.asianlii.org/cn/legis/cen/laws/pogtoofi613/
General Administration of Customs and State Administration of Taxation on 4September 2002“Implementation procedures for the adjustment of polices applicable to the Permitted Categoryof Foreign Investment Projects that Directly Export all its Products (hereafter, the All-for-exportProject) as defined in the Foreign Investment Industrial Guidance Catalogue.
All equipment imported under an All-for-Export Project that is approved as of the implemen-tation date of the policy adjustment shall invariably be subject to the levy of import duty andimport-stage value-added tax in accordance with the regulations. [...] If exports are proven to betrue after the verification, 20% of paid taxes shall be refunded each year, i.e., all paid taxes shall berefunded within five years; and, if exports are proven to be untrue, the taxes paid in the relevantyear shall not be refunded and tax payments already refunded for the project shall be recoveredtogether with legally-prescribed penalties.”Source and translation: en8848.com.cn.http : //www.en8848.com.cn/e/DoPrint/?classid = 9687&id = 93235
B Processing Trade Enterprises
Hong Kong Trade Development Council (2003), ‘Guide to Doing Business in China’,Chapter on ‘Processing-Trade’“Domestic Sale of Materials, Parts and Finished Products Materials and parts imported in bondmust be re-exported after processing, and enterprises may not sell their bonded materials and partsor finished products in China. If such goods have to be sold on the domestic market for specialreasons, approval must be obtained from the commerce authorities in charge of processing tradeat provincial level as well as from Customs. Business enterprises and processing enterprises mustpromptly pay the tariffs and VAT exempted on the imported materials and parts if these goodsare sold domestically, whether the import settlement is in renminbi or in foreign currency. [...] Ifan enterprise is unable to submit the import licence issued by the relevant import administrationorgan, the commerce authorities in charge of processing trade at provincial level may still issuethe Domestic Sale Approval Certificate with Customs verifying and cancelling the processing tradehandbook after levying on the enterprise duties and interest thereon and a penalty ranging from30% to 100% of the declared value of the imported materials and parts.”Source: ‘Guide to Doing Business in China’, Chapter on ‘Import and Export Administration’, Sec-tion on ‘Processing-Trade’, ‘Domestic Sale of Materials, Parts and Finished Products’.http://www.hktdc.com/info/mi/bgcn/en/
Circular of the MOFTEC and the general administration of customs on relevantissues in imported equipment for processing trade, March 16, 1998 (Wai Jing MaoZheng Fa No.383).“Imports exempted from taxes and use of non-price setting equipment provided by foreign busi-nessmen must conform to one of the following conditions:- Having independent factories or workshops exclusively for processing trade (i.e, not producingproducts processed for home sale) and that the non-price setting equipment shall be used onlywithin the factories or workshops;
44

- For those processing trade enterprises which have no such factories or workshops and engage inprocessing trade based on their existing production capacity and use of non-price setting equipmentfor processing production, in the terms of their processing trade contract (agreement), over 70% oftheir yearly produced processing products must be exported.”Source and translation: Asian Legal Information Institute.http://www.asianlii.org/cn/legis/cen/laws/cotmatgaocoriiiefpt1177/
C Free Trade Zones
Corporate Income Tax Law of the People’s Republic of China, 16 September 1991,Article 5 (GUO SHUI HAN [663] 1991.9.16)“Income Tax shall be levied at the reduced tax rate of 10% if the output value of exported prod-ucts manufactured by development zones enterprises is over 70% of the total output value uponthe verification of the taxation authorities.”Source and translation: Kaisen Corporate Service Limited.http://www.by-cpa.com/html/news/20079/1058.html
Circular of the state council concerning the approval of the national developmentzones for New and High Technology Industries and the relevant policies and provi-sions, March 6, 1991.“Article 4 The income tax of development zone enterprises shall be levied at a reduced rate of 15percent from the date of their acknowledgement and determination.Article 5 When the output value of export of a development zone enterprise exceeds 70 percentof its total annual output value, the income tax shall be levied at a reduced rate of 10 percentafter being verified by the taxation authorities.” Source and translation: Asian Legal InformationInstitute.http://www.asianlii.org/cn/legis/cen/laws/cotscctaotndzfnahtiatrpap1530/
The ”Provisional Measures Governing the Processing Trade in Export ProcessingZones”, Chapter I General Provisions, November 22, 2005.Article 2: An export processing zone is a special area established upon the approval of the StateCouncil and supervised by the customs in a closed way.Article 3: “Processing trade in an export processing zone” shall refer to the production and busi-ness operation activities that the enterprises inside the zone purchase raw materials, parts andcomponents, elements, packing materials, etc. from the outside or inside the territory of China,and transport the finished products processed or assembled to outside the territory of China.Article 16: The goods carried between the enterprises in an export processing zone and the domes-tic enterprises outside the zone (including domestic sale of goods from the export processing zone),shall be handled in accordance with the relevant provisions on the import and export of goods. Ifthe import and export permit administration is involved, the relevant certificates must be providedto the administrative department. The leftover pieces, defective products and wasters caused bythe enterprises inside a zone during processing and production shall be treated in accordance withthe relevant provisions. Source and translation: Asian Legal Information Institute.http://www.asianlii.org/cn/legis/cen/laws/pmgtptiepz824/
45

CENTRE FOR ECONOMIC PERFORMANCE
Recent Discussion Papers
1181 Wenya Cheng
John Morrow
Kitjawat Tacharoen
Productivity As If Space Mattered: An
Application to Factor Markets Across China
1180 Yona Rubinstein
Dror Brenner
Pride and Prejudice: Using Ethnic-Sounding
Names and Inter-Ethnic Marriages to Identify
Labor Market Discrimination
1179 Martin Gaynor
Carol Propper
Stephan Seiler
Free to Choose? Reform and Demand
Response in the English National Health
Service
1178 Philippe Aghion
Antoine
Dechezleprêtre
David Hemous
Ralf Martin
John Van Reenen
Carbon Taxes, Path Dependency and Directed
Technical Change: Evidence from the Auto
Industry
1177 Tim Butcher
Richard Dickens
Alan Manning
Minimum Wages and Wage Inequality: Some
Theory and an Application to the UK
1176 Jan-Emmanuel De Neve
Andrew J. Oswald
Estimating the Influence of Life Satisfaction
and Positive Affect on Later Income Using
Sibling Fixed-Effects
1175 Rachel Berner Shalem
Francesca Cornaglia
Jan-Emmanuel De Neve
The Enduring Impact of Childhood on Mental
Health: Evidence Using Instrumented Co-
Twin Data
1174 Monika Mrázová
J. Peter Neary
Selection Effects with Heterogeneous Firms
1173 Nattavudh Powdthavee Resilience to Economic Shocks and the Long
Reach of Childhood Bullying
1172 Gianluca Benigno Huigang
Chen Christopher Otrok
Alessandro Rebucci
Eric R. Young
Optimal Policy for Macro-Financial Stability
1171 Ana Damas de Matos The Careers of Immigrants
1170 Bianca De Paoli
Pawel Zabczyk
Policy Design in a Model with Swings in
Risk Appetite
1169 Mirabelle Muûls Exporters, Importers and Credit Constraints

1168 Thomas Sampson Brain Drain or Brain Gain? Technology
Diffusion and Learning On-the-job
1167 Jérôme Adda Taxes, Cigarette Consumption, and Smoking
Intensity: Reply
1166 Jonathan Wadsworth Musn't Grumble. Immigration, Health and
Health Service Use in the UK and Germany
1165 Nattavudh Powdthavee
James Vernoit
The Transferable Scars: A Longitudinal
Evidence of Psychological Impact of Past
Parental Unemployment on Adolescents in
the United Kingdom
1164 Natalie Chen
Dennis Novy
On the Measurement of Trade Costs: Direct
vs. Indirect Approaches to Quantifying
Standards and Technical Regulations
1163 Jörn-Stephan Pischke
Hannes Schwandt
A Cautionary Note on Using Industry
Affiliation to Predict Income
1162 Cletus C. Coughlin
Dennis Novy
Is the International Border Effect Larger than
the Domestic Border Effect? Evidence from
U.S. Trade
1161 Gianluca Benigno
Luca Fornaro
Reserve Accumulation, Growth and Financial
Crises
1160 Gianluca Benigno
Huigang Chen
Christopher Otrok
Alessandro Rebucci
Eric R. Young
Capital Controls or Exchange Rate Policy? A
Pecuniary Externality Perspective
1159 Paul Dolan
Georgios Kavetsos
Happy Talk: Mode of Administration Effects
on Subjective Well-Being
1158 Alan Manning Steady-State Equilibrium in a Model of
Short-Term Wage-Posting
1157 Joan Costa-Font
Mireia Jofre-Bonet
Steven T. Yen
Not all Incentives Wash out the Warm Glow:
The Case of Blood Donation Revisited
1156 Christian Siegel Female Employment and Fertility - The
Effects of Rising Female Wages
1155 Albrecht Ritschl The German Transfer Problem, 1920-1933: A
Sovereign Debt Perspective
The Centre for Economic Performance Publications Unit
Tel 020 7955 7673 Fax 020 7955 7595
Email [email protected] Web site http://cep.lse.ac.uk