Embed Size (px)
Citation preview
CERAWEEK®2007
Technology Needs for a
Carbon-Constrained World
Jeff SterbaChairman, President, CEO
PNM Resources, Inc.
February 15, 2007
2
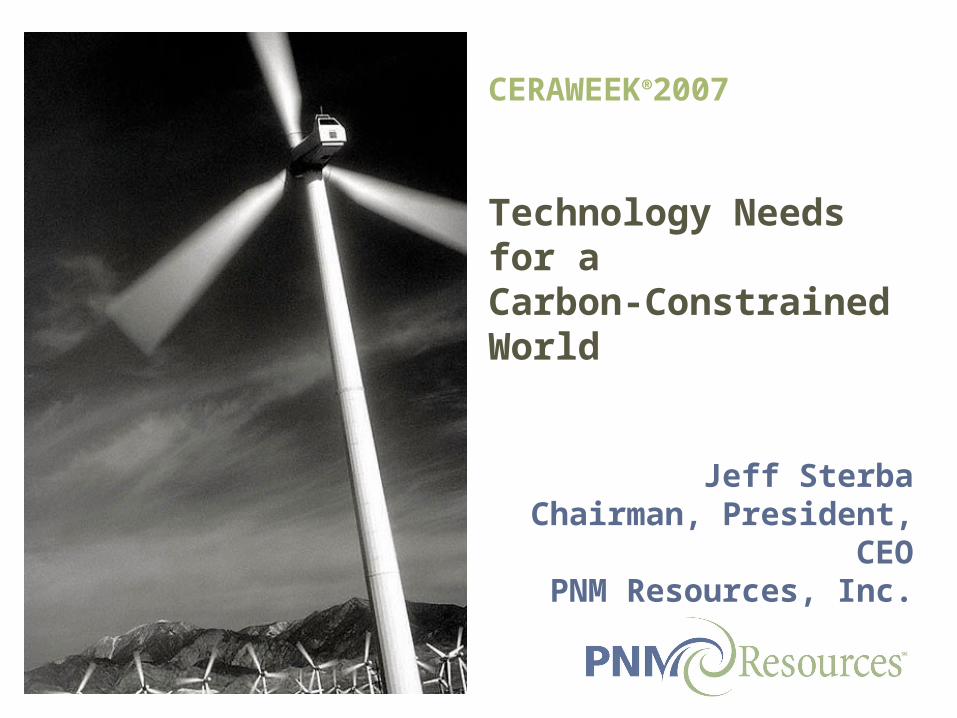
PNM Resources
3
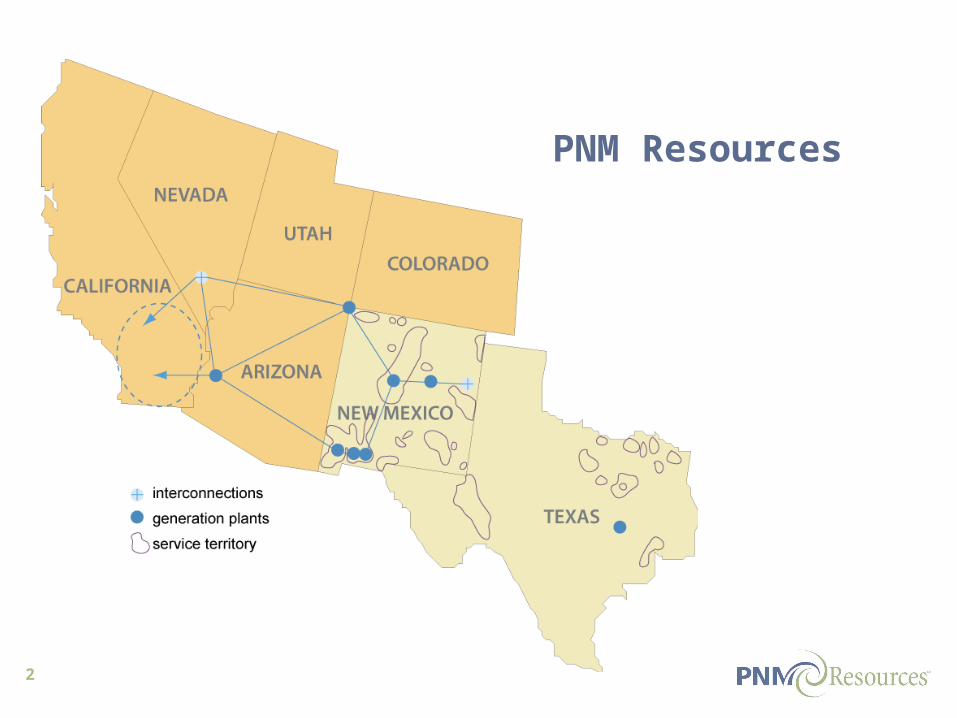
PNM Resources Generation Portfolio
MW
coal
nuclear
gas
wind
coal
nuclear
gas wind
49%
15%
28%
8%
68%25%
2%5%
MW as of June 2006, MWh generated during 2005
MWh
4
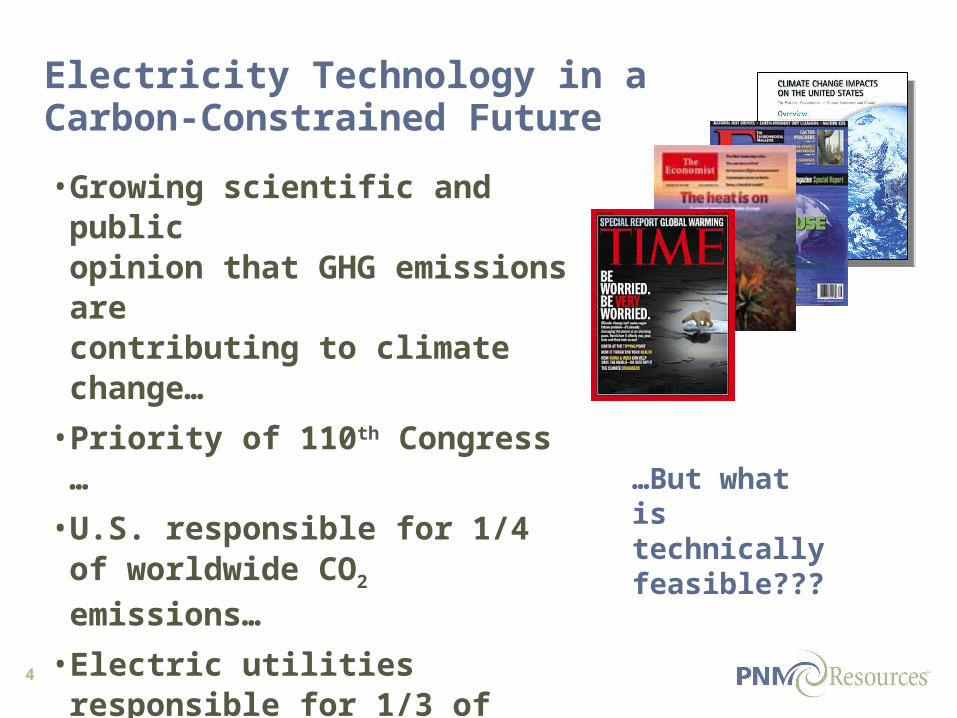
Electricity Technology in a Carbon-Constrained Future
…But what is technically feasible???
• Growing scientific and public opinion that GHG emissions are contributing to climate change…
• Priority of 110th Congress …
• U.S. responsible for 1/4 of worldwide CO2 emissions…
• Electric utilities responsible for 1/3 of U.S. CO2 emissions…
• Agreement that technology solutions are needed…

5
Comparative Costs 2010 to 2015
Source: EPRI 2007
6
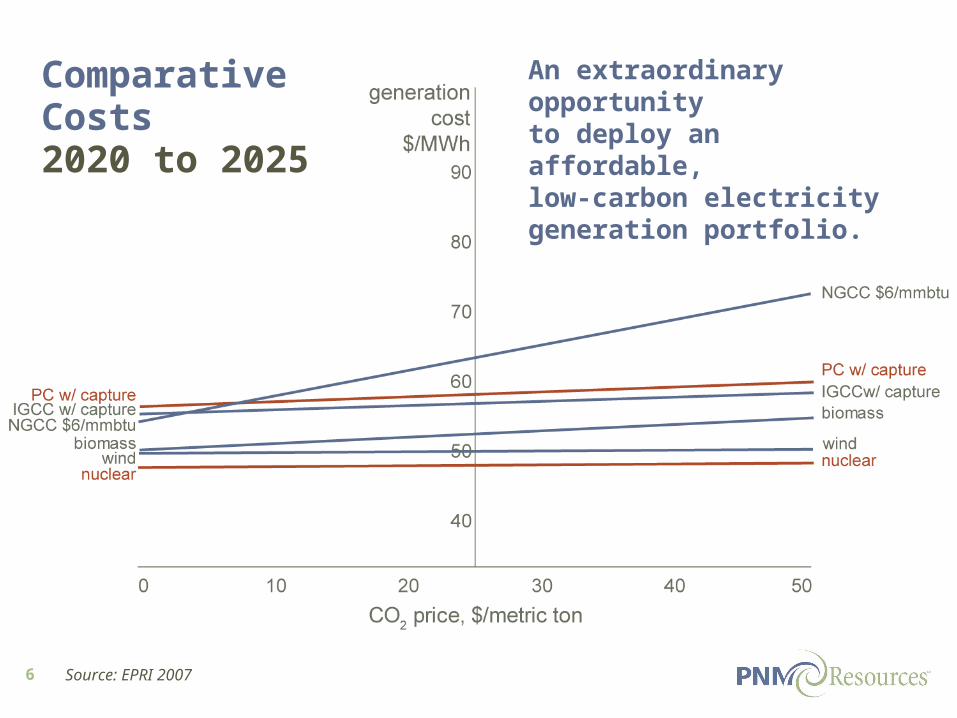
Comparative Costs 2020 to 2025
An extraordinary opportunity to deploy an affordable, low-carbon electricity generation portfolio.
Source: EPRI 2007
7
0
500
1000
1500
2000
2500
3000
3500
1990 1995 2000 2005 2010 2015 2020 2025 2030
U.S
. Ele
ctri
c S
ecto
rC
O2
Em
issi
on
s (m
illio
n m
etri
c to
ns)
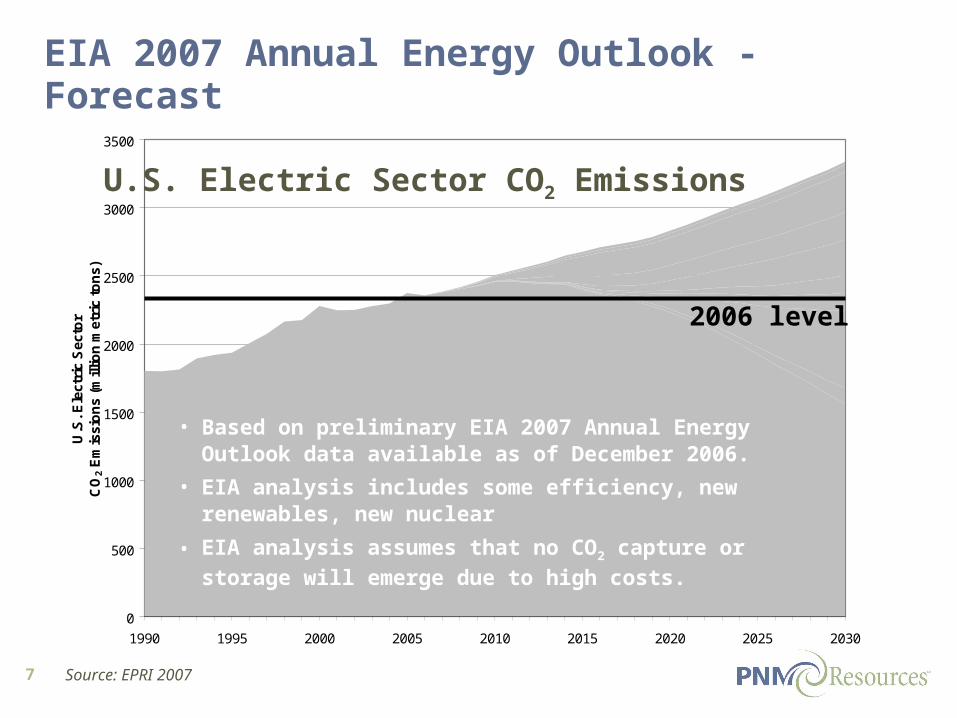
EIA 2007 Annual Energy Outlook - Forecast
U.S. Electric Sector CO2 Emissions
• Based on preliminary EIA 2007 Annual Energy Outlook data available as of December 2006.
• EIA analysis includes some efficiency, new renewables, new nuclear
• EIA analysis assumes that no CO2 capture or storage will
emerge due to high costs.
2006 level
Source: EPRI 2007
8
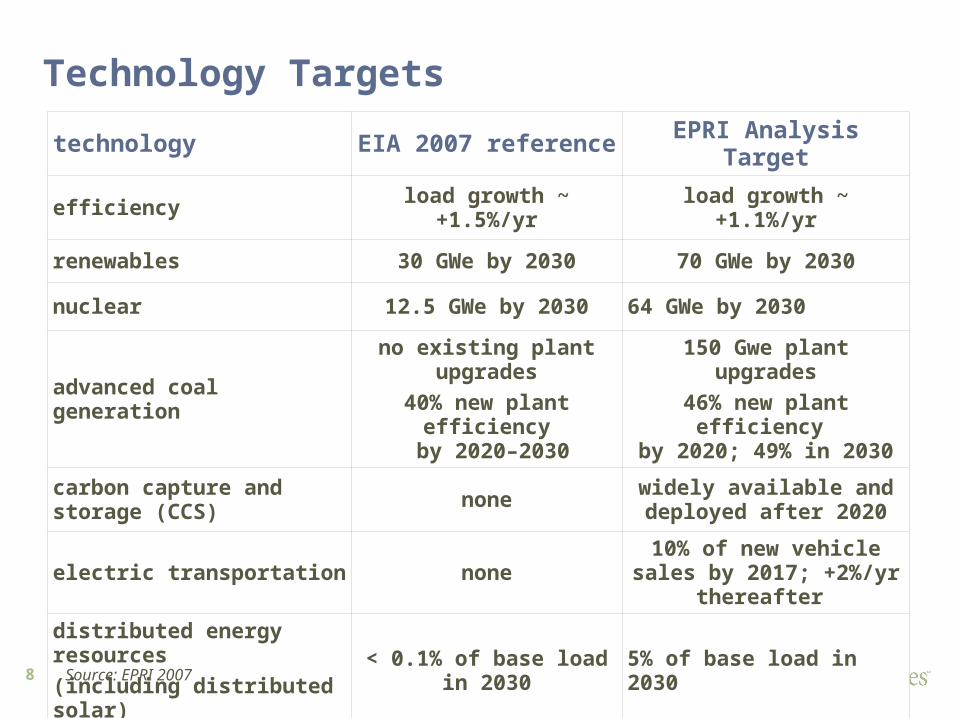
technology EIA 2007 reference EPRI Analysis Target
efficiency load growth ~ +1.5%/yr load growth ~ +1.1%/yr
renewables 30 GWe by 2030 70 GWe by 2030
nuclear 12.5 GWe by 2030 64 GWe by 2030
advanced coal generation
no existing plant upgrades
40% new plant efficiency by 2020–2030
150 Gwe plant upgrades
46% new plant efficiency by 2020; 49% in 2030
carbon capture and storage (CCS)
nonewidely available and deployed after 2020
electric transportation none10% of new vehicle sales
by 2017; +2%/yr thereafter
distributed energy resources
(including distributed solar)< 0.1% of base load in
20305% of base load in 2030
Source: EPRI 2007
Technology Targets
9
0
500
1000
1500
2000
2500
3000
3500
1990 1995 2000 2005 2010 2015 2020 2025 2030
U.S
. Ele
ctri
c S
ecto
rC
O2 E
mis
sio
ns
(mill
ion
met
ric
ton
s)
EIA Base Case 2007
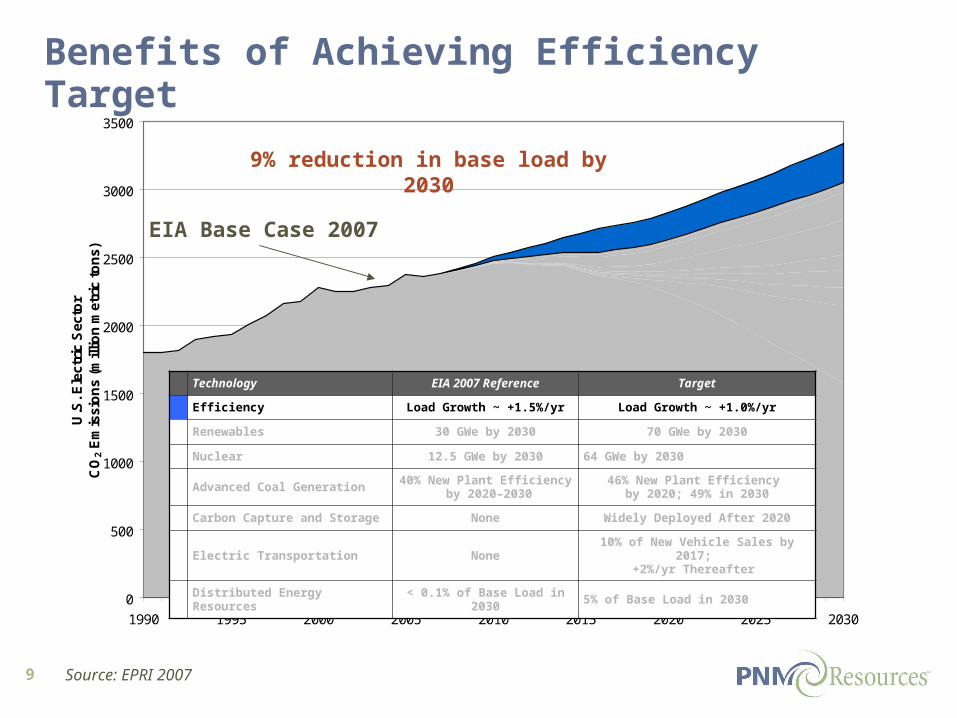
9% reduction in base load by 2030
Benefits of Achieving Efficiency Target
Technology EIA 2007 Reference Target
Efficiency Load Growth ~ +1.5%/yr Load Growth ~ +1.0%/yr
Renewables 30 GWe by 2030 70 GWe by 2030
Nuclear 12.5 GWe by 2030 64 GWe by 2030
Advanced Coal Generation40% New Plant Efficiency
by 2020–203046% New Plant Efficiency
by 2020; 49% in 2030
Carbon Capture and Storage None Widely Deployed After 2020
Electric Transportation None10% of New Vehicle Sales by 2017;
+2%/yr Thereafter
Distributed Energy Resources < 0.1% of Base Load in 2030 5% of Base Load in 2030
Source: EPRI 2007

10
0
500
1000
1500
2000
2500
3000
3500
1990 1995 2000 2005 2010 2015 2020 2025 2030
U.S
. E
lec
tric
Se
cto
rC
O2
Em
iss
ion
s (
mil
lio
n m
etr
ic t
on
s) EIA Base Case 2007
Benefits of Achieving Renewables Target
50 GWe new renewables by 2020; +2 GWe/yr thereafter
Technology EIA 2007 Reference Target
Efficiency Load Growth ~ +1.5%/yr Load Growth ~ +1.0%/yr
Renewables 30 GWe by 2030 70 GWe by 2030
Nuclear 12.5 GWe by 2030 64 GWe by 2030
Advanced Coal Generation40% New Plant Efficiency
by 2020–203046% New Plant Efficiency
by 2020; 49% in 2030
Carbon Capture and Storage None Widely Deployed After 2020
Electric Transportation None10% of New Vehicle Sales by 2017;
+2%/yr Thereafter
Distributed Energy Resources < 0.1% of Base Load in 2030 5% of Base Load in 2030
Source: EPRI 2007
11
0
500
1000
1500
2000
2500
3000
3500
1990 1995 2000 2005 2010 2015 2020 2025 2030
U.S
. Ele
ctri
c S
ecto
rC
O2 E
mis
sio
ns
(mill
ion
met
ric
ton
s)
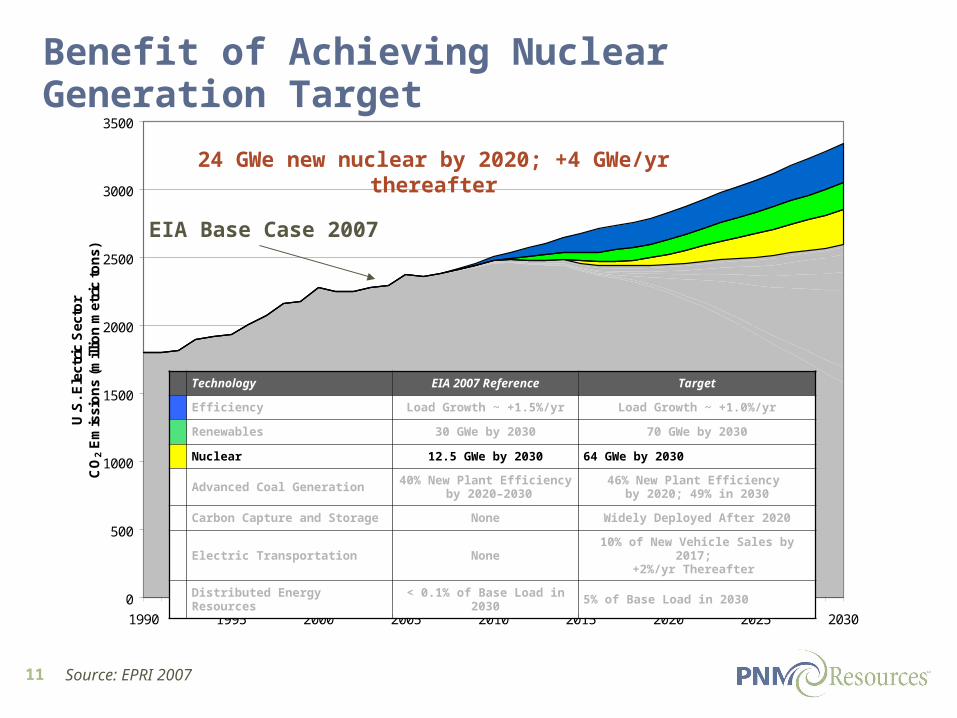
EIA Base Case 2007
Benefit of Achieving Nuclear Generation Target
24 GWe new nuclear by 2020; +4 GWe/yr thereafter
Technology EIA 2007 Reference Target
Efficiency Load Growth ~ +1.5%/yr Load Growth ~ +1.0%/yr
Renewables 30 GWe by 2030 70 GWe by 2030
Nuclear 12.5 GWe by 2030 64 GWe by 2030
Advanced Coal Generation40% New Plant Efficiency
by 2020–203046% New Plant Efficiency
by 2020; 49% in 2030
Carbon Capture and Storage None Widely Deployed After 2020
Electric Transportation None10% of New Vehicle Sales by 2017;
+2%/yr Thereafter
Distributed Energy Resources < 0.1% of Base Load in 2030 5% of Base Load in 2030
Source: EPRI 2007

12
0
500
1000
1500
2000
2500
3000
3500
1990 1995 2000 2005 2010 2015 2020 2025 2030
U.S
. Ele
ctri
c S
ecto
rC
O2 E
mis
sio
ns
(mill
ion
met
ric
ton
s)
EIA Base Case 2007
Benefit of Achieving Advanced Coal Target
46% efficiency by 2020, 49% efficiency by 2030
Technology EIA 2007 Reference Target
Efficiency Load Growth ~ +1.5%/yr Load Growth ~ +1.0%/yr
Renewables 30 GWe by 2030 70 GWe by 2030
Nuclear 12.5 GWe by 2030 64 GWe by 2030
Advanced Coal Generation40% New Plant Efficiency
by 2020–203046% New Plant Efficiency
by 2020; 49% in 2030
Carbon Capture and Storage None Widely Deployed After 2020
Electric Transportation None10% of New Vehicle Sales by 2017;
+2%/yr Thereafter
Distributed Energy Resources < 0.1% of Base Load in 2030 5% of Base Load in 2030
Source: EPRI 2007
13
0
500
1000
1500
2000
2500
3000
3500
1990 1995 2000 2005 2010 2015 2020 2025 2030
U.S
. Ele
ctri
c S
ecto
rC
O2 E
mis
sio
ns
(mill
ion
met
ric
ton
s)
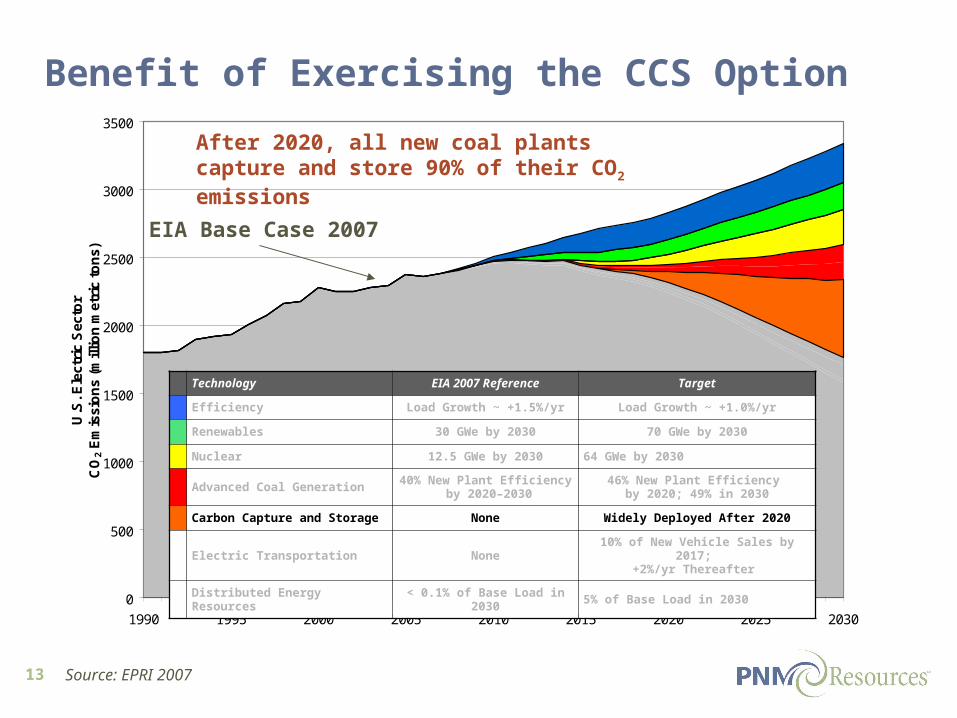
EIA Base Case 2007
Benefit of Exercising the CCS Option
After 2020, all new coal plants capture and store 90% of their CO2 emissions
Technology EIA 2007 Reference Target
Efficiency Load Growth ~ +1.5%/yr Load Growth ~ +1.0%/yr
Renewables 30 GWe by 2030 70 GWe by 2030
Nuclear 12.5 GWe by 2030 64 GWe by 2030
Advanced Coal Generation40% New Plant Efficiency
by 2020–203046% New Plant Efficiency
by 2020; 49% in 2030
Carbon Capture and Storage None Widely Deployed After 2020
Electric Transportation None10% of New Vehicle Sales by 2017;
+2%/yr Thereafter
Distributed Energy Resources < 0.1% of Base Load in 2030 5% of Base Load in 2030
Source: EPRI 2007
14
0
500
1000
1500
2000
2500
3000
3500
1990 1995 2000 2005 2010 2015 2020 2025 2030
U.S
. Ele
ctri
c S
ecto
rC
O2 E
mis
sio
ns
(mill
ion
met
ric
ton
s)
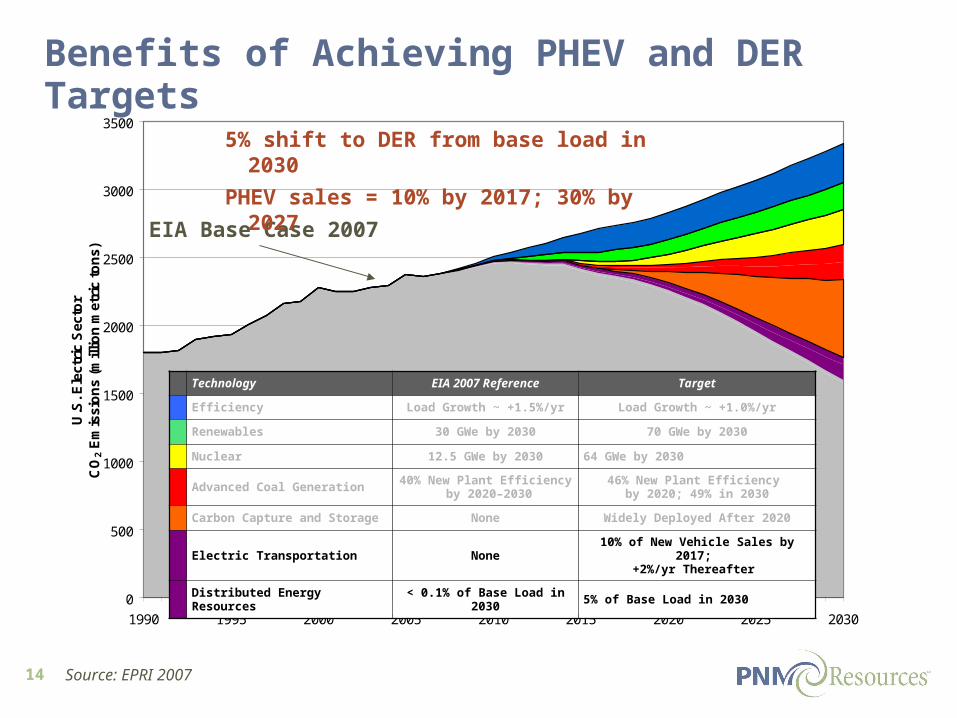
EIA Base Case 2007
Benefits of Achieving PHEV and DER Targets
5% shift to DER from base load in 2030
PHEV sales = 10% by 2017; 30% by 2027
Technology EIA 2007 Reference Target
Efficiency Load Growth ~ +1.5%/yr Load Growth ~ +1.0%/yr
Renewables 30 GWe by 2030 70 GWe by 2030
Nuclear 12.5 GWe by 2030 64 GWe by 2030
Advanced Coal Generation40% New Plant Efficiency
by 2020–203046% New Plant Efficiency
by 2020; 49% in 2030
Carbon Capture and Storage None Widely Deployed After 2020
Electric Transportation None10% of New Vehicle Sales by 2017;
+2%/yr Thereafter
Distributed Energy Resources < 0.1% of Base Load in 2030 5% of Base Load in 2030
Source: EPRI 2007

15
0
500
1000
1500
2000
2500
3000
3500
1990 1995 2000 2005 2010 2015 2020 2025 2030
U.S
. Ele
ctri
c S
ecto
rC
O2 E
mis
sio
ns
(mill
ion
met
ric
ton
s)CO2 Reductions…What’s Technically Feasible
Technology EIA 2007 Reference Target
Efficiency Load Growth ~ +1.5%/yr Load Growth ~ +1.0%/yr
Renewables 30 GWe by 2030 70 GWe by 2030
Nuclear 12.5 GWe by 2030 64 GWe by 2030
Advanced Coal Generation40% New Plant Efficiency
by 2020–203046% New Plant Efficiency
by 2020; 49% in 2030
Carbon Capture and Storage None Widely Deployed After 2020
Electric Transportation None10% of New Vehicle Sales by 2017;
+2%/yr Thereafter
Distributed Energy Resources < 0.1% of Base Load in 2030 5% of Base Load in 2030
2006 level
Source: EPRI 2007
EIA Base Case 2007
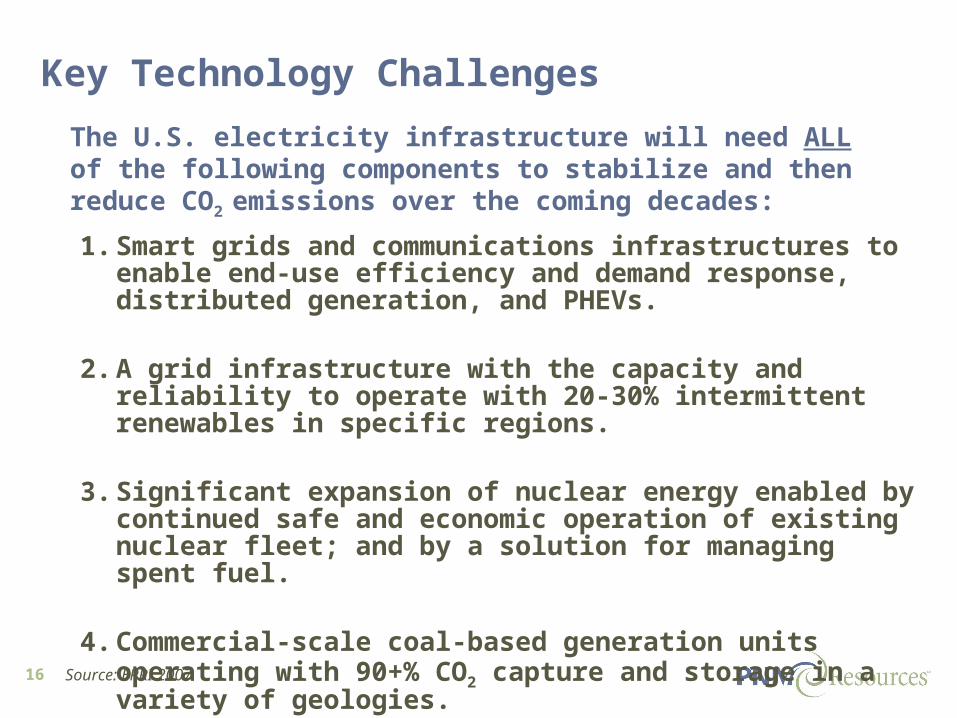
16 Source: EPRI 2007
The U.S. electricity infrastructure will need ALL of the following components to stabilize and then reduce CO2 emissions over the coming decades:
1. Smart grids and communications infrastructures to enable end-use efficiency and demand response, distributed generation, and PHEVs.
2. A grid infrastructure with the capacity and reliability to operate with 20-30% intermittent renewables in specific regions.
3. Significant expansion of nuclear energy enabled by continued safe and economic operation of existing nuclear fleet; and by a solution for managing spent fuel.
4. Commercial-scale coal-based generation units operating with 90+% CO2 capture and storage in a variety of geologies.
Key Technology Challenges
17
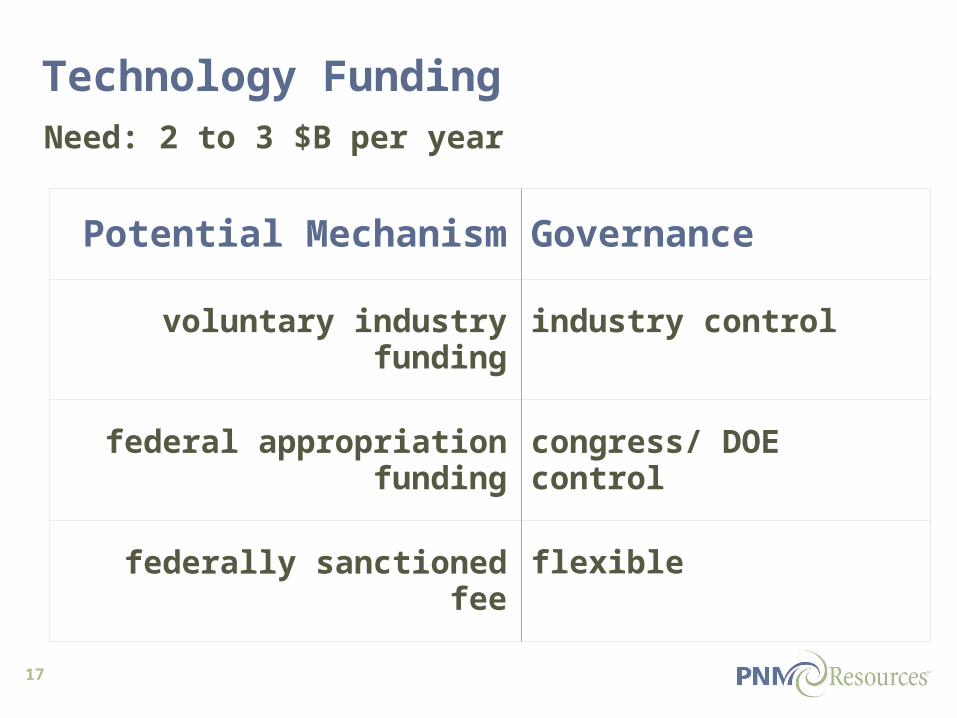
Technology Funding
Potential Mechanism Governance
voluntary industry funding industry control
federal appropriation funding congress/ DOE control
federally sanctioned fee flexible
Need: 2 to 3 $B per year