Embed Size (px)
Citation preview
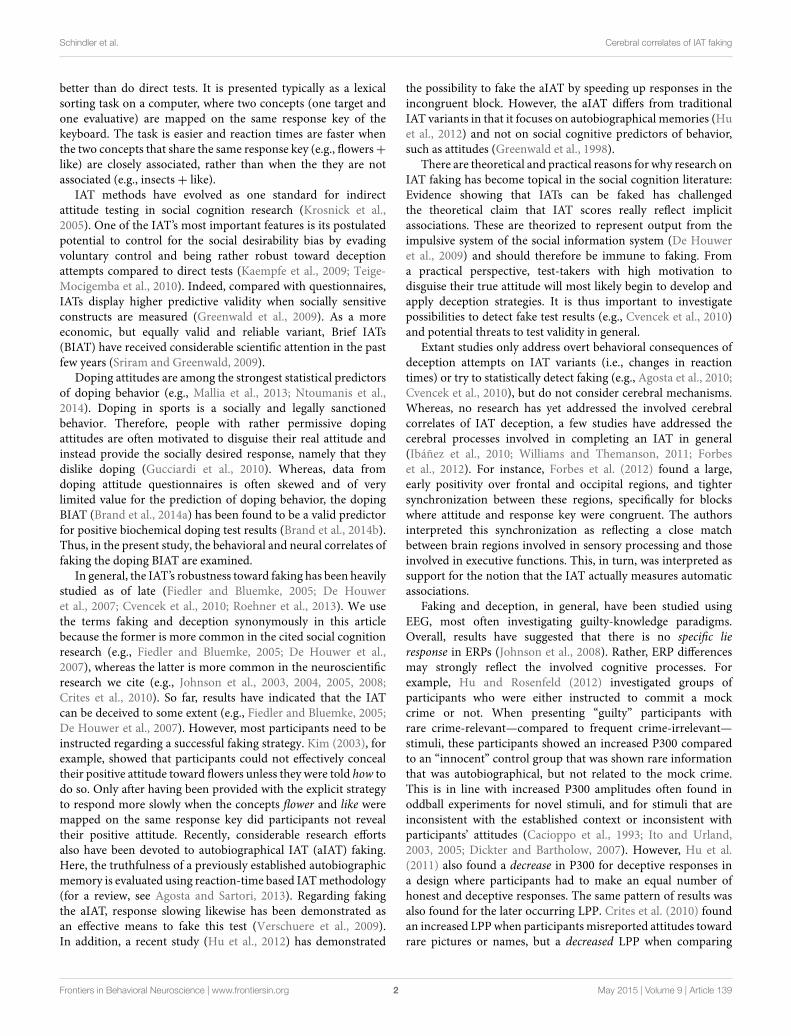
ORIGINAL RESEARCHpublished: 29 May 2015
doi: 10.3389/fnbeh.2015.00139
Frontiers in Behavioral Neuroscience | www.frontiersin.org 1 May 2015 | Volume 9 | Article 139
Edited by:
Christoph M. Michel,
University of Geneva, Switzerland
Reviewed by:
Xiaoqing Hu,
University of Texas, USA
J. Peter Rosenfeld,
Northwestern University, USA
*Correspondence:
Sebastian Schindler,
Department of Psychology, University
of Bielefeld, Universitätsstraße 25,
33501 Bielefeld, Germany
†These authors have contributed
equally to this work.
Received: 13 February 2015
Accepted: 12 May 2015
Published: 29 May 2015
Citation:
Schindler S, Wolff W, Kissler JM and
Brand R (2015) Cerebral correlates of
faking: evidence from a brief implicit
association test on doping attitudes.
Front. Behav. Neurosci. 9:139.
doi: 10.3389/fnbeh.2015.00139
Cerebral correlates of faking:evidence from a brief implicitassociation test on doping attitudes
Sebastian Schindler 1, 2*†, Wanja Wolff 3 †, Johanna M. Kissler 1, 2 and Ralf Brand 3
1 Affective Neuropsychology, Department of Psychology, University of Bielefeld, Bielefeld, Germany, 2Center of Excellence
Cognitive Interaction Technology, University of Bielefeld, Bielefeld, Germany, 3Division of Sport and Exercise Psychology,
University of Potsdam, Potsdam, Germany
Direct assessment of attitudes toward socially sensitive topics can be affected by
deception attempts. Reaction-time based indirect measures, such as the Implicit
Association Test (IAT), are less susceptible to such biases. Neuroscientific evidence
shows that deception can evoke characteristic ERP differences. However, the cerebral
processes involved in faking an IAT are still unknown. We randomly assigned 20
university students (15 females, 24.65 ± 3.50 years of age) to a counterbalanced
repeated-measurements design, requesting them to complete a Brief-IAT (BIAT) on
attitudes toward doping without deception instruction, and with the instruction to
fake positive and negative doping attitudes. Cerebral activity during BIAT completion
was assessed using high-density EEG. Event-related potentials during faking revealed
enhanced frontal and reduced occipital negativity, starting around 150ms after stimulus
presentation. Further, a decrease in the P300 and LPP components was observed.
Source analyses showed enhanced activity in the right inferior frontal gyrus between 150
and 200ms during faking, thought to reflect the suppression of automatic responses.
Further, more activity was found for faking in the bilateral middle occipital gyri and the
bilateral temporoparietal junction. Results indicate that faking reaction-time based tests
alter brain processes from early stages of processing and reveal the cortical sources of
the effects. Analyzing the EEG helps to uncover response patterns in indirect attitude
tests and broadens our understanding of the neural processes involved in such faking.
This knowledge might be useful for uncovering faking in socially sensitive contexts, where
attitudes are likely to be concealed.
Keywords: EEG/ERP, implicit association test (IAT), faking, deception, indirect tests, anti-doping, right inferior
frontal gyrus
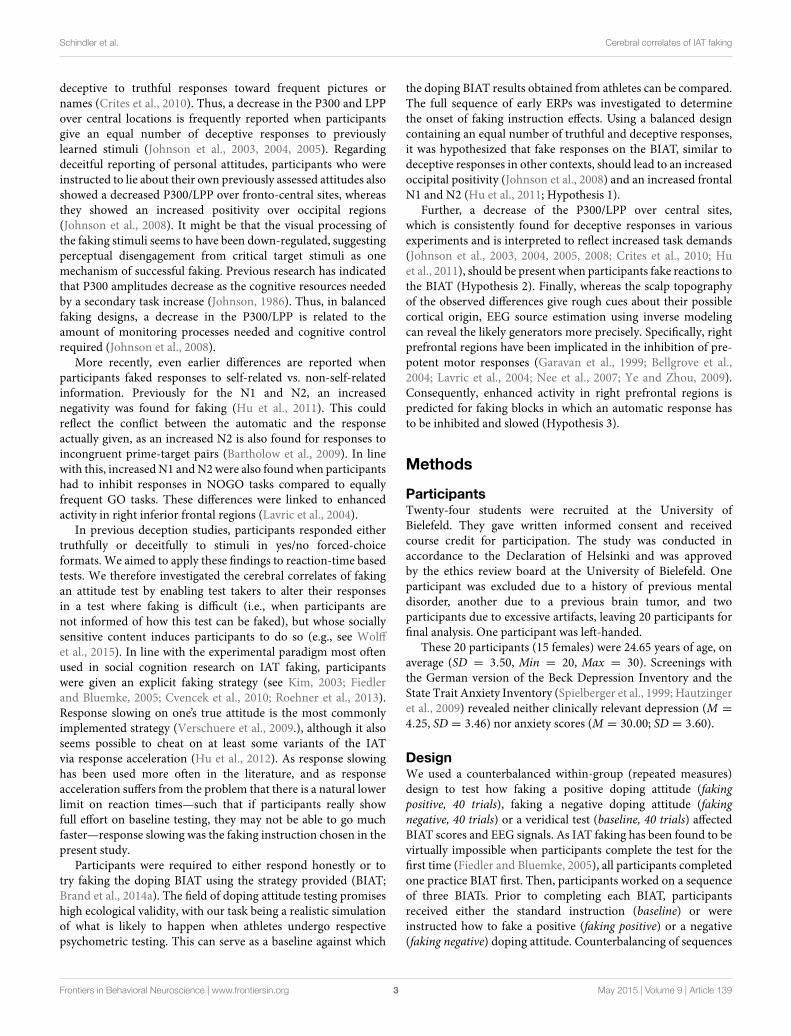
Introduction
Attitudes are among the strongest social cognitive predictors of human behavior (Kraus, 1995).Direct (i.e., self-report) assessment of socially sensitive attitudes can be distorted by socialdesirability bias (McDaniel et al., 2009) because the purpose of a given test often is easyto determine, and thus allows participants to deliberately choose and alter their responses(Roehner et al., 2011). The Implicit Association Test (IAT; Greenwald et al., 1998) constitutesa class of reaction-time based indirect tests that aim to hide the true goal of measurement
Schindler et al. Cerebral correlates of IAT faking
better than do direct tests. It is presented typically as a lexicalsorting task on a computer, where two concepts (one target andone evaluative) are mapped on the same response key of thekeyboard. The task is easier and reaction times are faster whenthe two concepts that share the same response key (e.g., flowers+like) are closely associated, rather than when the they are notassociated (e.g., insects+ like).
IAT methods have evolved as one standard for indirectattitude testing in social cognition research (Krosnick et al.,2005). One of the IAT’s most important features is its postulatedpotential to control for the social desirability bias by evadingvoluntary control and being rather robust toward deceptionattempts compared to direct tests (Kaempfe et al., 2009; Teige-Mocigemba et al., 2010). Indeed, compared with questionnaires,IATs display higher predictive validity when socially sensitiveconstructs are measured (Greenwald et al., 2009). As a moreeconomic, but equally valid and reliable variant, Brief IATs(BIAT) have received considerable scientific attention in the pastfew years (Sriram and Greenwald, 2009).
Doping attitudes are among the strongest statistical predictorsof doping behavior (e.g., Mallia et al., 2013; Ntoumanis et al.,2014). Doping in sports is a socially and legally sanctionedbehavior. Therefore, people with rather permissive dopingattitudes are often motivated to disguise their real attitude andinstead provide the socially desired response, namely that theydislike doping (Gucciardi et al., 2010). Whereas, data fromdoping attitude questionnaires is often skewed and of verylimited value for the prediction of doping behavior, the dopingBIAT (Brand et al., 2014a) has been found to be a valid predictorfor positive biochemical doping test results (Brand et al., 2014b).Thus, in the present study, the behavioral and neural correlates offaking the doping BIAT are examined.
In general, the IAT’s robustness toward faking has been heavilystudied as of late (Fiedler and Bluemke, 2005; De Houweret al., 2007; Cvencek et al., 2010; Roehner et al., 2013). We usethe terms faking and deception synonymously in this articlebecause the former is more common in the cited social cognitionresearch (e.g., Fiedler and Bluemke, 2005; De Houwer et al.,2007), whereas the latter is more common in the neuroscientificresearch we cite (e.g., Johnson et al., 2003, 2004, 2005, 2008;Crites et al., 2010). So far, results have indicated that the IATcan be deceived to some extent (e.g., Fiedler and Bluemke, 2005;De Houwer et al., 2007). However, most participants need to beinstructed regarding a successful faking strategy. Kim (2003), forexample, showed that participants could not effectively concealtheir positive attitude toward flowers unless they were told how todo so. Only after having been provided with the explicit strategyto respond more slowly when the concepts flower and like weremapped on the same response key did participants not revealtheir positive attitude. Recently, considerable research effortsalso have been devoted to autobiographical IAT (aIAT) faking.Here, the truthfulness of a previously established autobiographicmemory is evaluated using reaction-time based IATmethodology(for a review, see Agosta and Sartori, 2013). Regarding fakingthe aIAT, response slowing likewise has been demonstrated asan effective means to fake this test (Verschuere et al., 2009).In addition, a recent study (Hu et al., 2012) has demonstrated
the possibility to fake the aIAT by speeding up responses in theincongruent block. However, the aIAT differs from traditionalIAT variants in that it focuses on autobiographical memories (Huet al., 2012) and not on social cognitive predictors of behavior,such as attitudes (Greenwald et al., 1998).
There are theoretical and practical reasons for why research onIAT faking has become topical in the social cognition literature:Evidence showing that IATs can be faked has challengedthe theoretical claim that IAT scores really reflect implicitassociations. These are theorized to represent output from theimpulsive system of the social information system (De Houweret al., 2009) and should therefore be immune to faking. Froma practical perspective, test-takers with high motivation todisguise their true attitude will most likely begin to develop andapply deception strategies. It is thus important to investigatepossibilities to detect fake test results (e.g., Cvencek et al., 2010)and potential threats to test validity in general.
Extant studies only address overt behavioral consequences ofdeception attempts on IAT variants (i.e., changes in reactiontimes) or try to statistically detect faking (e.g., Agosta et al., 2010;Cvencek et al., 2010), but do not consider cerebral mechanisms.Whereas, no research has yet addressed the involved cerebralcorrelates of IAT deception, a few studies have addressed thecerebral processes involved in completing an IAT in general(Ibáñez et al., 2010; Williams and Themanson, 2011; Forbeset al., 2012). For instance, Forbes et al. (2012) found a large,early positivity over frontal and occipital regions, and tightersynchronization between these regions, specifically for blockswhere attitude and response key were congruent. The authorsinterpreted this synchronization as reflecting a close matchbetween brain regions involved in sensory processing and thoseinvolved in executive functions. This, in turn, was interpreted assupport for the notion that the IAT actually measures automaticassociations.
Faking and deception, in general, have been studied usingEEG, most often investigating guilty-knowledge paradigms.Overall, results have suggested that there is no specific lieresponse in ERPs (Johnson et al., 2008). Rather, ERP differencesmay strongly reflect the involved cognitive processes. Forexample, Hu and Rosenfeld (2012) investigated groups ofparticipants who were either instructed to commit a mockcrime or not. When presenting “guilty” participants withrare crime-relevant—compared to frequent crime-irrelevant—stimuli, these participants showed an increased P300 comparedto an “innocent” control group that was shown rare informationthat was autobiographical, but not related to the mock crime.This is in line with increased P300 amplitudes often found inoddball experiments for novel stimuli, and for stimuli that areinconsistent with the established context or inconsistent withparticipants’ attitudes (Cacioppo et al., 1993; Ito and Urland,2003, 2005; Dickter and Bartholow, 2007). However, Hu et al.(2011) also found a decrease in P300 for deceptive responses ina design where participants had to make an equal number ofhonest and deceptive responses. The same pattern of results wasalso found for the later occurring LPP. Crites et al. (2010) foundan increased LPPwhen participants misreported attitudes towardrare pictures or names, but a decreased LPP when comparing
Frontiers in Behavioral Neuroscience | www.frontiersin.org 2 May 2015 | Volume 9 | Article 139
Schindler et al. Cerebral correlates of IAT faking
deceptive to truthful responses toward frequent pictures ornames (Crites et al., 2010). Thus, a decrease in the P300 and LPPover central locations is frequently reported when participantsgive an equal number of deceptive responses to previouslylearned stimuli (Johnson et al., 2003, 2004, 2005). Regardingdeceitful reporting of personal attitudes, participants who wereinstructed to lie about their own previously assessed attitudes alsoshowed a decreased P300/LPP over fronto-central sites, whereasthey showed an increased positivity over occipital regions(Johnson et al., 2008). It might be that the visual processing ofthe faking stimuli seems to have been down-regulated, suggestingperceptual disengagement from critical target stimuli as onemechanism of successful faking. Previous research has indicatedthat P300 amplitudes decrease as the cognitive resources neededby a secondary task increase (Johnson, 1986). Thus, in balancedfaking designs, a decrease in the P300/LPP is related to theamount of monitoring processes needed and cognitive controlrequired (Johnson et al., 2008).
More recently, even earlier differences are reported whenparticipants faked responses to self-related vs. non-self-relatedinformation. Previously for the N1 and N2, an increasednegativity was found for faking (Hu et al., 2011). This couldreflect the conflict between the automatic and the responseactually given, as an increased N2 is also found for responses toincongruent prime-target pairs (Bartholow et al., 2009). In linewith this, increasedN1 andN2were also found when participantshad to inhibit responses in NOGO tasks compared to equallyfrequent GO tasks. These differences were linked to enhancedactivity in right inferior frontal regions (Lavric et al., 2004).
In previous deception studies, participants responded eithertruthfully or deceitfully to stimuli in yes/no forced-choiceformats. We aimed to apply these findings to reaction-time basedtests. We therefore investigated the cerebral correlates of fakingan attitude test by enabling test takers to alter their responsesin a test where faking is difficult (i.e., when participants arenot informed of how this test can be faked), but whose sociallysensitive content induces participants to do so (e.g., see Wolffet al., 2015). In line with the experimental paradigm most oftenused in social cognition research on IAT faking, participantswere given an explicit faking strategy (see Kim, 2003; Fiedlerand Bluemke, 2005; Cvencek et al., 2010; Roehner et al., 2013).Response slowing on one’s true attitude is the most commonlyimplemented strategy (Verschuere et al., 2009.), although it alsoseems possible to cheat on at least some variants of the IATvia response acceleration (Hu et al., 2012). As response slowinghas been used more often in the literature, and as responseacceleration suffers from the problem that there is a natural lowerlimit on reaction times—such that if participants really showfull effort on baseline testing, they may not be able to go muchfaster—response slowing was the faking instruction chosen in thepresent study.
Participants were required to either respond honestly or totry faking the doping BIAT using the strategy provided (BIAT;Brand et al., 2014a). The field of doping attitude testing promiseshigh ecological validity, with our task being a realistic simulationof what is likely to happen when athletes undergo respectivepsychometric testing. This can serve as a baseline against which
the doping BIAT results obtained from athletes can be compared.The full sequence of early ERPs was investigated to determinethe onset of faking instruction effects. Using a balanced designcontaining an equal number of truthful and deceptive responses,it was hypothesized that fake responses on the BIAT, similar todeceptive responses in other contexts, should lead to an increasedoccipital positivity (Johnson et al., 2008) and an increased frontalN1 and N2 (Hu et al., 2011; Hypothesis 1).
Further, a decrease of the P300/LPP over central sites,which is consistently found for deceptive responses in variousexperiments and is interpreted to reflect increased task demands(Johnson et al., 2003, 2004, 2005, 2008; Crites et al., 2010; Huet al., 2011), should be present when participants fake reactions tothe BIAT (Hypothesis 2). Finally, whereas the scalp topographyof the observed differences give rough cues about their possiblecortical origin, EEG source estimation using inverse modelingcan reveal the likely generators more precisely. Specifically, rightprefrontal regions have been implicated in the inhibition of pre-potent motor responses (Garavan et al., 1999; Bellgrove et al.,2004; Lavric et al., 2004; Nee et al., 2007; Ye and Zhou, 2009).Consequently, enhanced activity in right prefrontal regions ispredicted for faking blocks in which an automatic response hasto be inhibited and slowed (Hypothesis 3).
Methods
ParticipantsTwenty-four students were recruited at the University ofBielefeld. They gave written informed consent and receivedcourse credit for participation. The study was conducted inaccordance to the Declaration of Helsinki and was approvedby the ethics review board at the University of Bielefeld. Oneparticipant was excluded due to a history of previous mentaldisorder, another due to a previous brain tumor, and twoparticipants due to excessive artifacts, leaving 20 participants forfinal analysis. One participant was left-handed.
These 20 participants (15 females) were 24.65 years of age, onaverage (SD = 3.50, Min = 20, Max = 30). Screenings withthe German version of the Beck Depression Inventory and theState Trait Anxiety Inventory (Spielberger et al., 1999; Hautzingeret al., 2009) revealed neither clinically relevant depression (M =
4.25, SD = 3.46) nor anxiety scores (M = 30.00; SD = 3.60).
DesignWe used a counterbalanced within-group (repeated measures)design to test how faking a positive doping attitude (fakingpositive, 40 trials), faking a negative doping attitude (fakingnegative, 40 trials) or a veridical test (baseline, 40 trials) affectedBIAT scores and EEG signals. As IAT faking has been found to bevirtually impossible when participants complete the test for thefirst time (Fiedler and Bluemke, 2005), all participants completedone practice BIAT first. Then, participants worked on a sequenceof three BIATs. Prior to completing each BIAT, participantsreceived either the standard instruction (baseline) or wereinstructed how to fake a positive (faking positive) or a negative(faking negative) doping attitude. Counterbalancing of sequences
Frontiers in Behavioral Neuroscience | www.frontiersin.org 3 May 2015 | Volume 9 | Article 139
Schindler et al. Cerebral correlates of IAT faking
(instructions) resulted in six conditions that participants wererandomly assigned to (see Table 1).
The BIATDoping attitudes were assessed using a validated picture-baseddoping BIAT (Brand et al., 2014a). Our picture-based dopingBIAT used the standard BIAT setup (Sriram and Greenwald,2009). It required the combined classification of the two conceptcategories doping vs. health food, with the classification of the twoattribute categories like vs. dislike. The doping BIAT’s consists oftwo combined task blocks. In Block A, stimuli that belong to theconcept doping or the attribute like must be categorized usingthe “I” key. In block B, doping stimuli and stimuli belonging tothe attribute category dislike are mapped on the same responsekey, and must be categorized using the “I” key. As doping isconsistently mapped on the “I” key, it is the focal conceptbecause participants have to primarily attend to it (Sriram andGreenwald, 2009). Upon starting either combined task block,the complete stimulus set of the categories are shown on twointroductory screens to allow for participants’ familiarizationwith the stimuli (doping + like on one, doping + dislike on thenext screen.) The stimuli of the non-focal category health foodwere not shown. The task-relevant category labels (doping + like,or doping + dislike) remain visible at the top and bottom ofthe screen so that participants know at any time what stimuliare focal and have to be categorized using the “I” key. Thepicture stimuli representing each category were selected based onan evaluation of their associative strength with their respectivereference category (Brand et al., 2014a). The doping conceptwas represented by pictures of pills, ampoules, and syringes;the health food concept by apples, cereal, and vegetables; thelike attribute by positive emoticons; and the dislike attributeby negative emoticons. According to the notation of Sriramand Greenwald, this setup corresponds to a doping–dislike/like–(health food) BIAT (2009). The BIAT program file and all stimuliused are made fully available in Brand et al. (2014a).
Inquisit 3.0 software (www.millisecond.com) was usedto program the BIAT. The practice BIAT consisted ofa discrimination block (20 trials) where participants werefamiliarized with the BIAT procedure. Then, the socialexpectations compatible block (doping + dislike, 20 trials) waspresented, followed by the incompatible block (doping + like,
20 trials). The order of compatible and incompatible blockswas counterbalanced between participants to avoid positioningeffects. In the following + trials, the discrimination blockwas removed, and compatible and incompatible blocks wereexpanded to 40 trials each. Our + is therefore identical to theone described by Brand et al. (2014a), with the exception that(a) we expanded to 40 trials to get an adequate number of trialsper cell for ERP averaging, and (b) set the inter-trial intervalto 1000ms in order to avoid introducing artifacts into the EEGmeasure. D-scores are calculated according to the D4 algorithmsuch that negative scores represent a negative attitude towarddoping (Greenwald et al., 2003). In the D4 algorithm, reactiontimes above 10,000ms, and those of error trials, are deleted andare replaced by an error value (average reaction time of thisparticipant in all correct trials of the block plus 600ms; mereelimination of error trials would have a negative impact on thereliability of the test).
BIAT Faking InstructionIn the faking negative condition, participants were instructed tofake the subsequent BIAT in a way that would seem like theirattitude was strongly toward anti-doping. In line with previousdeception research, participants were provided with an explicitfaking strategy: For faking a positive attitude, participants wereinstructed to slow their responses when doping and dislike sharedthe same response key. In the faking negative condition, slowingof responses in the doping and like condition was described to bethe faking strategy.
EEG RecordingEEG signals were recorded from 128 BioSemi active electrodes(www.biosemi.com) with a sampling rate of 2048Hz. Duringrecording, Cz was used as a reference electrode. Biosemi usestwo separate electrodes as ground electrodes: First, a CommonMode Sense active electrode (CMS), and second, a Driven RightLeg passive electrode (DLR). Four additional electrodes (EOG)measured horizontal and vertical eye movement. These wereplaced at the outer canthi of the eyes and below the eyes.
Pre-processing and statistical analyses of source activity weredone using SPM8 for EEG (http://www.fil.ion.ucl.ac.uk/spm/).Although perhaps best known as a toolbox for the analysis offunctional magnetic resonance data, SPM provides a unitary
TABLE 1 | Research design.
t Counterbalanced sequence of experimental BIAT instructions Block discrimination Trials
1 Practice Practice Practice Practice Practice Practice Doping + Likea 20
Doping + Dislike 20
2 Faking Faking Faking Faking Baseline Baseline Doping + Like 40
negative negative positive positive Doping + Dislike 40
3 Faking Baseline Baseline Faking Faking Faking Doping + Like 40
Positive Negative Positive Negative Doping + Dislike 40
4 Baseline Faking Faking Baseline Faking Faking Doping + Like 40
Positive Negative Negative Positive Doping + Dislike 40
aWhether doping + like or doping + dislike was presented as the first block was counterbalanced in order to avoid order effects.
Frontiers in Behavioral Neuroscience | www.frontiersin.org 4 May 2015 | Volume 9 | Article 139
Schindler et al. Cerebral correlates of IAT faking
framework for the analysis of neuroscience data acquired withdifferent technologies, including EEG and MEG, using thesame rationale (Penny and Henson, 2007; Litvak et al., 2011).In a first step, data were offline re-referenced to whole-scalpaverage reference. That is, for each measured time, the averagevoltage across all measured electrodes is subtracted from eachelectrode, resulting in non-zero voltage measurements for all 128electrodes. To identify artifacts caused by saccades (horizontal,HEOG) or eye blinks (vertical, VEOG), virtual HEOG andVEOGchannels were created from the EOG electrodes. EEG signalsthat were highly correlated with HEOG or VEOG activity weresubtracted from the EEG (minimum correlation of 0.5). Datawere then down-sampled to 250Hz, and later band-pass filteredfrom 0.166 to 30Hz with a fifth-order Butterworth zero-phasefilter. Filtered data were segmented from 100ms before stimulusonset until 1000ms after stimulus presentation. 100ms beforestimulus onset were used for baseline correction. Automaticartifact detection was used to eliminate remaining artifactsdefined as trials exceeding a threshold of 150µV (see e.g., Küperet al., 2012; Cecchini et al., 2013; Kuipers and Thierry, 2013;Schindler et al., 2014). Data were then averaged using the robustaveraging algorithm of SPM8, excluding possible further artifacts.Robust averaging down-weights outliers for each channel andeachmeasured time, thereby preserving a higher number of trials.This is because artifacts are not supposed to distort the wholetrial, but most of the time corrupt only parts of the trial. Weused the recommended offset of the weighting function, whichpreserves approximately 95% of the data points drawn from arandomGaussian distribution (Litvak et al., 2011). Overall, 3.12%of all electrodes were interpolated, and 20.74% of all trials wererejected. From an initial 40 trials for each block (doping + likeand doping + dislike) within the three conditions (baseline,faking negative, faking positive), we were able to retain 31.7 trials,on average. Conditions did not differ with regard to number ofuseable trials F(2, 38) = 0.98, p = 0.38, partial η
2 = 0.05, andthere was no interaction between block and condition F(2, 38) =0.61, p = 0.55, partial η2 = 0.03.
Source reconstructions of the cortical generators of significantERP differences were calculated and statistically assessed withSPM8 for EEG (Friston et al., 2008; Lopez et al., 2013), followingrecommended procedures. First, a realistic boundary elementhead model (BEM) was derived from SPM’s template head modelbased on the standard brain from the Montreal NeurologicalInstitute (MNI brain). Electrode positions then were transformedto match the template head, which is thought to generatereasonable results even when individual subjects’ head differ fromthe template (Litvak et al., 2011). Average electrode positions, asprovided by BioSemi, were co-registered with the cortical meshtemplate for source reconstruction. Group inversion (Litvak andFriston, 2008) was computed and the multiple sparse priorsalgorithm implemented in SPM8 was applied. This methodallows activated sources to vary in the degree of activity, butrestricts the activated sources from being the same in all subjects(Litvak and Friston, 2008). This is thought to result in moreprecise source estimation than single-subject matrix inversion.For source reconstruction, frequency contents between 0.166 and30Hz were analyzed (Litvak et al., 2011). For each analyzed
time window, three-dimensional source reconstructions weregenerated as NIFTI images. These images were smoothed usingan 8mm full-width half-maximum kernel (voxel size = 2mm ×
2mm× 2mm).
BIAT AnalysesIn order to test whether faking instructions worked, a repeated-measures ANOVA (condition: baseline, faking negative, fakingpositive) was set-up to investigate main effects for the resultingD-scores. D-scores are already an aggregate measure of reactiontime differences between the doping + like (positive sign)and the doping + dislike block (negative sign). For significanteffects (p < 0.05), post-hoc comparisons were computed toinvestigate direction of differences. Effect sizes were calculatedfor all statistical tests (Cohen, 1988). For significant violationsof Mauchly’s Assumption of Sphericity, degrees of freedom werecorrected according to Greenhouse-Geisser.
EEG Data AnalysesEEG scalp data were analyzed with EMEGS (http://www.emegs.org/, Peyk et al., 2011). For statistical analyses, 2 (block: doping+like vs. doping + dislike) × 3 (condition: baseline, fakingnegative, faking positive) repeated measures ANOVAs were set-up to investigate interaction effects between block and conditionin time windows and electrode clusters of interest. We expectedinteraction effects because the ERPs for both blocks (doping +
like and doping + dislike) were thought to differ depending onthe given baseline (full effort) or faking instruction (negative vs.positive). For the faking positive condition, faking was expectedto alter responses in the doping + dislike block, whereas forfaking negative condition, faking was expected to alter responsesin the doping + like block. For significant interaction effects,post-hoc comparisons were computed between the two blocks toinvestigate the direction of mean differences.
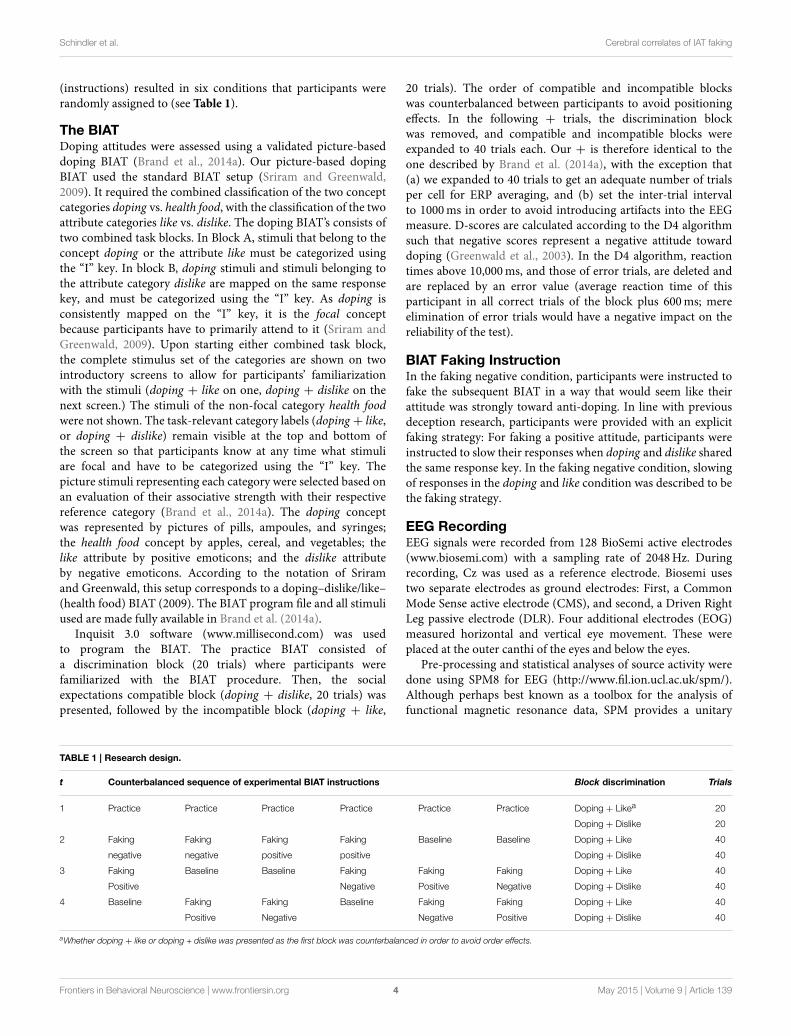
After identification of the ERP components, time windowswere segmented from 100 to 130 to investigate occipital P1 andfrontal N1 effects; from 150 to 200ms to investigate occipital N1and frontal P2 effects; from 200 to 300ms to investigate occipitalP2 and frontal N2 effects; and from 300 to 500ms and 500 to700ms to investigate P3/LPP effects. For the early time window(P1-N2), an occipital cluster (twenty-three electrodes: PO5, PO7,PO9h, PO9, PO3, POO3, O1, OI1, I1, POz, POOz, Oz, OIz,Iz, PO4, POO4, O2, OI2, I2, PO6, PO8, PO10h, PO10; see e.g.,Johnson et al., 2008), and also for the N1, P2/N2 time window, afrontal cluster was examined (twenty-one electrodes: AF7, AFF5,F3, Fp1, AFp3, AF3, AFF1, F1, Fpz, AFpz, AFz, AFFz, Fz, Fp2,AFp4, AF4, AFF2, F2, AF8, AFF6, F4; see e.g., Hu et al., 2011). Forthe P3/LPP time windows, a centro-parietal cluster was examined(thirty-four electrodes: FC3, C3, CP3, P3, FC3h, C3h, CP3h, P3h,FC1, C1, CP1, P1, FCC1h, CCP1h, FCz, Cz, CCPz, CPz, CPPz,Pz, FCC2h, CCp2h, FC2, C2, CP2, P2, FC4h, C4h, CP4h, P4h,FC4, C4, CP4, P4; see e.g., Johnson et al., 2005; Crites et al., 2010and see Figure 1).
Statistical tests for source estimations were calculated for thesame time windows as for the investigated scalp ERPs whensignificant scalp effects were found. In order to account for thenoisier estimations in source space, the two faking blocks of both
Frontiers in Behavioral Neuroscience | www.frontiersin.org 5 May 2015 | Volume 9 | Article 139
Schindler et al. Cerebral correlates of IAT faking
FIGURE 1 | Selected electrode clusters for all time windows.
faking conditions were compared to the baseline blocks using athreshold of p < 0.005 (Campo et al., 2013; Schindler et al., 2015)with a minimum of 25 significant voxels (Schindler et al., 2015;Sun et al., 2015). The identification of involved brain regions wasperformed using the AAL atlas (Tzourio-Mazoyer et al., 2002).
Results
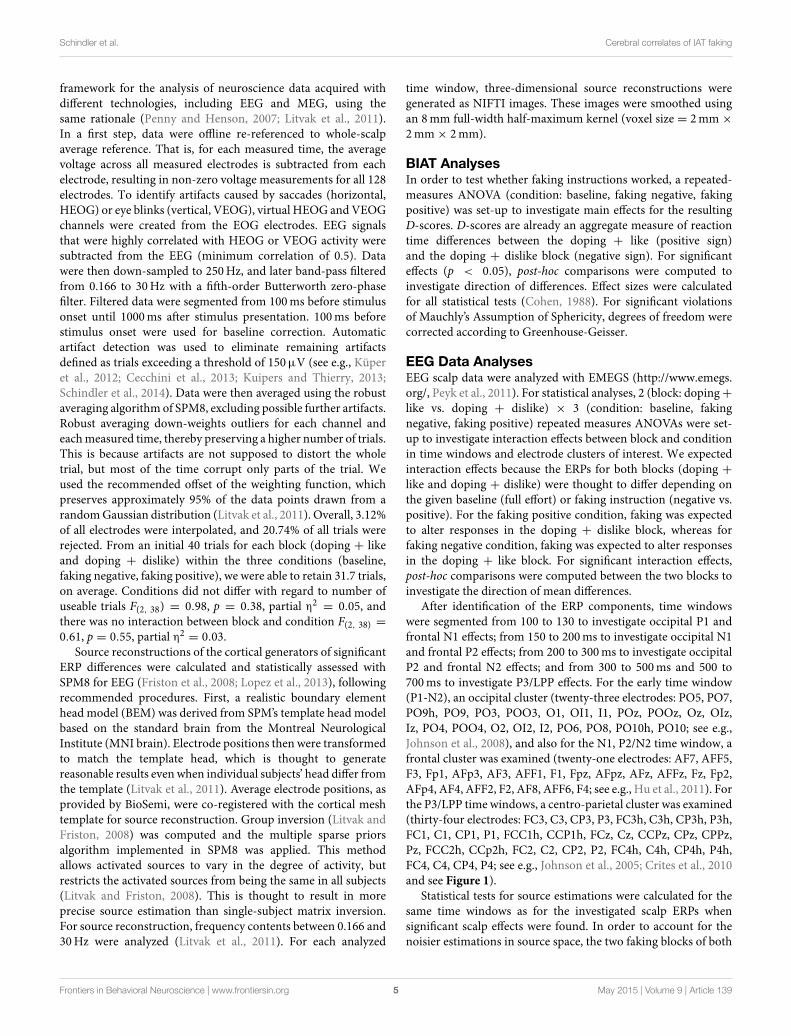
Effects of Faking Instruction on BIAT ScoresMean reaction times for each block in each condition aredisplayed in Figure 2. These raw reaction times show a slowingin the doping + dislike block for the faking positive conditionand in the doping + like block in the faking negative condition.Participants’ average doping attitudes in the baseline BIAT weresomewhat negative (D-score = −0.26, SD = 0.54) and differedfrom zero, t(19) = 2.14, p < 0.05, d = 0.98.
Repeated measures ANOVA showed a main effect ofcondition, F(2, 38) = 123.00, p < 0.001, partial η
2 = 0.87.Post-hoc comparisons showed that the D score in the fakingpositive condition (D-score = 1.27, p < 0.001,d = 2.43)was significantly larger than the baseline D-score (D-score =
−0.26), which, in turn, was significantly larger than the D-score in the faking negative condition (D-score = −0.99,p < 0.001,d = −2.23). This indicates that participants weresuccessful in behaviorally faking positive and negative dopingattitudes.
EEG ResultsIn the two faking conditions, participants were instructed toeither respond slower in blocks where like and doping sharedthe same key (faking negative), or where dislike and dopingshared the same key (faking positive). Figures 3, 5 show thepost-hoc comparisons within both faking conditions between the
FIGURE 2 | Mean reaction times for each block and condition. Error
bars represent standard deviations.
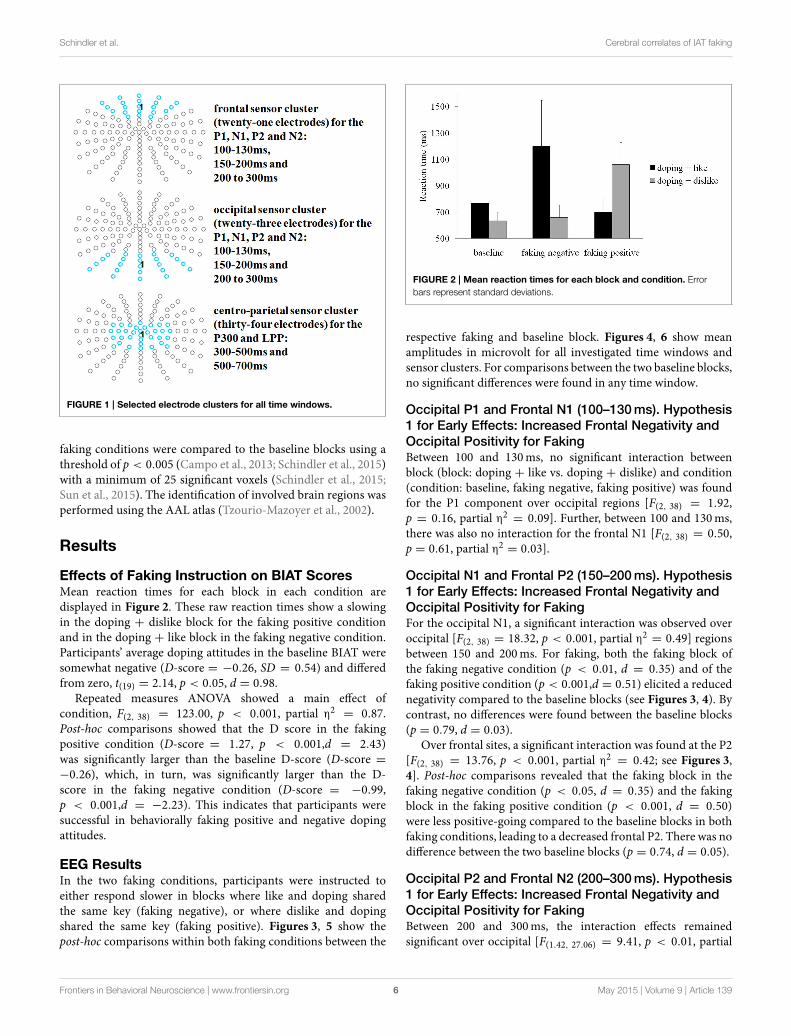
respective faking and baseline block. Figures 4, 6 show meanamplitudes in microvolt for all investigated time windows andsensor clusters. For comparisons between the two baseline blocks,no significant differences were found in any time window.
Occipital P1 and Frontal N1 (100–130ms). Hypothesis
1 for Early Effects: Increased Frontal Negativity and
Occipital Positivity for FakingBetween 100 and 130ms, no significant interaction betweenblock (block: doping + like vs. doping + dislike) and condition(condition: baseline, faking negative, faking positive) was foundfor the P1 component over occipital regions [F(2, 38) = 1.92,p = 0.16, partial η2 = 0.09]. Further, between 100 and 130ms,there was also no interaction for the frontal N1 [F(2, 38) = 0.50,p = 0.61, partial η2 = 0.03].
Occipital N1 and Frontal P2 (150–200ms). Hypothesis
1 for Early Effects: Increased Frontal Negativity and
Occipital Positivity for FakingFor the occipital N1, a significant interaction was observed overoccipital [F(2, 38) = 18.32, p < 0.001, partial η2 = 0.49] regionsbetween 150 and 200ms. For faking, both the faking block ofthe faking negative condition (p < 0.01, d = 0.35) and of thefaking positive condition (p < 0.001,d = 0.51) elicited a reducednegativity compared to the baseline blocks (see Figures 3, 4). Bycontrast, no differences were found between the baseline blocks(p = 0.79, d = 0.03).
Over frontal sites, a significant interaction was found at the P2[F(2, 38) = 13.76, p < 0.001, partial η
2 = 0.42; see Figures 3,4]. Post-hoc comparisons revealed that the faking block in thefaking negative condition (p < 0.05, d = 0.35) and the fakingblock in the faking positive condition (p < 0.001, d = 0.50)were less positive-going compared to the baseline blocks in bothfaking conditions, leading to a decreased frontal P2. There was nodifference between the two baseline blocks (p = 0.74, d = 0.05).
Occipital P2 and Frontal N2 (200–300ms). Hypothesis
1 for Early Effects: Increased Frontal Negativity and
Occipital Positivity for FakingBetween 200 and 300ms, the interaction effects remainedsignificant over occipital [F(1.42, 27.06) = 9.41, p < 0.01, partial
Frontiers in Behavioral Neuroscience | www.frontiersin.org 6 May 2015 | Volume 9 | Article 139

Schindler et al. Cerebral correlates of IAT faking
FIGURE 3 | Faking effects on the N1, P2, and N2 components.
(A) Difference topographies within the faking negative and the faking
positive condition: Blue color indicates more negativity and red color
indicates more positivity for the faking blocks (in italics). (B) Selected
electrodes F7, Fz, and F8 for the frontal electrode cluster and PO7,
Oz, and PO8 for the occipital electrode set, displaying the time
course over frontal and occipital sites. Within the faking condition, the
respective blocks where participants were instructed to delay their
responses are represented by straight lines, whereas baseline blocks
are illustrated by dotted lines.
η2 = 0.33] and frontal regions [F(1.53, 29.06) = 5.73, p < 0.05,
partial η2 = 0.23]. For the occipital cluster, post-hoc comparisonsshowed that the faking block of the faking positive condition(p < 0.01, d = 0.58) elicited a larger positivity compared to thebaseline block, leading to an increased P2, whereas no differences
occurred between baseline blocks (p = 0.31, d = 0.10) andfaking negative blocks (p = 0.15, d = 0.22).
Over frontal sites, the faking block of the faking positivecondition led to an increased N2 compared to the baseline block(p < 0.01, d = 0.57), but there were neither significant
Frontiers in Behavioral Neuroscience | www.frontiersin.org 7 May 2015 | Volume 9 | Article 139
Schindler et al. Cerebral correlates of IAT faking
FIGURE 4 | Mean amplitudes in microvolt for early effects over frontal and occipital sensor clusters. Error bars represent ±1 standard error of the mean
(SEM).
differences between baseline blocks (p = 0.32, d = 0.13) norbetween the two faking negative blocks (p = 0.31, d = 0.20).
P300 and LPP (300–700ms). Hypothesis 2 for Late
Effects: Decreased Centro-Parietal Positivity for
FakingBetween 300 and 500ms, a significant interaction was found overcentro-parietal sites [F(1.54, 29.32) = 6.84, p < 0.01, partialη2 = 0.27; see Figures 5, 6]. For both faking blocks of the
faking negative condition (p < 0.01, d = 0.53) and of thefaking positive condition (p < 0.05, d = 0.32), decreasedP300 components were found compared to the baseline blocks.No significant differences were observed between baseline blocks(p = 0.90, d = 0.01).
In the last time window between 500 and 700ms, asignificant interaction was again observed over centro-parietalsites [F(2, 38) = 11.26, p < 0.001, partial η
2 = 0.37]. Again,compared to the baseline blocks, decreased amplitudes werefound for both faking blocks of the faking negative condition(p < 0.001, d = 0.68) and of the faking positive condition(p < 0.05, d = 0.36), whereas no significant differences werefound between baseline blocks (p = 0.38, d = 0.13).
Source Analyses. Hypothesis 3: IncreasedRight-Inferior Frontal Activity for FakingFor time windows where differences in signal space had beenfound, source analyses were conducted to examine the differences
in source activity between baseline and faking blocks. Table 2provides detailed results.
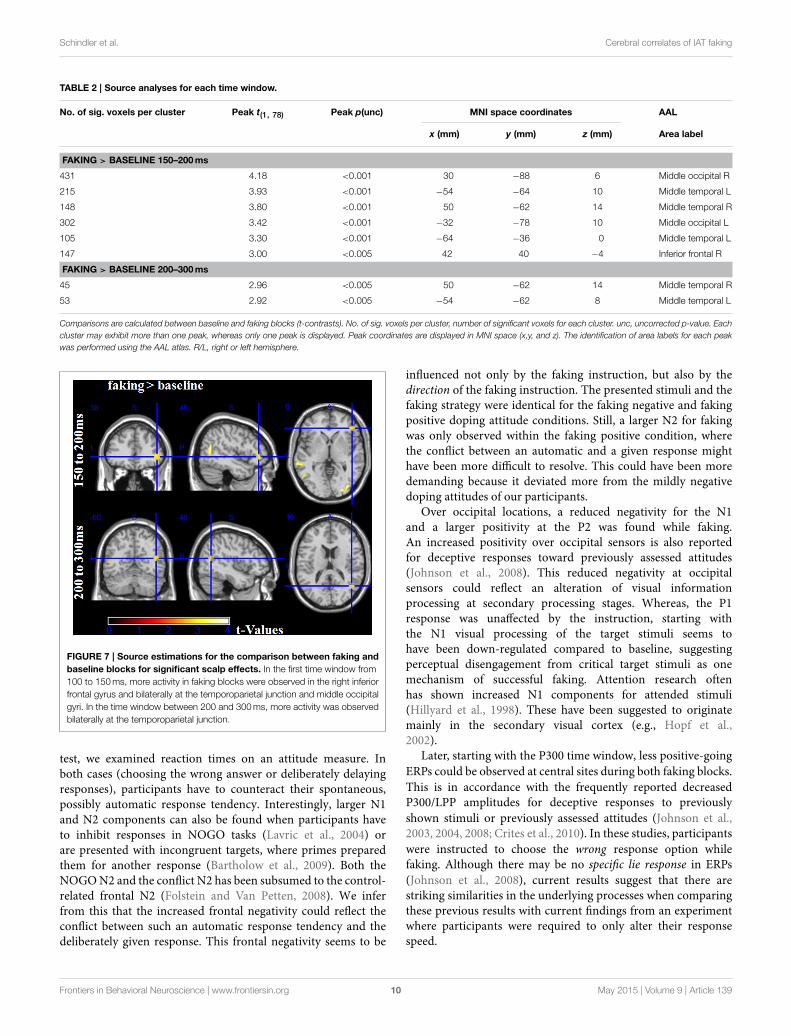
For the first time window between 150 and 200ms, the fakingblocks led to an enhanced activity in the right inferior frontalgyrus (largest peak [t(1, 78) = 3.00, p < 0.005]), bilaterallyin the middle occipital gyri (largest peak right [t(1, 78) = 4.18,p < 0.001]), and bilaterally in the temporoparietal junction(TPJ, largest peak left [t(1, 78) = 3.93, p < 0.001], seeFigure 7). Importantly, there was no significantly large activityin source space for baseline blocks compared to faking blocks,even using an extremely liberal threshold (uncorrected p <
0.05).Between 200 and 300ms, in faking blocks, again, enhanced
activity could be observed in the bilateral TPJ (largest peak[t(1, 78) = 2.96, p < 0.005]). For the later time windows, nosignificant differences were found for any comparison, whichmay be partly explained by noisier estimations due to the longertime windows and by a potentially more complex generatorstructure.
Discussion
We experimentally instructed participants to fake positivedoping attitudes or fake negative doping attitudes, or torespond truthfully to a doping BIAT. Participants weregiven a faking strategy and thus could successfully fake
Frontiers in Behavioral Neuroscience | www.frontiersin.org 8 May 2015 | Volume 9 | Article 139

Schindler et al. Cerebral correlates of IAT faking
FIGURE 5 | Faking effects on the P300 and LPP components. (A)
Difference topographies within the faking negative and the faking positive
condition: Blue color indicates more negativity and red color indicates more
positivity for the faking blocks (in italics). (B) Selected electrodes Cz and CPz
for the centro-parietal electrode cluster displaying the time course over
central sites. Within the faking condition, the respective blocks where
participants were instructed to delay their responses are represented by
straight lines, whereas baseline blocks are illustrated by dotted lines.
FIGURE 6 | Mean amplitudes in microvolt for late effects over the centro-parietal sensor cluster. Error bars represent ±1 standard error of the mean (SEM).
doping attitude measurements in both directions. Descriptively,behavioral (IAT D-scores) and neuroscientific results (EEGdata) suggest that faking a positive doping attitude was moreeffortful. This may be due to the already somewhat negativedoping attitude participants exhibited in the baseline condition(D-score= −0.26).
Investigating the cerebral processing in all conditions, wefound large ERP differences for faking. For the earliest
investigated components—the occipital P1 and frontal N1—no faking effects were observed, suggesting no differencesbetween the conditions in initial sensory processing. However,as expected, a more negative-going potential was observed forfaking, starting at the P2. This negative-going frontal ERP forfaking is in line with previous findings of a larger frontalN1 and N2 when lying (Hu et al., 2011). Whereas, Hu et al.(2011) investigated deceptive responses in a yes–no forced choice
Frontiers in Behavioral Neuroscience | www.frontiersin.org 9 May 2015 | Volume 9 | Article 139
Schindler et al. Cerebral correlates of IAT faking
TABLE 2 | Source analyses for each time window.
No. of sig. voxels per cluster Peak t(1, 78) Peak p(unc) MNI space coordinates AAL
x (mm) y (mm) z (mm) Area label
FAKING > BASELINE 150–200ms
431 4.18 <0.001 30 −88 6 Middle occipital R
215 3.93 <0.001 −54 −64 10 Middle temporal L
148 3.80 <0.001 50 −62 14 Middle temporal R
302 3.42 <0.001 −32 −78 10 Middle occipital L
105 3.30 <0.001 −64 −36 0 Middle temporal L
147 3.00 <0.005 42 40 −4 Inferior frontal R
FAKING > BASELINE 200–300ms
45 2.96 <0.005 50 −62 14 Middle temporal R
53 2.92 <0.005 −54 −62 8 Middle temporal L
Comparisons are calculated between baseline and faking blocks (t-contrasts). No. of sig. voxels per cluster, number of significant voxels for each cluster. unc, uncorrected p-value. Each
cluster may exhibit more than one peak, whereas only one peak is displayed. Peak coordinates are displayed in MNI space (x,y, and z). The identification of area labels for each peak
was performed using the AAL atlas. R/L, right or left hemisphere.
FIGURE 7 | Source estimations for the comparison between faking and
baseline blocks for significant scalp effects. In the first time window from
100 to 150ms, more activity in faking blocks were observed in the right inferior
frontal gyrus and bilaterally at the temporoparietal junction and middle occipital
gyri. In the time window between 200 and 300ms, more activity was observed
bilaterally at the temporoparietal junction.
test, we examined reaction times on an attitude measure. Inboth cases (choosing the wrong answer or deliberately delayingresponses), participants have to counteract their spontaneous,possibly automatic response tendency. Interestingly, larger N1and N2 components can also be found when participants haveto inhibit responses in NOGO tasks (Lavric et al., 2004) orare presented with incongruent targets, where primes preparedthem for another response (Bartholow et al., 2009). Both theNOGON2 and the conflict N2 has been subsumed to the control-related frontal N2 (Folstein and Van Petten, 2008). We inferfrom this that the increased frontal negativity could reflect theconflict between such an automatic response tendency and thedeliberately given response. This frontal negativity seems to be
influenced not only by the faking instruction, but also by thedirection of the faking instruction. The presented stimuli and thefaking strategy were identical for the faking negative and fakingpositive doping attitude conditions. Still, a larger N2 for fakingwas only observed within the faking positive condition, wherethe conflict between an automatic and a given response mighthave been more difficult to resolve. This could have been moredemanding because it deviated more from the mildly negativedoping attitudes of our participants.
Over occipital locations, a reduced negativity for the N1and a larger positivity at the P2 was found while faking.An increased positivity over occipital sensors is also reportedfor deceptive responses toward previously assessed attitudes(Johnson et al., 2008). This reduced negativity at occipitalsensors could reflect an alteration of visual informationprocessing at secondary processing stages. Whereas, the P1response was unaffected by the instruction, starting withthe N1 visual processing of the target stimuli seems tohave been down-regulated compared to baseline, suggestingperceptual disengagement from critical target stimuli as onemechanism of successful faking. Attention research oftenhas shown increased N1 components for attended stimuli(Hillyard et al., 1998). These have been suggested to originatemainly in the secondary visual cortex (e.g., Hopf et al.,2002).
Later, starting with the P300 time window, less positive-going
ERPs could be observed at central sites during both faking blocks.
This is in accordance with the frequently reported decreasedP300/LPP amplitudes for deceptive responses to previously
shown stimuli or previously assessed attitudes (Johnson et al.,2003, 2004, 2008; Crites et al., 2010). In these studies, participants
were instructed to choose the wrong response option whilefaking. Although there may be no specific lie response in ERPs
(Johnson et al., 2008), current results suggest that there arestriking similarities in the underlying processes when comparingthese previous results with current findings from an experimentwhere participants were required to only alter their responsespeed.
Frontiers in Behavioral Neuroscience | www.frontiersin.org 10 May 2015 | Volume 9 | Article 139
Schindler et al. Cerebral correlates of IAT faking
Further, source analyses revealed that deception led to alarger activity in the right inferior frontal gyrus and, althoughnot specifically hypothesized, bilaterally in the temporoparietaljunction (TPJ) and the bilateral middle occipital gyri at earliermeasured times. Previous research has shown that the rightinferior frontal gyrus is important for the processing of attitudes(Wood et al., 2005; Johnson et al., 2011), but also for memoryinhibition (Wimber et al., 2008) and inhibition of automaticresponses (Garavan et al., 1999; Bellgrove et al., 2004; Nee et al.,2007; Ye and Zhou, 2009). Thus, the enhanced activity in fakingblocks appears to reflect the inhibition of the automatic responseto the presented stimulus. This inhibitionmight closely be relatedto response inhibition, for example, for memory inhibition, anincreased late positivity over right frontal regions has been found(Hanslmayr et al., 2009). This response-related inhibition isfurther supported by similar source estimation results from anexperiment using equally frequent GO and NOGO trials (Lavricet al., 2004). For NOGO trials where participants had to inhibita response, larger source activity was found in right prefrontalareas in the N2 time window (220–320; Lavric et al., 2004). Inthis time window, response inhibition and conflict monitoringare discussed in the ERP literature (Lavric et al., 2004; Folsteinand Van Petten, 2008; Bartholow et al., 2009). The combinationof findings in scalp and source space therefore suggests aninhibitory account. We suppose that participants indeed haddifficulties to overcome their pre-potent motor response whendelaying their responses. Moreover, this initial right IFG activitymay initialize the monitoring process that leads to reduced P3and LPP components.
Also, while faking, participants showed more activity in theTPJ between 150 and 300ms. Interestingly, this region has beenpreviously shown to be more active when participants fakeresponses (Ganis et al., 2011). But as this region is also relevantfor attention (Pessoa et al., 2009) and intentional actions (Saxeet al., 2004; den Ouden et al., 2005), its enhanced activity couldalso reflect the monitoring of the planned response, namely, toinhibit the automatic response toward the target stimulus.
Summarizing the results, subsequent deception can alreadybe observed, starting with the frontal P2 and occipital N1,extending into the frontal N2 and occipital P2 and the centro-parietal P300/LPP. One could argue that the slowing of responsessimply reduced ERP amplitudes throughout all time windows.However, the pattern of results in scalp and source space for theearly components seem to be very similar to response inhibitionfindings (Lavric et al., 2004), whereas slower response behaviorin the absence of inhibition requirements has been found toaffect mostly the P300 (Wascher et al., 1996). In support of thisargument, the frontal N2 and the occipital P2 are significantlylarger in the critical condition of the fake positive block, whichcan be assumed to induce more of a response conflict andmore inhibitory requirements than the fake negative block, whicheffectively only requires accentuation of the actual responsetendency. By contrast, faking negative and faking positive doesnot differ on the parietal P3 and LPP components. Further, theenhanced source activity for the faking blocks in the TPJ andright inferior frontal gyrus suggests that even when a strategy issupplied, faking is likely an active cognitive process. The right
inferior frontal gyrus activity may be responsible for suppressingan automatic response tendency.
So far, it is not clear whether the present results are specificto the BIAT or extend to other variants of the IAT, or in howfar they also apply to slowing in reaction time-based tasks ingeneral. ERP similarities between our results and those fromother studies using forced-choice formats could support thehypothesis that our results are not BIAT specific. However,in light of frameworks that distinguish between automatic(implicit) and deliberate (explicit) attitudes (i.e., dual-processmodels of social cognition; Strack and Deutsch, 2004; Gawronskiand Bodenhausen, 2006), our findings nevertheless suggest thatconflicts between deliberate and automatic processes occurduring faking, and that they may occur very early in theprocessing stream. Still, it is important to note that such earlyeffects, as described by Hu et al. (2011) and in the presentstudy, may be partly due to experimental design. The blockeddesigns used in these studies enable participants to anticipate andprepare deceptive responses across an entire block, which mayhave induced earlier ERP effects.
In sum, this is the first study to examine the neuralcorrelates of faking the BIAT. It revealed that deceptionalready modulates very early brain responses, and suggeststhe right inferior frontal gyrus to be a crucial brain regionfor suppressing automatic responses in the deception context.Further, source estimations suggest that the TPJ may be involvedin the monitoring of executed responses and also of suppressedresponses. Alternatively, these results show that IATs can befaked (in line with e.g., Kim, 2003), challenging the theoreticalclaim that IAT scores really reflect implicit associations. Theseare theorized to represent output from the impulsive system andshould be immune to faking (De Houwer et al., 2009). From apractical perspective, test-takers with high motivation to disguisetheir true attitude will most likely begin to develop and applydeception strategies. Faking on socially sensitive topics (such asdoping in sports) is therefore likely to occur for people whohave a high intrinsic motivation to deceive on this topic (suchas professional athletes). Knowledge of the cerebral processes thataccompany deceptive efforts might be utilized in order to preventor detect faking attempts in the future.
Acknowledgments
Funded by the DFG, Cluster of Excellence 277 “CognitiveInteraction Technology” and the German Federal Instituteof Sport Science (IIA1-070302/12-13). We acknowledgesupport for the Article Processing Charge by the DeutscheForschungsgemeinschaft and the Open Access Publication Fundof Bielefeld University. We thank all participants contributing tothis study.
Supplementary Material
The Supplementary Material for this article can be foundonline at: http://journal.frontiersin.org/article/10.3389/fnbeh.2015.00139/abstract
Frontiers in Behavioral Neuroscience | www.frontiersin.org 11 May 2015 | Volume 9 | Article 139
Schindler et al. Cerebral correlates of IAT faking
References
Agosta, S., Ghirardi, V., Zogmaister, C., Castiello, U., and Sartori, G. (2010).
Detecting fakers of the autobiographical IAT. Appl. Cogn. Psychol. 25, 299–306.
doi: 10.1002/acp.1691
Agosta, S., and Sartori, G. (2013). The autobiographical IAT: a review. Front.
Psychol. 4:519. doi: 10.3389/fpsyg.2013.00519
Bartholow, B. D., Riordan, M. A., Saults, J. S., and Lust, S. A. (2009).
Psychophysiological evidence of response conflict and strategic control of
responses in affective priming. J. Exp. Soc. Psychol. 45, 655–666. doi:
10.1016/j.jesp.2009.02.015
Bellgrove, M. A., Hester, R., and Garavan, H. (2004). The functional
neuroanatomical correlates of response variability: evidence from
a response inhibition task. Neuropsychologia 42, 1910–1916. doi:
10.1016/j.neuropsychologia.2004.05.007
Brand, R., Heck, P., and Ziegler, M. (2014a). Illegal performance enhancing
drugs and doping in sport: a picture-based brief implicit association test
for measuring athletes’ attitudes. Subst. Abuse Treat. Prev. Policy 9:7. doi:
10.1186/1747-597X-9-7
Brand, R., Wolff, W., and Thieme, D. (2014b). Using response-time latencies to
measure athletes’ doping attitudes: the brief implicit attitude test identifies
substance abuse in bodybuilders. Subst. Abuse Treat. Prev. Policy 9, 38. doi:
10.1186/1747-597X-9-36
Cacioppo, J. T., Crites, S. L., Berntson, G. G., and Coles, M. G. (1993). If attitudes
affect how stimuli are processed, should they not affect the event-related brain
potential? Psychol. Sci. 4, 108–112. doi: 10.1111/j.1467-9280.1993.tb00470.x
Campo, P., Poch, C., Toledano, R., Igoa, J. M., Belinchon, M., and Garcia-
Morales, I. (2013). Anterobasal temporal lobe lesions alter recurrent functional
connectivity within the ventral pathway during naming. J. Neurosci. 33,
12679–12688. doi: 10.1523/JNEUROSCI.0645-13.2013
Cecchini, M., Aceto, P., Altavilla, D., Palumbo, L., and Lai, C. (2013). The role of
the eyes in processing an intact face and its scrambled image: a dense array
ERP and low-resolution electromagnetic tomography (sLORETA) study. Soc.
Neurosci. 8, 314–325. doi: 10.1080/17470919.2013.797020
Cohen, J. (1988). Statistical Power Analysis for the Behavioral Sciences, 2nd edn.
Hillsdale, NJ: Lawrence Erlbaum Associates, Inc.
Crites, S. L. Jr., Mojica, A. J., Corral, G., and Taylor, J. H. (2010). An event-related
potential paradigm for identifying (rare negative) attitude stimuli that people
intentionally misreport. Psychophysiology 47, 984–988. doi: 10.1111/j.1469-
8986.2010.01002.x
Cvencek, D., Greenwald, A. G., Brown, A. S., Gray, N. S., and Snowden,
R. J. (2010). Faking of the Implicit Association Test is statistically
detectable and partly correctable. Basic Appl. Soc. Psych. 32, 302–314. doi:
10.1080/01973533.2010.519236
De Houwer, J., Beckers, T., and Moors, A. (2007). Novel attitudes can be faked on
the Implicit Association Test. J. Exp. Soc. Psychol. 43, 972–978. doi: 10.1016/j.
jesp.2006.10.007
De Houwer, J., Teige-Mocigemba, S., Spruyt, A., and Moors, A. (2009). Implicit
measures: a normative analysis and review. Psychol. Bull. 135, 347–368. doi:
10.1037/a0014211
den Ouden, H. E., Frith, U., Frith, C., and Blakemore, S. J. (2005). Thinking about
intentions. Neuroimage 28, 787–796. doi: 10.1016/j.neuroimage.2005.05.001
Dickter, C. L., and Bartholow, B. D. (2007). Racial ingroup and outgroup attention
biases revealed by event-related brain potentials. Soc. Cogn. Affect. Neurosci. 2,
189–198. doi: 10.1093/scan/nsm012
Fiedler, K., and Bluemke, M. (2005). Faking the IAT: aided and unaided response
control on the Implicit Association Tests. Basic Appl. Soc. Psychol. 27, 307–316.
doi: 10.1207/s15324834basp2704_3
Folstein, J., and Van Petten, C. (2008). Influence of cognitive control andmismatch
on the N2 component of the ERP: a review. Psychophysiology 45, 152. doi:
10.1111/j.1469-8986.2007.00602.x
Forbes, C. E., Cameron, K. A., Grafman, J., Barbey, A., Solomon, J., and Ritter,
W. (2012). Identifying temporal and causal contributions of neural processes
underlying the Implicit Association Test (IAT). Front. Hum. Neurosci. 6:320.
doi: 10.3389/fnhum.2012.00320
Friston, K., Harrison, L., Daunizeau, J., Kiebel, S., Phillips, C., and Trujillo-Barreto,
N. (2008). Multiple sparse priors for the M/EEG inverse problem. Neuroimage
39, 1104–1120. doi: 10.1016/j.neuroimage.2007.09.048
Ganis, G., Rosenfeld, J. P., Meixner, J., Kievit, R. A., and Schendan, H. E. (2011).
Lying in the scanner: covert countermeasures disrupt deception detection
by functional magnetic resonance imaging. Neuroimage 55, 312–319. doi:
10.1016/j.neuroimage.2010.11.025
Garavan, H., Ross, T. J., and Stein, E. A. (1999). Right hemispheric dominance of
inhibitory control: an event-related functional MRI study. Proc. Natl. Acad. Sci.
U.S.A. 96, 8301–8306. doi: 10.1073/pnas.96.14.8301
Gawronski, B., and Bodenhausen, G. V. (2006). Associative and propositional
processes in evaluation: an integrative review of implicit and explicit attitude
change. Psychol. Bull. 132, 692–731. doi: 10.1037/0033-2909.132.5.692
Greenwald, A. G., McGhee, D. E., and Schwartz, J. L. K. (1998). Measuring
individual differences in implicit cognition: the implicit association test. J. Pers.
Soc. Psychol. 74, 1464–1480. doi: 10.1037/0022-3514.74.6.1464
Greenwald, A. G., Nosek, B. A., and Banaji, M. R. (2003). Understanding and using
the implicit association test: I. An improved scoring algorithm. J. Pers. Soc.
Psychol. 85, 197–216. doi: 10.1037/0022-3514.85.2.197
Greenwald, A. G., Poehlman, T. A., Uhlmann, E. L., and Banaji, M. R. (2009).
Understanding and using the Implicit Association Test: III. Meta-analysis of
predictive validity. J. Pers. Soc. Psychol. 97, 17–41. doi: 10.1037/a0015575
Gucciardi, D. F., Jalleh, G., and Donovan, R. J. (2010). Does social
desirability influence the relationship between doping attitudes and
doping susceptibility in athletes? Psychol. Sport Exerc. 11, 479–486. doi:
10.1016/j.psychsport.2010.06.002
Hanslmayr, S., Leipold, P., Pastötter, B., and Bäuml, K.-H. (2009). Anticipatory
signatures of voluntary memory suppression. J. Neurosci. 29, 2742–2747. doi:
10.1523/JNEUROSCI.4703-08.2009
Hautzinger, M., Keller, F., and Kühner, C. (2009). BDI-II. Beck-Depressions-
Inventar. Revision. 2. Auflage. Frankfurt: Pearson Assessment.
Hillyard, S. A., Teder-Sálejárvi, W. A., and Münte, T. F. (1998). Temporal
dynamics of early perceptual processing.Curr. Opin. Neurobiol. 8, 202–210. doi:
10.1016/S0959-4388(98)80141-4
Hopf, J. M., Vogel, E., Woodman, G., Heinze, H. J., and Luck, S. J. (2002).
Localizing visual discrimination processes in time and space. J. Neurophysiol.
88, 2088–2095. doi: 10.1152/jn.00860.2001
Hu, X., and Rosenfeld, J. P. (2012). Combining the p300-complex trial-based
Concealed Information Test and the reaction time-based autobiographical
Implicit Association Test in concealed memory detection. Psychophysiology 49,
1090–1100. doi: 10.1111/j.1469-8986.2012.01389.x
Hu, X., Rosenfeld, J. P., and Bodenhausen, G. V. (2012). Combating
automatic autobiographical associations: the effect of instruction and training
in strategically concealing information in the autobiographical Implicit
Association Test. Psychol. Sci. 23, 1079–1085. doi: 10.1177/0956797612443834
Hu, X., Wu, H., and Fu, G. (2011). Temporal course of executive control when
lying about self- and other-referential information: an ERP study. Brain Res.
1369, 149–157. doi: 10.1016/j.brainres.2010.10.106
Ibáñez, A., Gleichgerrcht, E., Hurtado, E., González, R., Haye, A., and Manes,
F. F. (2010). Early neural markers of implicit attitudes: N170 modulated by
intergroup and evaluative contexts in IAT. Front. Hum. Neurosci. 4:188. doi:
10.3389/fnhum.2010.00188.
Ito, T. A., and Urland, G. R. (2003). Race and gender on the brain: electrocortical
measures of attention to the race and gender of multiply categorizable
individuals. J. Pers. Soc. Psychol. 85, 616–626. doi: 10.1037/0022-3514.85.4.616
Ito, T. A., and Urland, G. R. (2005). The influence of processing objectives on the
perception of faces: an ERP study of race and gender perception. Cogn. Affect.
Behav. Neurosci. 5, 21–36. doi: 10.3758/CABN.5.1.21
Johnson, R. J. (1986). A triarchic model of P300 amplitude. Psychophysiology 23,
367–384. doi: 10.1111/j.1469-8986.1986.tb00649.x
Johnson, R. J., Barnhardt, J., and Zhu, J. (2003). The deceptive response: effects
of response conflict and strategic monitoring on the late positive component
and episodic memory-related brain activity. Biol. Psychol. 64, 217–253. doi:
10.1016/j.biopsycho.2003.07.006
Johnson, R. J., Barnhardt, J., and Zhu, J. (2004). The contribution of executive
processes to deceptive responding. Neuropsychologia 42, 878–901. doi:
10.1016/j.neuropsychologia.2003.12.005
Johnson, R. J., Barnhardt, J., and Zhu, J. (2005). Differential effects of practice on
the executive processes used for truthful and deceptive responses: an event-
related brain potential study. Brain Res. Cogn. Brain Res. 24, 386–404. doi:
10.1016/j.cogbrainres.2005.02.011
Frontiers in Behavioral Neuroscience | www.frontiersin.org 12 May 2015 | Volume 9 | Article 139

Schindler et al. Cerebral correlates of IAT faking
Johnson, R. J., Henkell, H., Simon, E., and Zhu, J. (2008). The self in conflict:
the role of executive processes during truthful and deceptive responses
about attitudes. Neuroimage 39, 469–482. doi: 10.1016/j.neuroimage.2007.
08.032
Johnson, R. J., Simon, E. J., Henkell, H., and Zhu, J. (2011). The role of
episodic memory in controlled evaluative judgments about attitudes:
an event-related potential study. Neuropsychologia 49, 945–960. doi:
10.1016/j.neuropsychologia.2011.01.028
Kaempfe, N., Penzhorn, J., Schikora, J., Duenzl, J., and Schneidenbach, J.
(2009). Empathy and social desirability: a comparison of delinquent and non-
delinquent participants using direct and indirect measures. Psychol. Crime Law
15, 1–17. doi: 10.1080/10683160802010640
Kim, D. Y. (2003). Voluntary controllability of the implicit association test (IAT).
Soc. Psychol. Q. 66, 83–96. doi: 10.2307/3090143
Kraus, S. J. (1995). Attitudes and the prediction of behavior: a meta-
analysis of the empirical literature. Pers. Soc. Psychol. Bull. 21, 58–75. doi:
10.1177/0146167295211007
Krosnick, J. A., Judd, C. M., and Wittenbrink, B. (2005). “The measurement of
attitudes,” in The Handbook of Attitudes, eds D. Albarracín, B. T. Johnson, and
M. P. Zanna (Mahwah, NJ: Lawrence Erlbaum Associates Publishers), 21–76.
Kuipers, J. R., and Thierry, G. (2013). ERP-pupil size correlations reveal
how bilingualism enhances cognitive flexibility. Cortex 49, 2853–2860. doi:
10.1016/j.cortex.2013.01.012
Küper, K., Groh-Bordin, C., Zimmer, H. D., and Ecker, U. K. (2012).
Electrophysiological correlates of exemplar-specific processes in implicit and
explicit memory. Cogn. Affect. Behav. Neurosci. 12, 52–64. doi: 10.3758/s13415-
011-0065-7
Lavric, A., Pizzagalli, D. A., and Forstmeier, S. (2004). When ‘go’ and ‘nogo’ are
equally frequent: ERP components and cortical tomography. Eur. J. Neurosci.
20, 2483–2488. doi: 10.1111/j.1460-9568.2004.03683.x
Litvak, V., and Friston, K. (2008). Electromagnetic source reconstruction for group
studies. Neuroimage 42, 1490–1498. doi: 10.1016/j.neuroimage.2008.06.022
Litvak, V., Mattout, J., Kiebel, S., Phillips, C., Henson, R., and Kilner, J. (2011).
EEG and MEG data analysis in SPM8. Comput. Intell. Neurosci. 2011:852961.
doi: 10.1155/2011/852961
Lopez, J. D., Litvak, V., Espinosa, J. J., Friston, K., and Barnes, G. R. (2013).
Algorithmic procedures for BayesianMEG/EEG source reconstruction in SPM.
Neuroimage 2013, 476–487. doi: 10.1016/j.neuroimage.2013.09.002
Mallia, L., Lucidi, F., Zelli, A., and Violani, C. (2013). Doping attitudes
and the use of legal and illegal performance-enhancing substances among
Italian adolescents. J. Child Adolesc. Subst. Abuse 22, 179–190. doi:
10.1080/1067828X.2012.733579
McDaniel, M. J., Beier, M. E., Perkins, A.W., Goggin, S., and Frankel, B. (2009). An
assessment of the fakeability of self-report and implicit personality measures.
J. Res. Pers. 43, 682–685. doi: 10.1016/j.jrp.2009.01.011
Nee, D. E., Wager, T. D., and Jonides, J. (2007). Interference resolution: insights
from a meta-analysis of neuroimaging tasks. Cogn. Affect. Behav. Neurosci. 7,
1–17. doi: 10.3758/CABN.7.1.1
Ntoumanis, N., Ng, J. Y. Y., Barkoukis, V., and Backhouse, S. (2014).
Personal and psychosocial predictors of doping use in physical activity
settings: a meta-analysis. Sports Med. 44, 1603–1624. doi: 10.1007/s40279-014-
0240-4
Penny, W., and Henson, R. (2007). “Hierarchical models,” in Statistical Parametric
Mapping, eds K. Friston, J. Ashburner, S. Kiebel, T. Nichols, and W. Penny
(Amsterdam: Elsevier), 149–155. doi: 10.1016/b978-012372560-8/50011-5
Pessoa, L., Rossi, A., Japee, S., Desimone, R., and Ungerleider, L. G. (2009).
Attentional control during the transient updating of cue information. Brain Res.
1247, 149–158. doi: 10.1016/j.brainres.2008.10.010
Peyk, P., De Cesarei, A., and Junghöfer, M. (2011). Electro Magneto
Encephalograhy Software: overview and integration with other EEG/MEG
toolboxes. Comput. Intell. Neurosci. 2011:861705. doi: 10.1155/2011/861705
Roehner, J., Schroeder-Abe, M., and Schuetz, A. (2011). Exaggeration is harder
than understatement, but practice makes perfect! Faking success in the IAT. Exp.
Psychol. 58, 464–472. doi: 10.1027/1618-3169/a000114
Roehner, J., Schroeder-Abe, M., and Schuetz, A. (2013). What do fakers actually
do to fake the IAT? An investigation of faking strategies under different faking
conditions. J. Res. Pers. 47, 330–338. doi: 10.1016/j.jrp.2013.02.009
Saxe, R., Xiao, D. K., Kovacs, G., Perrett, D. I., and Kanwisher, N.
(2004). A region of right posterior superior temporal sulcus responds
to observed intentional actions. Neuropsychologia 42, 1435–1446. doi:
10.1016/j.neuropsychologia.2004.04.015
Schindler, S., Wegrzyn, M., Steppacher, I., and Kissler, J. M. (2014). It’s all in your
head - how anticipating evaluation affects the processing of emotional trait
adjectives. Front. Psychol. 5:1292. doi: 10.3389/fpsyg.2014.01292
Schindler, S., Wegrzyn, M., Steppacher, I., and Kissler, J. M. (2015).
Perceived communicative context and emotional content amplify visual
word processing in the fusiform gyrus. J. Neurosci. 35, 6010–6019. doi:
10.1523/JNEUROSCI.3346-14.2015
Spielberger, C. D., Sydeman, S. J., Owen, A. E., andMarsh, B. J. (1999). “Measuring
anxiety and anger with the State-Trait Anxiety Inventory (STAI) and the State-
Trait Anger Expression Inventory (STAXI),” in The Use of Psychological Testing
for Treatment Planning and Outcomes Assessment, 2nd Edn, ed M. E. Maruish
(Mahwah, NY: Lawrence Erlbaum Associates), 993–1021.
Sriram, N., and Greenwald, A. G. (2009). The Brief Implicit Association Test. Exp.
Psychol. 56, 283–294. doi: 10.1027/1618-3169.56.4.283
Strack, F., and Deutsch, R. (2004). Reflective and impulsive determinants
of social behavior. Pers. Soc. Psychol. Rev. 8, 220–247. doi:
10.1207/s15327957pspr0803_1
Sun, D., Lee, T. M. C., and Chan, C. C. H. (2015). Unfolding the spatial and
temporal neural processing of lying about face familiarity. Cereb. Cortex 25,
927–936. doi: 10.1093/cercor/bht284
Teige-Mocigemba, S., Klauer, K. C., and Sherman, J. W. (2010). “A practical guide
to implicit association tests and related tasks,” in Handbook of Implicit Social
Cognition: Measurement, Theory, and Applications, eds B. Gawronski and B. K.
Payne (New York, NY US: Guilford Press), 117–139.
Tzourio-Mazoyer, N., Landeau, B., Papathanassiou, D., Crivello, F., Etard, O., and
Delcroix, N. (2002). Automated anatomical labeling of activations in SPMusing
a macroscopic anatomical parcellation of the MNI MRI single-subject brain.
Neuroimage 15, 273–289. doi: 10.1006/nimg.2001.0978
Verschuere, B., Prati, V., and De Houwer, J. (2009). Cheating the lie detector:
faking in the autobiographical Implicit Association Test. Psychol. Sci. 20,
410–413. doi: 10.1111/j.1467-9280.2009.02308.x
Wascher, E., Verleger, R., Jaskowski, P., and Wauschkuhn, B. (1996). Preparation
for action: an ERP study about two tasks provoking variability in response
speed. Psychophysiology 33, 262–272. doi: 10.1111/j.1469-8986.1996.tb00423.x
Williams, J. K., and Themanson, J. R. (2011). Neural correlates of the Implicit
Association Test: evidence for semantic and emotional processing. Soc. Cogn.
Affect. Neurosci. 6, 468–476. doi: 10.1093/scan/nsq065
Wimber, M., Bauml, K. H., Bergstrom, Z., Markopoulos, G., Heinze, H.
J., and Richardson-Klavehn, A. (2008). Neural markers of inhibition
in human memory retrieval. J. Neurosci. 28, 13419–13427. doi:
10.1523/JNEUROSCI.1916-08.2008
Wolff, W., Schindler, S., and Brand, R. (2015). The effect of implicitly incentivizing
faking on explicit and implicit measures of doping attitude: when athletes want
to pretend an even more negative attitude to doping. PLoS ONE 10:e0118507.
doi: 10.1371/journal.pone.0118507
Wood, J. N., Romero, S. G., Knutson, K. M., and Grafman, J. (2005).
Representation of attitudinal knowledge: role of prefrontal cortex,
amygdala and parahippocampal gyrus. Neuropsychologia 43, 249–259.
doi: 10.1016/j.neuropsychologia.2004.11.011
Ye, Z., and Zhou, X. (2009). Conflict control during sentence
comprehension: fMRI evidence. Neuroimage 48, 280–290. doi:
10.1016/j.neuroimage.2009.06.032
Conflict of Interest Statement: The authors declare that the research was
conducted in the absence of any commercial or financial relationships that could
be construed as a potential conflict of interest.
Copyright © 2015 Schindler, Wolff, Kissler and Brand. This is an open-access article
distributed under the terms of the Creative Commons Attribution License (CC BY).
The use, distribution or reproduction in other forums is permitted, provided the
original author(s) or licensor are credited and that the original publication in this
journal is cited, in accordance with accepted academic practice. No use, distribution
or reproduction is permitted which does not comply with these terms.
Frontiers in Behavioral Neuroscience | www.frontiersin.org 13 May 2015 | Volume 9 | Article 139